Notebookcheck Logo

Apple M1 Pro vs AMD Ryzen 9 7950X3D vs AMD Ryzen 7 7800X3D

Apple M1 Pro

► remove from comparison Apple M1 Pro

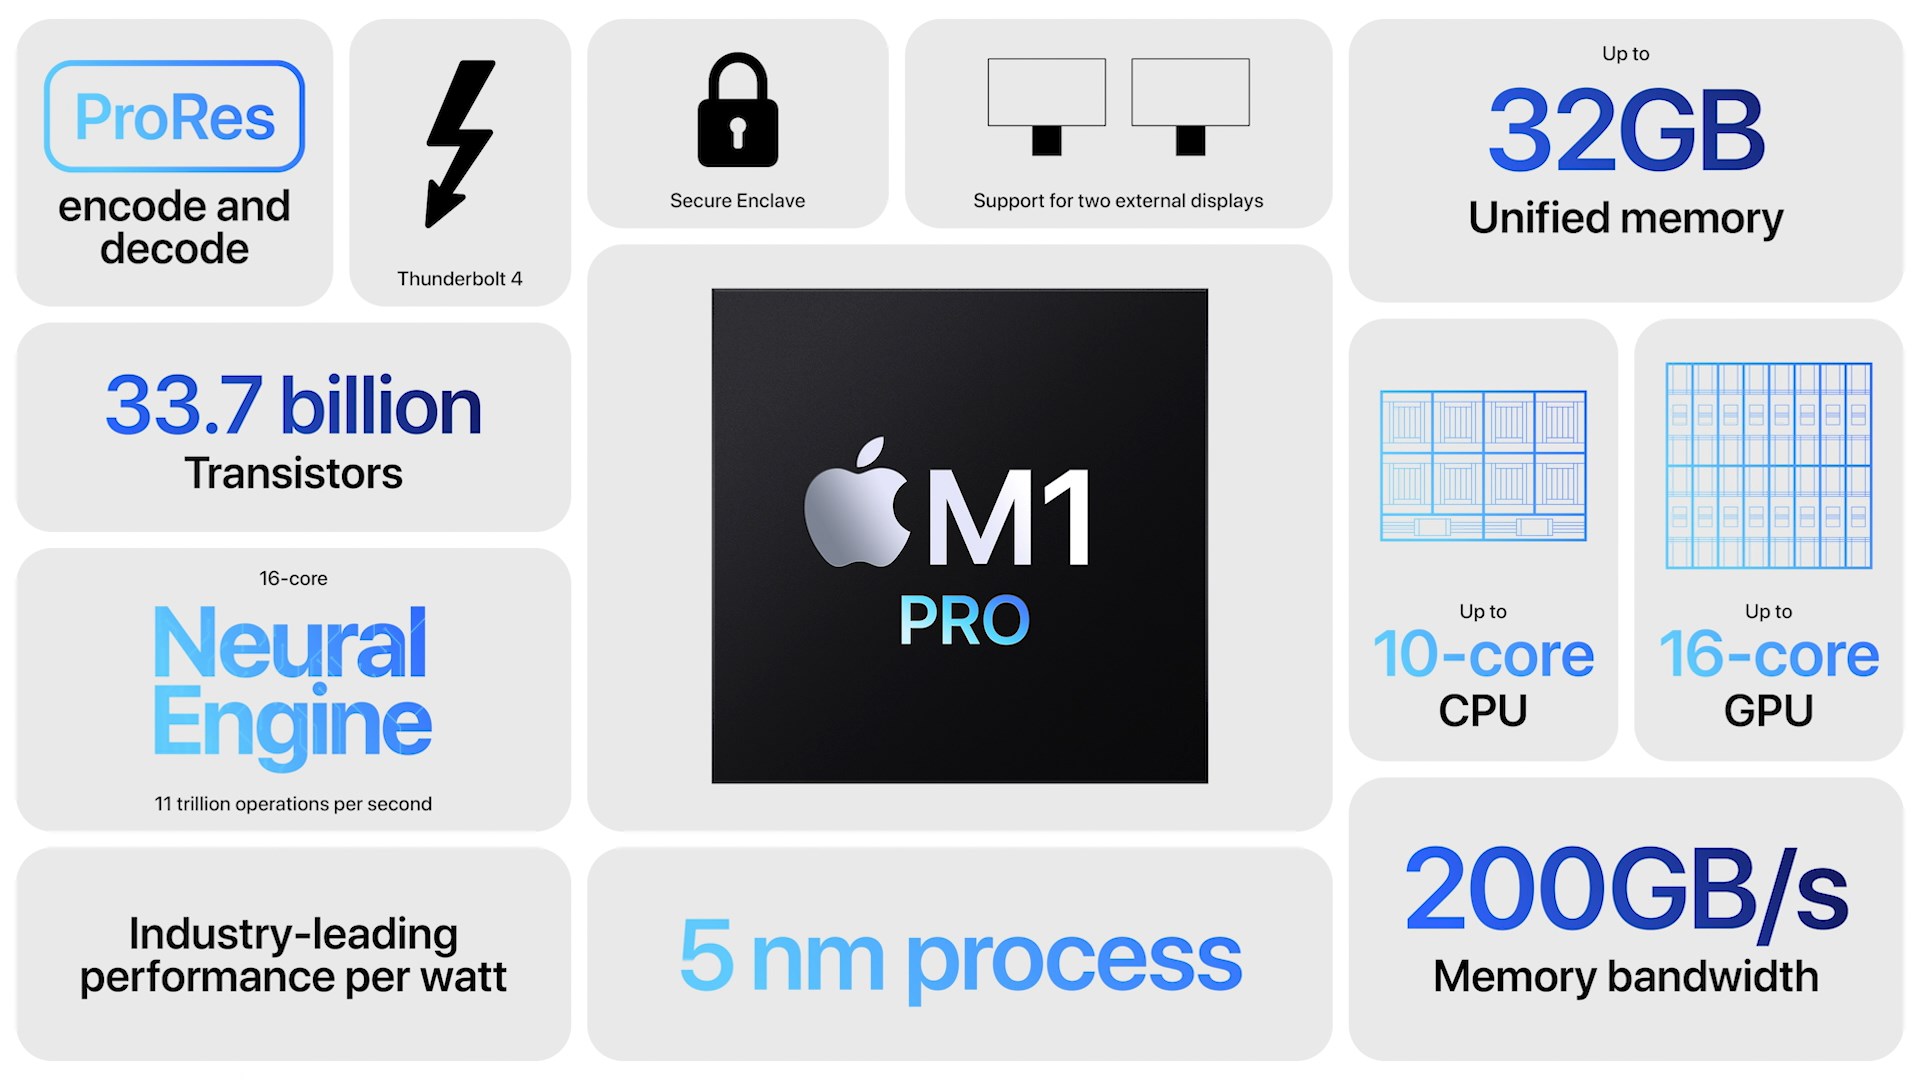
The Apple M1 Pro is a System on a Chip (SoC) from Apple that is found in the late 2021 MacBook Pro 14 and 16-inch models. It offers  all 10 cores available in the chip divided in eight performance cores (P-cores with 600 - 3220 MHz) and two power-efficiency cores (E-cores with 600 - 2064 MHz). There is no Turbo Boost for single cores or short burst periods. The cores are similar to the cores in the Apple M1. The entry level model offers only 8 cores.

The big cores (codename Firestorm) offer 192 KB instruction cache, 128 KB data cache, and 24 MB shared L2 cache (up from 12 MB in the M1). The four efficiency cores (codename Icestorm) are a lot smaller and offer only 128 KB instruction cache, 64 KB data cache, and 4 MB shared cache. CPU and GPU can both use the 24 MB SLC (System Level Cache). The efficiency cores (E cluster) clock with 600 - 2064 MHz, the performance cores (P cluster) with 600 - 3228 MHz.

The unified memory (16 or 32 GB LPDDR5-6400) next to the chip is connected by a 256 bit memory controller (200 GB/s bandwidth) and can be used by the GPU and CPU.

The integrated graphics card in the M1 Pro offers all 16 cores.

Furthermore, the SoC integrates a fast 16 core neural engine, a secure enclave (e.g., for encryption), a unified memory architecture, Thunderbolt 4 controller, an ISP, and media de- and encoders (including ProRes).

The M1 Pro is manufactured in 5 nm at TSMC and integrates 33.7 billion transistors. The peak power consumption of the chip was advertised around 30W for CPU intensive tasks. In the Prime95 benchmark the chip uses in our tests (with a MBP16) 33.6W package power and 31W for the CPU part. In idle the SoC only reports 1W package power.

AMD Ryzen 9 7950X3D

► remove from comparison AMD R9 7950X3D

The AMD Ryzen 9 7950X3D is a high-end desktop processor of the Raphael series with 16 cores and SMT (Simultaneous Multithreading), which means it can process up to 32 threads simultaneously. With the release in February 2023, the Ryzen 9 7950X3D is AMD's fastest consumer processor and the new top model of the 7000 series. The CPU cores clock from 4.2 GHz (base clock) up to 5.7 GHz (single core Turbo). In addition, the AMD Ryzen 9 7950X3D has a CCD with 8 cores that can access the fast 3D V-cache, which offers considerably more gaming performance.

The performance of the AMD Ryzen 9 7950X3D is consistently excellent in all applications tested. In addition, AMD was again able to increase the single-thread performance compared to the non-X3D models. Nevertheless, the lower base clock compared to the AMD Ryzen 9 7950X means that a small drop in multi-thread performance has to be accepted.

The internal structure of the processor is comparable to the previous AMD Ryzen 9 7950X. The AMD Ryzen 9 7950X3D is also still based on the chiplet design consisting of two CCD clusters with 8 cores each. However, the two CCDs differ significantly from each other because one offers the fast 3D V-Cache, which primarily improves gaming performance. In testing, the AMD Ryzen 9 7950X3D was able to put the Intel Core i9-13900K in second place and is the fastest gaming CPU on the market at the time of testing. 

The AMD Ryzen 9 7950X3D is an extremely energy-efficient CPU with up to 162 watts (PPT) and is significantly more frugal under load than an AMD Ryzen 9 7950X (max. 230 watts).

AMD Ryzen 7 7800X3D

► remove from comparison AMD R7 7800X3D

The AMD Ryzen 7 7800X3D is a high-end desktop processor from the Raphael series with 8 Zen 4 cores and SMT (Simultaneous Multithreading), allowing it to handle up to 16 threads simultaneously. After its announcement in January 2023 at CES in Las Vegas, it was launched in April 2023. Following the launch of the two top models, the AMD Ryzen 9 7900X3D and the AMD Ryzen 9 7950X3D, the third model was introduced, which offers significantly more gaming performance with the 3D V-Cache.

The CPU cores have a base clock of 4.2 GHz and can be boosted up to 5 GHz (single-core turbo). The AMD Ryzen 7 7800X3D features a CCD with 8 cores, which includes the fast 3D V-Cache. This differs significantly from the two Ryzen 9 models, as they have two CCDs, but only one of them can utilize the 3D V-Cache.

The performance of the AMD Ryzen 7 7800X3D is consistently good, although its multi-threaded performance suffers a bit due to the eight native compute cores. However, the real strength of the AMD Ryzen 7 7800X3D lies in gaming performance, where it excels. In tests, we see consistently high gaming performance, even surpassing that of an Intel Core i9-13900K.

In terms of power consumption, the AMD Ryzen 7 7800X3D aligns with the other two models featuring 3D V-Cache, making the 8-core processor extremely power-efficient. In numbers, this means that the AMD Ryzen 7 7800X3D is specified with a TDP of up to 120 watts. The PPT (Package Power Tracking) is also rated up to 162 watts. For comparison, an AMD Ryzen 9 7950X is specified with 170 watts (TDP) or 230 watts (PPT).

ModelApple M1 ProAMD Ryzen 9 7950X3DAMD Ryzen 7 7800X3D
SeriesApple Apple M-SeriesAMD Raphael (Zen 4, Ryzen 7000)AMD Raphael (Zen 4, Ryzen 7000)
Series: Raphael (Zen 4, Ryzen 7000) Raphael (Zen4)
Apple M1 Max2.06 - 3.22 GHz10 / 10 cores48 MB L3
Apple M1 Pro « 2.06 - 3.22 GHz10 / 10 cores24 MB L3
Apple M1 Pro 8-Core2.06 - 3.22 GHz8 / 8 cores16 MB L3
Apple M12.06 - 3.22 GHz8 / 8 cores8 MB L3
AMD Ryzen 9 7950X3D « 4.2 - 5.7 GHz16 / 32 cores128 MB L3
AMD Ryzen 9 7900X4.7 - 5.6 GHz12 / 24 cores64 MB L3
AMD Ryzen 9 79003.7 - 5.4 GHz12 / 24 cores64 MB L3
AMD Ryzen 7 7700X4.5 - 5.4 GHz8 / 16 cores32 MB L3
AMD Ryzen 7 77003.8 - 5.3 GHz8 / 16 cores32 MB L3
AMD Ryzen 7 7800X3D4.2 - 5 GHz8 / 16 cores96 MB L3
AMD Ryzen 5 7600X4.7 - 5.3 GHz6 / 12 cores32 MB L3
AMD Ryzen 5 76003.8 - 5.1 GHz6 / 12 cores32 MB L3
AMD Ryzen 9 7950X3D4.2 - 5.7 GHz16 / 32 cores128 MB L3
AMD Ryzen 9 7900X4.7 - 5.6 GHz12 / 24 cores64 MB L3
AMD Ryzen 9 79003.7 - 5.4 GHz12 / 24 cores64 MB L3
AMD Ryzen 7 7700X4.5 - 5.4 GHz8 / 16 cores32 MB L3
AMD Ryzen 7 77003.8 - 5.3 GHz8 / 16 cores32 MB L3
AMD Ryzen 7 7800X3D « 4.2 - 5 GHz8 / 16 cores96 MB L3
AMD Ryzen 5 7600X4.7 - 5.3 GHz6 / 12 cores32 MB L3
AMD Ryzen 5 76003.8 - 5.1 GHz6 / 12 cores32 MB L3
Clock2064 - 3220 MHz4200 - 5700 MHz4200 - 5000 MHz
L1 Cache2.9 MB1 MB0.1 MB
L2 Cache28 MB16 MB0 MB
L3 Cache24 MB128 MB96 MB
Cores / Threads10 / 1016 / 32
16 x 5.7 GHz AMD Zen 4
8 / 16
Transistors33700 Million13140 Million6570 Million
Technology5 nm5 nm5 nm
FeaturesARMv8 Instruction SetMMX(+), SSE, SSE2, SSE3, SSSE3, SSE4.1, SSE4.2, SSE4A, x86-64, AMD-V, AES, AVX, AVX2, AVX512F, FMA3, SHA, XFR2, Precision Boost 2MMX, SSE, SSE2, SSE3, SSSE3, SSE4.1, SSE4.2, SSE4A, x86-64, AMD-V, AES, AVX, AVX2, AVX512, BMI1, BMI2, F16C, FMA3, AMD64, EVP, AMD-V, SMAP, SMEP, SMT SHA, XFR2, Precision Boost 2
iGPUApple M1 Pro 16-Core GPUAMD Radeon Graphics (Ryzen 7000) (400 - 2200 MHz)AMD Radeon Graphics (Ryzen 7000) (400 - 2200 MHz)
ArchitectureARMx86x86
Announced
CodenameRaphael (Zen4)Raphael (Zen4)
TDP120 Watt162 Watt
Die Size263 mm21x 71 mm² (CCD) + 121 mm² (I/O) mm2
max. Temp.89 °C89 °C
SocketAM5 (LGA 1718)AM5 (LGA 1718)
$699 U.S.$449 U.S.
Manufacturerwww.amd.com

Benchmarks

Performance Rating - CB R15 + R20 + 7-Zip + X265 + Blender + 3DM11 CPU - R9 7950X3D
61.1 pt (85%)
Performance Rating - CB R15 + R20 + 7-Zip + X265 + Blender + 3DM11 CPU - R7 7800X3D
48.3 pt (67%)
Cinebench 2024 - Cinebench 2024 CPU Single Core
100%
1 M1 Pro +
112 Points (78%)
Cinebench 2024 - Cinebench 2024 CPU Multi Core
100%
1 M1 Pro +
824 Points (15%)
Cinebench R23 - Cinebench R23 Multi Core
12370 Points (11%)
36291 Points (34%)
min: 16688     avg: 17387     median: 17387 (16%)     max: 18086 Points
Cinebench R23 - Cinebench R23 Single Core
1534 Points (65%)
2053 Points (87%)
min: 1713     avg: 1767     median: 1766.5 (75%)     max: 1820 Points
Cinebench R20 - Cinebench R20 CPU (Single Core)
393 Points (44%)
795 Points (88%)
min: 663     avg: 686     median: 686 (76%)     max: 709 Points
Cinebench R20 - Cinebench R20 CPU (Multi Core)
2721 Points (7%)
14188 Points (35%)
min: 6488     avg: 6805     median: 6804.5 (17%)     max: 7121 Points
Cinebench R15 - Cinebench R15 CPU Multi 64 Bit
1690 Points (11%)
5974 Points (38%)
min: 2783     avg: 2879     median: 2878.5 (18%)     max: 2974 Points
Cinebench R15 - Cinebench R15 CPU Single 64 Bit
209 Points (63%)
326 Points (98%)
min: 272     avg: 281.5     median: 281.5 (85%)     max: 291 Points
Cinebench R11.5 - Cinebench R11.5 CPU Multi 64 Bit
64.6 Points (84%)
33.5 Points (44%)
Cinebench R11.5 - Cinebench R11.5 CPU Single 64 Bit
3.9 Points (96%)
3.4 Points (85%)
Cinebench R10 - Cinebench R10 Rend. Single (32bit)
16551 Points (100%)
8026 Points (48%)
Cinebench R10 - Cinebench R10 Rend. Multi (32bit)
138015 Points (100%)
51950 Points (38%)
Cinebench R10 - Cinebench R10 Rend. Multi (64bit)
72361 Points (50%)
94035 Points (65%)
Cinebench R10 - Cinebench R10 Rend. Single (64bit)
8853 Points (11%)
14485 Points (18%)
wPrime 2.10 - wPrime 2.0 1024m *
33.9 s (0%)
62.7 s (1%)
wPrime 2.10 - wPrime 2.0 32m *
2 s (0%)
2.4 s (0%)
WinRAR - WinRAR 4.0
15779 Points (25%)
16585 Points (26%)
7-Zip 18.03 - 7-Zip 18.03 Multli Thread 4 runs
159341 MIPS (91%)
min: 75558     avg: 80313     median: 80312.5 (46%)     max: 85067 MIPS
7-Zip 18.03 - 7-Zip 18.03 Single Thread 4 runs
8321 MIPS (99%)
min: 7412     avg: 7824     median: 7823.5 (94%)     max: 8235 MIPS
X264 HD Benchmark 4.0 - x264 Pass 2
265.5 fps (93%)
169.3 fps (59%)
X264 HD Benchmark 4.0 - x264 Pass 1
392.5 fps (91%)
344 fps (79%)
HWBOT x265 Benchmark v2.2 - HWBOT x265 4k Preset
42.4 fps (75%)
min: 22.1     avg: 23.3     median: 23.3 (41%)     max: 24.4 fps
TrueCrypt - TrueCrypt Serpent
2.8 GB/s (0%)
1.3 GB/s (0%)
TrueCrypt - TrueCrypt Twofish
4.2 GB/s (72%)
2.1 GB/s (36%)
TrueCrypt - TrueCrypt AES
26.9 GB/s (70%)
15.3 GB/s (40%)
Blender - Blender 3.3 Classroom CPU *
133 Seconds (2%)
min: 266     avg: 282.5     median: 282.5 (4%)     max: 299 Seconds
Blender - Blender 2.79 BMW27 CPU *
183.3 Seconds (1%)
86 Seconds (1%)
min: 169     avg: 178     median: 178 (1%)     max: 187 Seconds
R Benchmark 2.5 - R Benchmark 2.5 *
0.4 sec (8%)
min: 0.4152     avg: 0.4     median: 0.4 (9%)     max: 0.4479 sec
3DMark 06 - CPU - 3DMark 06 - CPU
20279 Points (43%)
16892 Points (36%)
Super Pi mod 1.5 XS 1M - Super Pi mod 1.5 XS 1M *
6.1 s (1%)
7.1 s (2%)
Super Pi mod 1.5 XS 2M - Super Pi mod 1.5 XS 2M *
13.2 s (1%)
15.3 s (1%)
Super Pi Mod 1.5 XS 32M - Super Pi mod 1.5 XS 32M *
305.1 s (1%)
337.6 s (1%)
3DMark Vantage - 3DM Vant. Perf. CPU no Physx
99321 Points (87%)
97391 Points (85%)
3DMark 11 - 3DM11 Performance Physics
36991 Points (100%)
min: 30767     avg: 32947     median: 32947 (89%)     max: 35127 Points
3DMark - 3DMark Ice Storm Physics
86389 Points (70%)
89617 Points (73%)
3DMark - 3DMark Ice Storm Extreme Physics
86306 Points (70%)
89287 Points (72%)
3DMark - 3DMark Ice Storm Unlimited Physics
87725 Points (74%)
91846 Points (77%)
3DMark - 3DMark Cloud Gate Physics
26168 Points (66%)
25510 Points (65%)
3DMark - 3DMark Fire Strike Standard Physics
44787 Points (80%)
min: 30333     avg: 31839     median: 31839 (57%)     max: 33345 Points
3DMark - 3DMark Time Spy CPU
17206 Points (73%)
min: 11975     avg: 13037     median: 13036.5 (55%)     max: 14098 Points
Geekbench 6.2 - Geekbench 6.2 Single-Core
100%
1 M1 Pro +
2409 Points (65%)
2634 Points (71%)
Geekbench 6.2 - Geekbench 6.2 Multi-Core
100%
1 M1 Pro +
12440 Points (49%)
14288 Points (56%)
Geekbench 5.5 - Geekbench 5.1 - 5.4 64 Bit Single-Core
1768 Points (75%)
2311 Points (98%)
min: 1856     avg: 1934     median: 1920 (81%)     max: 2027 Points
Geekbench 5.5 - Geekbench 5.1 - 5.4 64 Bit Multi-Core
12499 Points (22%)
24343 Points (44%)
min: 12073     avg: 13013     median: 12715 (23%)     max: 14252 Points
Geekbench 5.0 - Geekbench 5.0 64 Bit Single-Core
2183 Points (9%)
1938 Points (8%)
Geekbench 5.0 - Geekbench 5.0 64 Bit Multi-Core
23720 Points (75%)
13888 Points (44%)
Geekbench 4.4 - Geekbench 4.1 - 4.4 64 Bit Single-Core
9240 Points (92%)
9097 Points (91%)
Geekbench 4.4 - Geekbench 4.1 - 4.4 64 Bit Multi-Core
87922 Points (96%)
54840 Points (60%)
Mozilla Kraken 1.1 - Kraken 1.1 Total Score *
405.4 ms (0%)
437 ms (1%)
min: 487     avg: 504     median: 503.5 (1%)     max: 520 ms
Sunspider - Sunspider 1.0 Total Score *
100%
1 M1 Pro +
75.6 ms (1%)
Octane V2 - Octane V2 Total Score
100%
1 M1 Pro +
66203 Points (58%)
WebXPRT 4 - WebXPRT 4 Score
313 Points (90%)
282 Points (81%)
WebXPRT 3 - WebXPRT 3 Score
342 Points (71%)
383 Points (80%)
353 Points (74%)
CrossMark - CrossMark Overall
1556 Points (60%)
2193 Points (84%)
2216 Points (85%)
Power Consumption - Prime95 Power Consumption - external Monitor *
100%
1 M1 Pro +
41.5 Watt (7%)
276 Watt (48%)
218 Watt (38%)
Power Consumption - Cinebench R15 Multi Power Consumption - external Monitor *
100%
1 M1 Pro +
48.3 Watt (9%)
273 Watt (50%)
207 Watt (38%)
Power Consumption - Geekbench 5.5 Power Consumption 150cd *
100%
1 M1 Pro +
19.9 Watt (9%)
Power Consumption - Idle Power Consumption - external Monitor *
100%
1 M1 Pro +
6.4 Watt (4%)
118.4 Watt (78%)
121.6 Watt (80%)
Power Consumption - Idle Power Consumption 150cd 1min *
100%
1 M1 Pro +
9.9 Watt (11%)
Power Consumption - Cinebench R15 Multi Power Efficiency - external Monitor
100%
1 M1 Pro +
35 Points per Watt (26%)
21.9 Points per Watt (16%)
14.4 Points per Watt (11%)

Average Benchmarks Apple M1 Pro → 100% n=12

Average Benchmarks AMD Ryzen 9 7950X3D → 203% n=12

Average Benchmarks AMD Ryzen 7 7800X3D → 137% n=12

- Range of benchmark values for this graphics card
- Average benchmark values for this graphics card
* Smaller numbers mean a higher performance
1 This benchmark is not used for the average calculation

v1.28
log 02. 18:54:48

#0 checking url part for id 13845 +0s ... 0s

#1 checking url part for id 15000 +0s ... 0s

#2 checking url part for id 15064 +0s ... 0s

#3 redirected to Ajax server, took 1719939287 +0s ... 0s

#4 did not recreate cache, as it is less than 5 days old! Created at Mon, 01 Jul 2024 05:15:43 +0200 +0s ... 0s

#5 composed specs +0.007s ... 0.007s

#6 did output specs +0s ... 0.007s

#7 getting avg benchmarks for device 13845 +0.001s ... 0.008s

#8 got single benchmarks 13845 +0.004s ... 0.011s

#9 getting avg benchmarks for device 15000 +0.004s ... 0.015s

#10 got single benchmarks 15000 +0.004s ... 0.02s

#11 getting avg benchmarks for device 15064 +0.004s ... 0.024s

#12 got single benchmarks 15064 +0.006s ... 0.03s

#13 got avg benchmarks for devices +0s ... 0.03s

#14 min, max, avg, median took s +0.066s ... 0.096s

#15 return log +0s ... 0.096s

Please share our article, every link counts!
> Expert Reviews and News on Laptops, Smartphones and Tech Innovations > Benchmarks / Tech > Processor Comparison - Head 2 Head
Redaktion, 2017-09- 8 (Update: 2023-07- 1)