Notebookcheck Logo

Apple M1 Pro 8-Core vs Intel Core i9-13905H

Apple M1 Pro 8-Core

► remove from comparison Apple M1 Pro 8-Core

The Apple M1 Pro 8-Core is a System on a Chip (SoC) from Apple that is found in the late 2021 MacBook Pro 14 and 16-inch models. It offers 8 cores from the 10 available in the chip divided in six performance cores (P-cores with 600 - 3220 MHz) and four power-efficiency cores (E-cores with 600 - 2064 MHz). The cores are similar to the cores in the Apple M1.

The big cores (codename Firestorm) offer 192 KB instruction cache, 128 KB data cache, and 24 MB shared L2 cache (up from 12 MB in the M1). The four efficiency cores (codename Icestorm) are a lot smaller and offer only 128 KB instruction cache, 64 KB data cache, and 4 MB shared cache. Finally, the SoC includes 16 MB System Level Cache shared by the GPU. The efficiency cores (E cluster) clock with 600 - 2064 MHz, the performance cores (P cluster) with 600 - 3228 MHz.

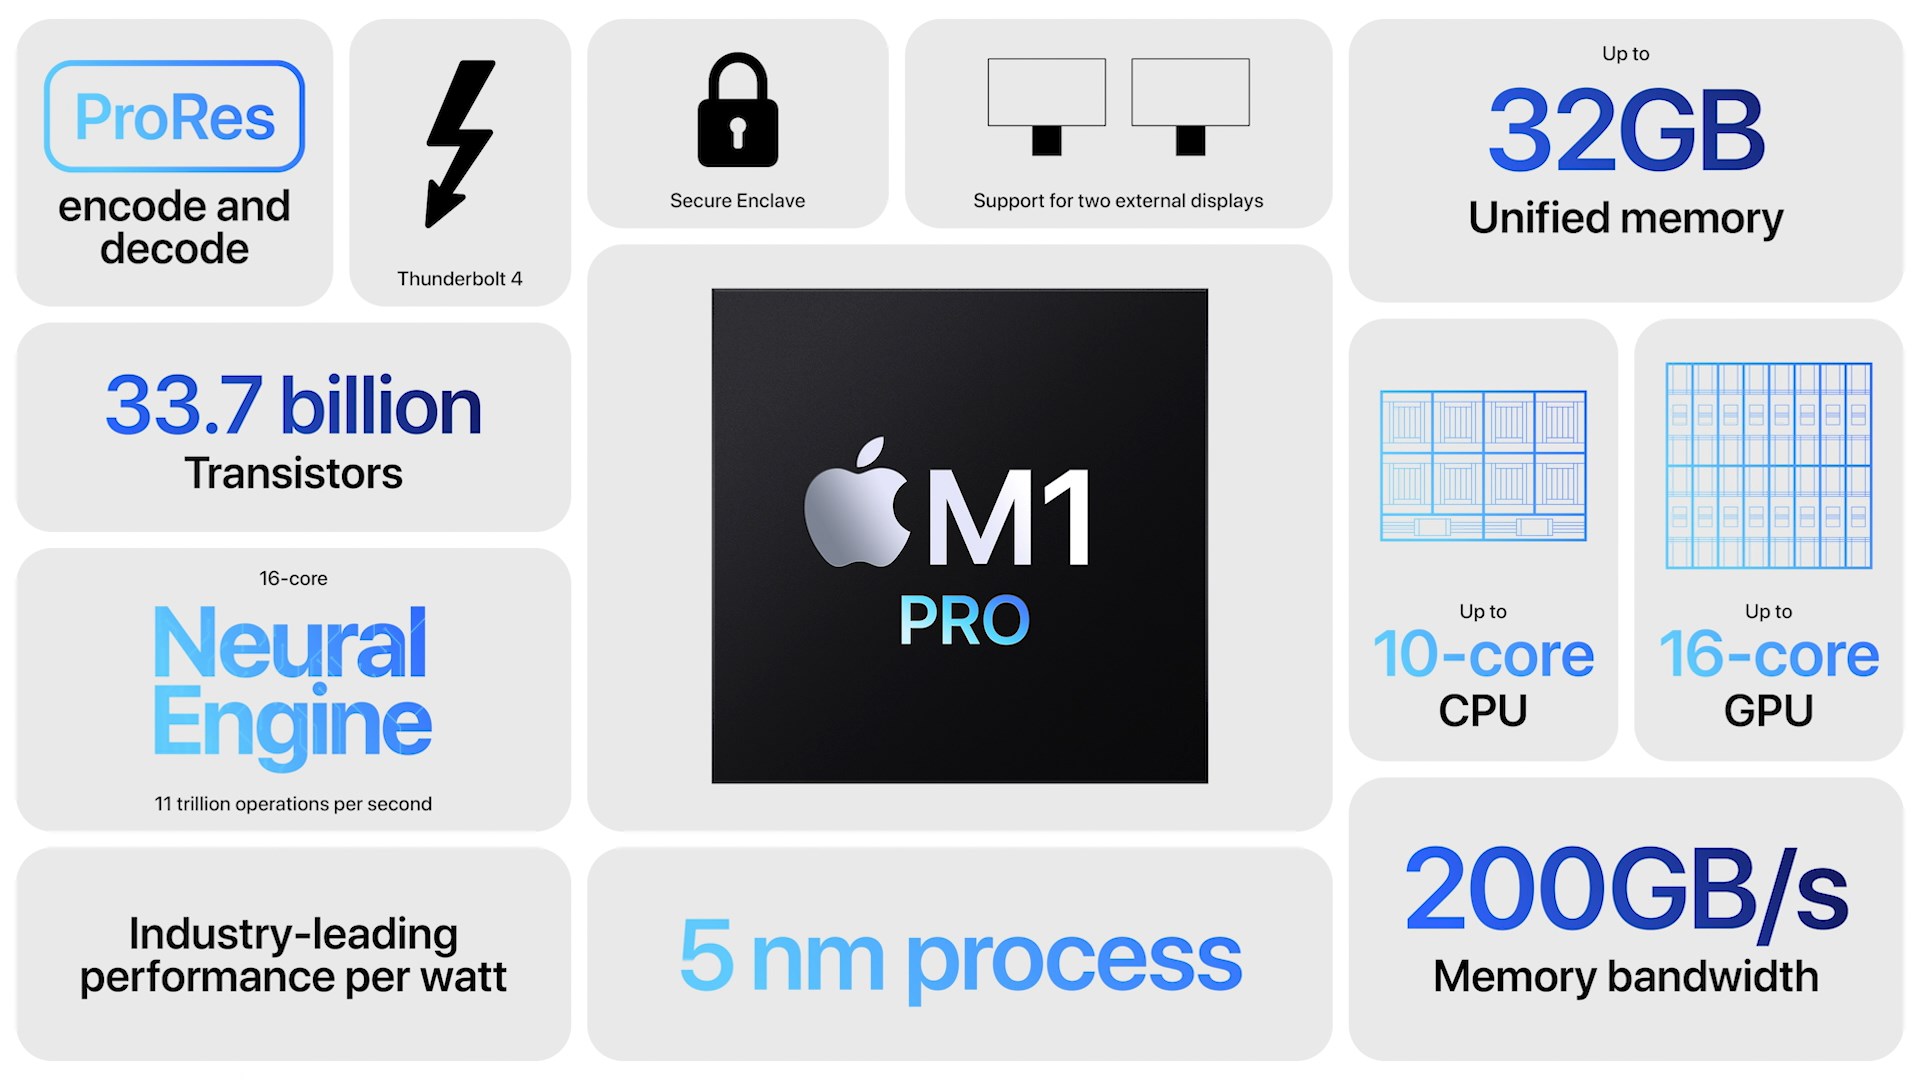
The unified memory (16 or 32 GB LPDDR5-6400) next to the chip is connected by a 256 bit memory controller and can be used by the GPU and CPU.

The integrated graphics card in the M1 Pro offers 14 cores (of the 16 cores in the chip).

Furthermore, the SoC integrates a fast 16 core neural engine, a secure enclave (e.g., for encryption), a unified memory architecture, Thunderbolt 4 controller, an ISP, and media de- and encoders (including ProRes).

The M1 Pro is manufactured in 5 nm at TSMC and integrates 33.7 billion transistors. The peak power consumption of the chip was advertised around 30W for CPU intensive tasks.

Intel Core i9-13905H

► remove from comparison Intel i9-13905H

The Intel Core i9-13905H is a high-end mobile CPU for laptops based on the Raptor Lake-H series (Alder Lake architecture). It was announced in early 2023 and offers 6 performance cores (P-cores, Golden Cove architecture) and 8 efficient cores (E-cores, Gracemont architecture). The P-cores support Hyper-Threading leading to 20 supported threads when combined with the E-cores. The clock rate ranges from 2.6 to 5.4 GHz (single core turbo, all-core 4.9 GHz) on the performance cluster and 1.9 to 4.1 GHz on the efficiency cluster. The performance of the E-cores should be similar to old Skylake cores (compare with the Core i7-6920HQ). All cores can use up to 24 MB L3 cache. Similar to the i9-13900H but without vPro support and the 13905H uses a different package and socket.

Performance

Thanks to the high core count and high clock speed, the Core i9-13905H is (together with the 13900HK) the fastest 45W CPU for laptops and only bested by Raptor Lake-HX based models with more cores and improved P-cores (e.g., the i9-13980HX). Still, the CPU is very well suited for all demanding use cases like gaming, content creation, and scientific calculations.

Features

The integrated memory controller supports various memory types up to DDR5-5200 (up from 4800 MHz for the 12th gen). The Thread Director (in hardware) can support the operating system to decide which thread to use on the performance or efficient cores for the best performance. For AI tasks, the CPU also integrates GNA 3.0 and DL Boost (via AVX2). Quick Sync in version 8 is the same as in the Rocket Lake CPUs and supports MPEG-2, AVC, VC-1 decode, JPEG, VP8 decode, VP9, HEVC, and AV1 decode in hardware. The CPU now supports PCIe 5.0 x8 for a GPU and two PCIe 4.0 x4 for SSDs.

The integrated graphics card is based on the Xe-architecture and offers 96 EUs (Execution Units) .

The CPU is rated at 45 W base power (115 W PL2) but most laptops will use a PL1 of around 60 Watt. The SoC is manufactured in a 10nm process at Intel, which is known as Intel 7 (improved over the 12th Gen).

ModelApple M1 Pro 8-CoreIntel Core i9-13905H
SeriesApple Apple M-SeriesIntel Raptor Lake-H
Series: Raptor Lake-H Raptor Lake-H
Apple M1 Max compare2.06 - 3.22 GHz10 / 10 cores48 MB L3
Apple M1 Pro compare2.06 - 3.22 GHz10 / 10 cores24 MB L3
Apple M1 Pro 8-Core « 2.06 - 3.22 GHz8 / 8 cores16 MB L3
Apple M1 compare2.06 - 3.22 GHz8 / 8 cores8 MB L3
Intel Core i9-13900HK compare1.9 - 5.4 GHz14 / 20 cores24 MB L3
Intel Core i9-13905H « 1.9 - 5.4 GHz14 / 20 cores24 MB L3
Intel Core i9-13900H compare1.9 - 5.4 GHz14 / 20 cores24 MB L3
Intel Core i7-13800H compare1.8 - 5.2 GHz14 / 20 cores24 MB L3
Intel Core i7-13705H compare1.8 - 5 GHz14 / 20 cores24 MB L3
Intel Core i7-13700H compare1.8 - 5 GHz14 / 20 cores24 MB L3
Intel Core i7-13620H compare1.8 - 4.9 GHz10 / 16 cores24 MB L3
Intel Core i5-13600H compare2.1 - 4.8 GHz12 / 16 cores18 MB L3
Intel Core i5-13505H compare1.9 - 4.7 GHz12 / 16 cores18 MB L3
Intel Core i5-13500H compare1.9 - 4.7 GHz12 / 16 cores18 MB L3
Intel Core i5-13420H compare1.5 - 4.6 GHz8 / 12 cores12 MB L3
Clock2060 - 3220 MHz1900 - 5400 MHz
L1 Cache2.3 MB1.2 MB
L2 Cache28 MB11.5 MB
L3 Cache16 MB24 MB
Cores / Threads8 / 814 / 20
Transistors33700 Million
Technology5 nm10 nm
FeaturesARMv8 Instruction SetThread Director
iGPUApple M1 Pro 14-Core GPU ( - 1296 MHz)Intel Iris Xe Graphics G7 96EUs ( - 1500 MHz)
ArchitectureARMx86
Announced
CodenameRaptor Lake-H
TDP45 Watt
max. Temp.100 °C
SocketFCBGA1792
Manufacturerark.intel.com

Benchmarks

Performance Rating - CB R15 + R20 + 7-Zip + X265 + Blender + 3DM11 CPU - i9-13905H
42.9 pt (60%)
Cinebench R23 - Cinebench R23 Multi Core
9581 Points (9%)
min: 17880     avg: 19384     median: 20034 (19%)     max: 20237 Points
Cinebench R23 - Cinebench R23 Single Core
1531 Points (65%)
min: 1652     avg: 1901     median: 2020 (86%)     max: 2030 Points
Cinebench R20 - Cinebench R20 CPU (Single Core)
min: 622     avg: 679     median: 639 (71%)     max: 775 Points
Cinebench R20 - Cinebench R20 CPU (Multi Core)
min: 6462     avg: 7028     median: 7152 (17%)     max: 7469 Points
Cinebench R15 - Cinebench R15 CPU Multi 64 Bit
1320 Points (8%)
min: 2676     avg: 2821     median: 2857 (18%)     max: 2931 Points
Cinebench R15 - Cinebench R15 CPU Single 64 Bit
210 Points (63%)
min: 235     avg: 255.3     median: 246 (74%)     max: 285 Points
7-Zip 18.03 - 7-Zip 18.03 Multli Thread 4 runs
min: 68880     avg: 71701     median: 69892 (40%)     max: 76332 MIPS
7-Zip 18.03 - 7-Zip 18.03 Single Thread 4 runs
min: 4871     avg: 5487     median: 5520 (66%)     max: 6069 MIPS
HWBOT x265 Benchmark v2.2 - HWBOT x265 4k Preset
min: 20.5     avg: 21.5     median: 21.2 (37%)     max: 22.9 fps
Blender - Blender 3.3 Classroom CPU *
min: 280     avg: 296     median: 302 (4%)     max: 306 Seconds
Blender - Blender 2.79 BMW27 CPU *
min: 163     avg: 171.3     median: 173 (1%)     max: 178 Seconds
R Benchmark 2.5 - R Benchmark 2.5 *
min: 0.4178     avg: 0.5     median: 0.5 (10%)     max: 0.4974 sec
3DMark 11 - 3DM11 Performance Physics
min: 22494     avg: 23911     median: 23894 (65%)     max: 25346 Points
3DMark - 3DMark Cloud Gate Physics
21588 Points (55%)
3DMark - 3DMark Fire Strike Standard Physics
min: 27625     avg: 29475     median: 29193 (52%)     max: 31606 Points
3DMark - 3DMark Time Spy CPU
min: 12800     avg: 13567     median: 13653 (58%)     max: 14249 Points
Geekbench 6.2 - Geekbench 6.2 Single-Core
2404 Points (65%)
Geekbench 6.2 - Geekbench 6.2 Multi-Core
14212 Points (56%)
Geekbench 5.5 - Geekbench 5.1 - 5.4 64 Bit Single-Core
1769 Points (75%)
min: 1672     avg: 1774     median: 1685 (71%)     max: 1966 Points
Geekbench 5.5 - Geekbench 5.1 - 5.4 64 Bit Multi-Core
9942 Points (18%)
min: 13661     avg: 14122     median: 13707 (25%)     max: 14999 Points
Geekbench 5.0 - Geekbench 5.0 64 Bit Single-Core
1898 Points (8%)
Geekbench 5.0 - Geekbench 5.0 64 Bit Multi-Core
14690 Points (46%)
Mozilla Kraken 1.1 - Kraken 1.1 Total Score *
407.2 ms (0%)
min: 465     avg: 522     median: 545 (1%)     max: 557 ms
Sunspider - Sunspider 1.0 Total Score *
76.7 ms (1%)
Octane V2 - Octane V2 Total Score
65528 Points (58%)
WebXPRT 4 - WebXPRT 4 Score
min: 243     avg: 265.5     median: 265.5 (76%)     max: 288 Points
WebXPRT 3 - WebXPRT 3 Score
343 Points (71%)
min: 267     avg: 301.5     median: 301.5 (63%)     max: 336 Points
CrossMark - CrossMark Overall
1490 Points (57%)
min: 1774     avg: 1884     median: 1883.5 (72%)     max: 1993 Points
Power Consumption - Prime95 Power Consumption - external Monitor *
min: 139.4     avg: 140     median: 140 (24%)     max: 140.6 Watt
Power Consumption - Cinebench R15 Multi Power Consumption - external Monitor *
168.6 Watt (31%)
Power Consumption - Geekbench 5.5 Power Consumption 150cd *
14.8 Watt (6%)
Power Consumption - Idle Power Consumption - external Monitor *
min: 16     avg: 16.6     median: 16.6 (11%)     max: 17.2 Watt
Power Consumption - Idle Power Consumption 150cd 1min *
5.4 Watt (6%)
min: 11.7     avg: 15.8     median: 15.8 (17%)     max: 19.9 Watt
Power Consumption - Cinebench R15 Multi Power Efficiency - external Monitor
16.9 Points per Watt (13%)

Average Benchmarks Apple M1 Pro 8-Core → 100% n=9

Average Benchmarks Intel Core i9-13905H → 136% n=9

- Range of benchmark values for this graphics card
- Average benchmark values for this graphics card
* Smaller numbers mean a higher performance
1 This benchmark is not used for the average calculation

Add one or more devices and compare

In the following list you can select (and also search for) devices that should be added to the comparison. You can select more than one device.

restrict list:

show all (including archived), 2024, 2023
v1.28
log 04. 18:56:05

#0 checking url part for id 13847 +0s ... 0s

#1 checking url part for id 14983 +0s ... 0s

#2 redirected to Ajax server, took 1720112164 +0s ... 0s

#3 did not recreate cache, as it is less than 5 days old! Created at Thu, 04 Jul 2024 05:15:21 +0200 +0s ... 0s

#4 composed specs +0.005s ... 0.005s

#5 did output specs +0s ... 0.005s

#6 getting avg benchmarks for device 13847 +0.001s ... 0.006s

#7 got single benchmarks 13847 +0.005s ... 0.01s

#8 getting avg benchmarks for device 14983 +0.004s ... 0.014s

#9 got single benchmarks 14983 +0.007s ... 0.021s

#10 got avg benchmarks for devices +0s ... 0.021s

#11 min, max, avg, median took s +0.023s ... 0.044s

#12 return log +0.002s ... 0.046s

Please share our article, every link counts!
> Expert Reviews and News on Laptops, Smartphones and Tech Innovations > Benchmarks / Tech > Processor Comparison - Head 2 Head
Redaktion, 2017-09- 8 (Update: 2023-07- 1)