 Deutsch
 English
 Español
 Français
 Italiano
 Nederlands
 Polski
 Português
 Русский
 Türkçe
 Svenska
 Chinese
 Magyar
Apple M1 Pro 8-Core vs Intel Core i7-11375H
Apple M1 Pro 8-Core
► remove from comparison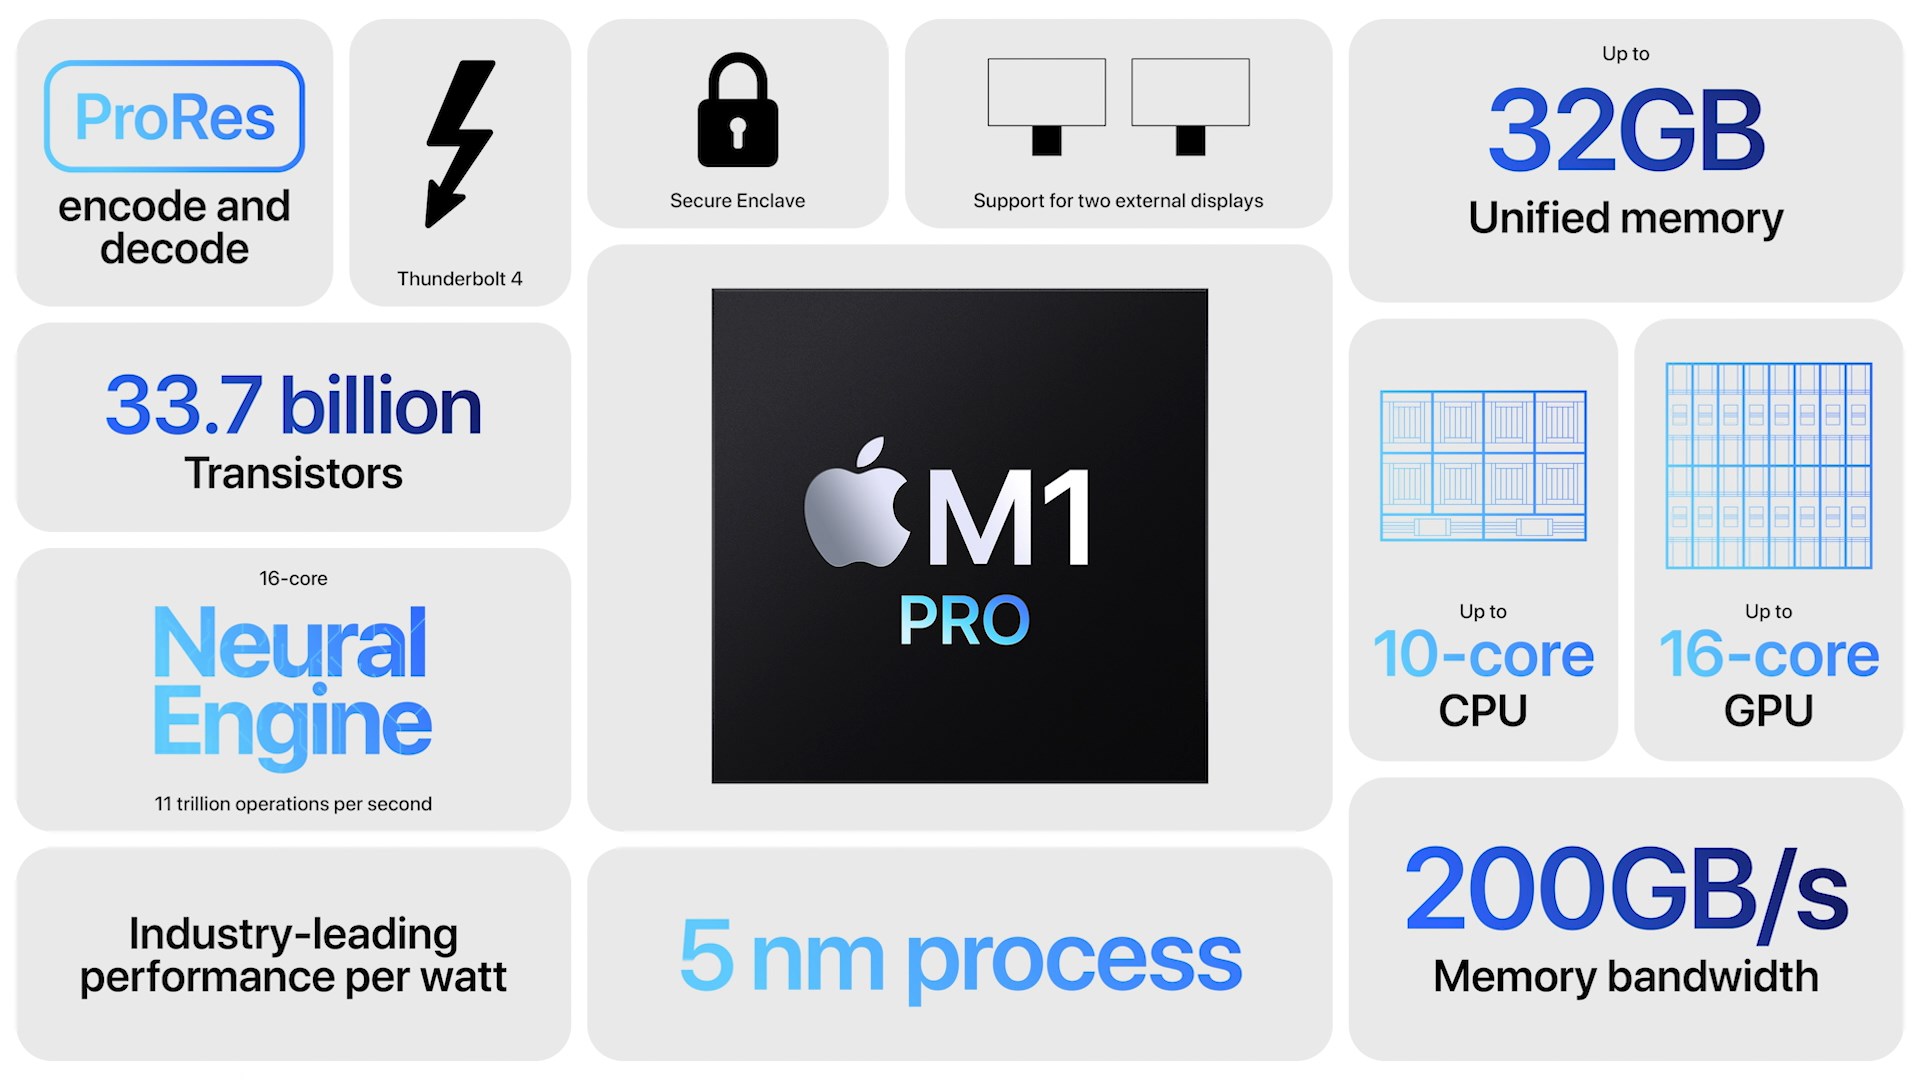
The Apple M1 Pro 8-Core is a System on a Chip (SoC) from Apple that is found in the late 2021 MacBook Pro 14 and 16-inch models. It offers 8 cores from the 10 available in the chip divided in six performance cores (P-cores with 600 - 3220 MHz) and four power-efficiency cores (E-cores with 600 - 2064 MHz). The cores are similar to the cores in the Apple M1.
The big cores (codename Firestorm) offer 192 KB instruction cache, 128 KB data cache, and 24 MB shared L2 cache (up from 12 MB in the M1). The four efficiency cores (codename Icestorm) are a lot smaller and offer only 128 KB instruction cache, 64 KB data cache, and 4 MB shared cache. Finally, the SoC includes 16 MB System Level Cache shared by the GPU. The efficiency cores (E cluster) clock with 600 - 2064 MHz, the performance cores (P cluster) with 600 - 3228 MHz.
The unified memory (16 or 32 GB LPDDR5-6400) next to the chip is connected by a 256 bit memory controller and can be used by the GPU and CPU.
The integrated graphics card in the M1 Pro offers 14 cores (of the 16 cores in the chip).
Furthermore, the SoC integrates a fast 16 core neural engine, a secure enclave (e.g., for encryption), a unified memory architecture, Thunderbolt 4 controller, an ISP, and media de- and encoders (including ProRes).
The M1 Pro is manufactured in 5 nm at TSMC and integrates 33.7 billion transistors. The peak power consumption of the chip was advertised around 30W for CPU intensive tasks.
Intel Core i7-11375H
► remove from comparison
The Intel Core i7-11375H is a high end quad core SoC for thin and light gaming laptops and mobile workstations. It is based on the Tiger Lake H35 generation and was announced early 2021. It integrates four Willow Cove processor cores (8 threads thanks to HyperThreading). The base clock speed depends on the TDP setting and can vary from 3 (28 W TDP) to 3.3 GHz (35 W). Compared to the i7-11370H, the only difference is the additional Turbo Boost 3.0 for a single core. With it, the 11375H can clock up to 5 GHz. Two cores can clock up to 4.8 GHz (as the 11370H) and all four cores can reach up to 4.3 GHz. The 11375H can use the whole 12 MB level 3 cache.
The processor performance of the i7 should be very similar to the i7-11370H. Only single threaded short workloads will be slightly faster. The multi-threaded performance should be clearly higher than the old Core i5-10400H (Comet Lake, fastest quad core of the 10th gen) due to the new processor architecture. The similar Core i7-1185G7 offers similar specs as the 11370H but a lower TDP and therefore also lower (sustained) performance.
The SoC also included the improved Xe graphics adapter with all 96 EUs clocked at up to 1350 MHz.
Furthermore, Tiger Lake SoCs add PCIe 4 support (four lanes), AI hardware acceleration, and the partial integration of Thunderbolt 4/USB 4 and Wi-Fi 6 in the chip.
The chip is produced on the improved 10nm process (called 10nm SuperFin) at Intel, which should be comparable to the 7nm process at TSMC (e.g. Ryzen 4000 series).
All articles on Tiger Lake can be found on our Tiger Lake architecture hub.
| Model | Apple M1 Pro 8-Core | Intel Core i7-11375H | ||||||||||||||||||||||||||||||||||||
| Series | Apple Apple M-Series | Intel Tiger Lake | ||||||||||||||||||||||||||||||||||||
| Series: Tiger Lake Tiger Lake-H35 |
|
| ||||||||||||||||||||||||||||||||||||
| Clock | 2060 - 3220 MHz | 3300 - 5000 MHz | ||||||||||||||||||||||||||||||||||||
| L1 Cache | 2.3 MB | 320 KB | ||||||||||||||||||||||||||||||||||||
| L2 Cache | 28 MB | 5 MB | ||||||||||||||||||||||||||||||||||||
| L3 Cache | 16 MB | 12 MB | ||||||||||||||||||||||||||||||||||||
| Cores / Threads | 8 / 8 | 4 / 8 | ||||||||||||||||||||||||||||||||||||
| Transistors | 33700 Million | |||||||||||||||||||||||||||||||||||||
| Technology | 5 nm | 10 nm | ||||||||||||||||||||||||||||||||||||
| Features | ARMv8 Instruction Set | DDR4-3200/LPDDR4x-4266 RAM, PCIe 4, 4 GT/s bus, DL Boost, GNA, MMX, SSE, SSE2, SSE3, SSSE3, SSE4.1, SSE4.2, AVX, AVX2, AVX-512, BMI2, ABM, FMA, ADX, VMX, SMEP, SMAP, EIST, TM1, TM2, Hyper-Threading, Turbo, SST, AES-NI, RDRAND, RDSEED, SHA | ||||||||||||||||||||||||||||||||||||
| iGPU | Apple M1 Pro 14-Core GPU ( - 1296 MHz) | Intel Iris Xe Graphics G7 96EUs (400 - 1350 MHz) | ||||||||||||||||||||||||||||||||||||
| Architecture | ARM | x86 | ||||||||||||||||||||||||||||||||||||
| Announced | ||||||||||||||||||||||||||||||||||||||
| Codename | Tiger Lake-H35 | |||||||||||||||||||||||||||||||||||||
| TDP | 35 Watt | |||||||||||||||||||||||||||||||||||||
| max. Temp. | 100 °C | |||||||||||||||||||||||||||||||||||||
| Socket | BGA1449 | |||||||||||||||||||||||||||||||||||||
| $482 U.S. | ||||||||||||||||||||||||||||||||||||||
| Manufacturer | ark.intel.com |
