Notebookcheck Logo

Apple M1 Pro 14-Core GPU vs Apple M3 Pro 18-Core GPU vs Apple M1 Max 32-Core GPU

Apple M1 Pro 14-Core GPU

► remove from comparison Apple M1 Pro 14-Core GPU

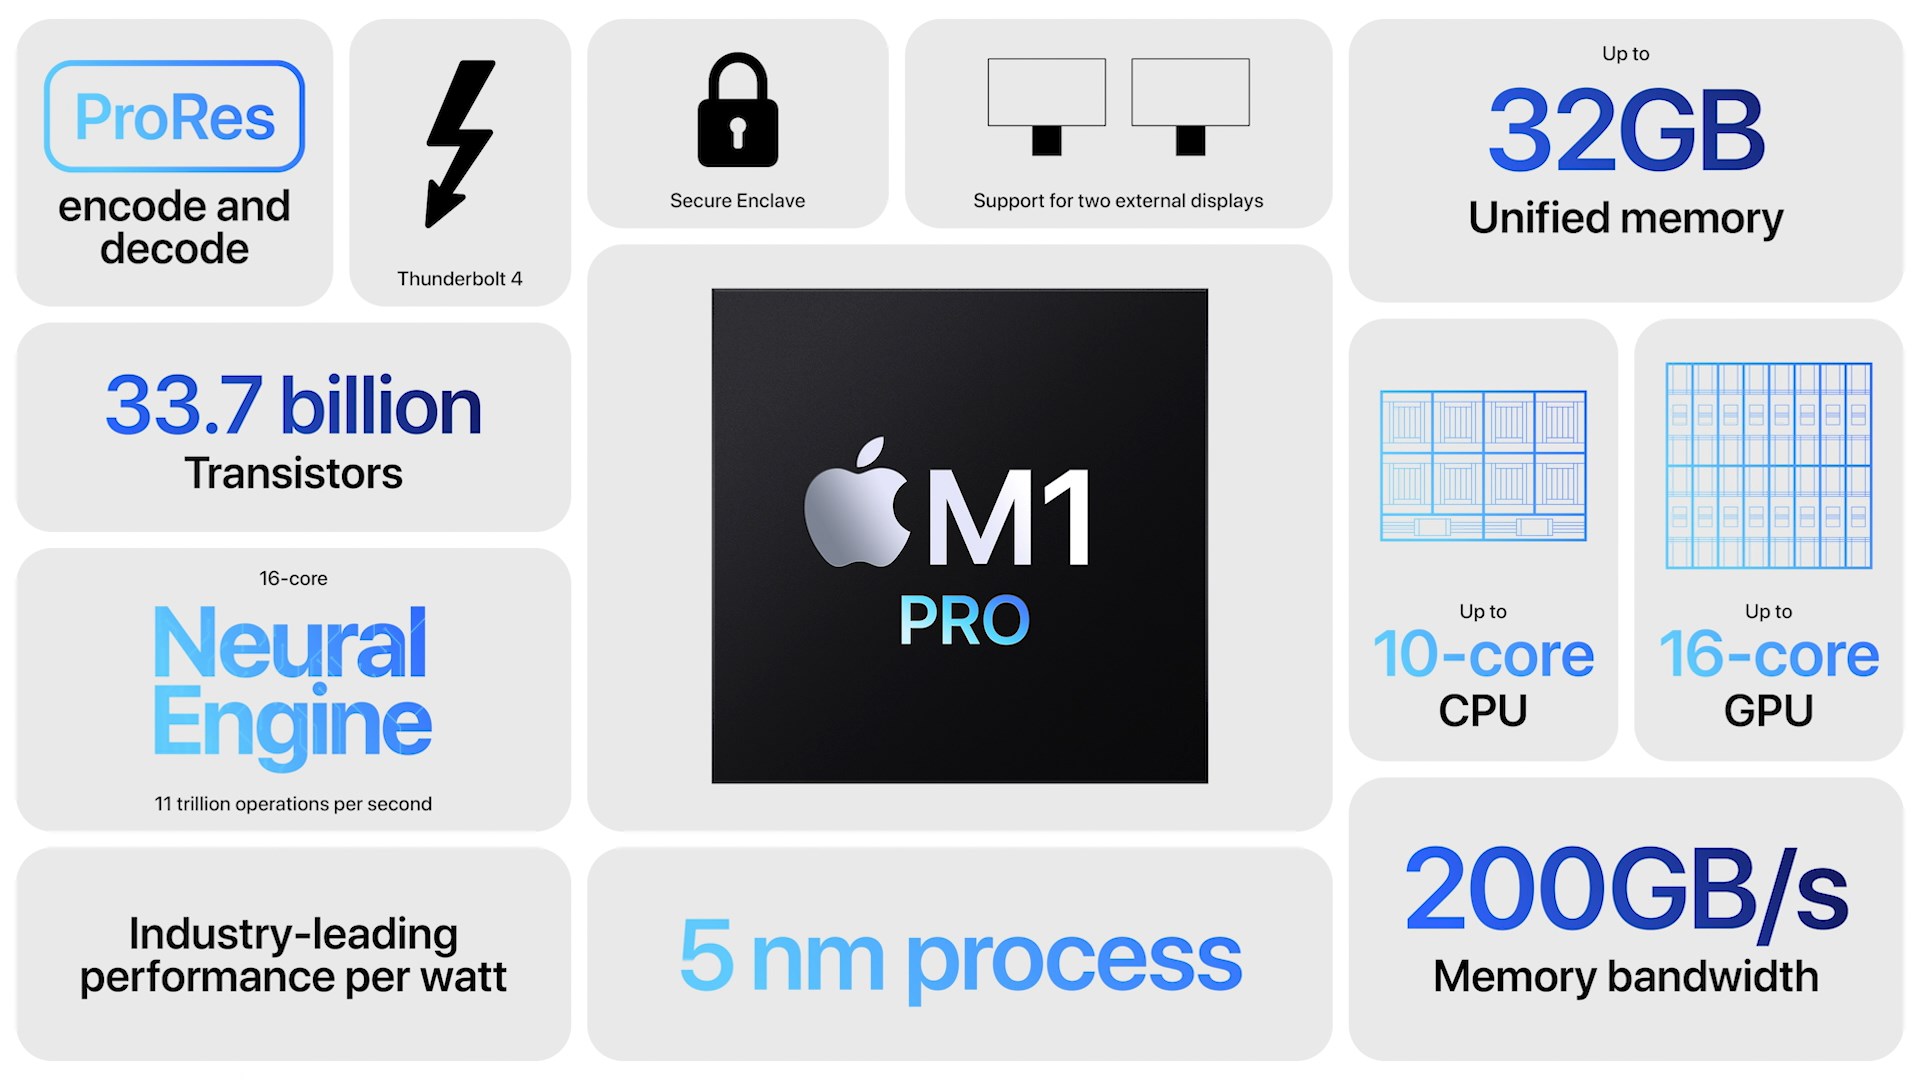
The Apple M1 Pro 14-Core-GPU is an integrated graphics card by Apple offering 14 of the 16 cores in the M1 Pro Chip. The 1792 ALUs offer a theoretical performance of up to 4.6 Teraflops (16 core variant with 2048 ALUs offers 5.3 Teraflops). 

The graphics card has no dedicated graphics memory but can use the fast LPDDR5-6400 unified memory with a 256 bit bus (up to 200 GBit/s).

The GPU clocks between 389 and 1296 MHz and offers no short term boost (389, 486, 648, 778, 972, 1296 MHz steps according to Powermetrics). The GPU is intended to use Apple Metal 2 API and could still be based on the older PowerVR architectures (last used in the Apple A10).

The Apple M1 Pro is manufactured in the modern 5nm process at TSMC and offers an excellent energy efficiency. According to the internal sensors, the GPU uses 15 Watt under full load.

Apple M3 Pro 18-Core GPU

► remove from comparison Apple M3 Pro 18-Core GPU

The Apple M3 Pro 18-Core GPU is a self-designed graphics card in the Apple M3 Pro (with 12 CPU cores) and offers all eighteen cores available on the chip. The graphics card uses a new architecture and now offers dynamic caching, mesh shading and ray tracing acceleration.

The GPU can access up to 36 GB LPDDR5-6400 unified memory via a 192-bit memory bus (max 150 GBit/s). Thanks to dynamic caching, the GPU only reserves as much memory as is required.

The entire chip is manufactured in the current 3nm process (probably N3B) at TSMC.

Apple M1 Max 32-Core GPU

► remove from comparison Apple M1 Max 32-Core GPU

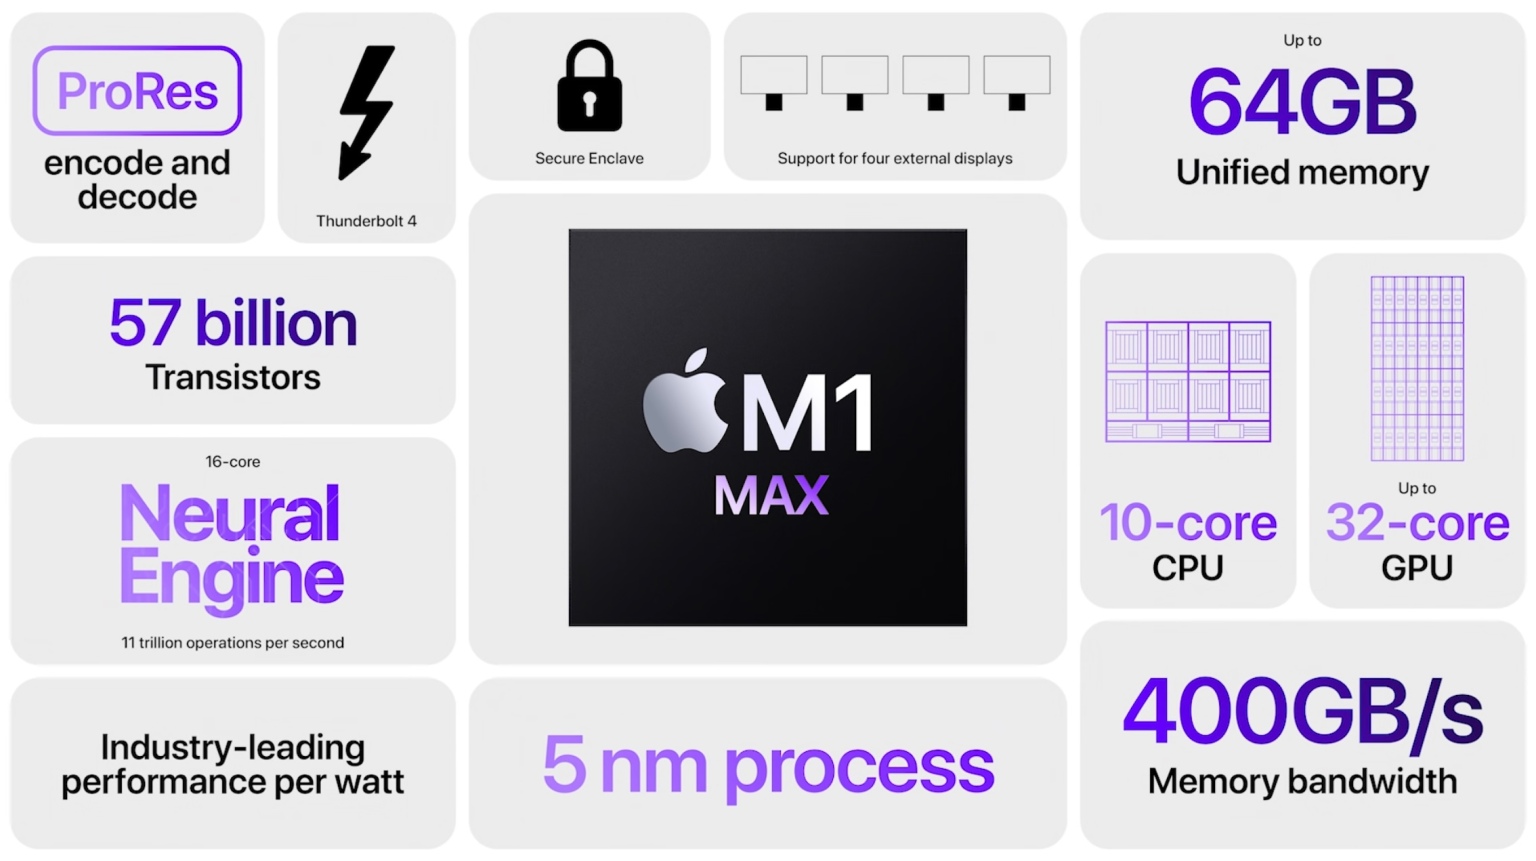
The Apple M1 Max 32-Core-GPU is an integrated graphics card by Apple offering all 32 cores in the M1 Max Chip. The 4,096 ALUs offer a theoretical performance of up to 10.4 Teraflops. 

The graphics card has no dedicated graphics memory but can use the fast LPDDR5-6400 unified memory with a 512 bit bus (up to 400 GBit/s).

The GPU clocks between 389 and 1296 MHz and offers no short term boost (389, 486, 648, 778, 972, 1296 MHz steps according to Powermetrics). The GPU is intended to use Apple Metal 2 API and could still be based on the older PowerVR architectures (last used in the Apple A10).

The Apple M1 Max is manufactured in the modern 5nm process at TSMC and offers an excellent energy efficiency.

Apple M1 Pro 14-Core GPUApple M3 Pro 18-Core GPUApple M1 Max 32-Core GPU
Apple M1 Series
M1 Max 32-Core GPU 32 @ 1.3 GHz512 Bit
M1 Max 24-Core GPU 24 @ 1.3 GHz
M1 Pro 16-Core GPU 16 @ 1.3 GHz
M1 Pro 14-Core GPU 14 @ 1.3 GHz
M1 8-Core GPU 8 @ 1.28 GHz
M1 7-Core GPU 7 @ 1.28 GHz
M3 Max 40-Core GPU 40
M3 Max 30-Core GPU 30
M3 Pro 18-Core GPU 18
M3 Pro 14-Core GPU 14
M3 10-Core GPU 10
M3 8-Core GPU 8
M1 Max 32-Core GPU 32 @ 1.3 GHz512 Bit
M1 Max 24-Core GPU 24 @ 1.3 GHz
M1 Pro 16-Core GPU 16 @ 1.3 GHz
M1 Pro 14-Core GPU 14 @ 1.3 GHz
M1 8-Core GPU 8 @ 1.28 GHz
M1 7-Core GPU 7 @ 1.28 GHz
Pipelines14 - unified18 - unified32 - unified
Core Speed1296 MHz1296 MHz
Theoretical Performance4.6 TFLOPS FP3210.4 TFLOPS FP32
Memory TypeLPDDR5-6400LPDDR5-6400LPDDR5-6400
Shared Memorynonono
Memory Bandwidth200 GB/s400 GB/s
Power Consumption15 Watt44 Watt
technology5 nm5 nm5 nm
Date of Announcement10.11.2020 31.10.2023 10.11.2020
Notebook Sizemedium sized
Memory Bus Width512 Bit
Link to Manufacturer Pagewww.apple.com
CPU in M1 Pro 14-Core GPUGPU Base SpeedGPU Boost / Turbo
Apple M1 Pro 8-Core8 x 2060 MHz? MHz1296 MHz
CPU in M3 Pro 18-Core GPUGPU Base SpeedGPU Boost / Turbo
Apple M3 Pro 12-Core12 x 2748 MHz, 27 W? MHz? MHz
CPU in M1 Max 32-Core GPUGPU Base SpeedGPU Boost / Turbo
Apple M1 Max10 x 2060 MHz? MHz? MHz

Benchmarks

3DMark - 3DMark Wild Life Unlimited
72116 Points (36%)
3DMark - 3DMark Wild Life Extreme Unlimited
9267 Points (11%)
14545 Points (17%)
min: 20228     avg: 20261     median: 20260.5 (23%)     max: 20293 Points
Blender - Blender 3.3 Classroom METAL *
69 Seconds (7%)
Cinebench R15
Cinebench R15 OpenGL 64 Bit + Apple M1 Pro 14-Core GPU
Cinebench R15 - Cinebench R15 OpenGL 64 Bit
91.8 fps (5%)
Cinebench R15 OpenGL 64 Bit + Apple M1 Max 32-Core GPU
min: 94.2     avg: 94.4     median: 94.4 (6%)     max: 94.5 fps
Cinebench R15 OpenGL Ref. Match 64 Bit + Apple M1 Pro 14-Core GPU
Cinebench R15 - Cinebench R15 OpenGL Ref. Match 64 Bit
99.5 % (100%)
Cinebench R15 OpenGL Ref. Match 64 Bit + Apple M1 Max 32-Core GPU
99.5 % (100%)
GFXBench - GFXBench 5.0 4K Aztec Ruins High Tier Offscreen
97.8 fps (40%)
139.6 fps (57%)
GFXBench - GFXBench 5.0 Aztec Ruins High Tier Offscreen
147 fps (27%)
219.7 fps (40%)
min: 308.5     avg: 309.4     median: 309.4 (56%)     max: 310.3 fps
GFXBench - GFXBench 5.0 Aztec Ruins Normal Tier Offscreen
394 fps (29%)
580 fps (43%)
min: 718.4     avg: 735     median: 735.2 (54%)     max: 752 fps
GFXBench - GFXBench Car Chase Offscreen
316 fps (36%)
436 fps (49%)
min: 424.2     avg: 437.5     median: 437.5 (49%)     max: 450.7 fps
GFXBench 3.1 - GFXBench Manhattan ES 3.1 Offscreen
496 fps (10%)
670 fps (14%)
min: 894.9     avg: 921     median: 921 (19%)     max: 947 fps
GFXBench 3.0 - GFXBench 3.0 Manhattan Offscreen
817 fps (48%)
936 fps (55%)
min: 1162.47     avg: 1227     median: 1227.2 (72%)     max: 1292 fps
GFXBench (DX / GLBenchmark) 2.7
GFXBench T-Rex HD Offscreen C24Z16 + Apple M1 Pro 14-Core GPU
GFXBench (DX / GLBenchmark) 2.7 - GFXBench T-Rex HD Offscreen C24Z16
1457 fps (12%)
GFXBench T-Rex HD Offscreen C24Z16 + Apple M3 Pro 18-Core GPU
1480 fps (12%)
GFXBench T-Rex HD Offscreen C24Z16 + Apple M1 Max 32-Core GPU
min: 2057.6     avg: 2252     median: 2251.8 (18%)     max: 2446 fps
Geekbench 6.2 - Geekbench 6.2 GPU OpenCL
50373 Points (15%)
Geekbench 6.2 - Geekbench 6.2 GPU Metal
78324 Points (50%)
Power Consumption - The Witcher 3 Power Consumption - external Monitor *
40 Watt (6%)
41.3 Watt (6%)
Power Consumption - Witcher 3 Power Consumption *
58.2 Watt (13%)
52.1 Watt (11%)
104 Watt (23%)
Power Consumption - GFXBench Aztec Ruins Normal Tier Offscreen Power Consumption 150cd *
35 Watt (14%)
Power Consumption - Witcher 3 ultra Power Efficiency
0.8 fps per Watt (74%)
Power Consumption - Witcher 3 ultra Power Efficiency - external Monitor
min: 1.075     avg: 1.1     median: 1.1 (89%)     max: 1.207 fps per Watt
Emissions Witcher 3 Fan Noise + Apple M1 Pro 14-Core GPU
Emissions - Witcher 3 Fan Noise
27.8 dB(A) (44%)
Witcher 3 Fan Noise + Apple M3 Pro 18-Core GPU
25.1 dB(A) (40%)
Witcher 3 Fan Noise + Apple M1 Max 32-Core GPU
min: 28.8     avg: 34.2     median: 34.2 (55%)     max: 39.5 dB(A)

Average Benchmarks Apple M1 Pro 14-Core GPU → 100% n=7

Average Benchmarks Apple M3 Pro 18-Core GPU → 135% n=7

Average Benchmarks Apple M1 Max 32-Core GPU → 178% n=7

- Range of benchmark values for this graphics card
- Average benchmark values for this graphics card
* Smaller numbers mean a higher performance
1 This benchmark is not used for the average calculation

Game Benchmarks

The following benchmarks stem from our benchmarks of review laptops. The performance depends on the used graphics memory, clock rate, processor, system settings, drivers, and operating systems. So the results don't have to be representative for all laptops with this GPU. For detailed information on the benchmark results, click on the fps number.

Total War Pharaoh

Total War Pharaoh

2023
low 1920x1080
M3 Pro 18-Core GPU:
212  fps
med. 1920x1080
M3 Pro 18-Core GPU:
140  fps
high 1920x1080
M3 Pro 18-Core GPU:
77  fps
ultra 1920x1080
M3 Pro 18-Core GPU:
58  fps
QHD 2560x1440
M3 Pro 18-Core GPU:
42  fps
Cyberpunk 2077 2.1 Phantom Liberty

Cyberpunk 2077 2.1 Phantom Liberty

2023
low 1920x1080
M3 Pro 18-Core GPU:
53  fps
med. 1920x1080
M3 Pro 18-Core GPU:
42.6  fps
high 1920x1080
M3 Pro 18-Core GPU:
35  fps
ultra 1920x1080
M3 Pro 18-Core GPU:
30.8  fps
high 1920x1080
M3 Pro 18-Core GPU:
53  fps
ultra 1920x1080
M3 Pro 18-Core GPU:
43  fps
high 1920x1080
M3 Pro 18-Core GPU:
30  fps
ultra 1920x1080
M3 Pro 18-Core GPU:
26  fps
QHD 2560x1440
M3 Pro 18-Core GPU:
17  fps
F1 2020

F1 2020

2020
low 1280x720
100%
M1 Pro 14-Core GPU:
65  fps
low 1280x720
100%
M1 Pro 14-Core GPU:
61.9  fps
107%
M1 Max 32-Core GPU:
65.5 67.4 ~ 66 fps
med. 1920x1080
100%
M1 Pro 14-Core GPU:
39.4  fps
137%
M1 Max 32-Core GPU:
53.2 55.3 ~ 54 fps
high 1920x1080
100%
M1 Pro 14-Core GPU:
31.9  fps
147%
M1 Max 32-Core GPU:
46.1 47.6 ~ 47 fps
ultra 1920x1080
100%
M1 Pro 14-Core GPU:
24.1  fps
166%
M1 Max 32-Core GPU:
39.6 40.7 ~ 40 fps
QHD 2560x1440
M1 Max 32-Core GPU:
33  fps
4K 3840x2160
M1 Max 32-Core GPU:
20.6  fps
low 1280x720
100%
M1 Pro 14-Core GPU:
171  fps
144%
M1 Max 32-Core GPU:
201 293 ~ 247 fps
med. 1920x1080
100%
M1 Pro 14-Core GPU:
58  fps
150%
M3 Pro 18-Core GPU:
87  fps
222%
M1 Max 32-Core GPU:
127 131 ~ 129 fps
high 1920x1080
100%
M1 Pro 14-Core GPU:
36  fps
156%
M3 Pro 18-Core GPU:
56  fps
228%
M1 Max 32-Core GPU:
80 83 ~ 82 fps
ultra 1920x1080
100%
M1 Pro 14-Core GPU:
27  fps
152%
M3 Pro 18-Core GPU:
41  fps
222%
M1 Max 32-Core GPU:
59 60 ~ 60 fps
QHD 2560x1440
M3 Pro 18-Core GPU:
25  fps
M1 Max 32-Core GPU:
39  fps
4K 3840x2160
M1 Max 32-Core GPU:
20  fps
low 1280x720
100%
M1 Pro 14-Core GPU:
122  fps
115%
M1 Max 32-Core GPU:
139 140 ~ 140 fps
med. 1920x1080
100%
M1 Pro 14-Core GPU:
58  fps
122%
M3 Pro 18-Core GPU:
71  fps
179%
M1 Max 32-Core GPU:
104 104 ~ 104 fps
high 1920x1080
100%
M1 Pro 14-Core GPU:
53  fps
123%
M3 Pro 18-Core GPU:
65  fps
183%
M1 Max 32-Core GPU:
97 97 ~ 97 fps
ultra 1920x1080
100%
M1 Pro 14-Core GPU:
46  fps
124%
M3 Pro 18-Core GPU:
57  fps
191%
M1 Max 32-Core GPU:
87 88 ~ 88 fps
QHD 2560x1440
100%
M1 Pro 14-Core GPU:
30  fps
123%
M3 Pro 18-Core GPU:
37  fps
203%
M1 Max 32-Core GPU:
61  fps
4K 3840x2160
M1 Max 32-Core GPU:
33  fps
low 1024x768
100%
M1 Pro 14-Core GPU:
120  fps
med. 1366x768
100%
M1 Pro 14-Core GPU:
72  fps
ultra 1920x1080
M3 Pro 18-Core GPU:
43  fps
GTA V

GTA V

2015
med. 1366x768
M3 Pro 18-Core GPU:
90  fps
high 1920x1080
M3 Pro 18-Core GPU:
79  fps
ultra 1920x1080
M3 Pro 18-Core GPU:
52  fps
QHD 2560x1440
M3 Pro 18-Core GPU:
49  fps

Average Gaming Apple M1 Pro 14-Core GPU → 100%

Average Gaming 30-70 fps → 100%

Average Gaming Apple M3 Pro 18-Core GPU → 136%

Average Gaming 30-70 fps → 135%

Average Gaming Apple M1 Max 32-Core GPU → 173%

Average Gaming 30-70 fps → 164%

Apple M3 Pro 18-Core GPUlowmed.highultraQHD4K
Total War Pharaoh212140775842
Cyberpunk 2077 2.1 Phantom Liberty5342.63530.8
Baldur's Gate 35343
Star Wars Jedi Survivor302617
Total War: Three Kingdoms87564125
Shadow of the Tomb Raider71655737
The Witcher 343
GTA V90795249
< 30 fps
< 60 fps
< 120 fps
≥ 120 fps

1

1

1
3
1

4
3
1
7

2
3


Apple M1 Pro 14-Core GPUlowmed.highultraQHD4K
F1 202065
Borderlands 361.939.431.924.1
Total War: Three Kingdoms171583627
Shadow of the Tomb Raider12258534630
Civilization VI12072
< 30 fps
< 60 fps
< 120 fps
≥ 120 fps


2
3

3
1

3

2
1


1


Apple M1 Max 32-Core GPUlowmed.highultraQHD4K
Borderlands 3665447403320.6
Total War: Three Kingdoms24712982603920
Shadow of the Tomb Raider14010497886133
< 30 fps
< 60 fps
< 120 fps
≥ 120 fps


1
2

1
1
1

1
2

1
2

2
1
2
1

For more games that might be playable and a list of all games and graphics cards visit our Gaming List

v1.28
log 02. 14:17:39

#0 checking url part for id 10965 +0s ... 0s

#1 checking url part for id 11638 +0s ... 0s

#2 checking url part for id 10970 +0s ... 0s

#3 redirected to Ajax server, took 1719922659 +0s ... 0s

#4 did not recreate cache, as it is less than 5 days old! Created at Mon, 01 Jul 2024 05:16:07 +0200 +0s ... 0s

#5 composed specs +0.031s ... 0.031s

#6 did output specs +0s ... 0.031s

#7 start showIntegratedCPUs +0s ... 0.031s

#8 getting avg benchmarks for device 10965 +0.027s ... 0.058s

#9 got single benchmarks 10965 +0.004s ... 0.062s

#10 getting avg benchmarks for device 11638 +0s ... 0.062s

#11 got single benchmarks 11638 +0.003s ... 0.066s

#12 getting avg benchmarks for device 10970 +0s ... 0.066s

#13 got single benchmarks 10970 +0.004s ... 0.07s

#14 got avg benchmarks for devices +0s ... 0.07s

#15 min, max, avg, median took s +0.019s ... 0.089s

#16 before gaming benchmark output +0s ... 0.089s

#17 Got 73 rows for game benchmarks. +0.008s ... 0.097s

#18 composed SQL query for gamebenchmarks +0s ... 0.097s

#19 got data and put it in $dataArray +0.001s ... 0.097s

#20 benchmarks composed for output. +0.004s ... 0.101s

#21 calculated avg scores. +0s ... 0.101s

#22 return log +0s ... 0.102s

Please share our article, every link counts!
> Expert Reviews and News on Laptops, Smartphones and Tech Innovations > Benchmarks / Tech > Graphics Card Comparison - Head 2 Head
Redaktion, 2017-09- 8 (Update: 2023-07- 1)