Notebookcheck Logo

Apple M1 8-Core GPU vs Intel Arc A530M

Apple M1 8-Core GPU

► remove from comparison Apple M1 8-Core GPU

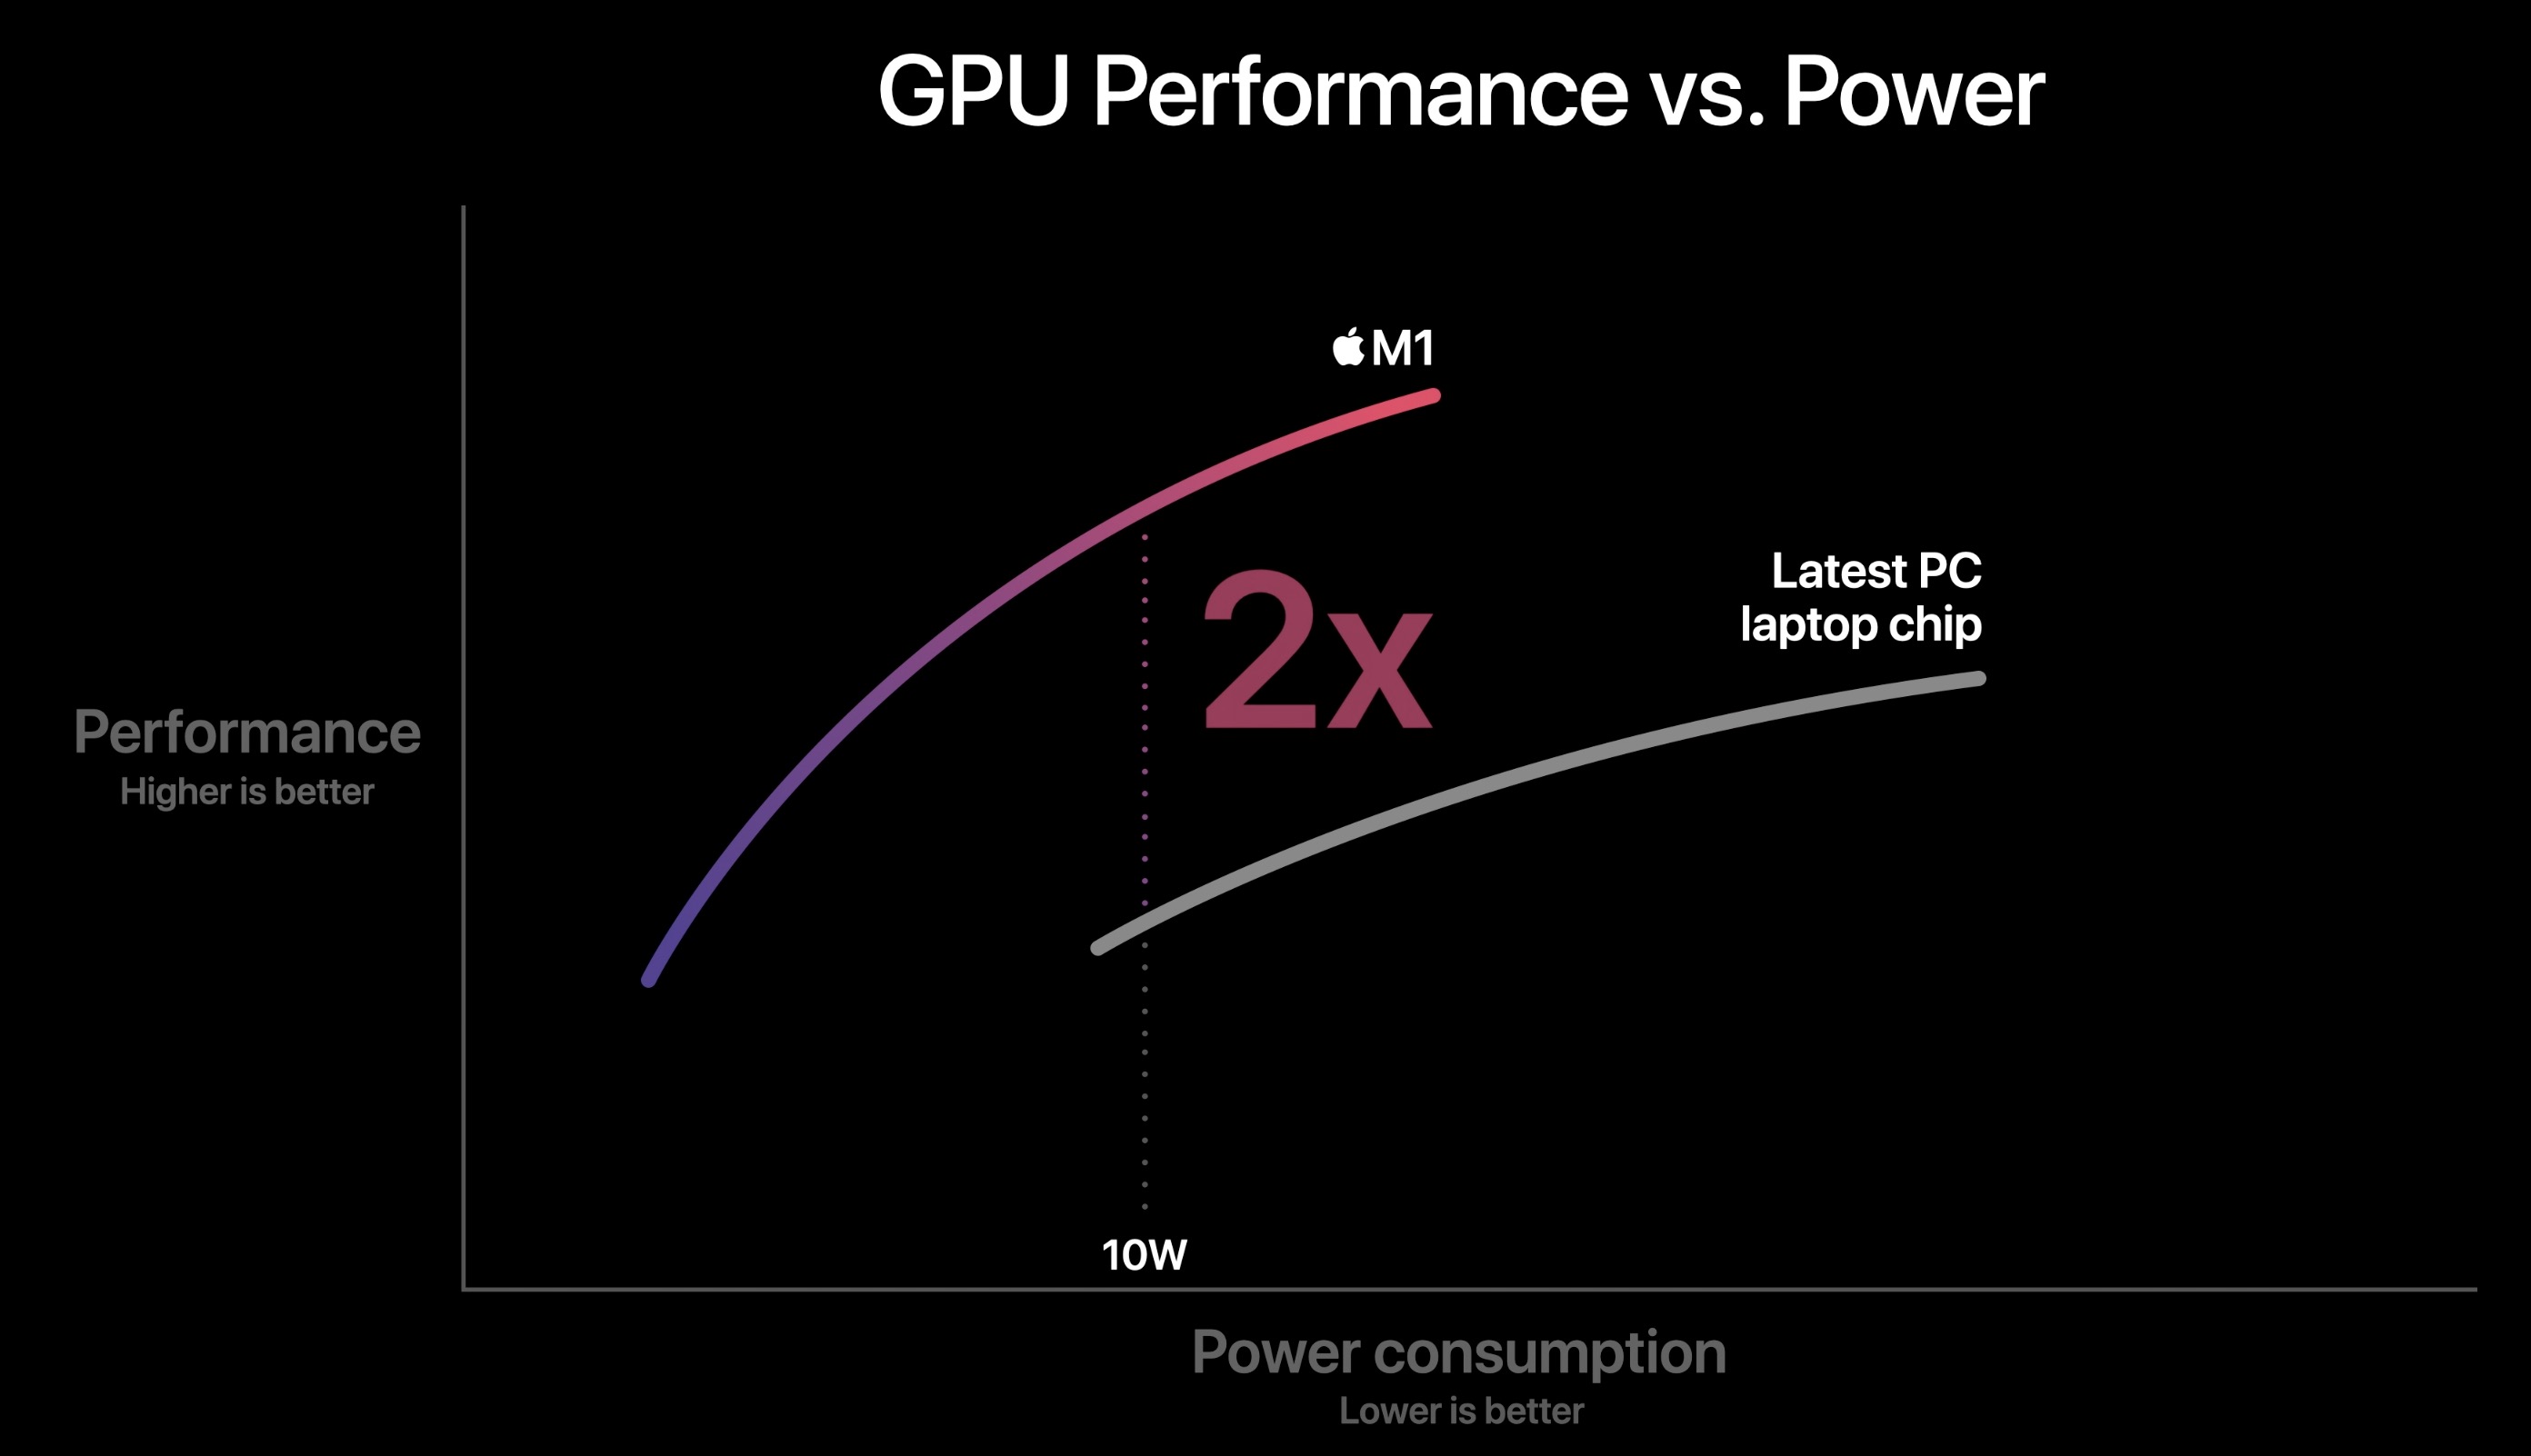
The Apple M1 GPU is an integrated graphics card offering 8 cores (1 deactivated core in the entry MacBook Air) designed by Apple and integrated in the Apple M1 SoC. According to Apple it is faster and more energy efficient as competing products (like the Tiger Lake Xe GPU). The peak performance of the high end variant is 2.6 teraflops and thanks to the unified memory architecture it should have fast access to the RAM.

The Apple M1 is manufactured in the modern 5nm process at TSMC and should offer an excellent energy efficiency. According to internal tools, the M1 GPU uses under load approximately 10 Watt (11.5 Watt package power including the RAM).

Intel Arc A530M

► remove from comparison Intel A530M

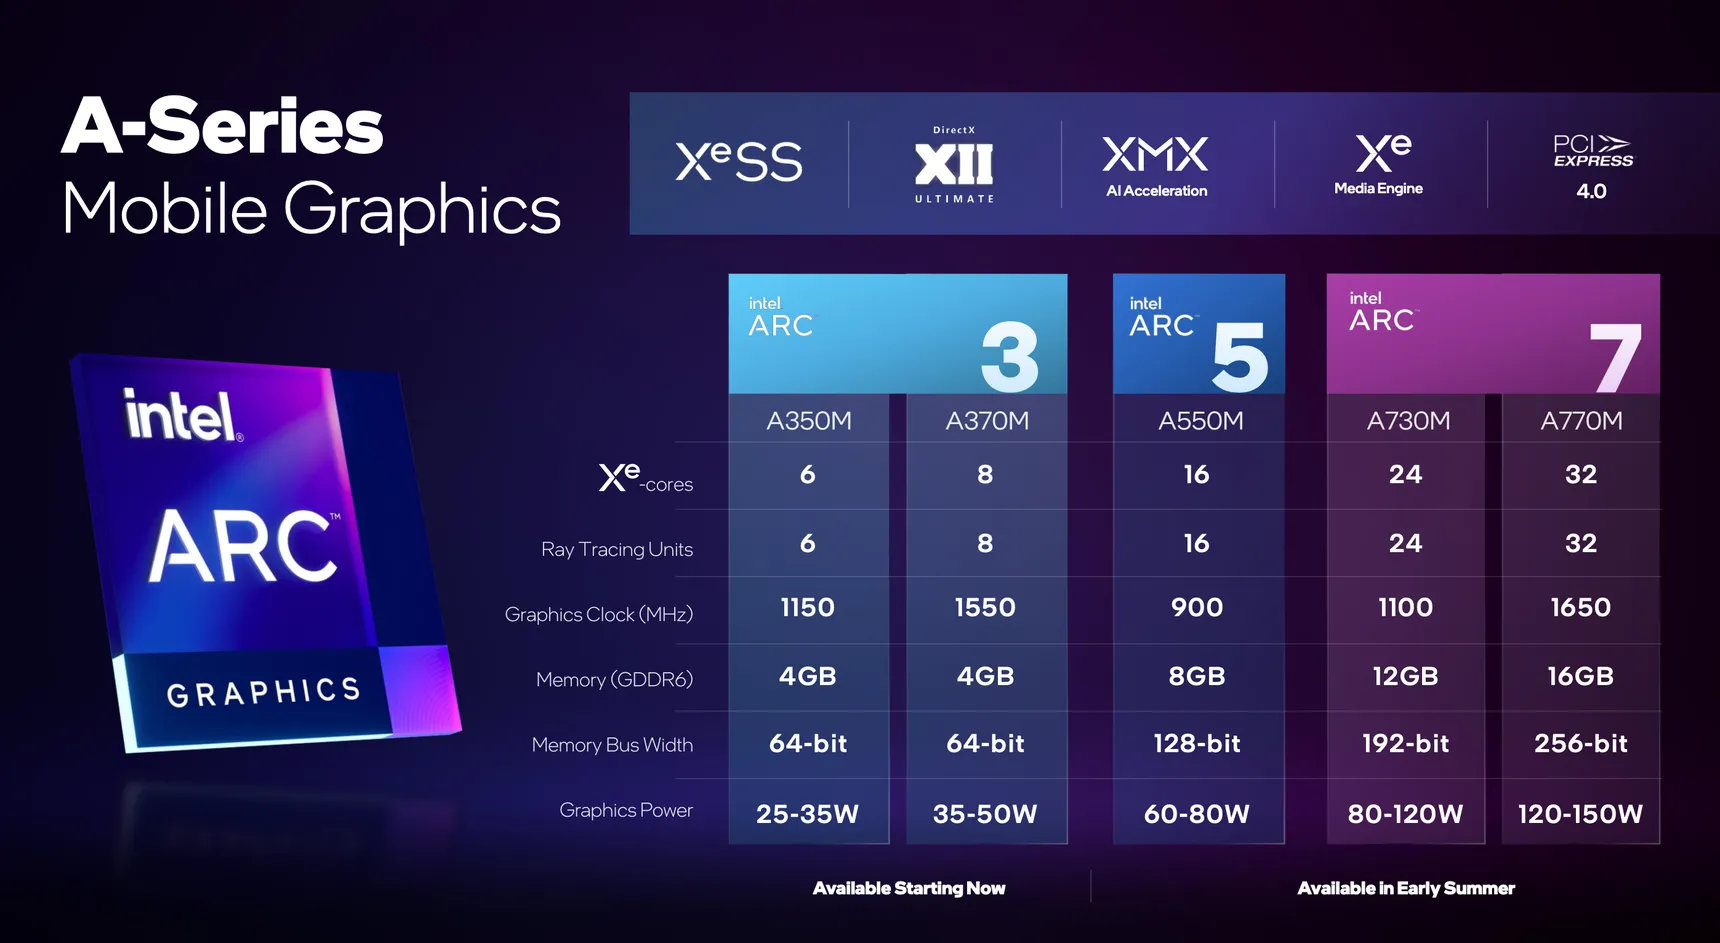
The Intel Arc A530M (device ID 5697) is a dedicated mobile lower- mid-range graphics card for laptops based on Xe HPG microarchitecture. It uses the ACM-G12 chip and offers 12 of the 16 Xe-cores (192 ALUs), 12 ray tracing units and a 128-bit memory bus for 8 GB GDDR6 graphics memory. The cores can clock from 300 MHz (low frequency mode) to 1300 MHz (high frequency) or in short bursts 2050+ MHz (short bursts / Turbo).

The performance of the Arc A530M should be slightly below the older Arc A550M (more cores but less clock speed).

The chip also integrates two media engines for VP9, AVC, HEVC, and AV1 8k en- and decoding. The 4 display pipes support up to 4x 4k120 HDR via DMI 2.0B or DisplayPort 2.0 10G. 

The A530M is produced in 6nm at TSMC (N6 process) and supports dynamic power share (using Deep Link) with 12th gen Intel CPUs (Alder Lake).

Apple M1 8-Core GPUIntel Arc A530M
Arc Series
M1 Max 32-Core GPU compare 32 @ 1.3 GHz512 Bit
M1 Max 24-Core GPU compare 24 @ 1.3 GHz
M1 Pro 16-Core GPU compare 16 @ 1.3 GHz
M1 Pro 14-Core GPU compare 14 @ 1.3 GHz
M1 8-Core GPU 8 @ 1.28 GHz
M1 7-Core GPU compare 7 @ 1.28 GHz
Arc A770 compare 4096 @ 2.1 - 2.4 GHz256 Bit @ 16000 MHz
Arc A750 compare 3584 @ 2.05 - 2.4 GHz256 Bit @ 16000 MHz
Arc A580 compare 3072 @ 1.7 - 2 GHz256 Bit @ 16000 MHz
A770M compare 4096 @ 1.65 GHz256 Bit @ 16000 MHz
A730M compare 3072 @ 1.1 GHz192 Bit @ 14000 MHz
A570M compare 16 @ 0.9 - 1.3 GHz128 Bit @ 14000 MHz
A550M compare 16 @ 0.9 - 2.01 GHz128 Bit @ 14000 MHz
A530M 12 @ 0.9 - 1.3 GHz128 Bit @ 14000 MHz
A370M compare 8 @ 1.55 GHz64 Bit @ 14000 MHz
Arc A380 compare 1024 @ 2 GHz96 Bit @ 15500 MHz
A310 compare 6 @ 2 GHz64 Bit @ 15500 MHz
A350M compare 6 @ 1.15 GHz64 Bit @ 14000 MHz
Pipelines8 - unified12 - unified
Core Speed1278 MHz900 - 1300 (Boost) MHz
Theoretical Performance2.6 TFLOPS FP32
Memory TypeLPDDR4X-4266GDDR6
Shared Memorynono
Power Consumption10 Watt65 Watt (65 - 95 Watt TGP)
technology5 nm6 nm
Date of Announcement10.11.2020 31.07.2023
CodenameAlchemist
ArchitectureXe HPG
TMUs96
ROPs48
Raytracing Cores12
CacheL2: 8 MB
Memory Speed14000 effective = 1750 MHz
Memory Bus Width128 Bit
Max. Amount of Memory8 GB
Memory Bandwidth224 GB/s
APIDirectX 12_2, Shader 6.6, OpenGL 4.6, OpenCL 3.0, Vulkan 1.3
PCIe4 16x
Displays4 Displays (max.), HDMI 2.0b, DisplayPort 2.0 10G Ready
Link to Manufacturer Pagewww.intel.com
CPU in M1 8-Core GPUGPU Base SpeedGPU Boost / Turbo
Apple M18 x 2064 MHz? MHz? MHz

Benchmarks

3DMark - 3DMark Ice Storm Unlimited Graphics
280200 Points (32%)
3DMark - 3DMark Sling Shot (ES 3.0) Unlimited
min: 7588     avg: 10635     median: 10635 (46%)     max: 13682 Points
3DMark - 3DMark Sling Shot (ES 3.0) Unlimited Graphics
min: 35978     avg: 39365     median: 39364.5 (87%)     max: 42751 Points
3DMark - 3DMark Sling Shot Extreme (ES 3.1) Unlimited
min: 8911     avg: 9606     median: 9605.5 (48%)     max: 10300 Points
3DMark - 3DMark Sling Shot Extreme (ES 3.1) Unlimited Graphics
25707 Points (77%)
3DMark - 3DMark Wild Life Extreme Unlimited
min: 4144     avg: 4696     median: 4821 (6%)     max: 4997 Points
Cinebench R15
Cinebench R15 OpenGL 64 Bit + Apple M1 8-Core GPU
Cinebench R15 - Cinebench R15 OpenGL 64 Bit
min: 88.1     avg: 89.1     median: 89.4 (5%)     max: 89.8 fps
Cinebench R15 OpenGL Ref. Match 64 Bit + Apple M1 8-Core GPU
Cinebench R15 - Cinebench R15 OpenGL Ref. Match 64 Bit
99.5 % (100%)
GFXBench - GFXBench 5.0 Aztec Ruins High Tier Offscreen
min: 60.9     avg: 74.3     median: 78.1 (14%)     max: 81.7 fps
GFXBench - GFXBench 5.0 Aztec Ruins Normal Tier Offscreen
min: 149     avg: 196.9     median: 206 (15%)     max: 216.1 fps
GFXBench - GFXBench Car Chase Offscreen
min: 150     avg: 167.4     median: 165.1 (19%)     max: 197 fps
GFXBench 3.1 - GFXBench Manhattan ES 3.1 Offscreen
min: 216     avg: 248.2     median: 248.7 (5%)     max: 275 fps
GFXBench 3.0 - GFXBench 3.0 Manhattan Offscreen
min: 317     avg: 358.5     median: 345 (20%)     max: 408 fps
GFXBench (DX / GLBenchmark) 2.7
GFXBench T-Rex HD Offscreen C24Z16 + Apple M1 8-Core GPU
GFXBench (DX / GLBenchmark) 2.7 - GFXBench T-Rex HD Offscreen C24Z16
min: 557     avg: 610     median: 588 (5%)     max: 670 fps
Antutu v9 - AnTuTu v9 GPU
min: 549301     avg: 598951     median: 598951 (75%)     max: 648601 Points
Power Consumption - Witcher 3 Power Consumption *
min: 19.6     avg: 39.4     median: 39.4 (9%)     max: 59.2 Watt
Power Consumption - GFXBench Aztec Ruins Normal Tier Offscreen Power Consumption 150cd *
min: 16     avg: 16.4     median: 16.5 (6%)     max: 16.6 Watt

Average Benchmarks Apple M1 8-Core GPU → 0% n=

- Range of benchmark values for this graphics card
- Average benchmark values for this graphics card
* Smaller numbers mean a higher performance
1 This benchmark is not used for the average calculation

Game Benchmarks

The following benchmarks stem from our benchmarks of review laptops. The performance depends on the used graphics memory, clock rate, processor, system settings, drivers, and operating systems. So the results don't have to be representative for all laptops with this GPU. For detailed information on the benchmark results, click on the fps number.

League of Legends: Wild Rift

League of Legends: Wild Rift

2020
ultra
100%
M1 8-Core GPU:
60  fps
Call of Duty Mobile

Call of Duty Mobile

2020
high
100%
M1 8-Core GPU:
59 60 ~ 60 fps
ultra
100%
M1 8-Core GPU:
59 60 60 ~ 60 fps
Genshin Impact

Genshin Impact

2020
ultra
100%
M1 8-Core GPU:
59 60 ~ 60 fps
Armajet

Armajet

2020
high
100%
M1 8-Core GPU:
59 60 ~ 60 fps
low 1280x720
100%
M1 8-Core GPU:
30.4 52.5 54 56.7 ~ 48 fps
med. 1920x1080
100%
M1 8-Core GPU:
20.3 30.7 32.5 33 ~ 29 fps
high 1920x1080
100%
M1 8-Core GPU:
19 20 20.5 ~ 20 fps
low 1280x720
100%
M1 8-Core GPU:
93.4 100 100 100.1 ~ 98 fps
med. 1920x1080
100%
M1 8-Core GPU:
32.2 33 33 42.3 ~ 35 fps
high 1920x1080
100%
M1 8-Core GPU:
20 20.3 20.6 25.5 ~ 22 fps
ultra 1920x1080
100%
M1 8-Core GPU:
15 15 ~ 15 fps
low 1280x720
100%
M1 8-Core GPU:
64 66 78 ~ 69 fps
med. 1920x1080
100%
M1 8-Core GPU:
25 27 45 ~ 32 fps
high 1920x1080
100%
M1 8-Core GPU:
23 25 43 ~ 30 fps
ultra 1920x1080
100%
M1 8-Core GPU:
38  fps
PUBG Mobile

PUBG Mobile

2018
low
100%
M1 8-Core GPU:
39  fps
high
100%
M1 8-Core GPU:
39 39.9 40 ~ 40 fps
ultra
100%
M1 8-Core GPU:
39 44 ~ 42 fps
World of Tanks Blitz

World of Tanks Blitz

2018
high
100%
M1 8-Core GPU:
59  fps
ultra 1920x1080
100%
M1 8-Core GPU:
39.6  fps

Average Gaming Apple M1 8-Core GPU → 100%

Average Gaming 30-70 fps → 100%

Apple M1 8-Core GPUlowmed.highultraQHD4K
League of Legends: Wild Rift60
Call of Duty Mobile6060
Genshin Impact60
Armajet60
Borderlands 3482920
Total War: Three Kingdoms98352215
Shadow of the Tomb Raider69323038
PUBG Mobile394042
World of Tanks Blitz59
Rise of the Tomb Raider39.6
< 30 fps
< 60 fps
< 120 fps
≥ 120 fps

2
2
1
2

2
3
2
1
3
3


For more games that might be playable and a list of all games and graphics cards visit our Gaming List

Add one or more devices and compare

In the following list you can select (and also search for) devices that should be added to the comparison. You can select more than one device.

restrict list:

show all (including archived), 2024, 2023
v1.28
log 05. 00:07:55

#0 checking url part for id 10552 +0s ... 0s

#1 checking url part for id 11612 +0s ... 0s

#2 redirected to Ajax server, took 1720130875 +0s ... 0s

#3 did not recreate cache, as it is less than 5 days old! Created at Thu, 04 Jul 2024 05:15:44 +0200 +0s ... 0s

#4 composed specs +0.051s ... 0.051s

#5 did output specs +0s ... 0.051s

#6 start showIntegratedCPUs +0s ... 0.051s

#7 getting avg benchmarks for device 10552 +0.018s ... 0.069s

#8 got single benchmarks 10552 +0.006s ... 0.076s

#9 getting avg benchmarks for device 11612 +0s ... 0.076s

#10 got single benchmarks 11612 +0.002s ... 0.078s

#11 got avg benchmarks for devices +0s ... 0.078s

#12 min, max, avg, median took s +0.008s ... 0.086s

#13 before gaming benchmark output +0s ... 0.086s

#14 Got 53 rows for game benchmarks. +0.005s ... 0.091s

#15 composed SQL query for gamebenchmarks +0s ... 0.091s

#16 got data and put it in $dataArray +0s ... 0.091s

#17 benchmarks composed for output. +0.003s ... 0.094s

#18 calculated avg scores. +0s ... 0.094s

#19 return log +0.002s ... 0.096s

Please share our article, every link counts!
> Expert Reviews and News on Laptops, Smartphones and Tech Innovations > Benchmarks / Tech > Graphics Card Comparison - Head 2 Head
Redaktion, 2017-09- 8 (Update: 2023-07- 1)