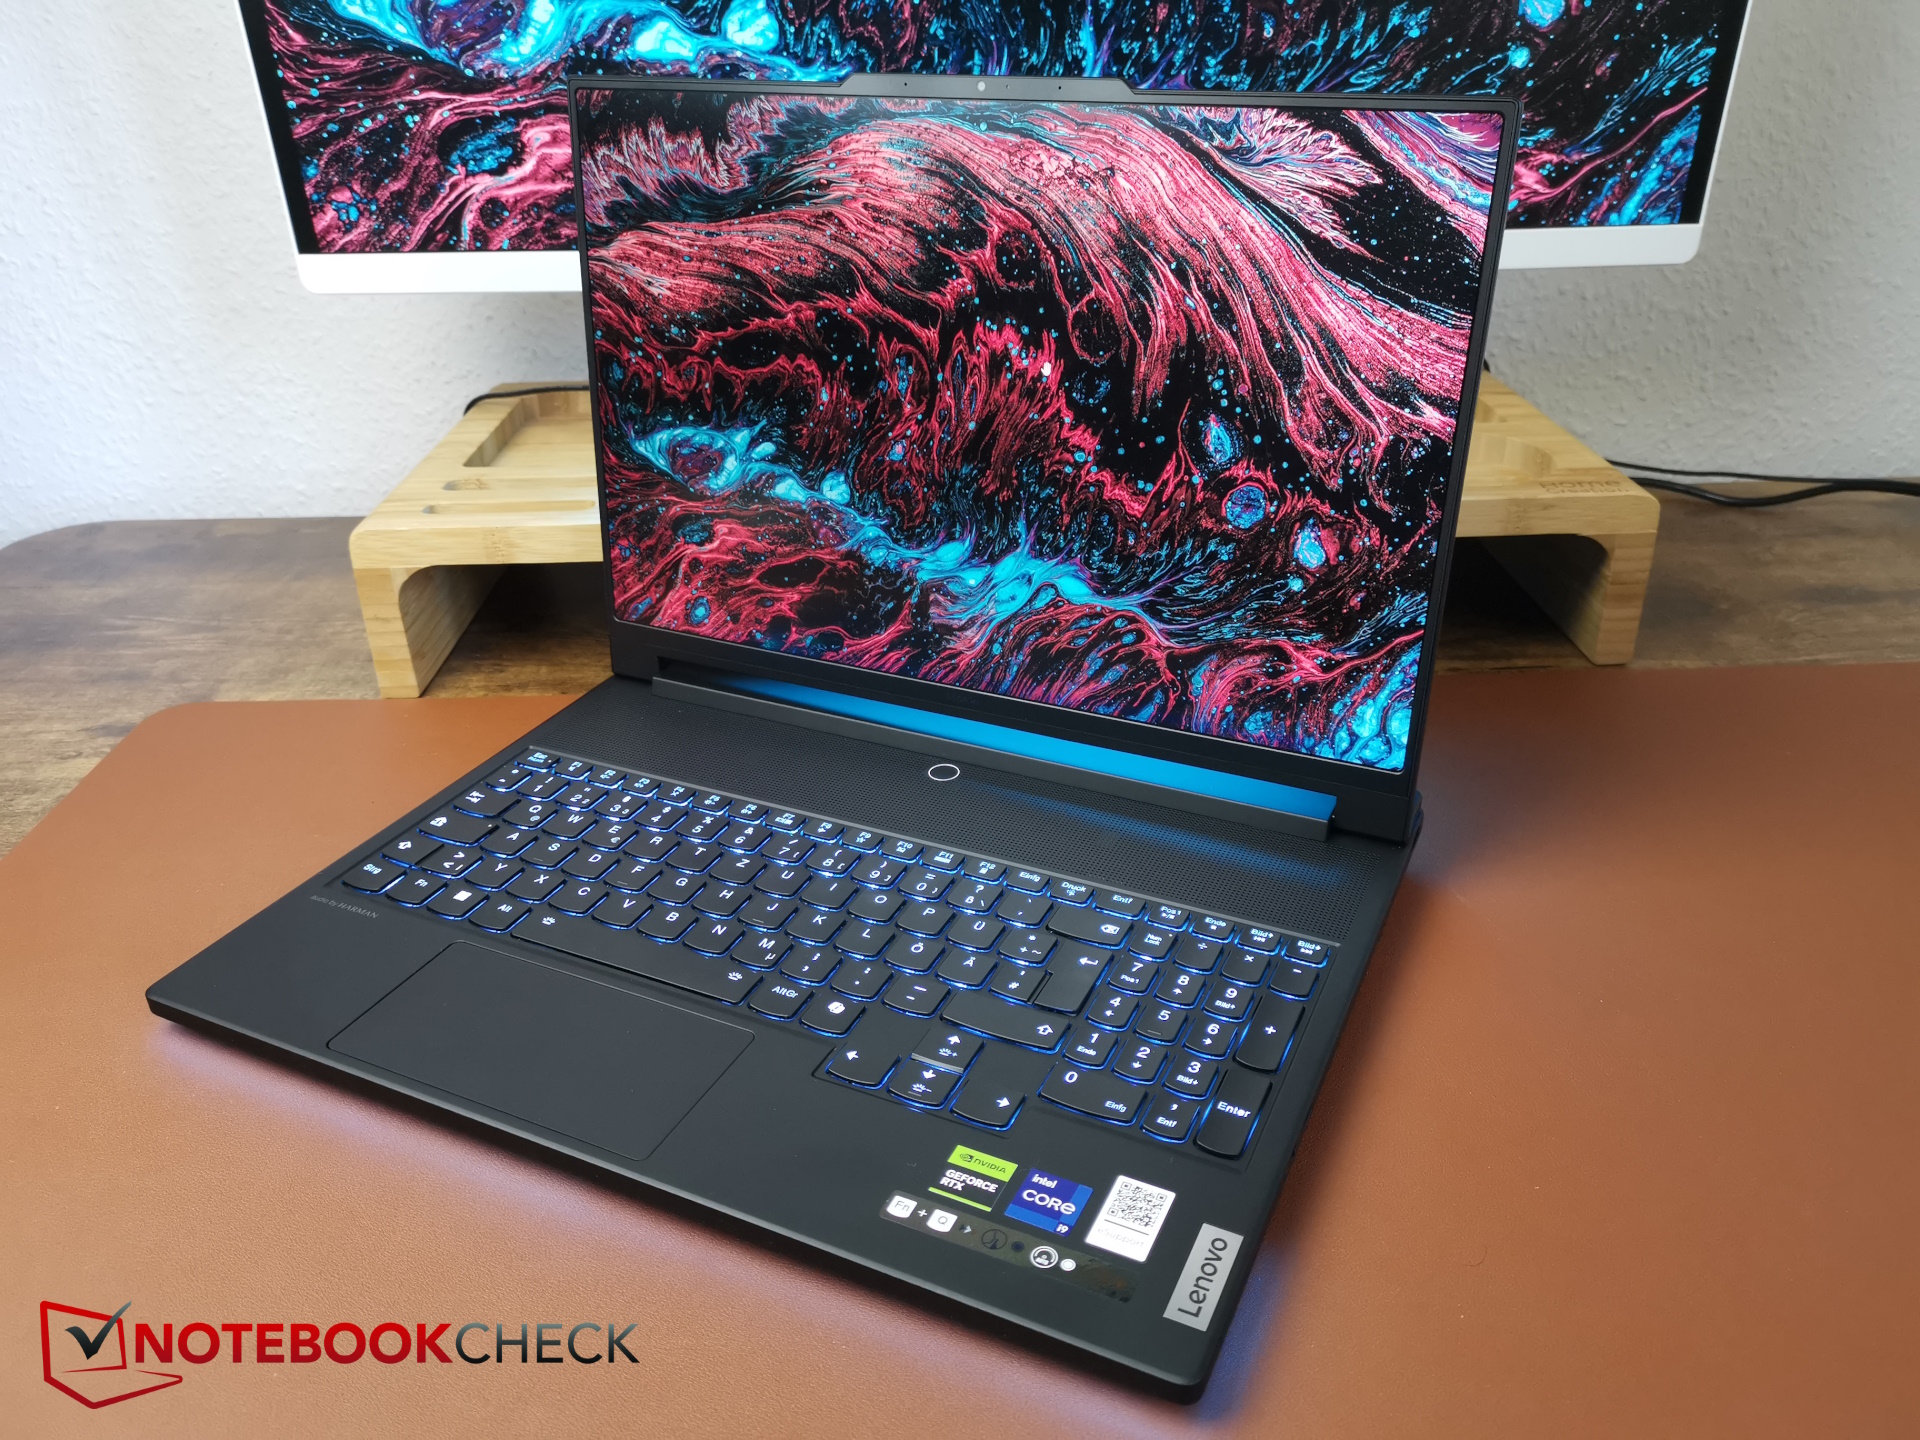
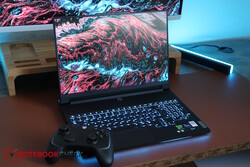
Lenovo Legion 9 16IRX9 (Legion 9i) review: How high-end is the RTX 4090 gamer?
Mean machine.
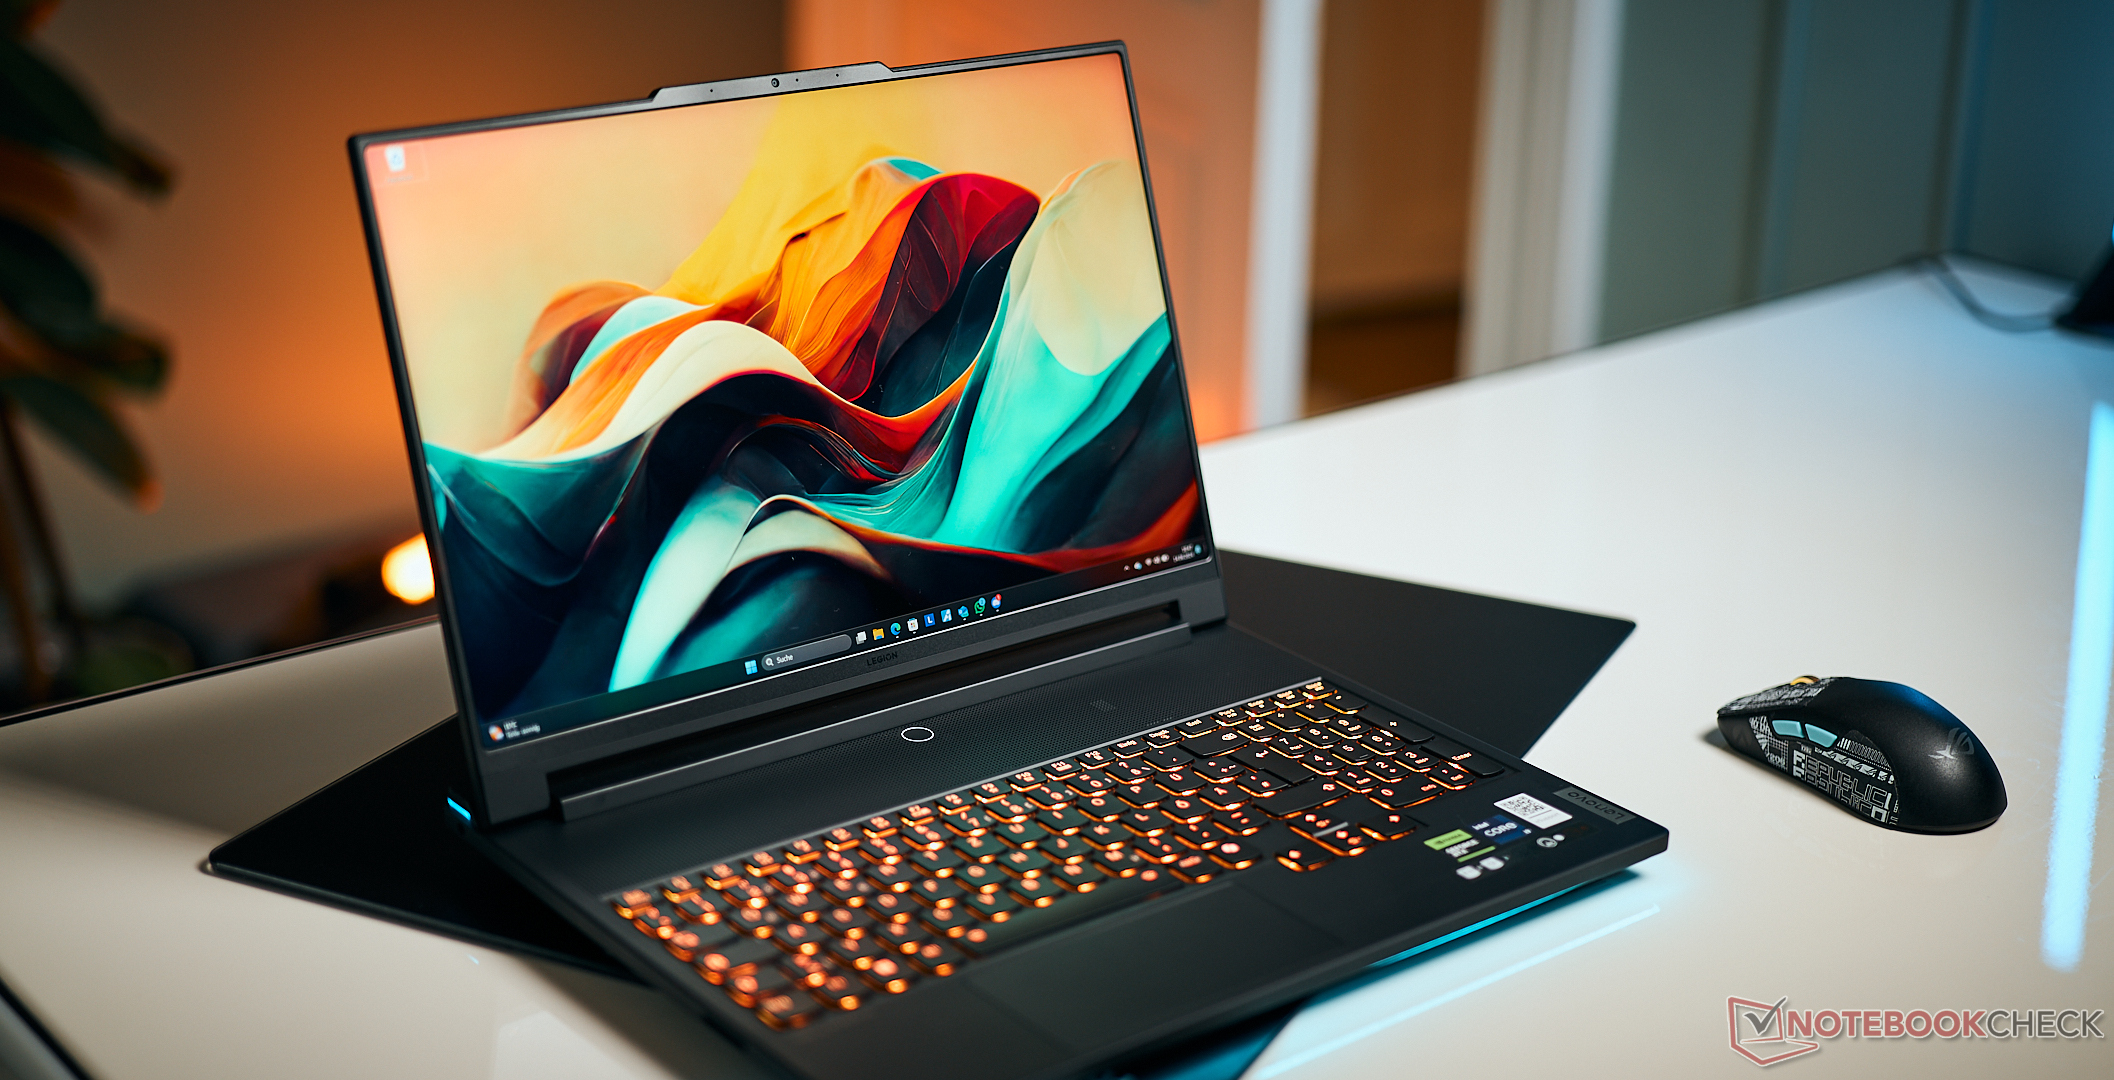
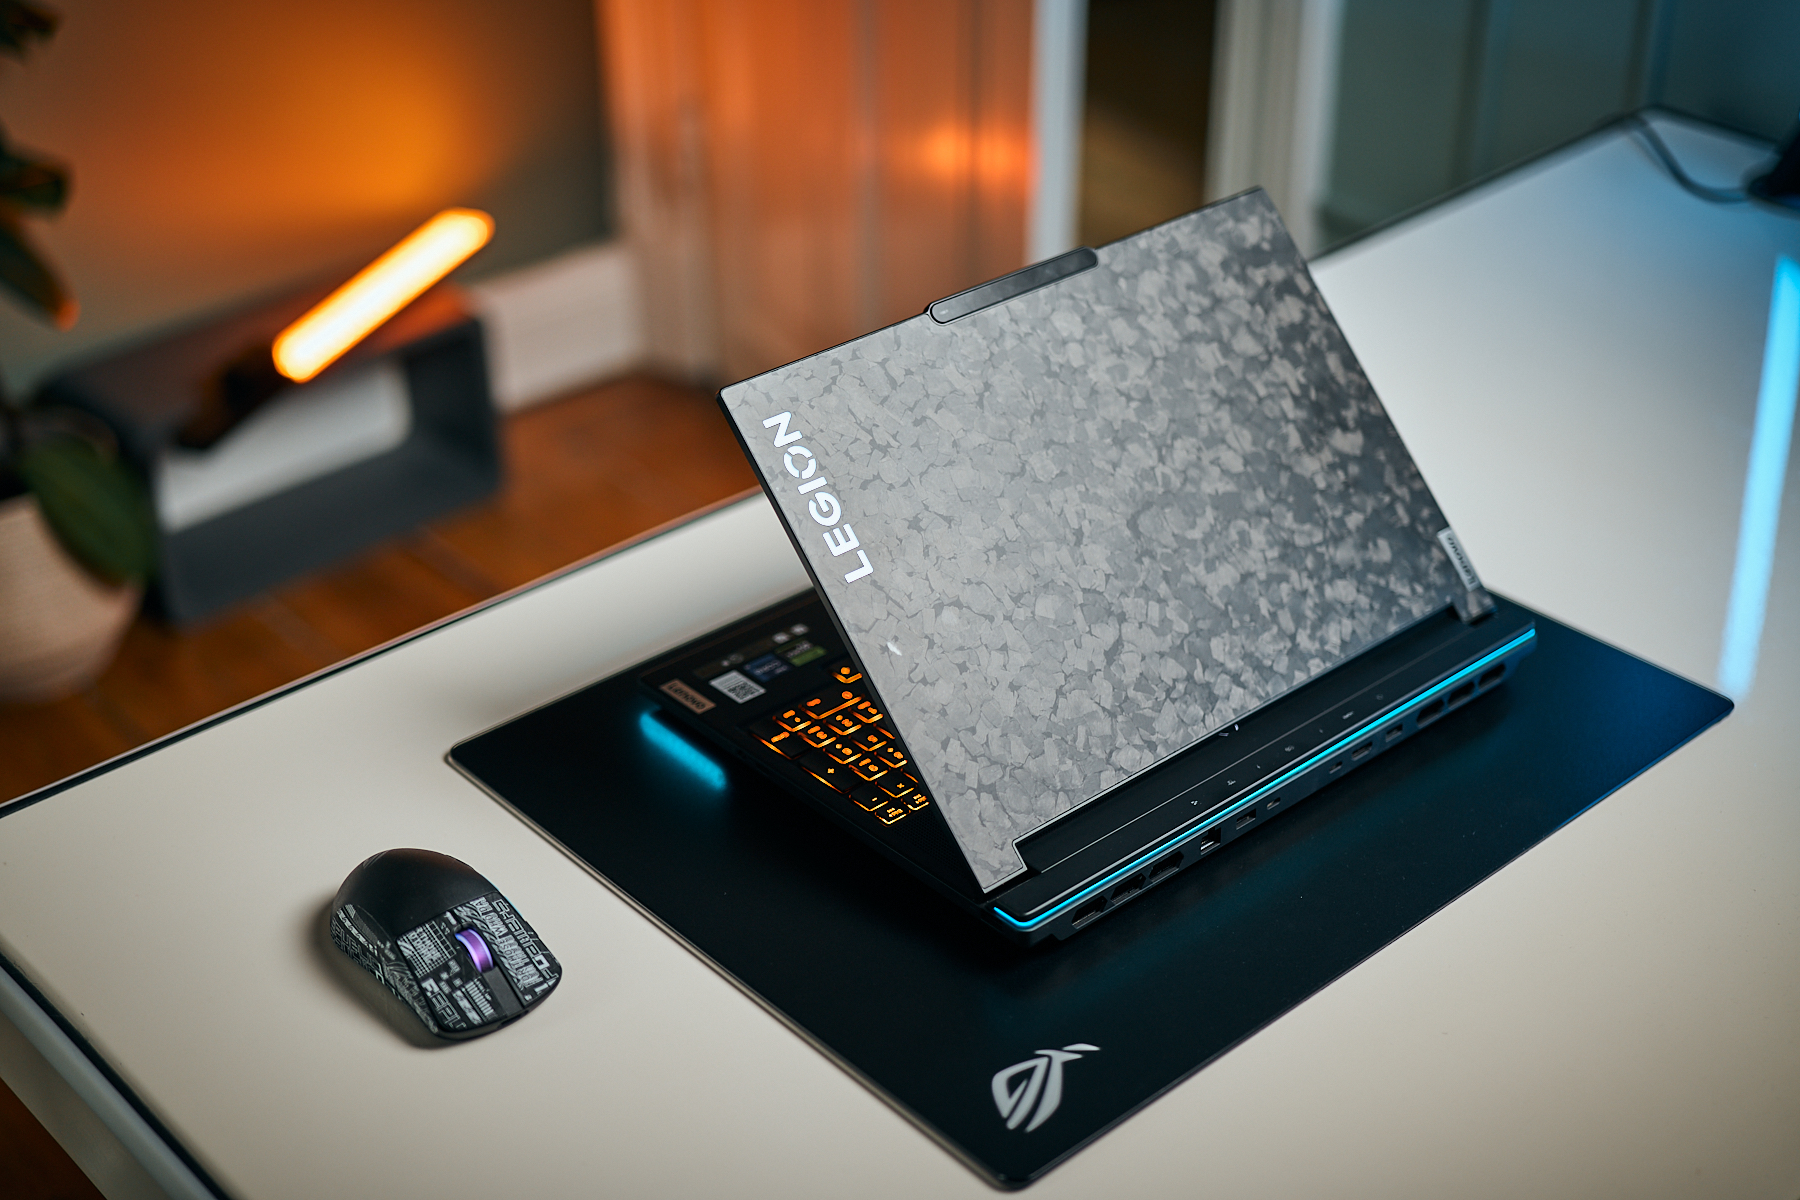
"Forged carbon", "reinforced with 90 % recycled magnesium", plus an update to Intel's Gen14 CPUs including AI functions. This, together with the RTX 4090, is included in the 3,800-dollar luxury gamer. Our test will reveal whether the new processor really makes the Legion 9 better or whether you can save a bit by buying last year's model. Update: A BIOS update has arrived that fixes the frame rate issues.Christian Hintze, 👁 Christian Hintze (translated by Daisy Dickson) Published 🇩🇪 🇷🇺 ...
Last year, we called the Legion 9i "Lenovo's most ambitious gaming laptop to date". The next generation may not be any less ambitious, however, the changes actually made to the high-end gamer are severely limited. Only its CPU has been swapped out for the latest 14th Intel generation, which also makes the laptop more AI-capable.
As 16-inch laptops aren't often kitted out with the RTX 4090, we will be comparing it to its predecessor, the Razer Blade 16 (2024) as well as 18-inch gamers such as the Alienware m18 R2 and the Asus ROG Strix Scar 18 (2024), and the 17-inch Medion Erazer Beast X40 (2024).
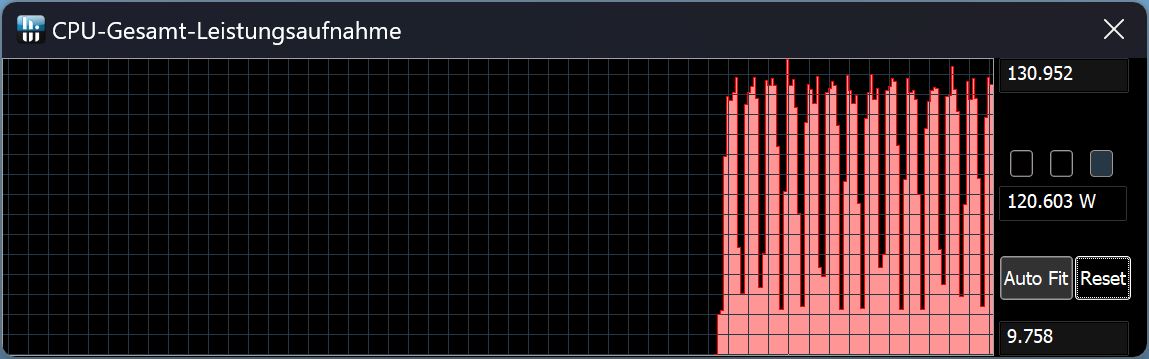
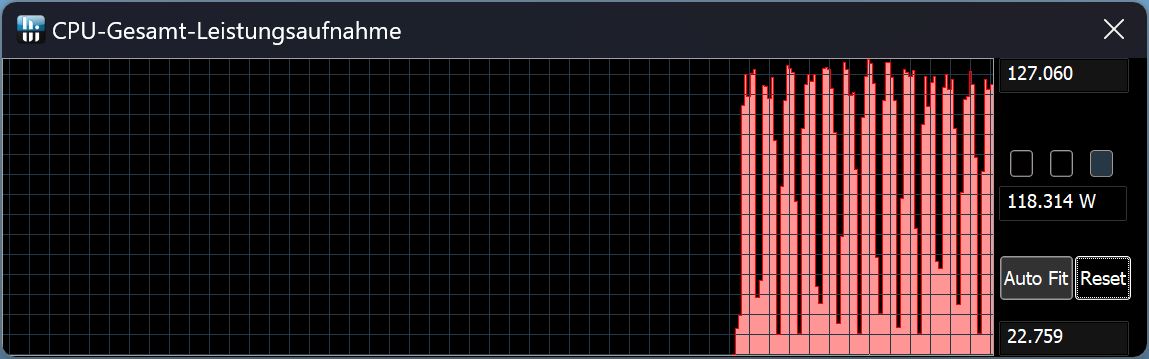
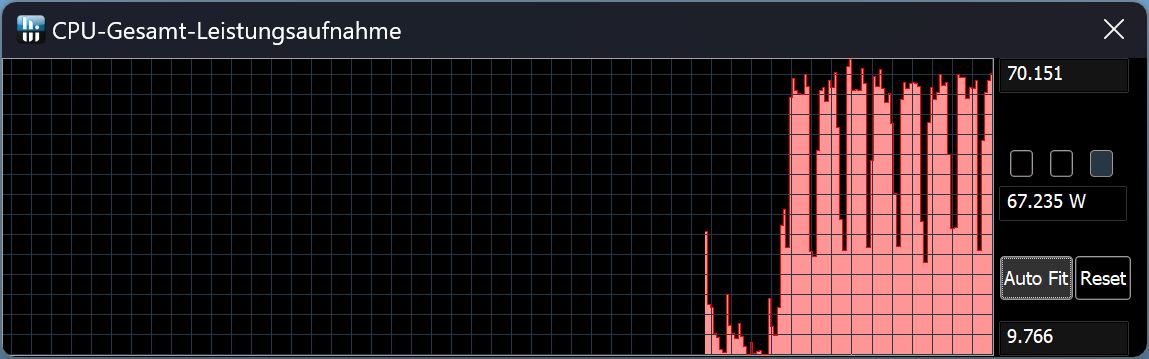
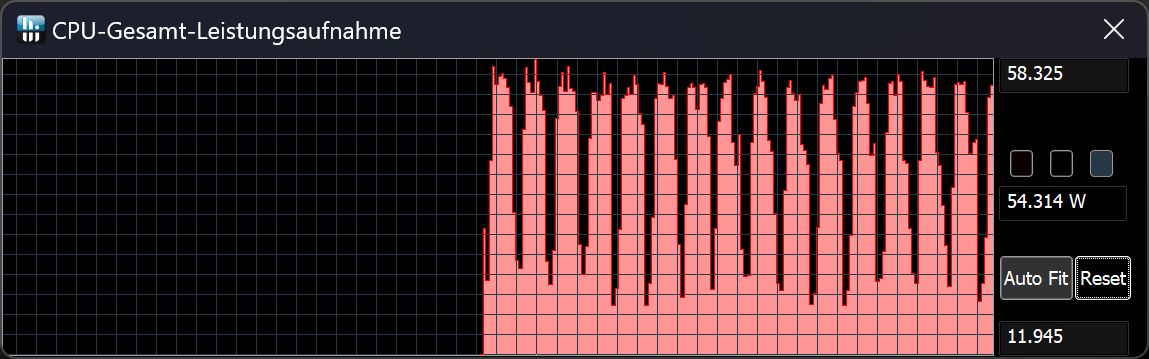
September 26, 2024 update: Due to the issues mentioned in this review (frame rate drops, low CPU single-core performance scores), we got in touch with the manufacturer (via its agency). A couple of months later, Lenovo reacted by making a new BIOS version for the laptop available for download that appears to solve the issue of unstable frame rates. Please see the images below for further information. No edits to the review's original contents have been made.


Possible competitors compared
Rating | Version | Date | Model | Weight | Height | Size | Resolution | Price |
|---|---|---|---|---|---|---|---|---|
| 83.9 % | v8 | 06 / 2024 | Lenovo Legion 9 16IRX9, RTX 4090 i9-14900HX, GeForce RTX 4090 Laptop GPU | 2.5 kg | 22.7 mm | 16.00" | 3200x2000 | |
| 90.2 % v7 (old) | v7 (old) | 10 / 2023 | Lenovo Legion 9 16IRX8 i9-13980HX, GeForce RTX 4090 Laptop GPU | 2.6 kg | 22.7 mm | 16.00" | 3200x2000 | |
| 91.1 % v7 (old) | v7 (old) | 02 / 2024 | Razer Blade 16 2024, RTX 4090 i9-14900HX, GeForce RTX 4090 Laptop GPU | 2.5 kg | 22 mm | 16.00" | 2560x1600 | |
| 89.5 % v7 (old) | v7 (old) | 03 / 2024 | Alienware m18 R2 i9-14900HX, GeForce RTX 4090 Laptop GPU | 4 kg | 26.7 mm | 18.00" | 2560x1600 | |
| 88.3 % v7 (old) | v7 (old) | 02 / 2024 | Asus ROG Strix Scar 18 G834JYR (2024) i9-14900HX, GeForce RTX 4090 Laptop GPU | 3.1 kg | 30.8 mm | 18.00" | 2560x1600 | |
| 89.2 % v7 (old) | v7 (old) | 02 / 2024 | Medion Erazer Beast X40 2024 i9-14900HX, GeForce RTX 4090 Laptop GPU | 2.9 kg | 36 mm | 17.00" | 2560x1600 |
Note: We have recently updated our rating system and the results of version 8 are not comparable with the results of version 7. More information is available here .
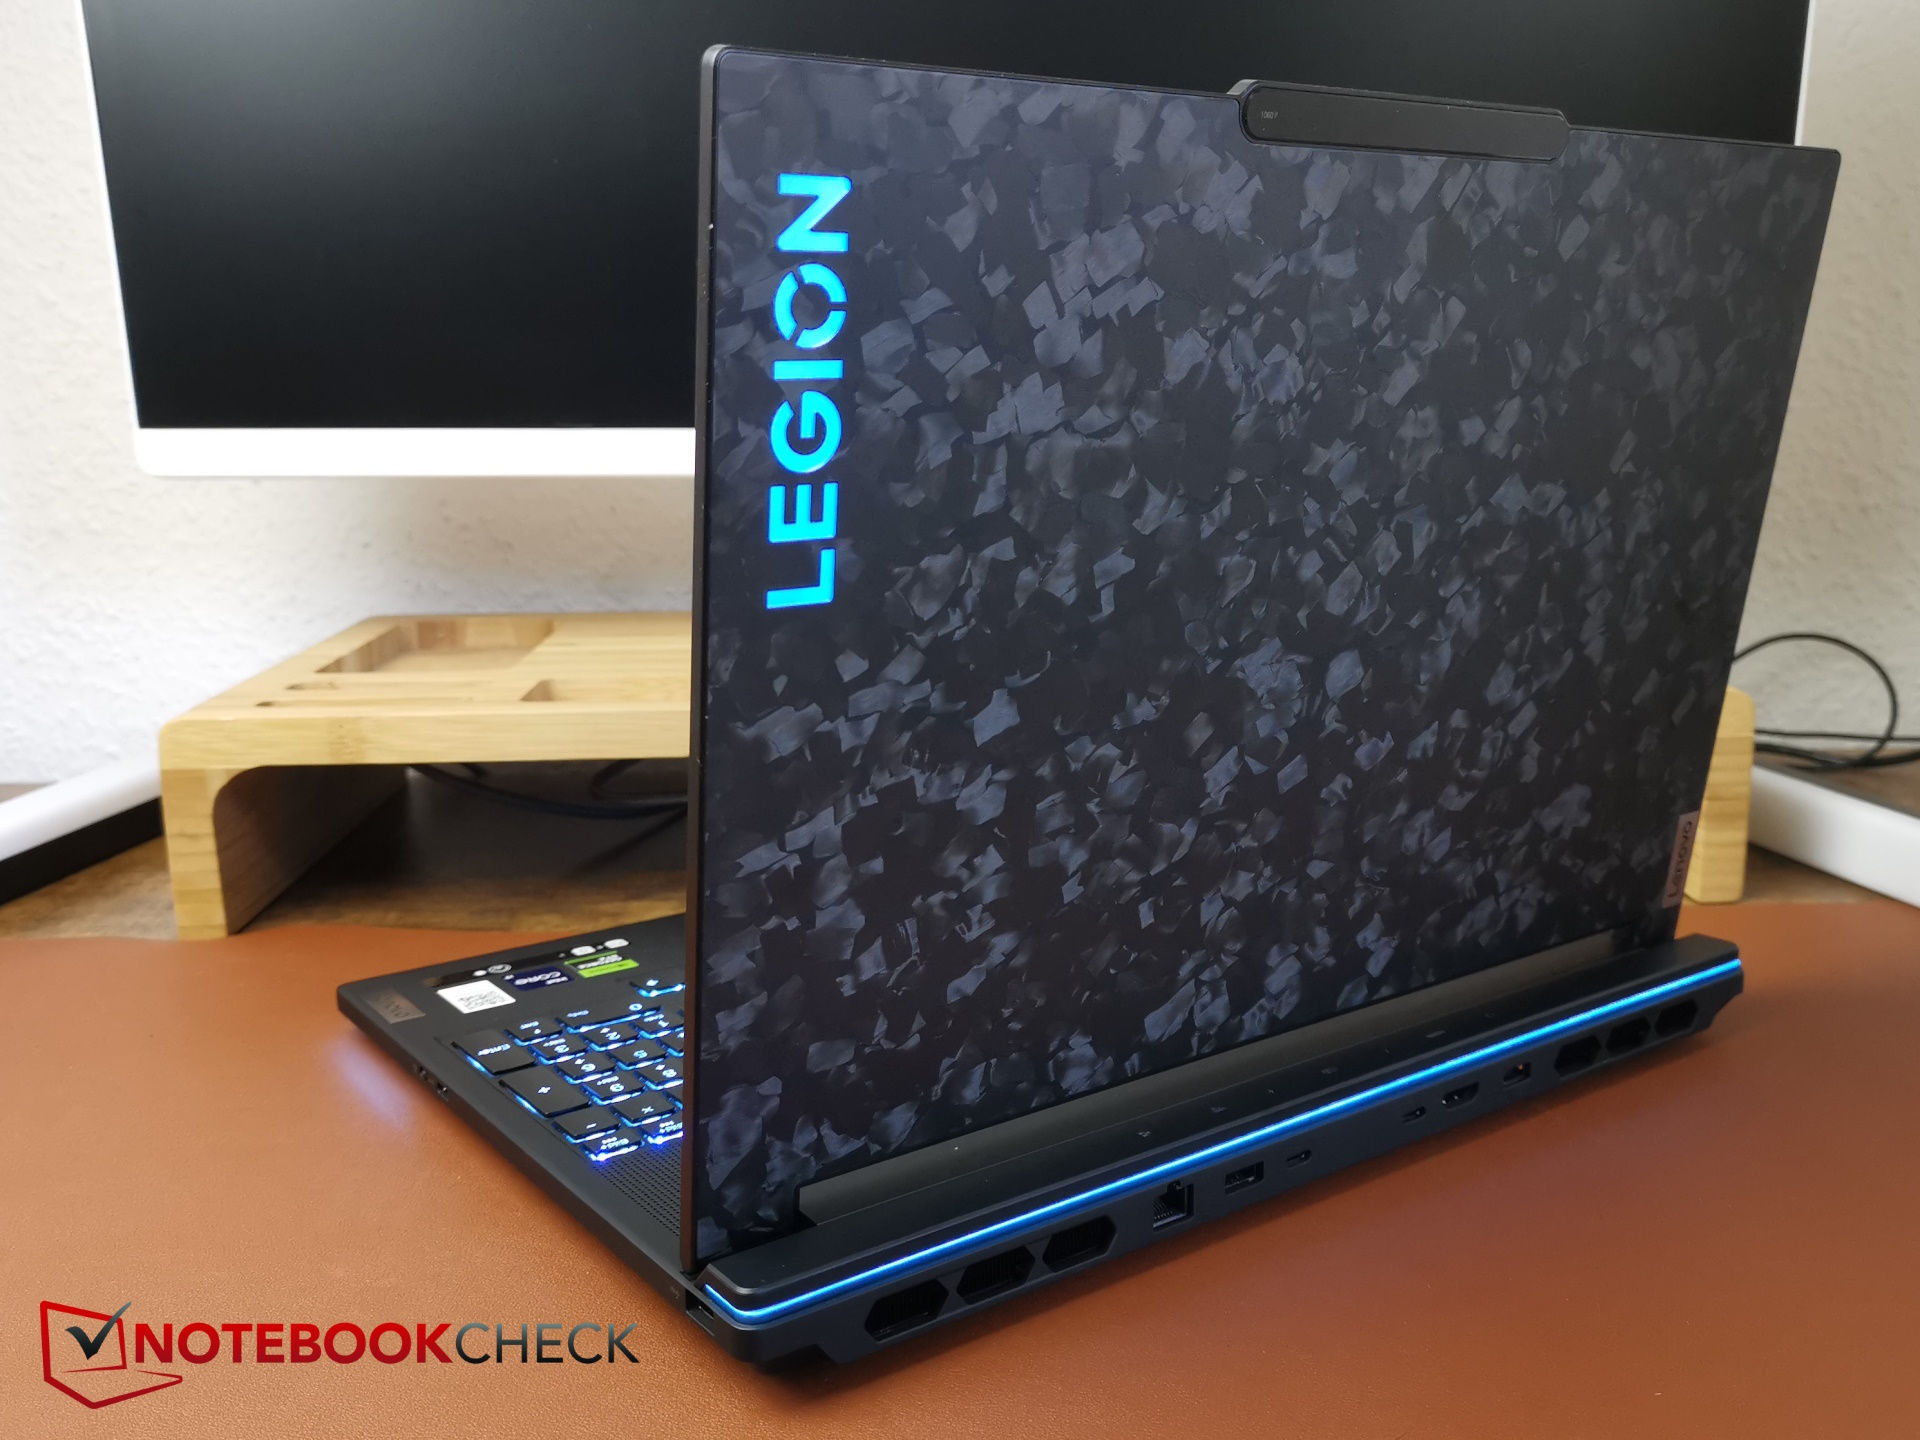
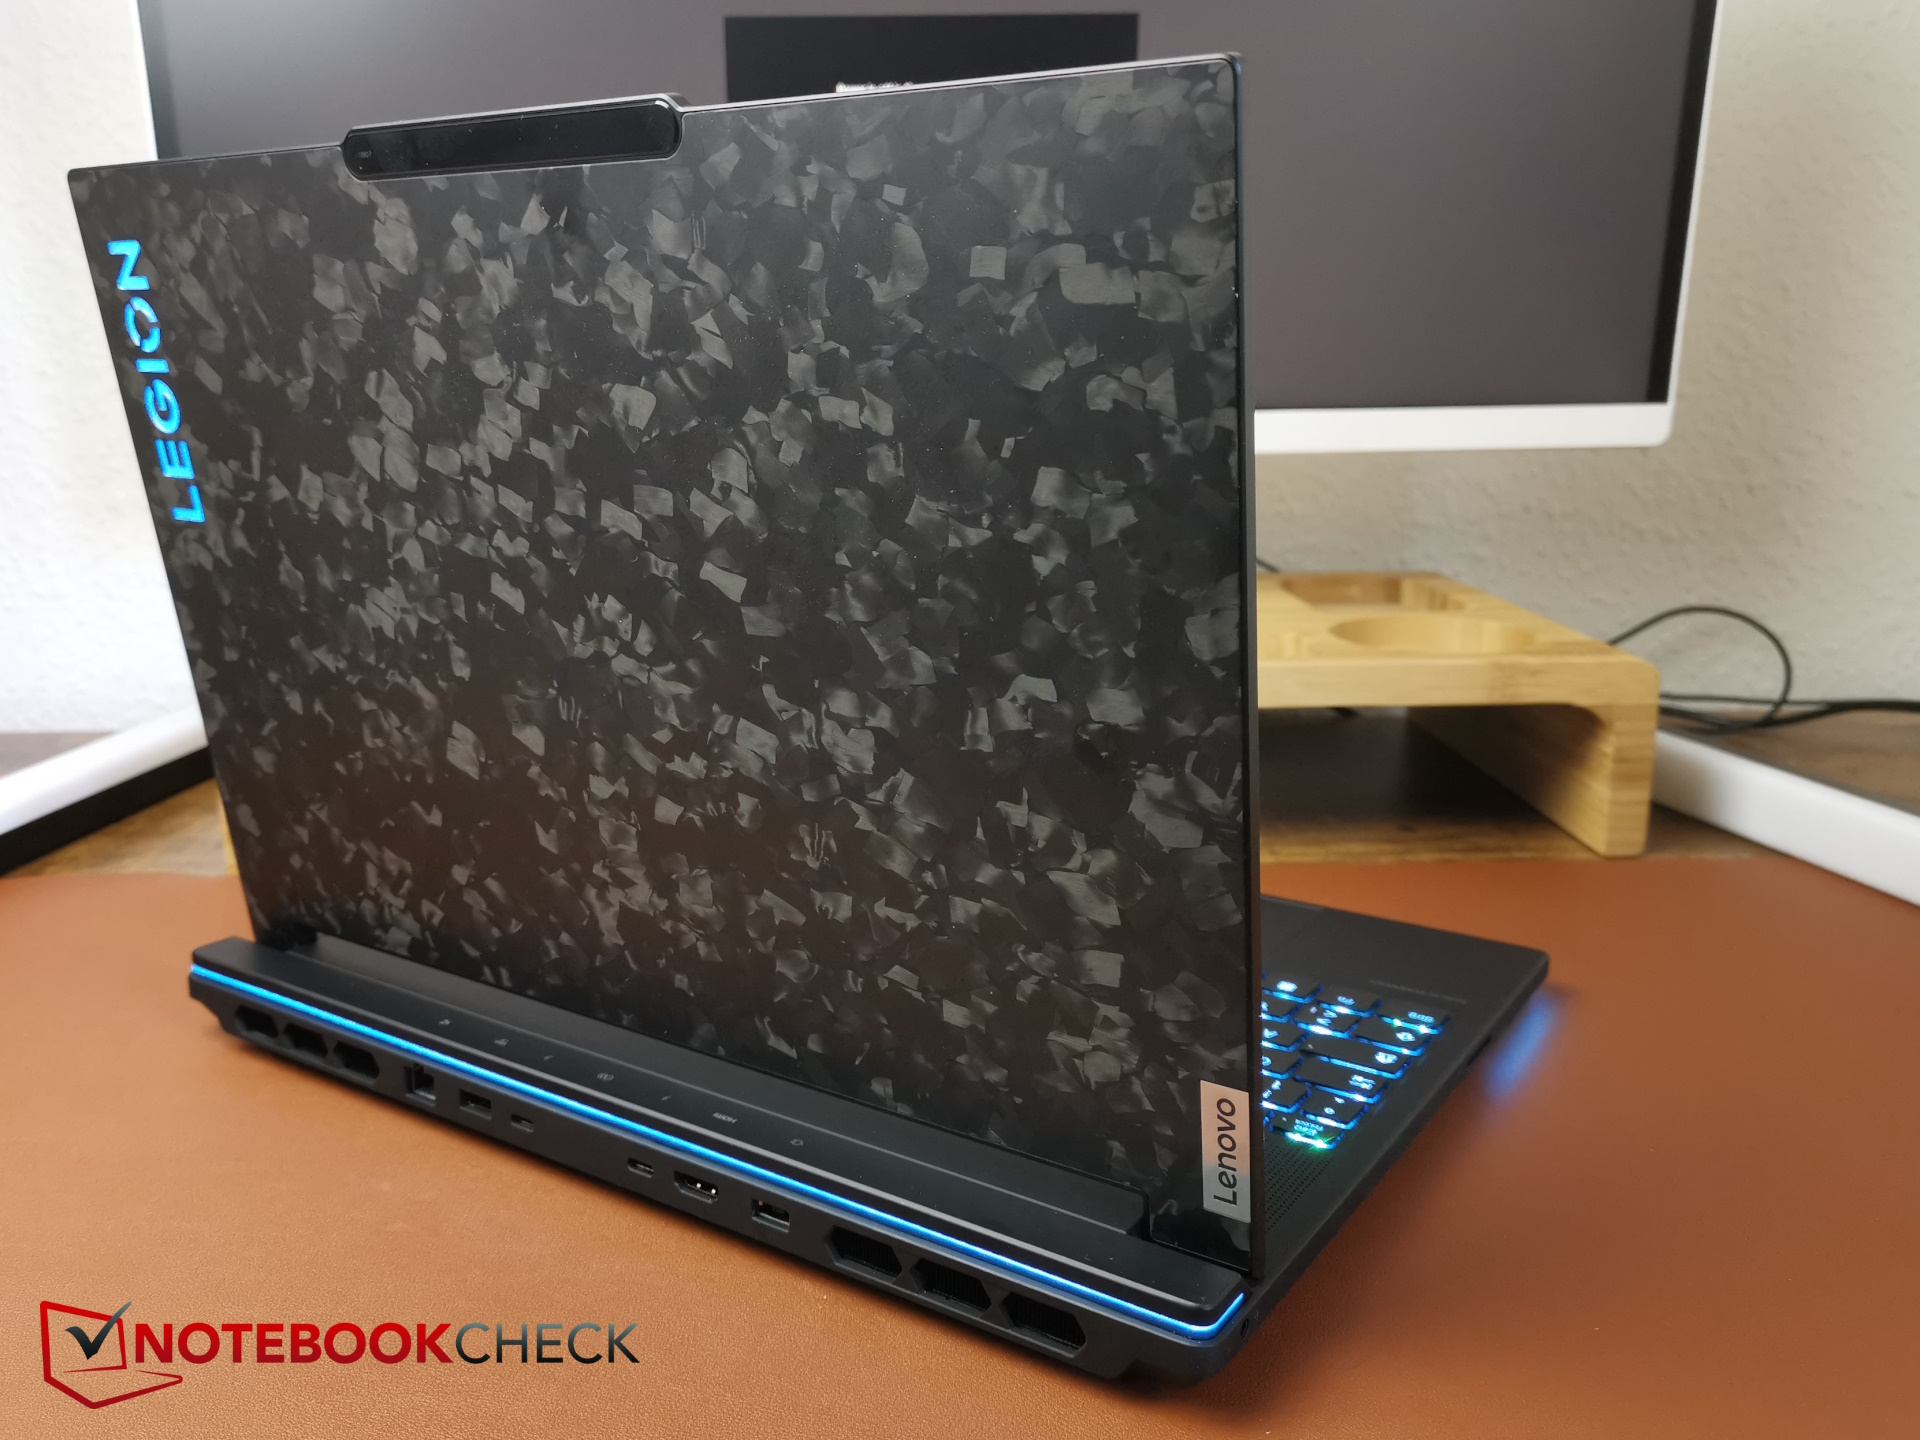
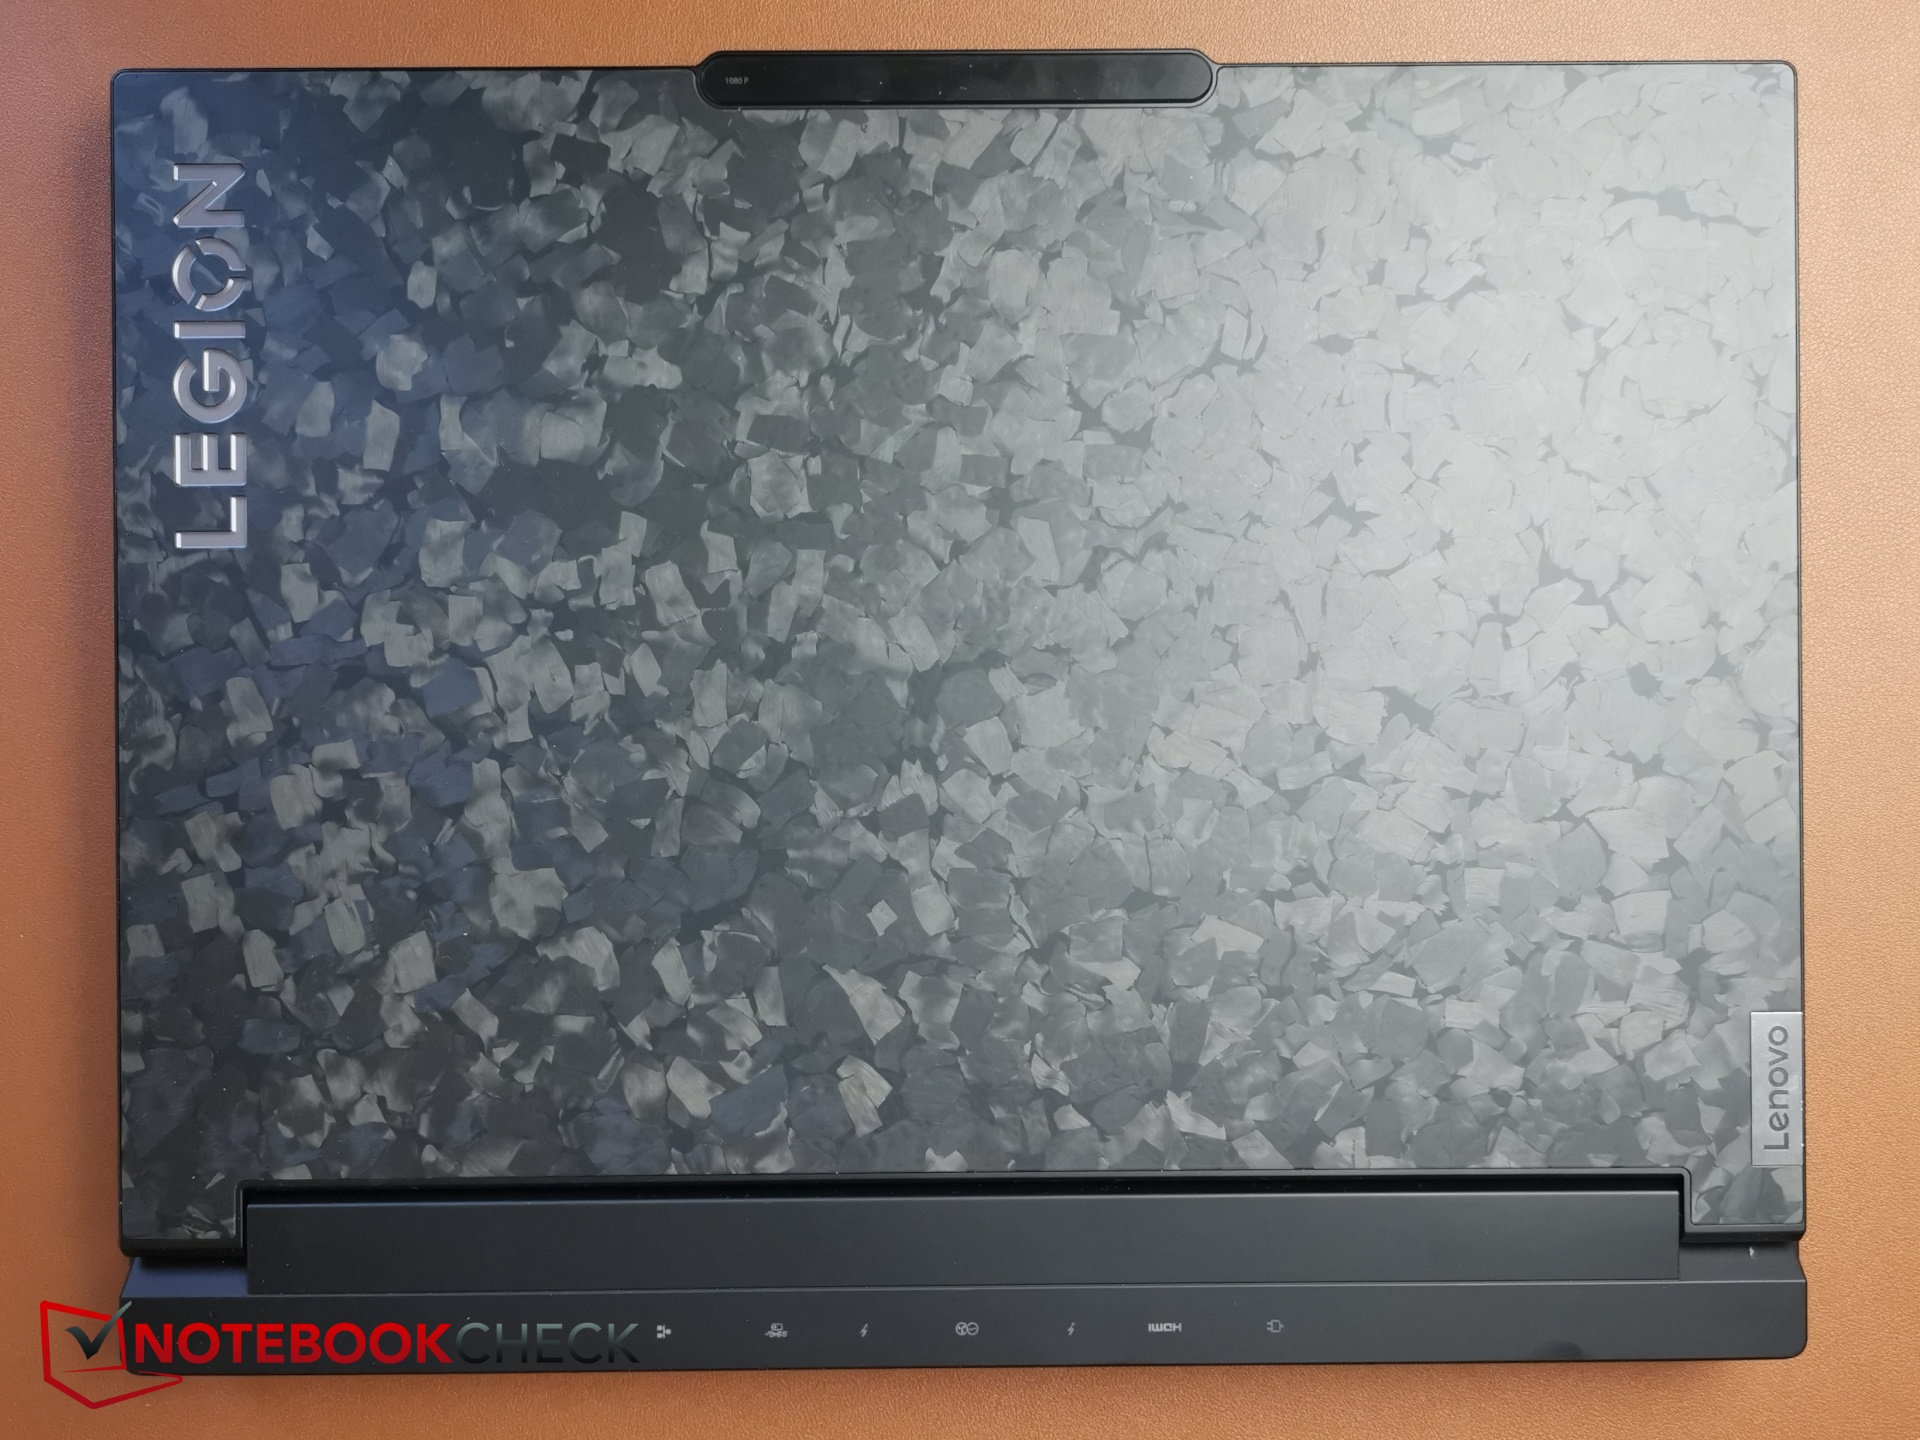
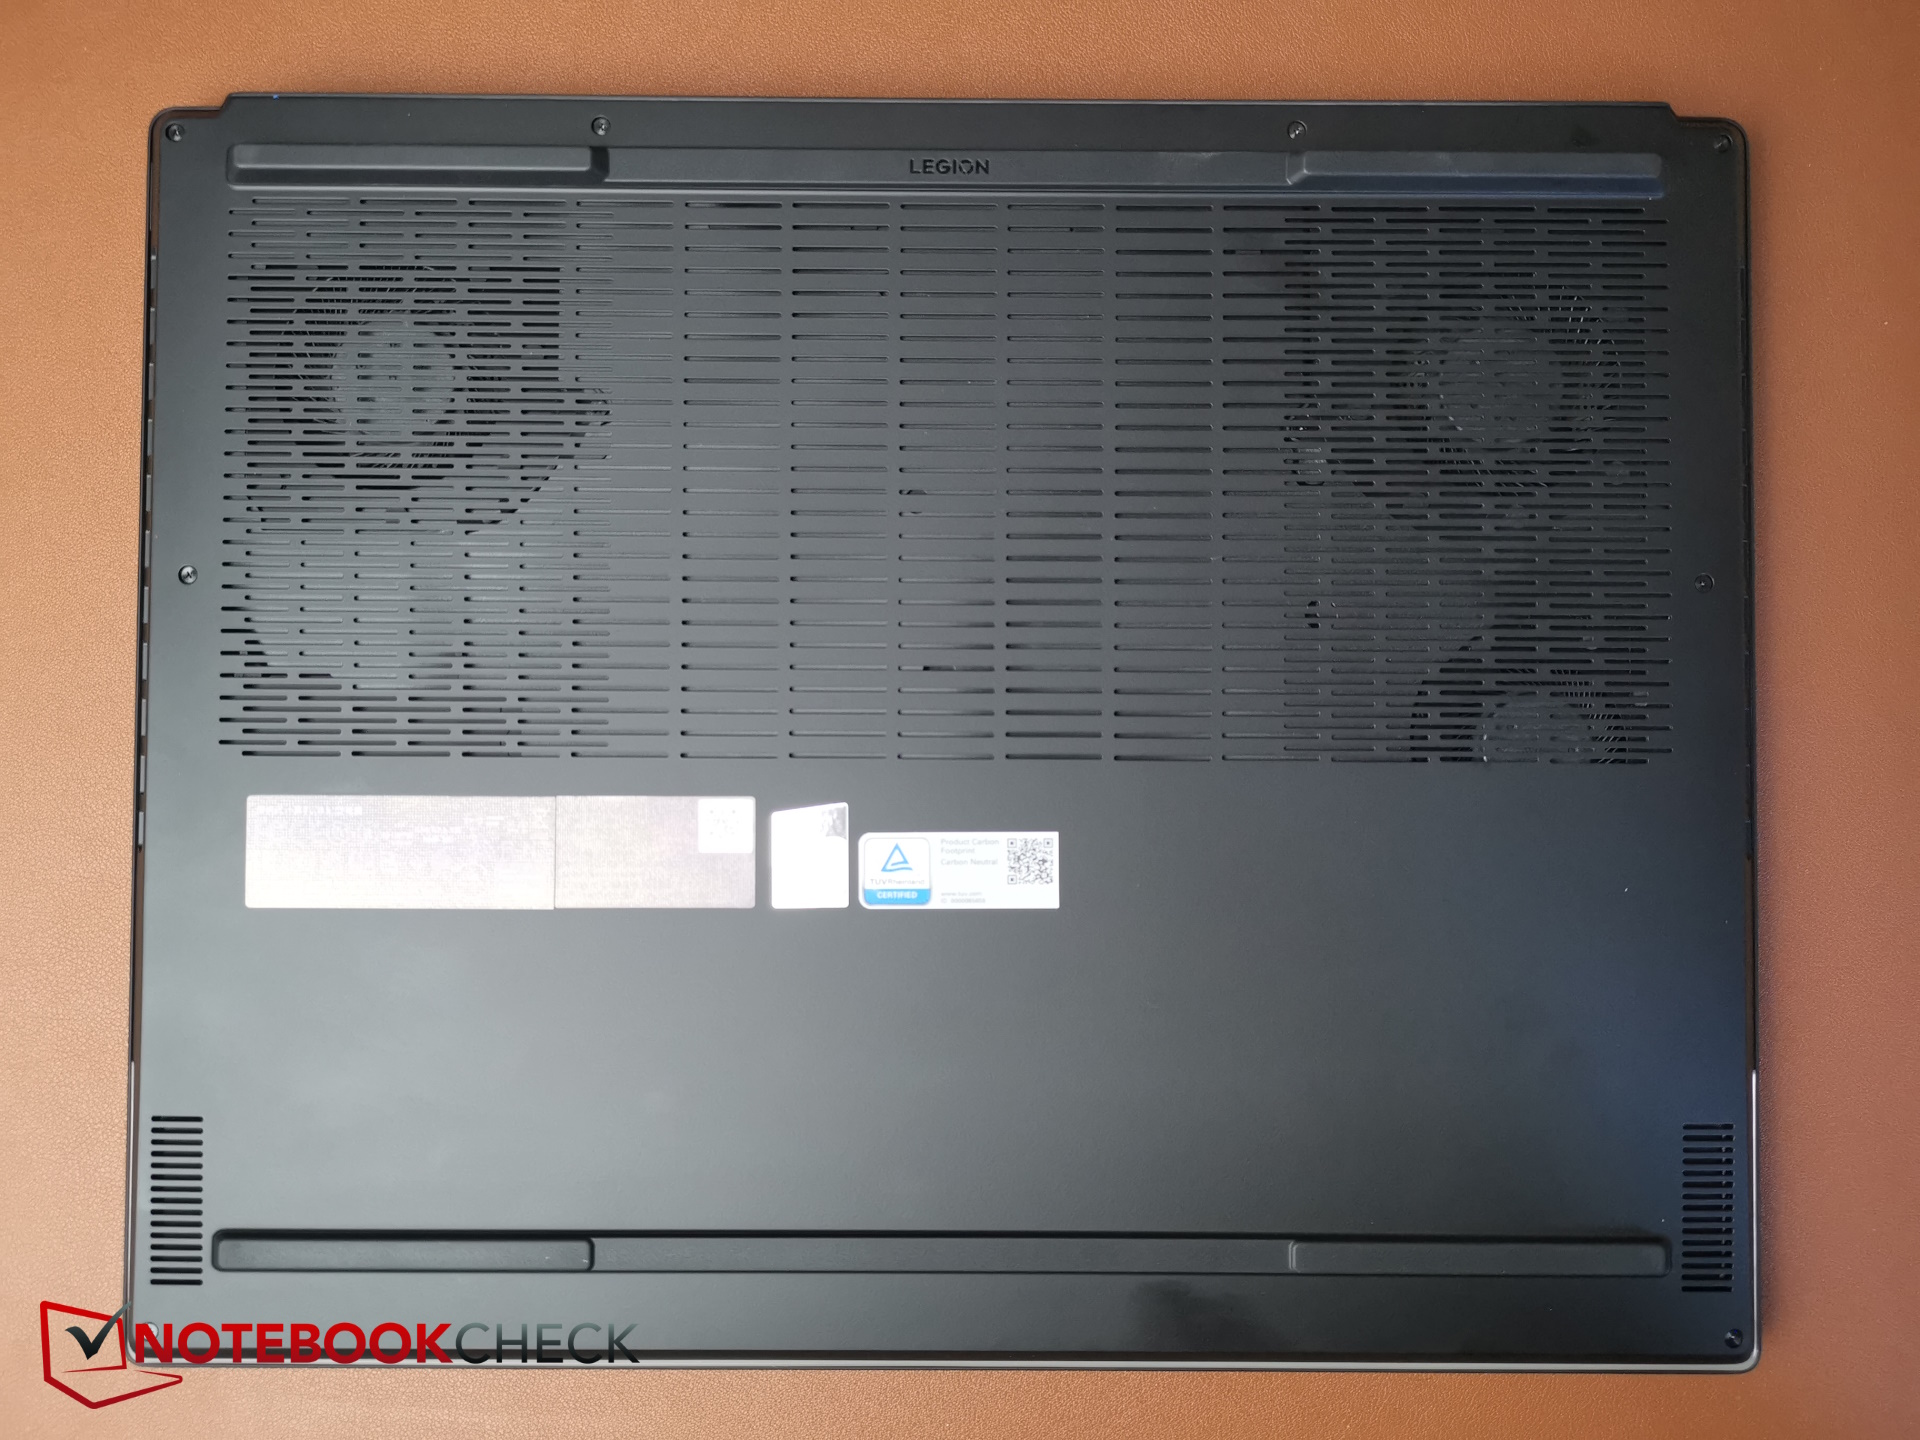
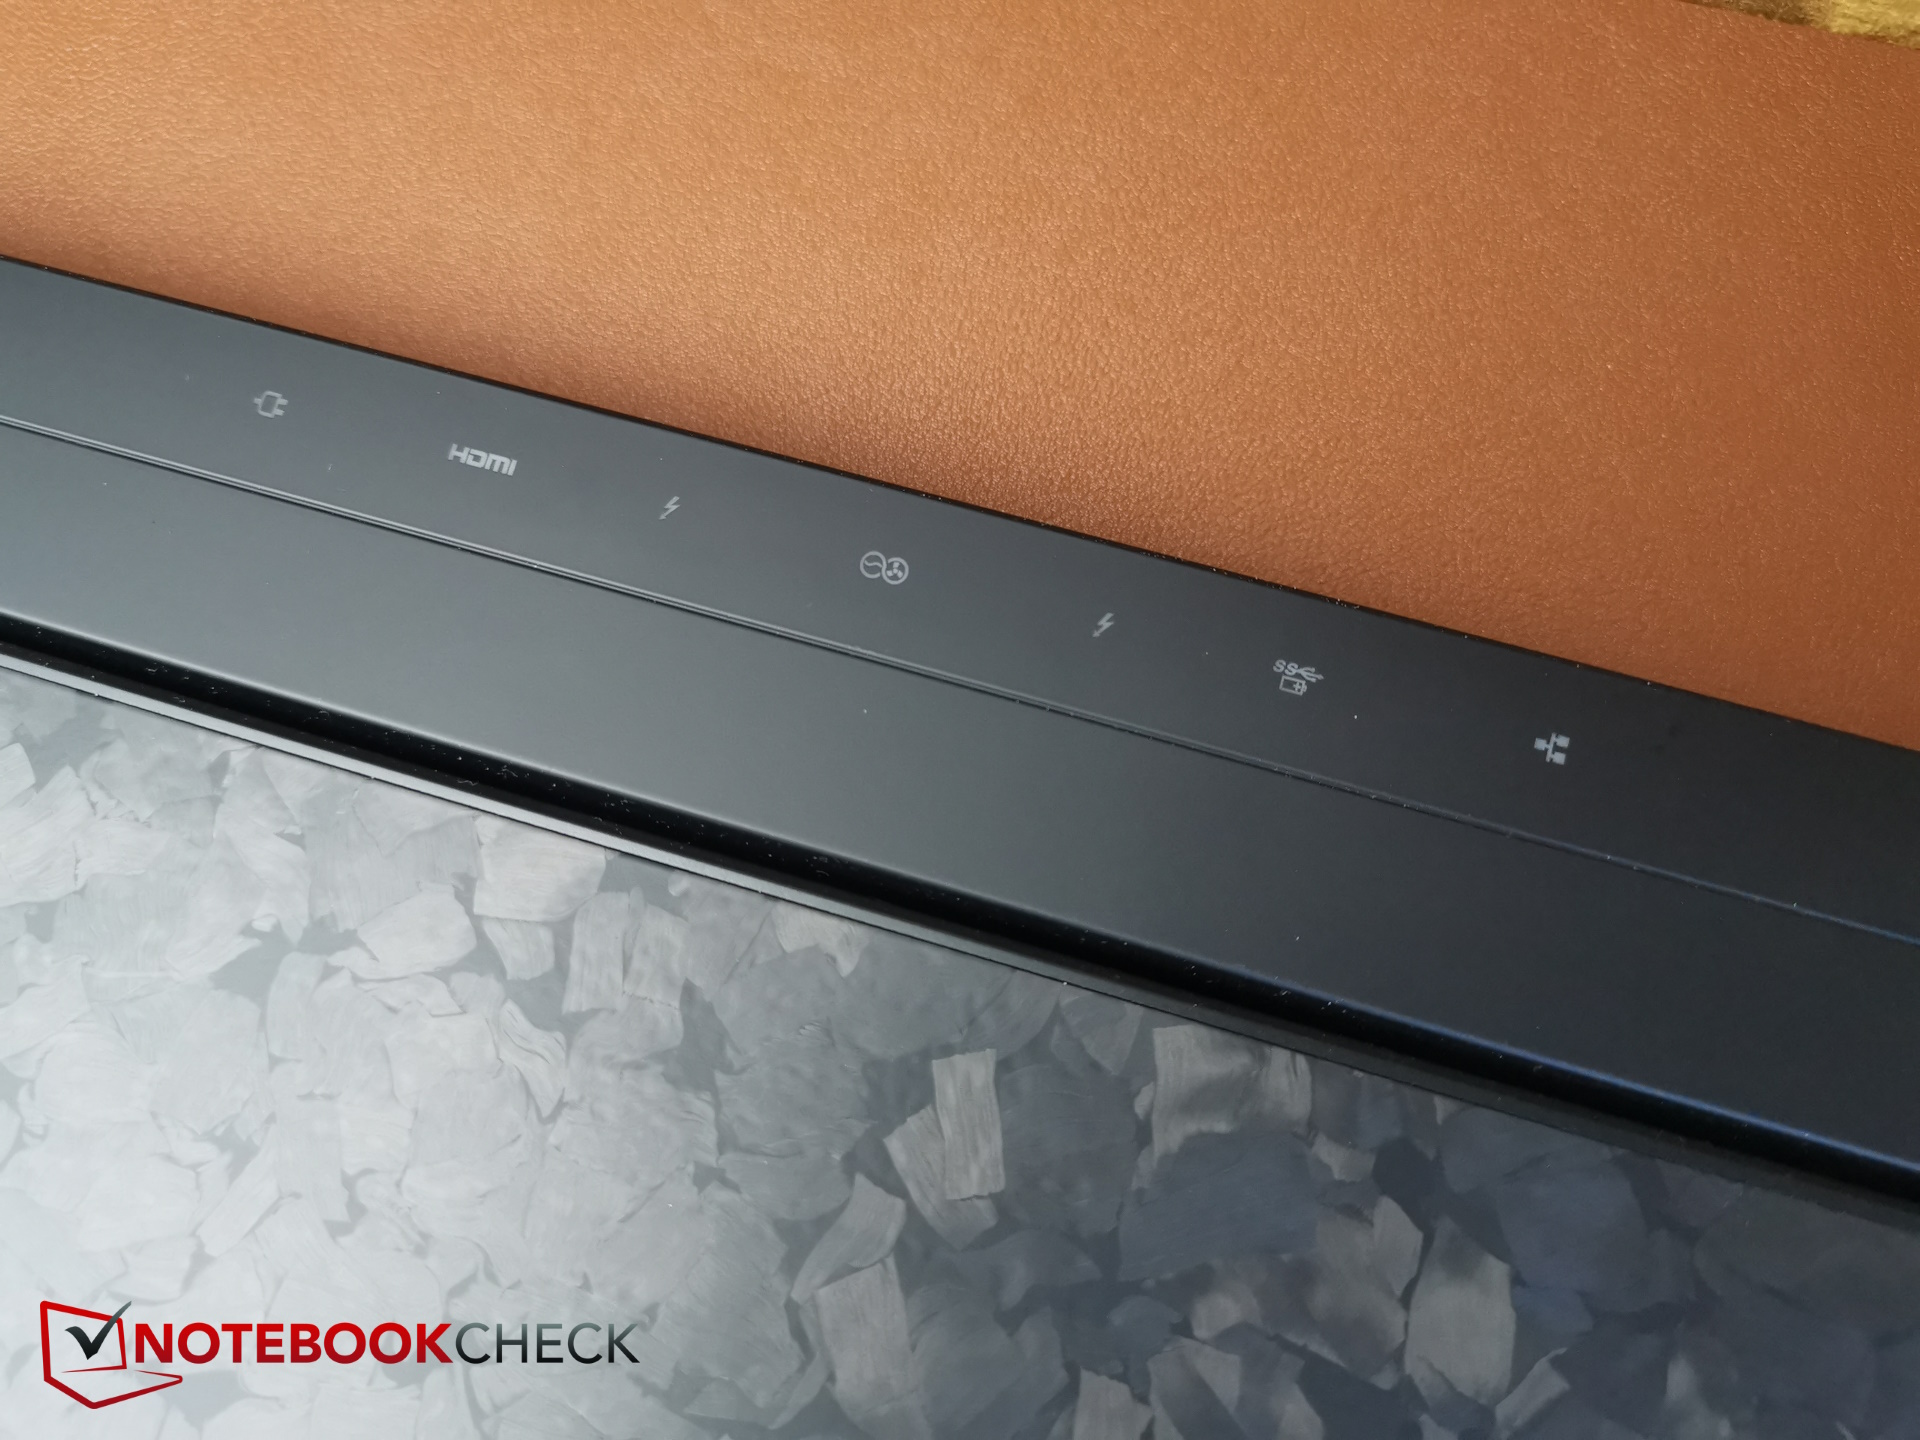
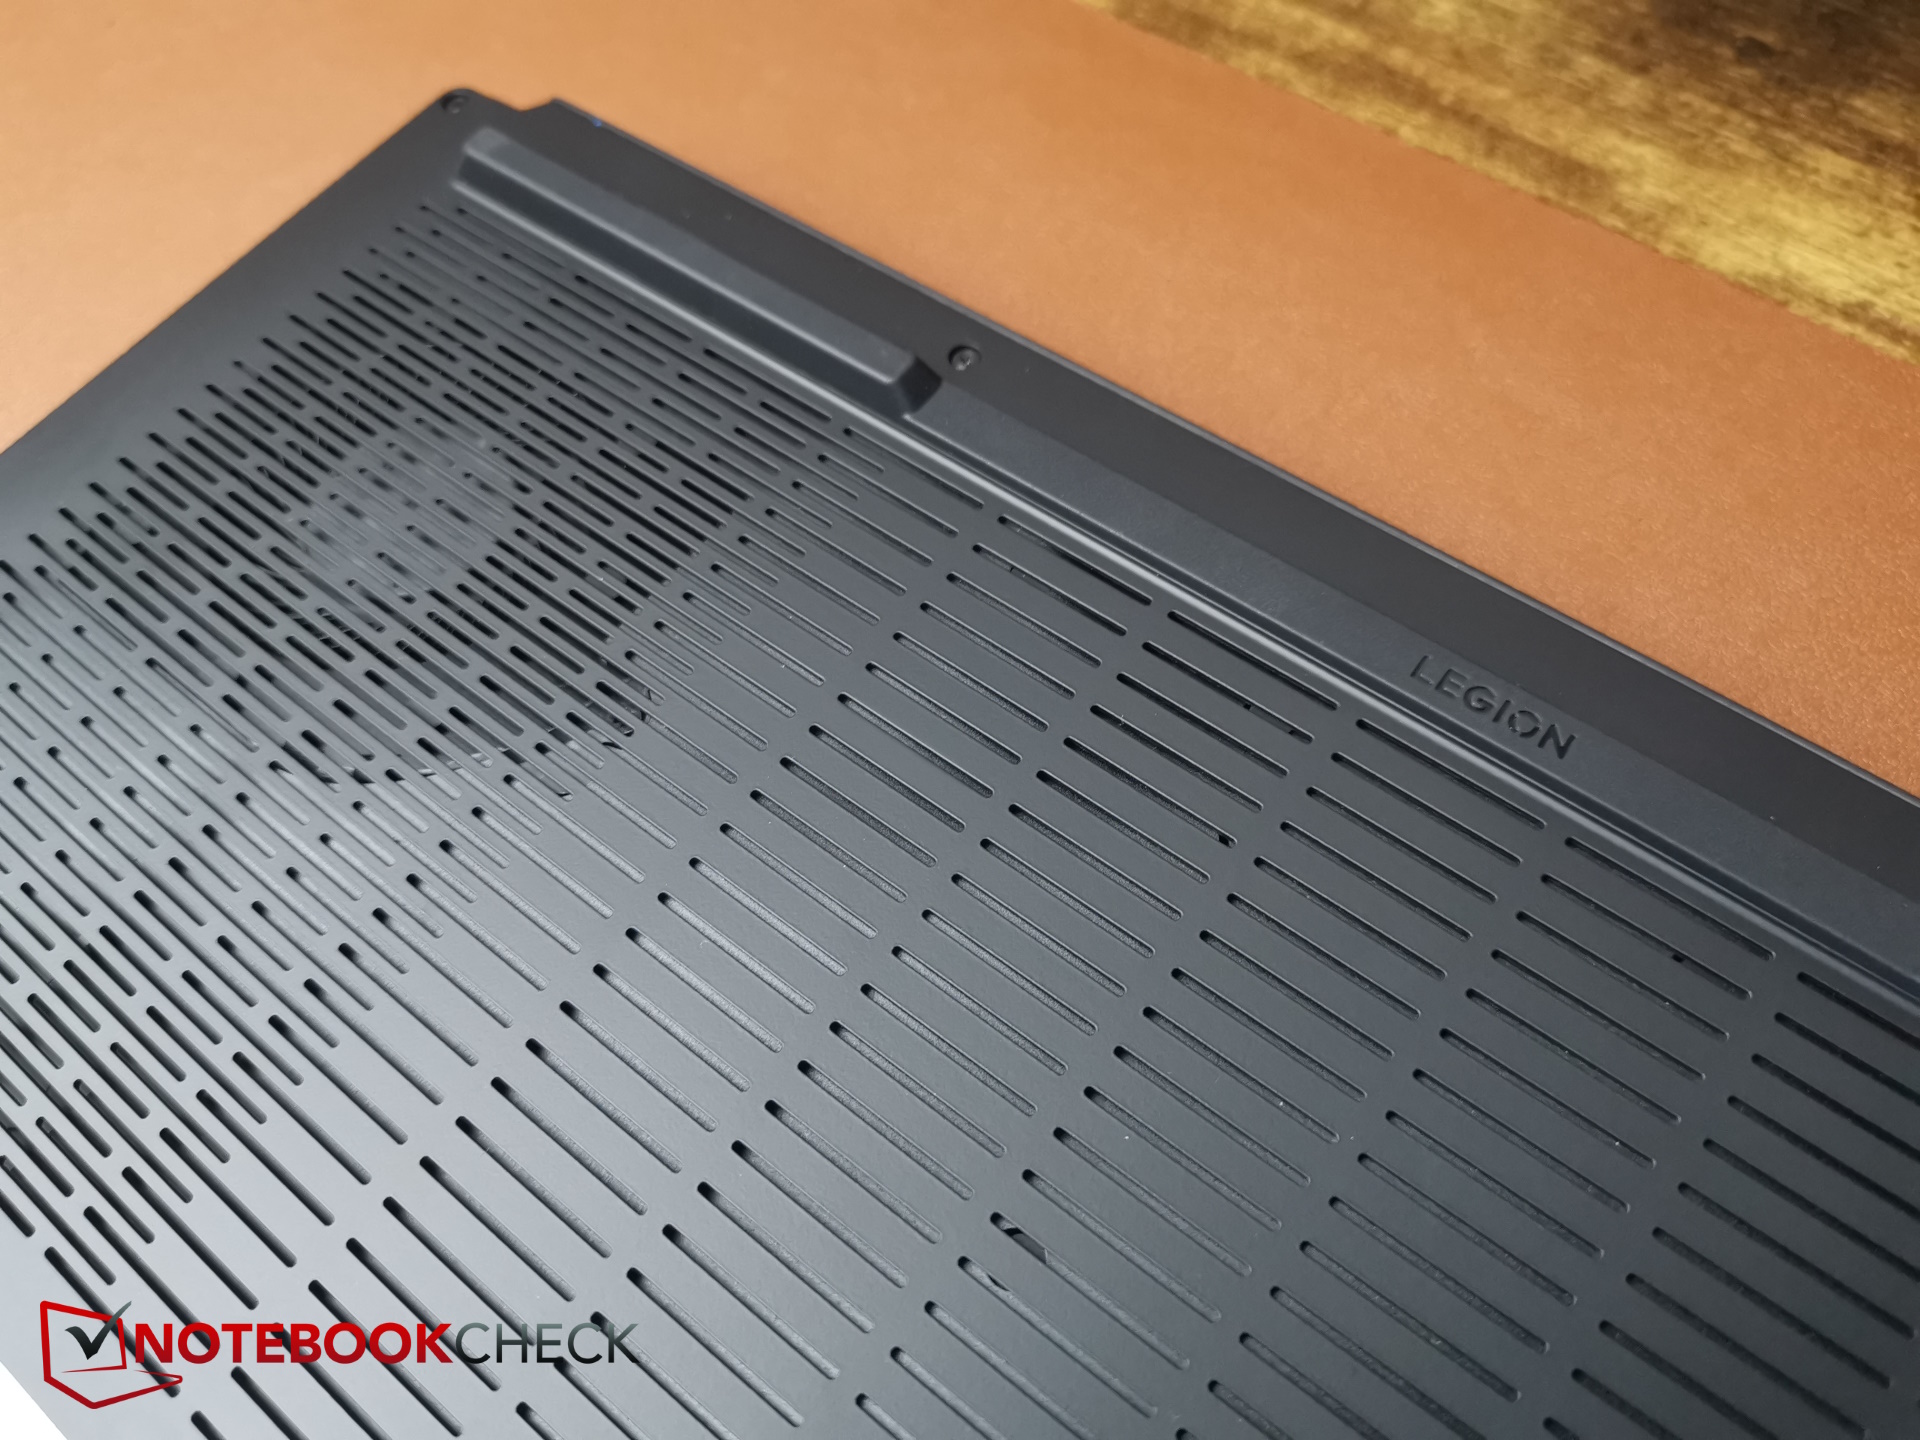
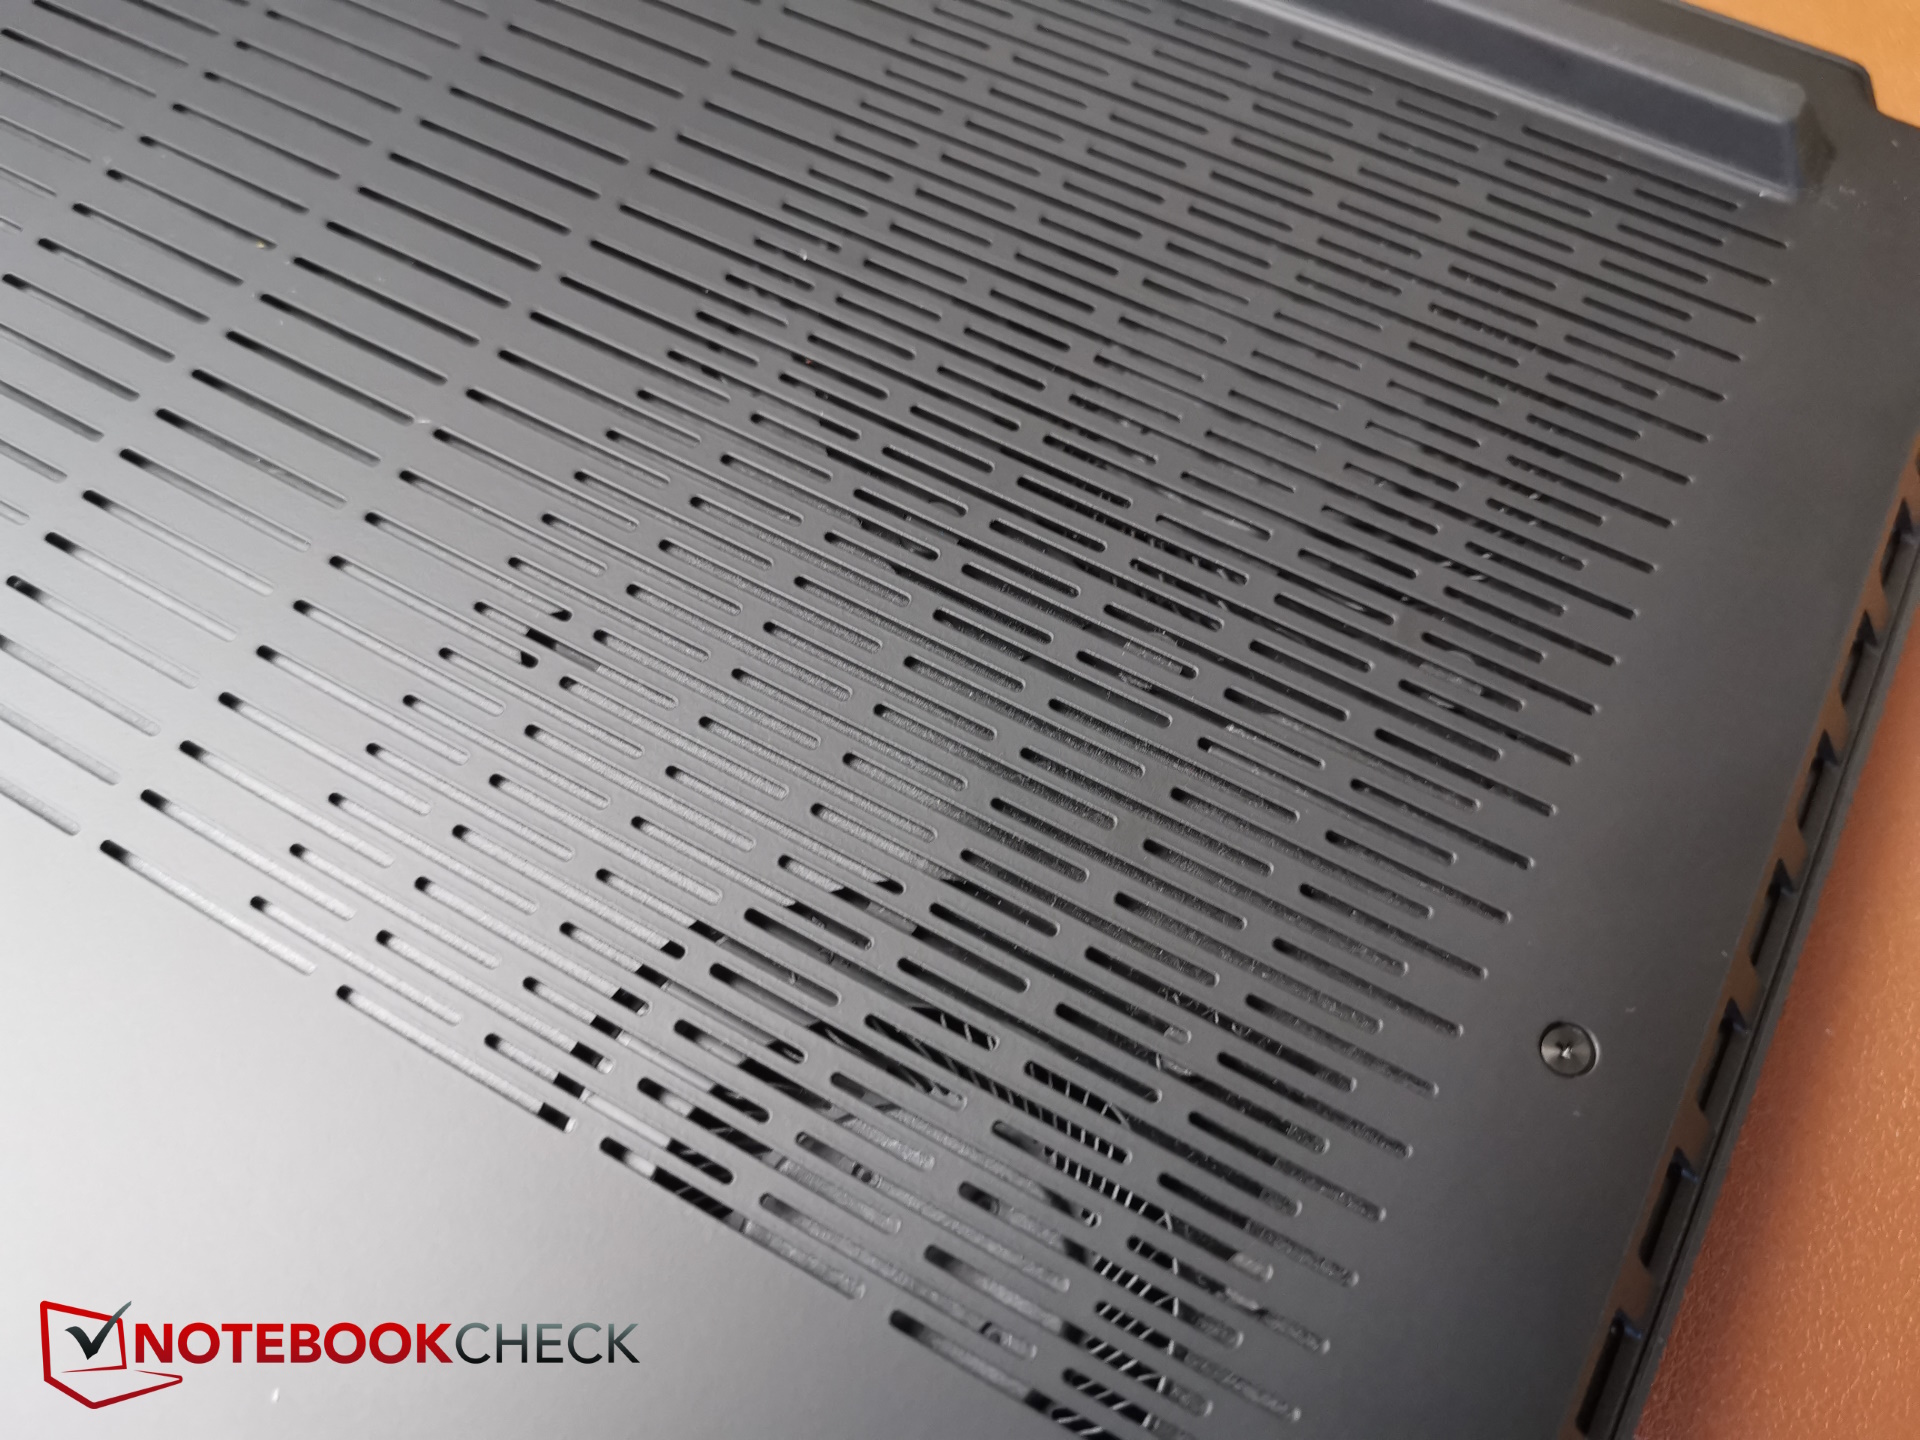
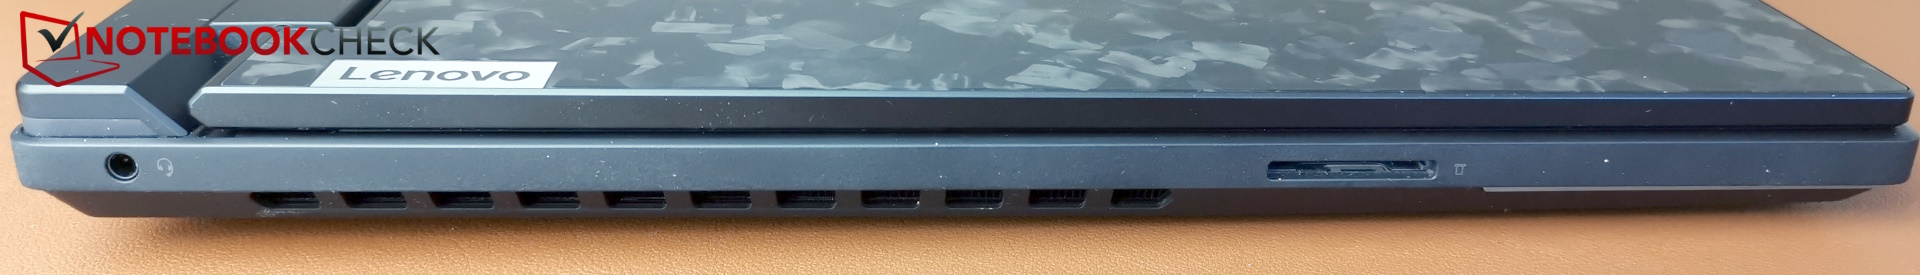
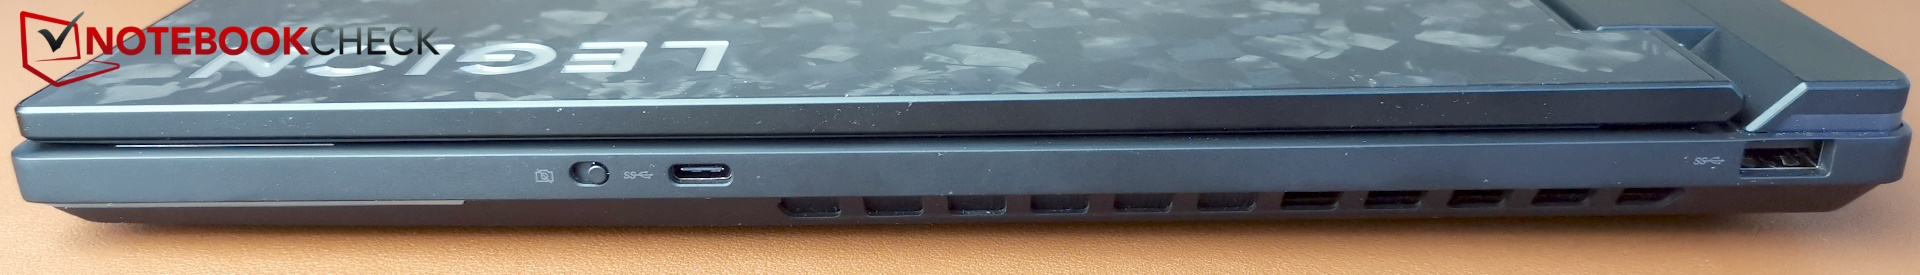
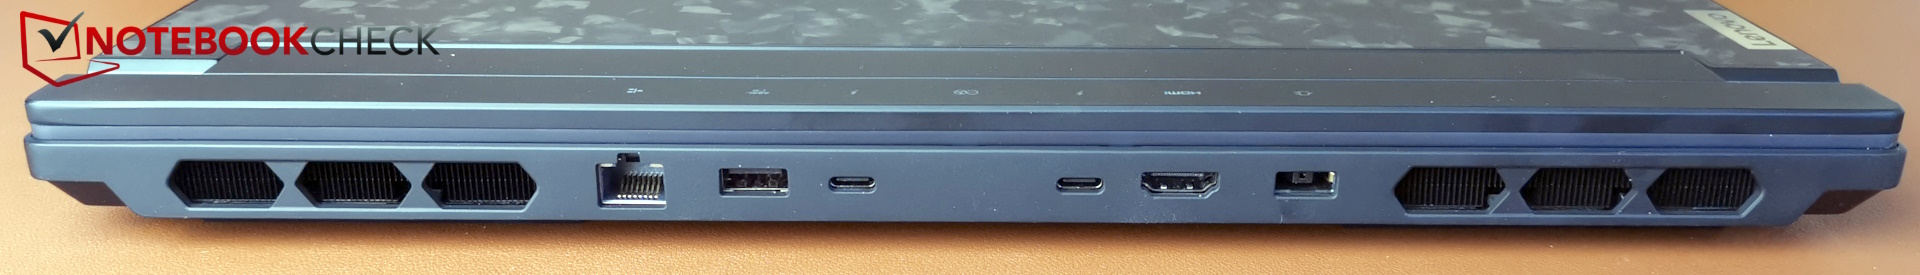
Case & connectivity - Forged carbon
Because at least visually everything has remained the same about the new model, we recommend taking a look at our review of the Lenovo Legion 9i Gen8 for information on its carbon-forged case, maintenance options and input devices.

SD card reader
For a high-end laptop, the SD card reader's transfer rates are disappointing. They are slightly worse than last year and are miles away from the transfer rates of a Razer Blade 16 or Alienware m18 R2.
| SD Card Reader | |
| average JPG Copy Test (av. of 3 runs) | |
| Alienware m18 R2 (Toshiba Exceria Pro SDXC 64 GB UHS-II) | |
| Razer Blade 16 2024, RTX 4090 | |
| Average of class Gaming (20.9 - 210, n=54, last 2 years) | |
| Lenovo Legion 9 16IRX8 (Toshiba Exceria Pro SDXC 64 GB UHS-II) | |
| Medion Erazer Beast X40 2024 (AV PRO microSD 128 GB V60) | |
| Lenovo Legion 9 16IRX9, RTX 4090 | |
| maximum AS SSD Seq Read Test (1GB) | |
| Alienware m18 R2 (Toshiba Exceria Pro SDXC 64 GB UHS-II) | |
| Razer Blade 16 2024, RTX 4090 | |
| Average of class Gaming (25.5 - 261, n=51, last 2 years) | |
| Medion Erazer Beast X40 2024 (AV PRO microSD 128 GB V60) | |
| Lenovo Legion 9 16IRX9, RTX 4090 | |
| Lenovo Legion 9 16IRX8 (Toshiba Exceria Pro SDXC 64 GB UHS-II) | |
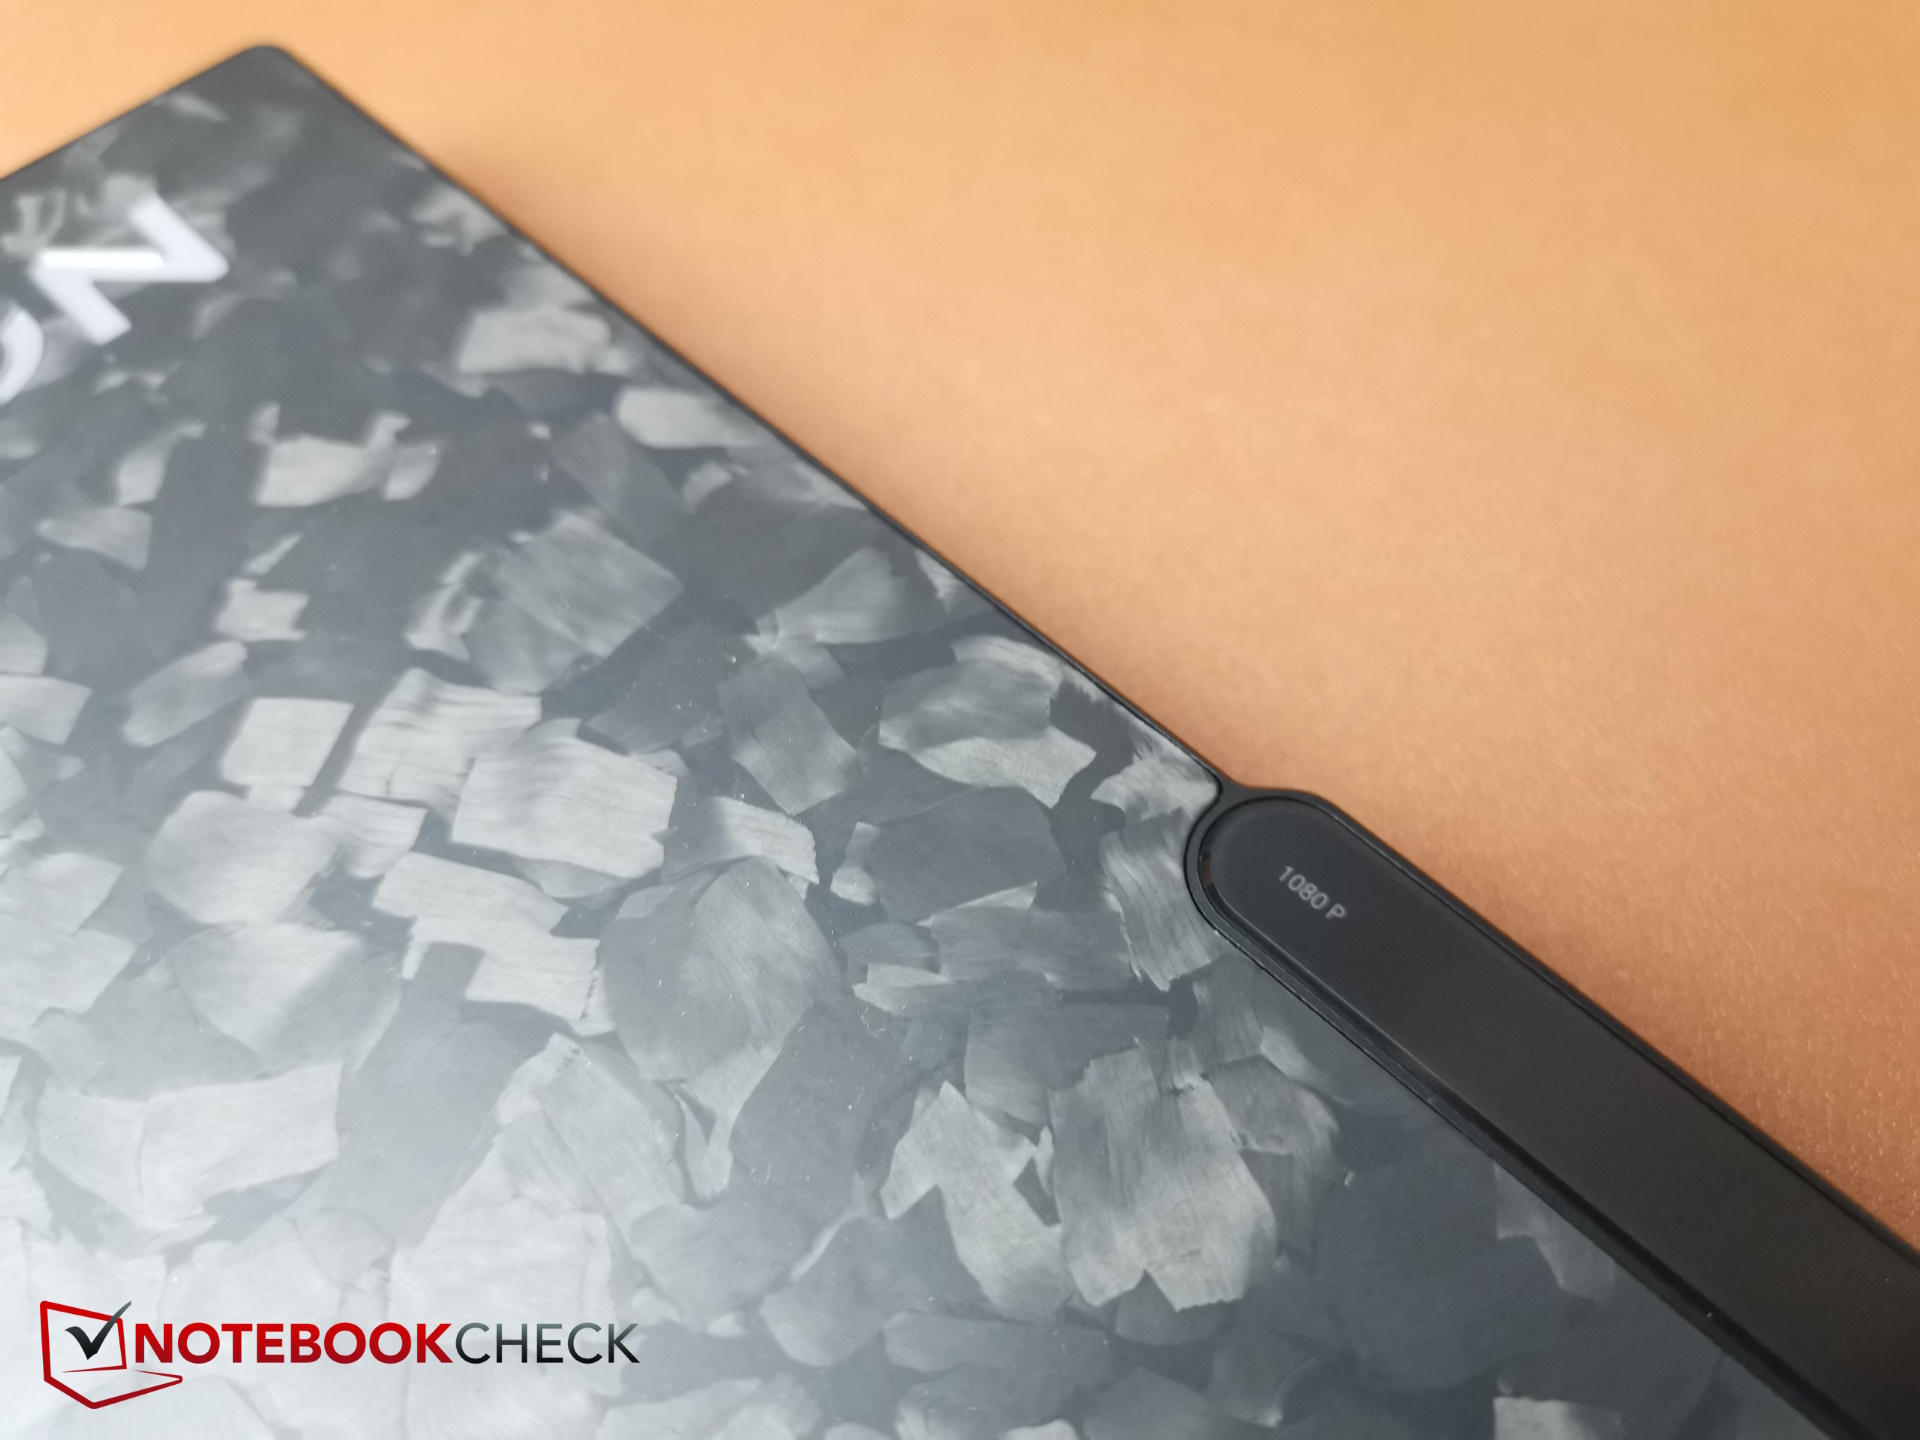
Webcam
The 1,080p Full HD webcam has medium to high color deviations and its image sharpness is okay.


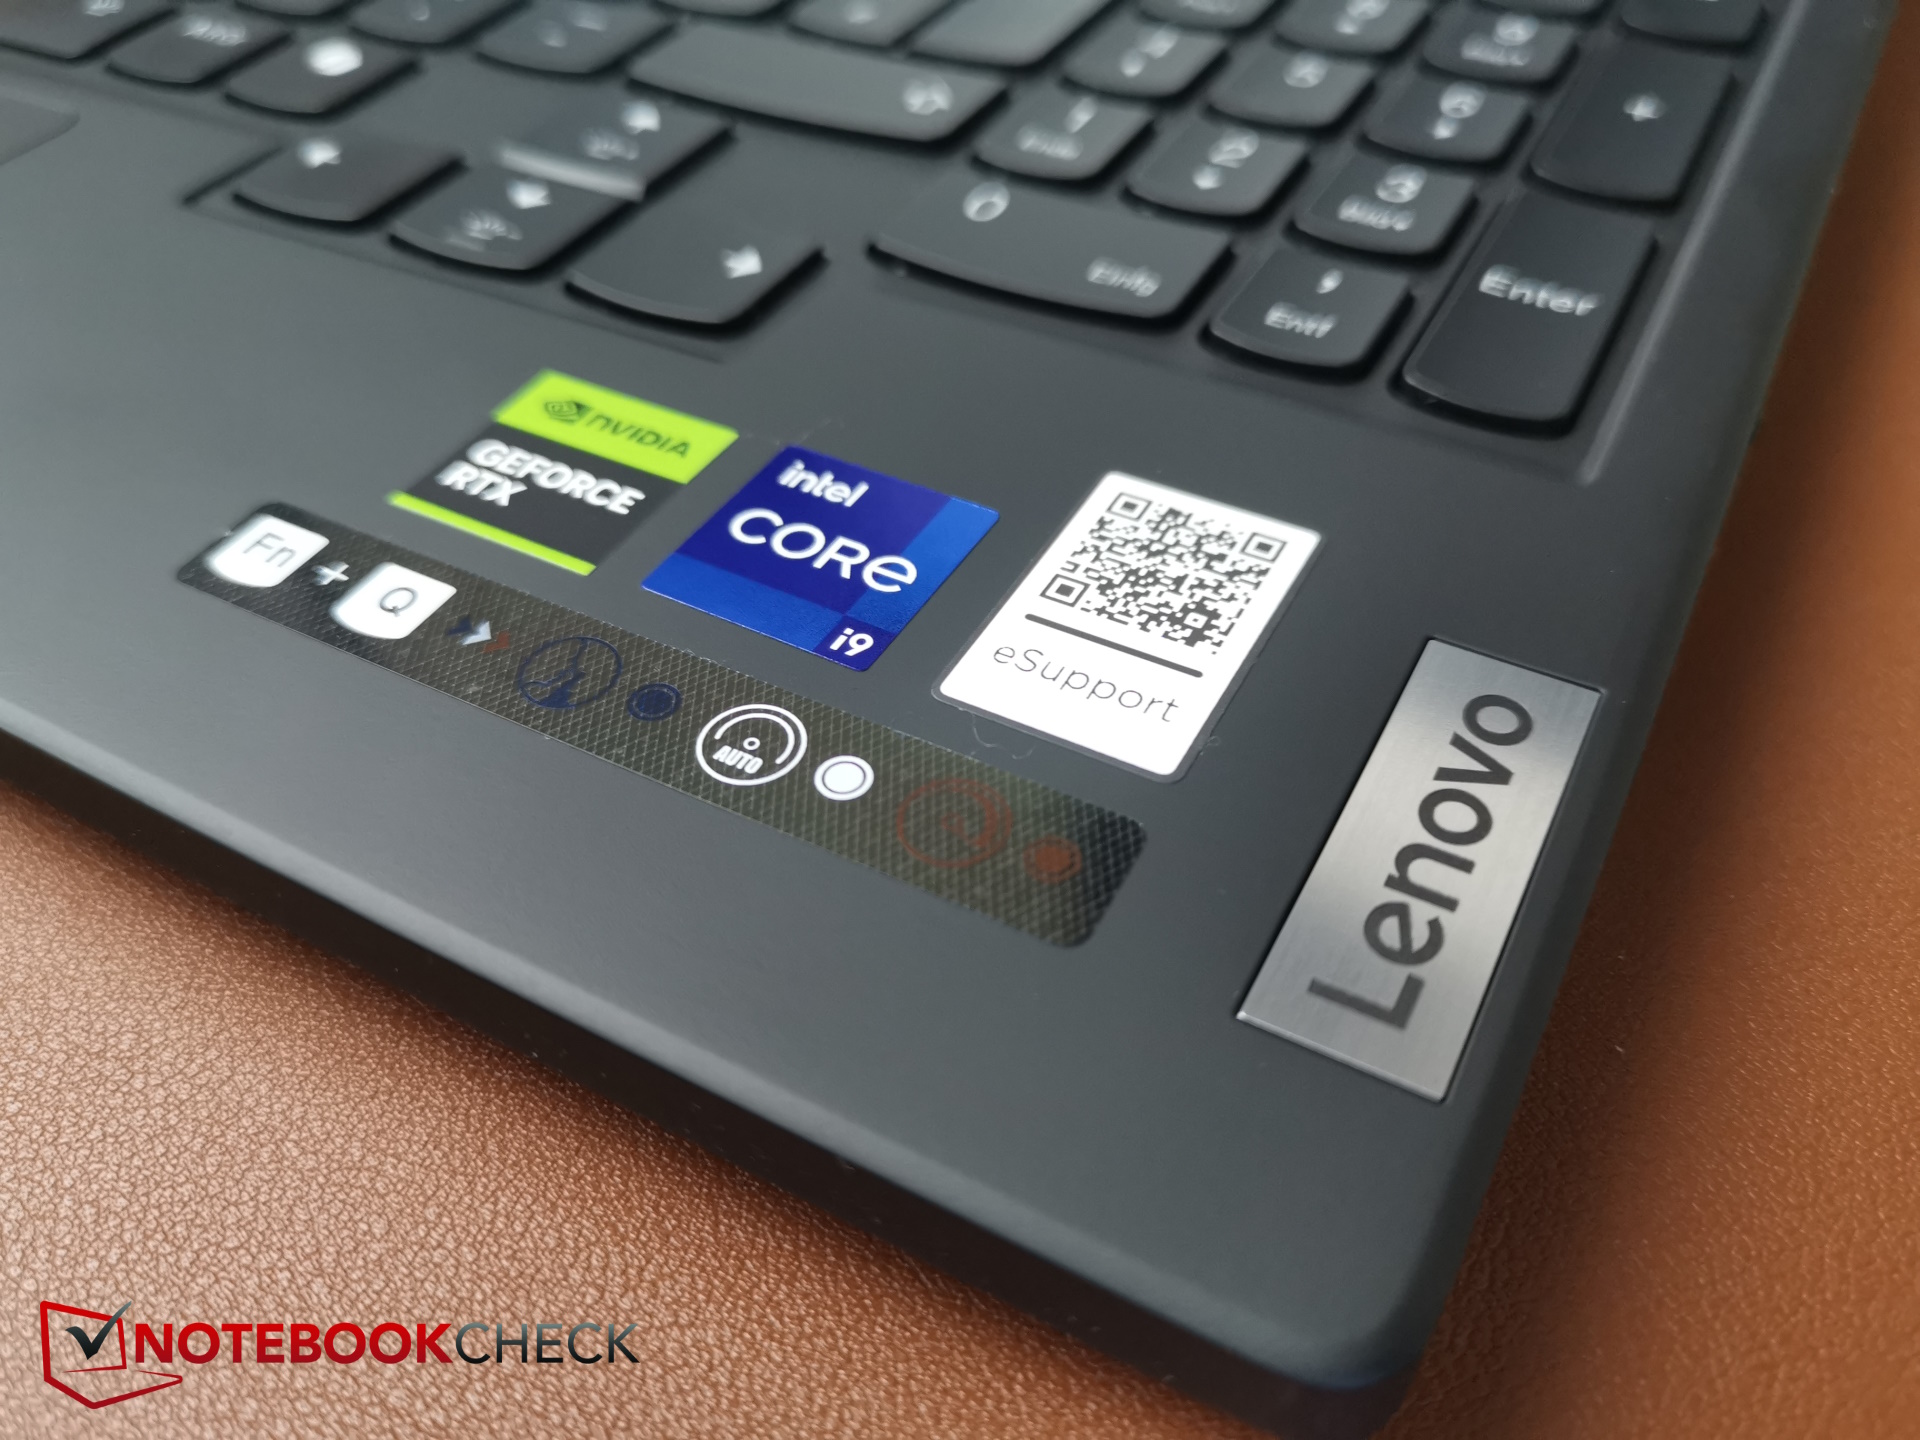
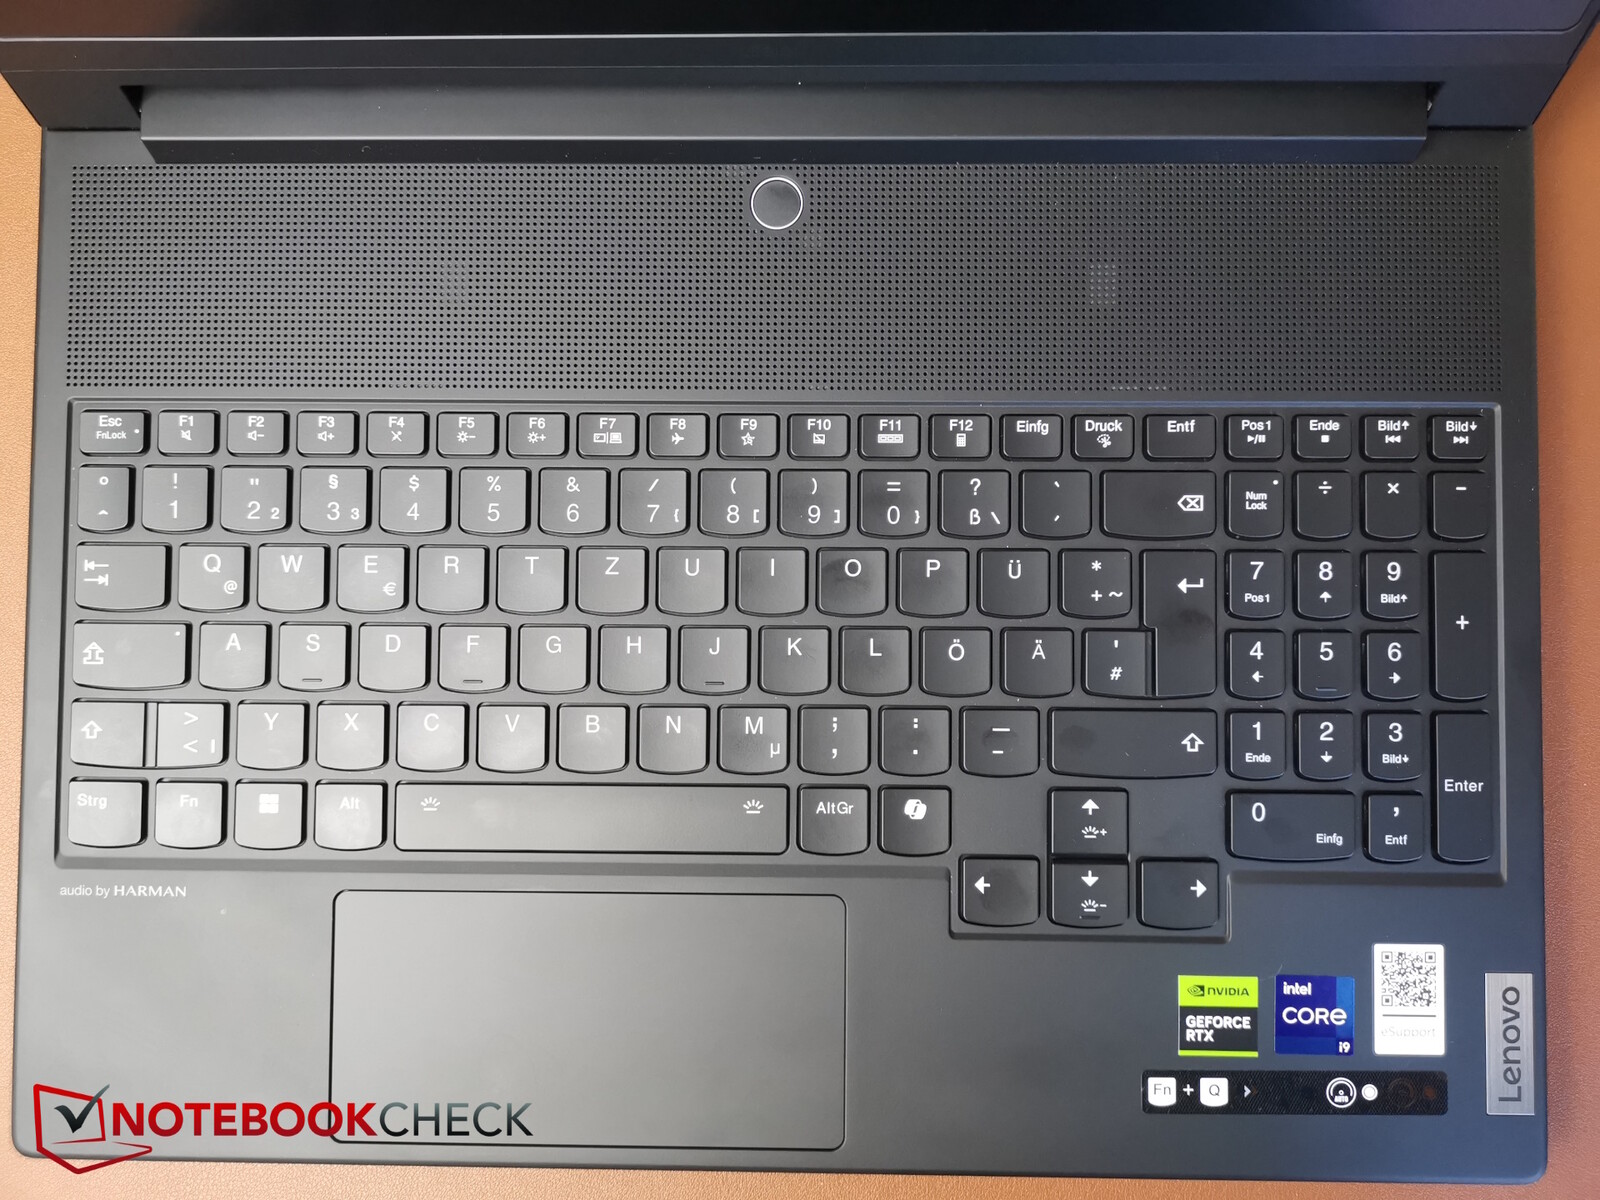
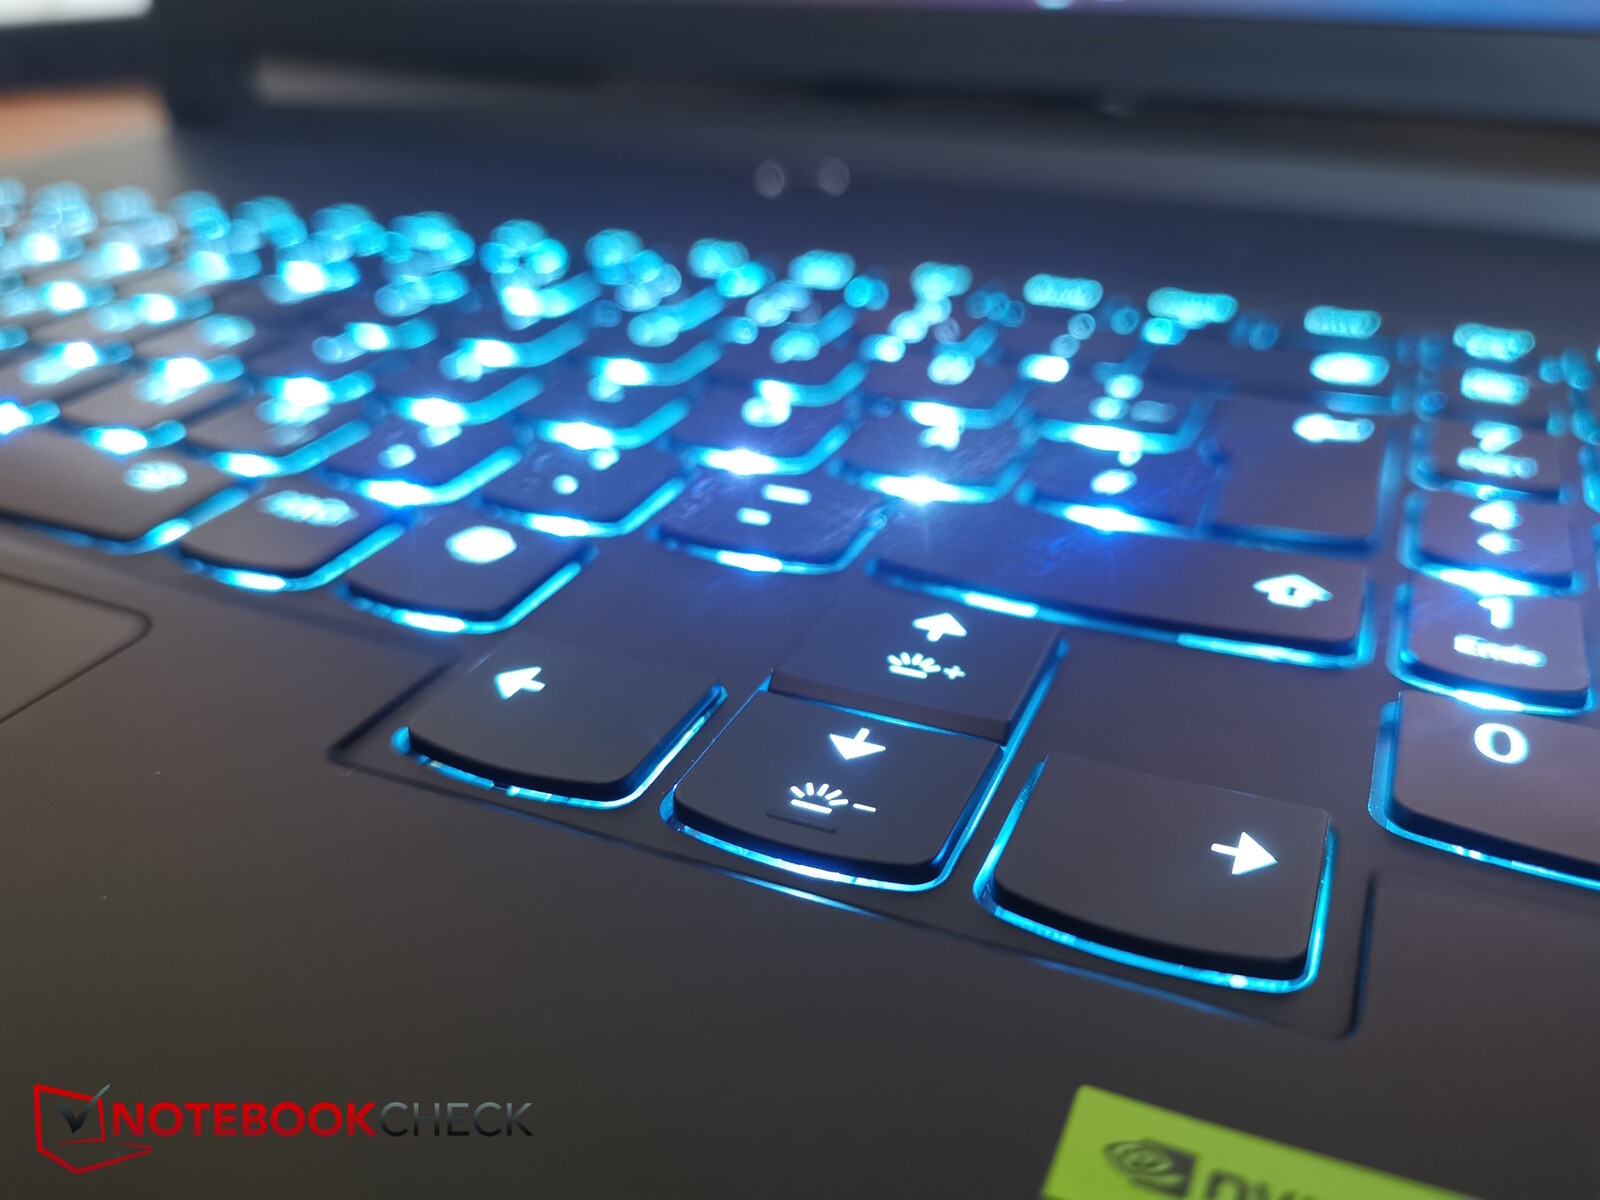
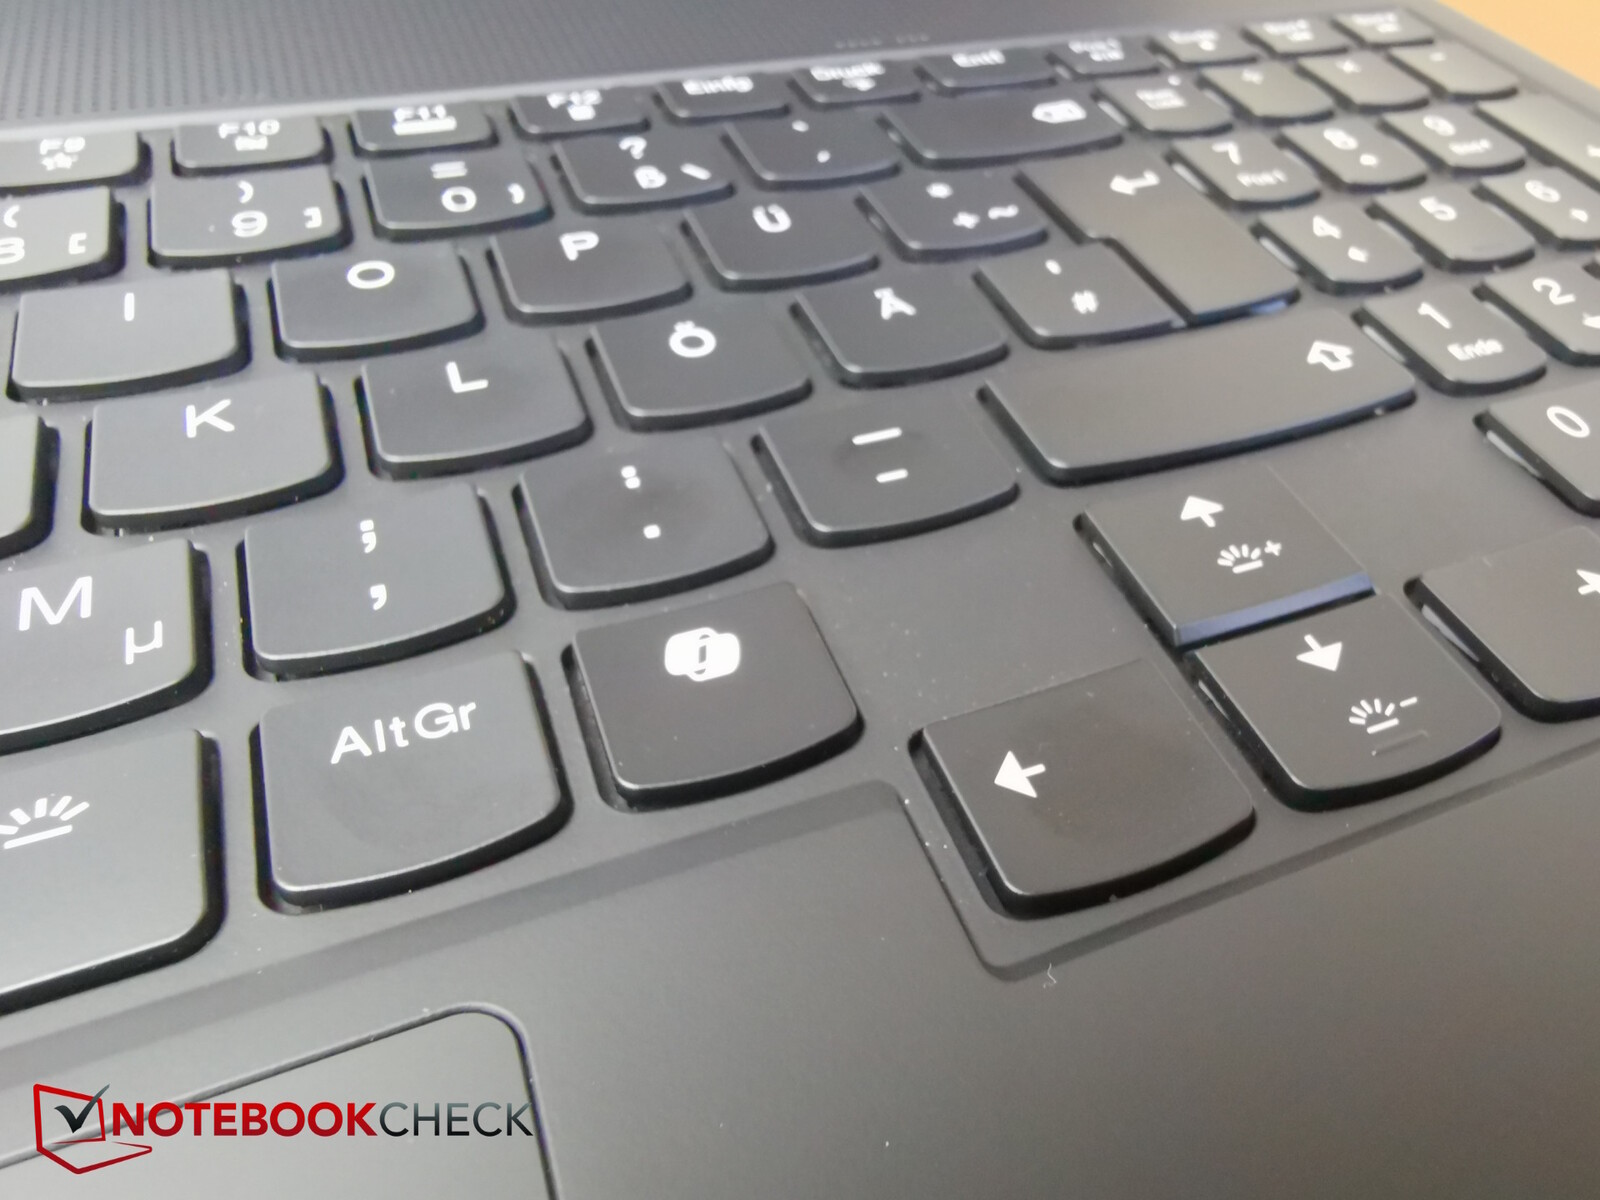
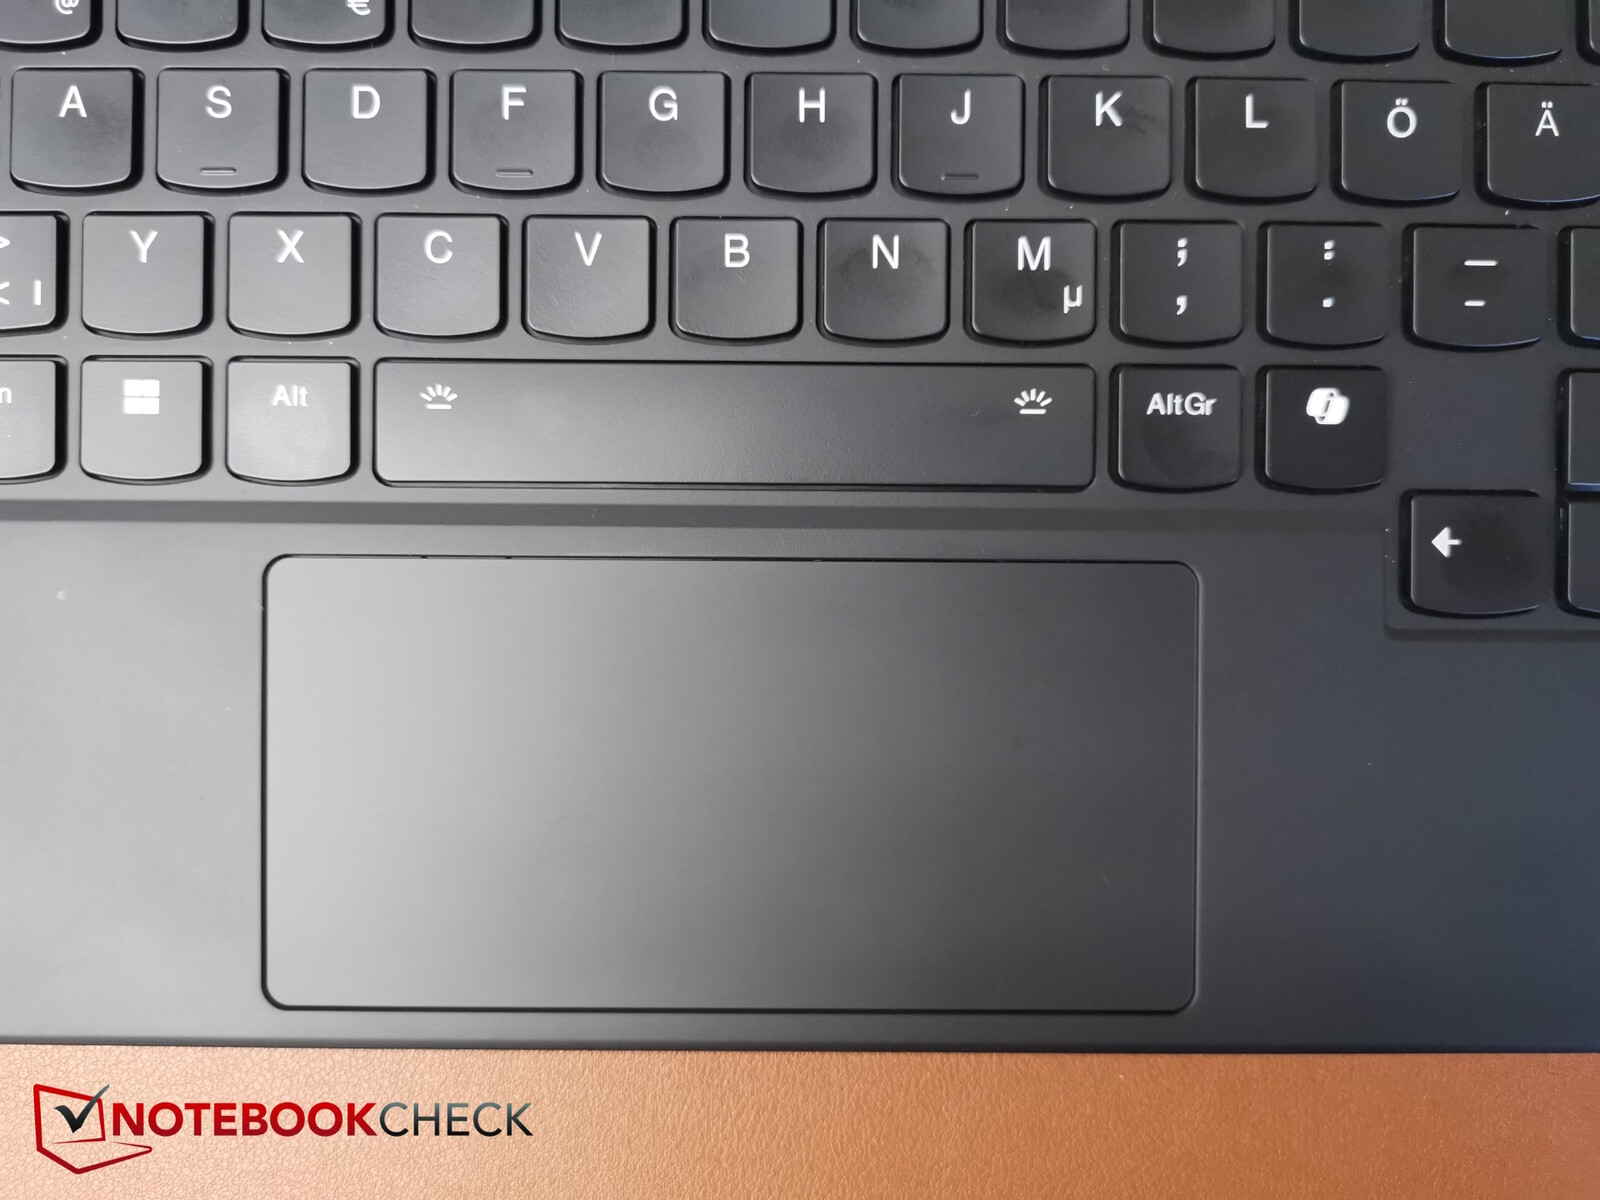
Input devices - Now with Co-Pilot
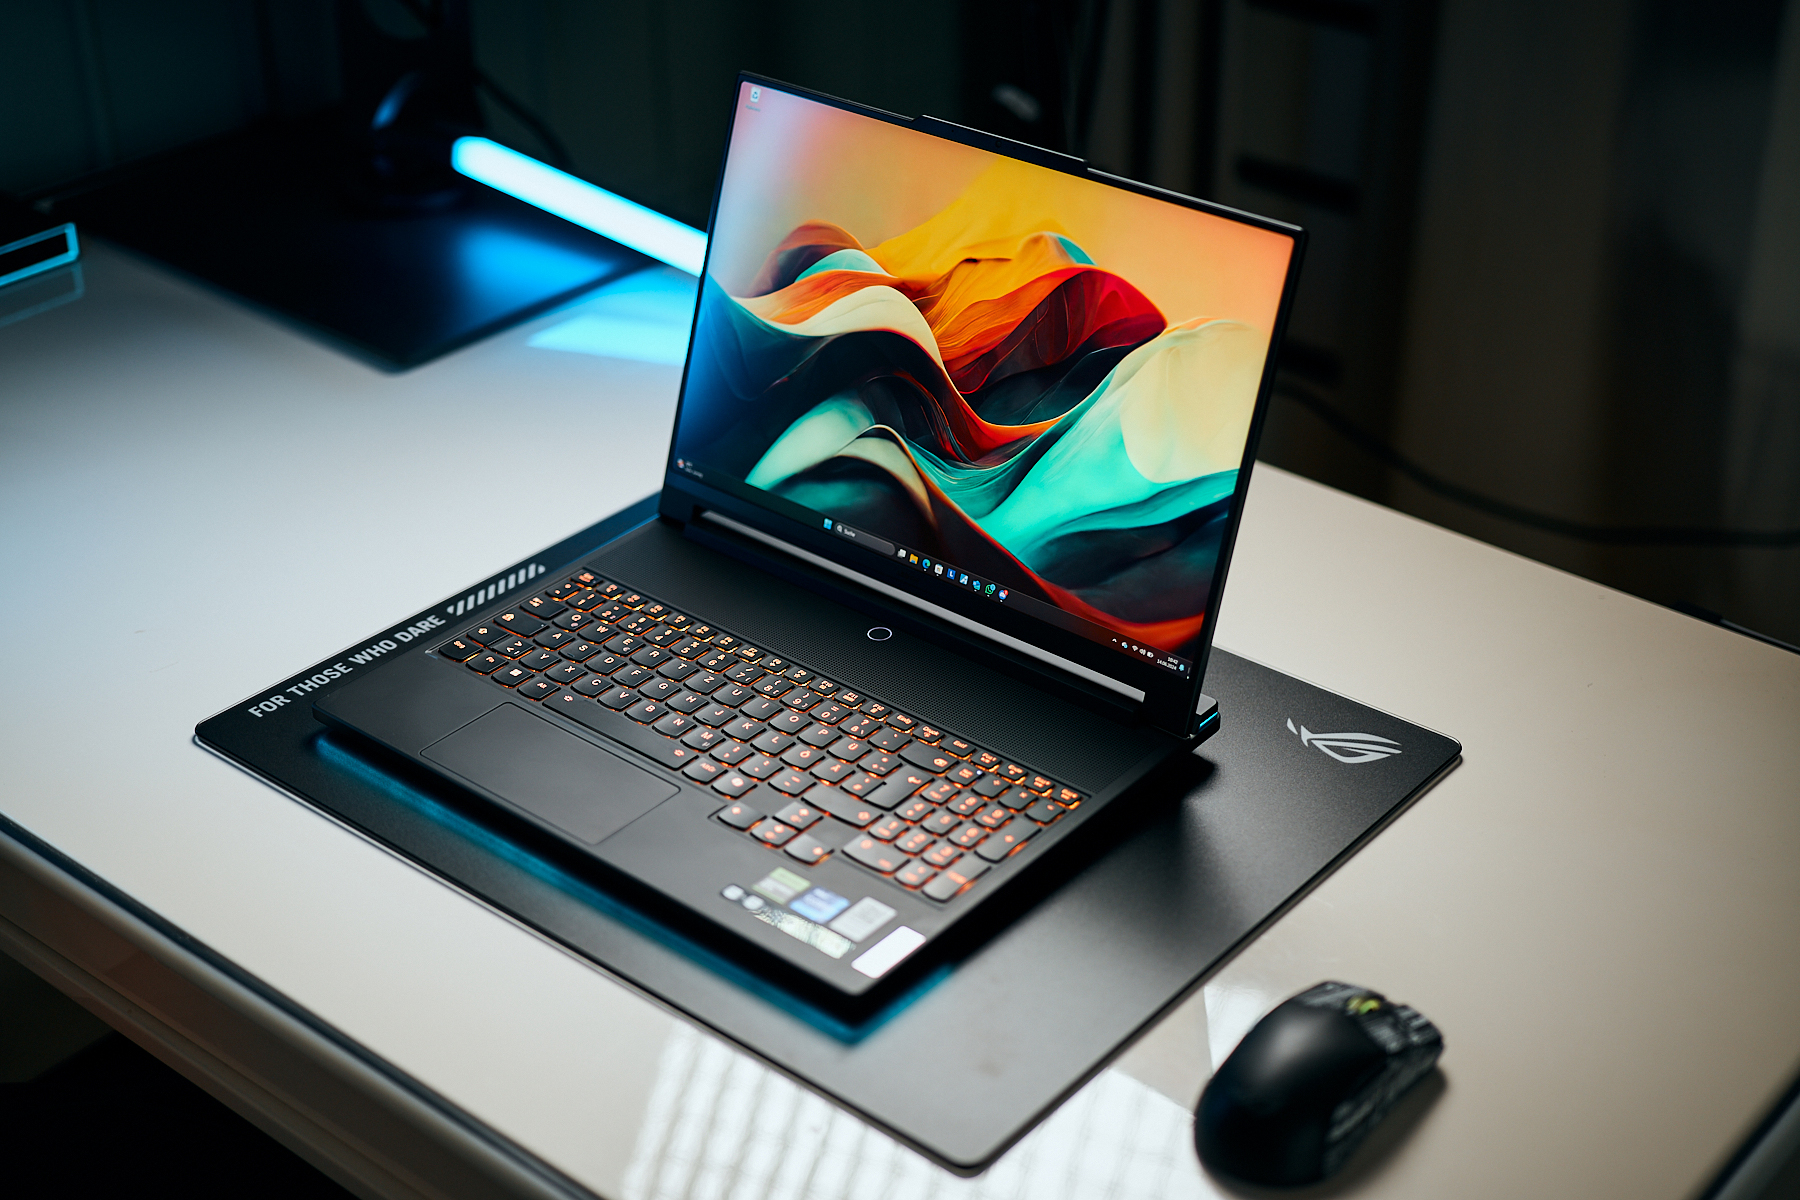
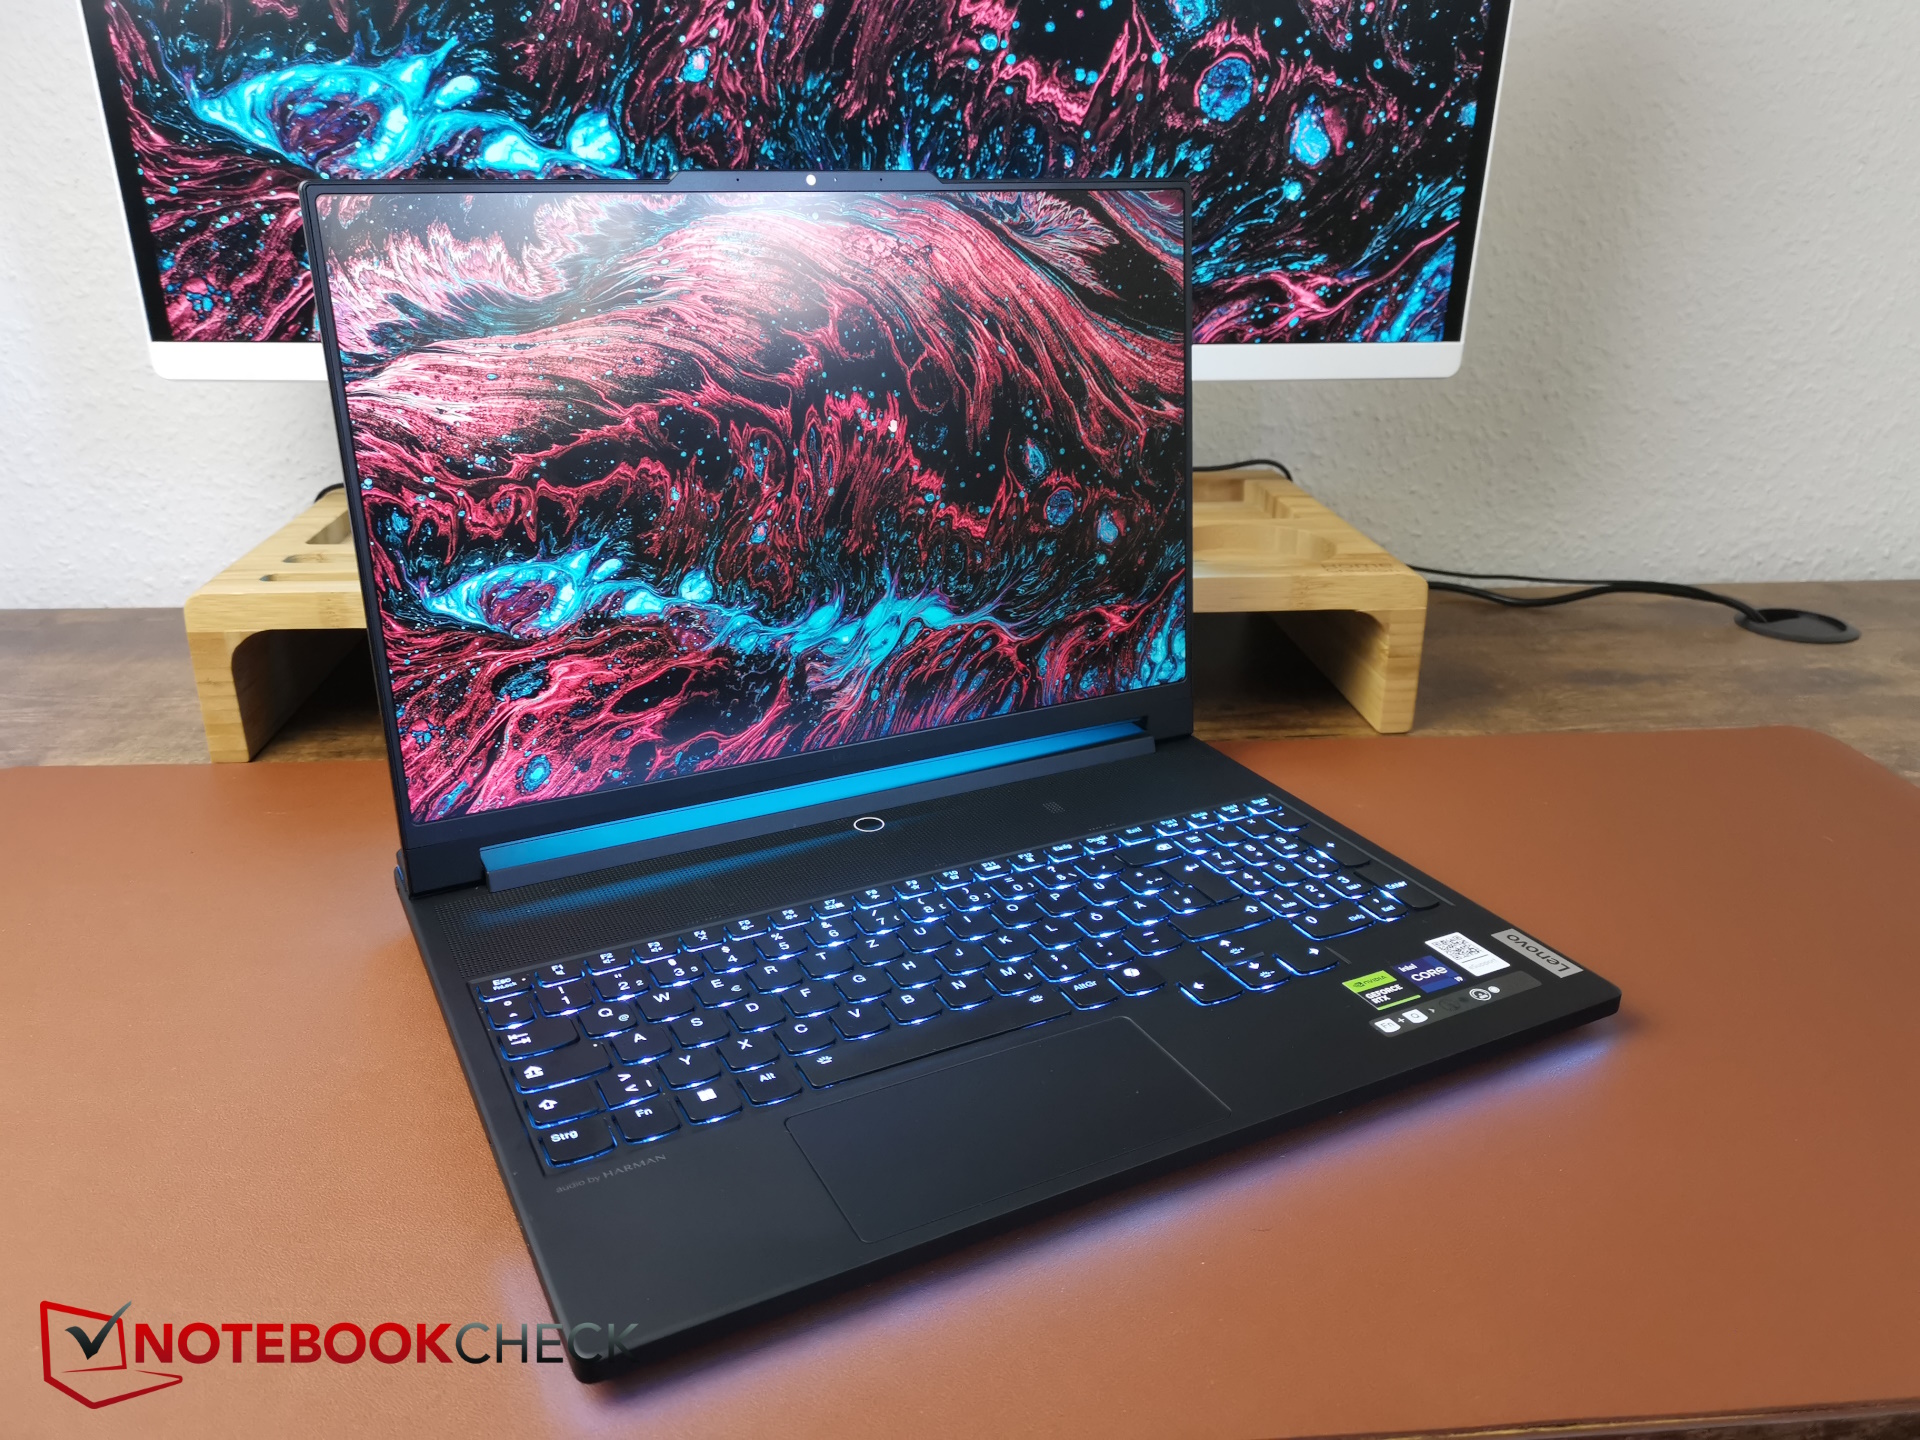
Its comfortable membrane keyboard and touchpad remain largely unchanged. The latter is still very narrow at just 5.9 cm. A Co-Pilot key has now been added to the keyboard. The right-hand Ctrl key has had to make way for this.
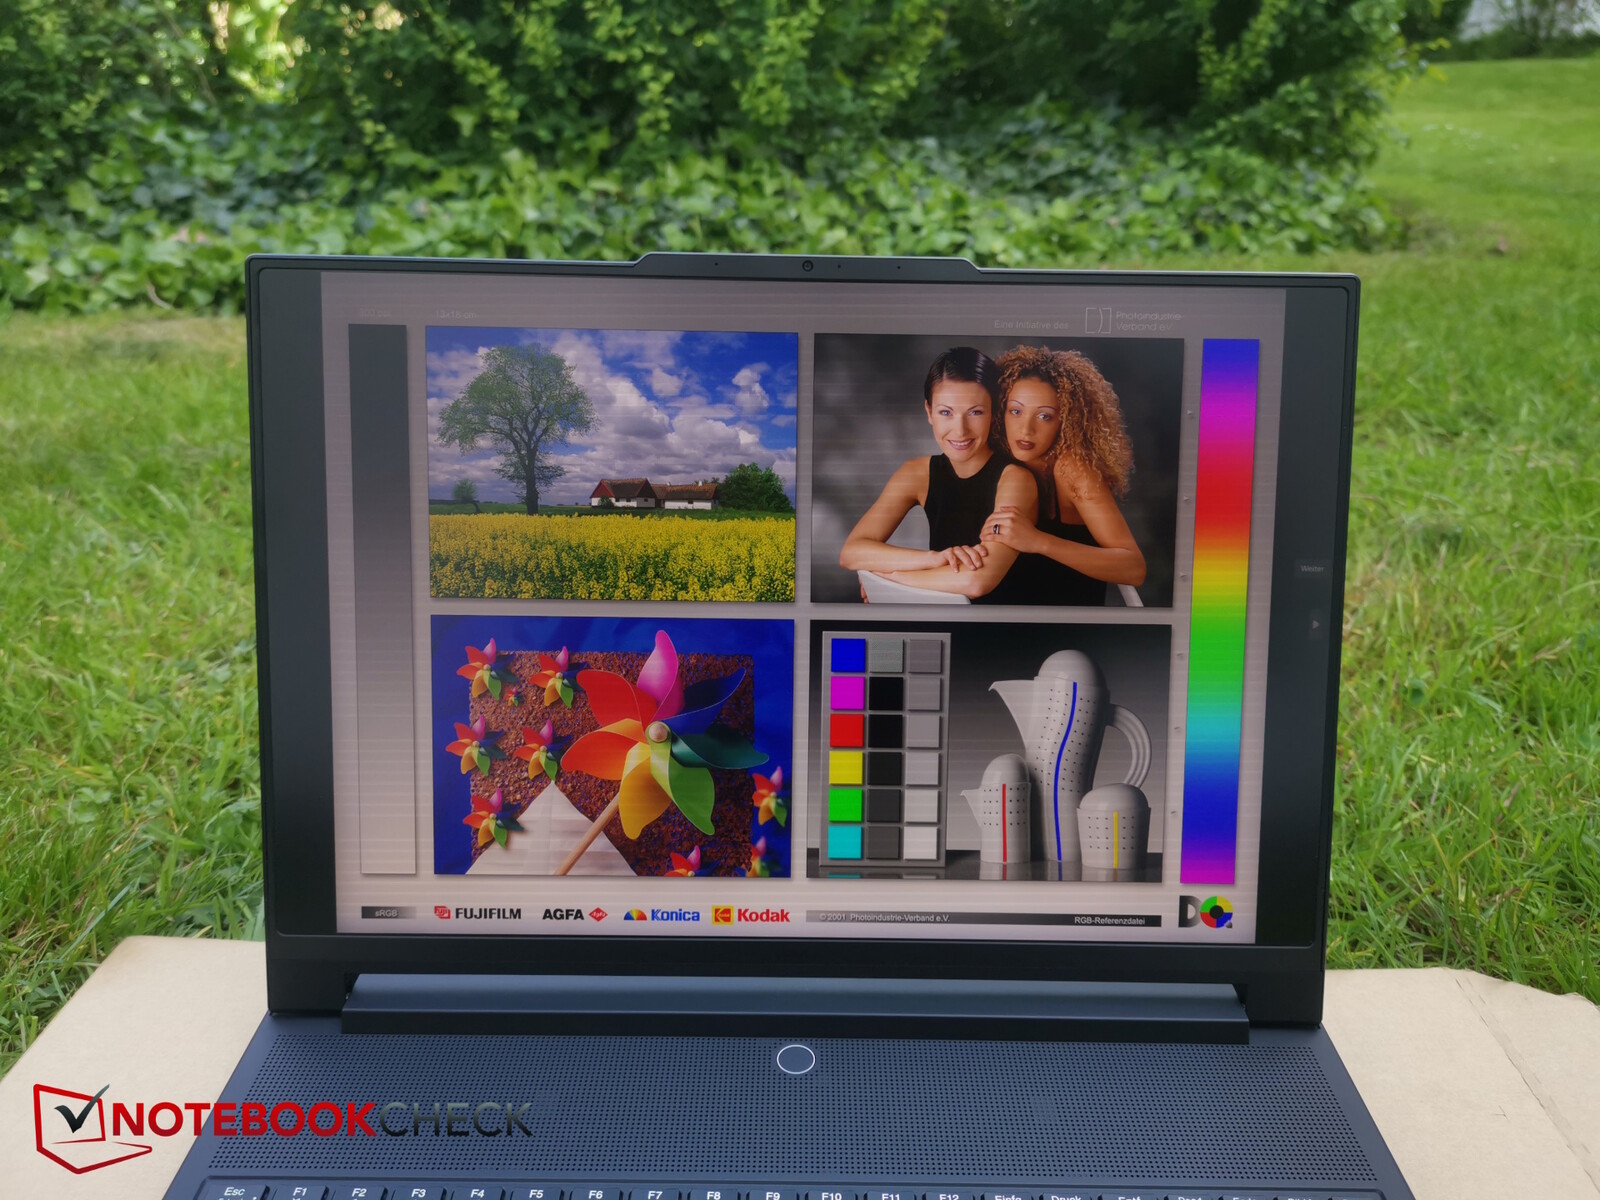
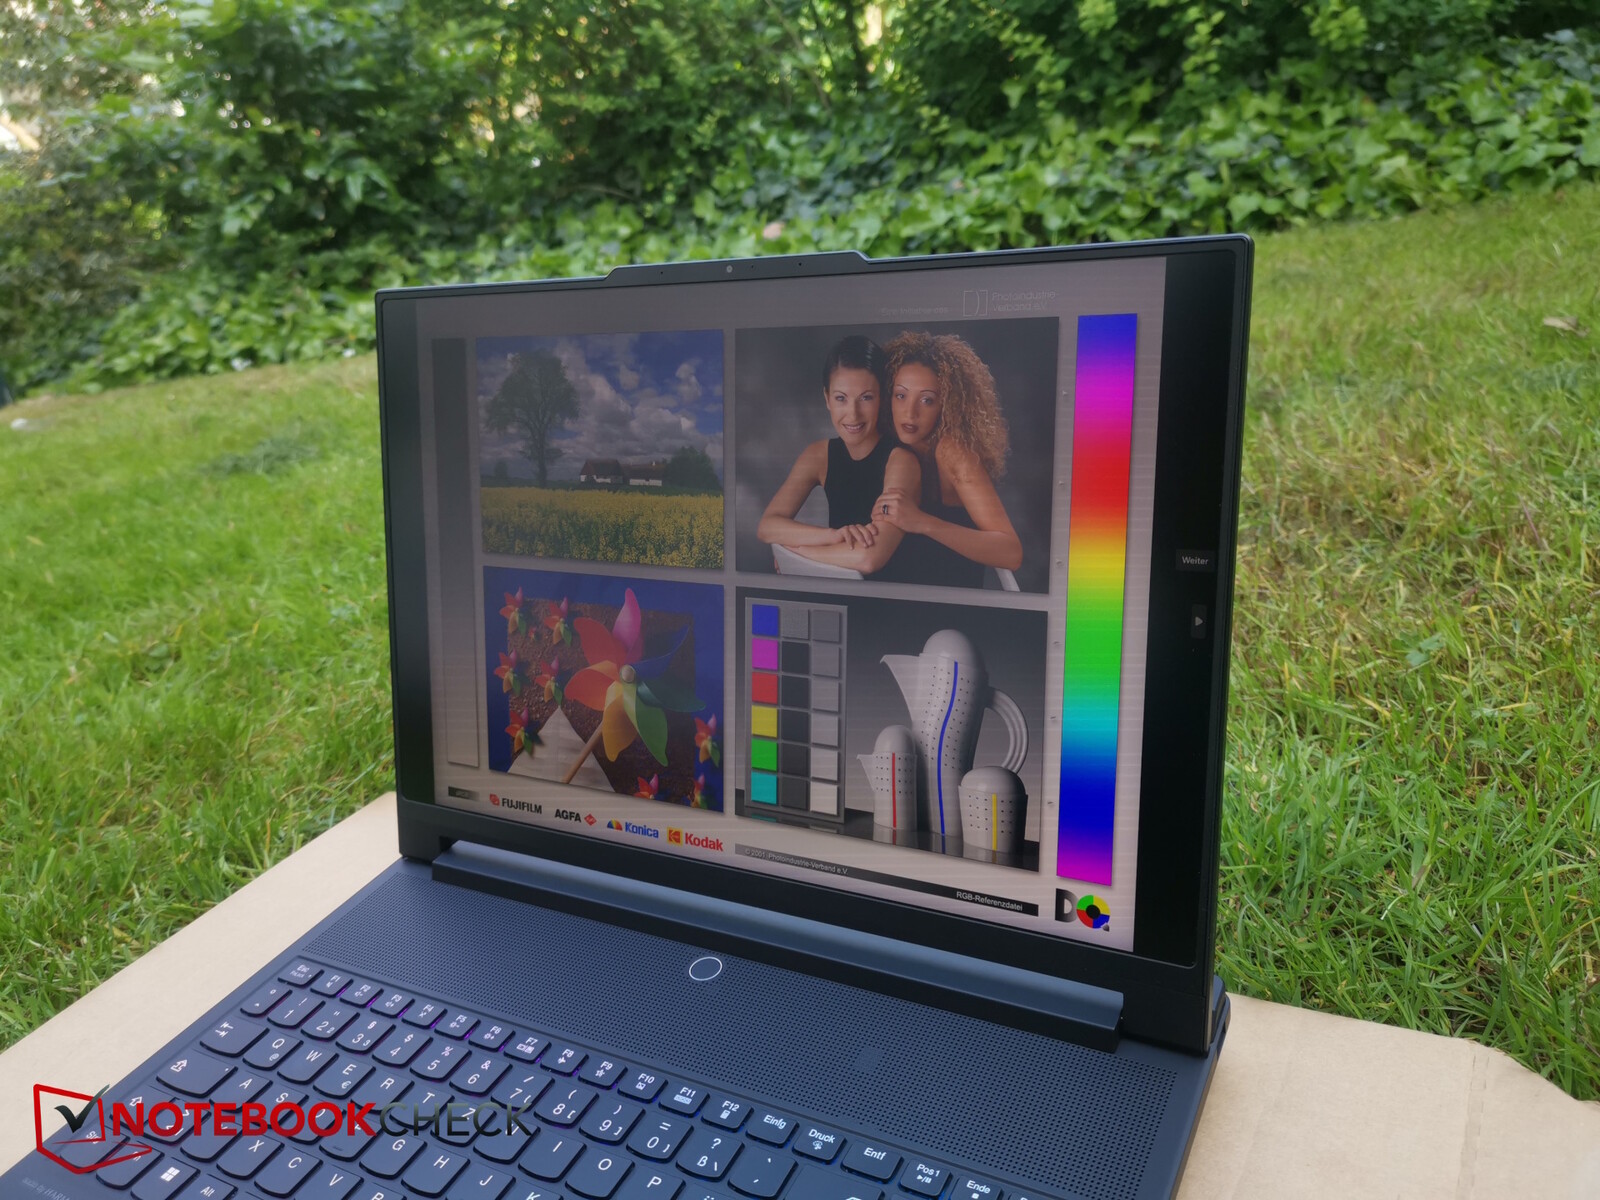
Display - 1,200-nit MiniLED
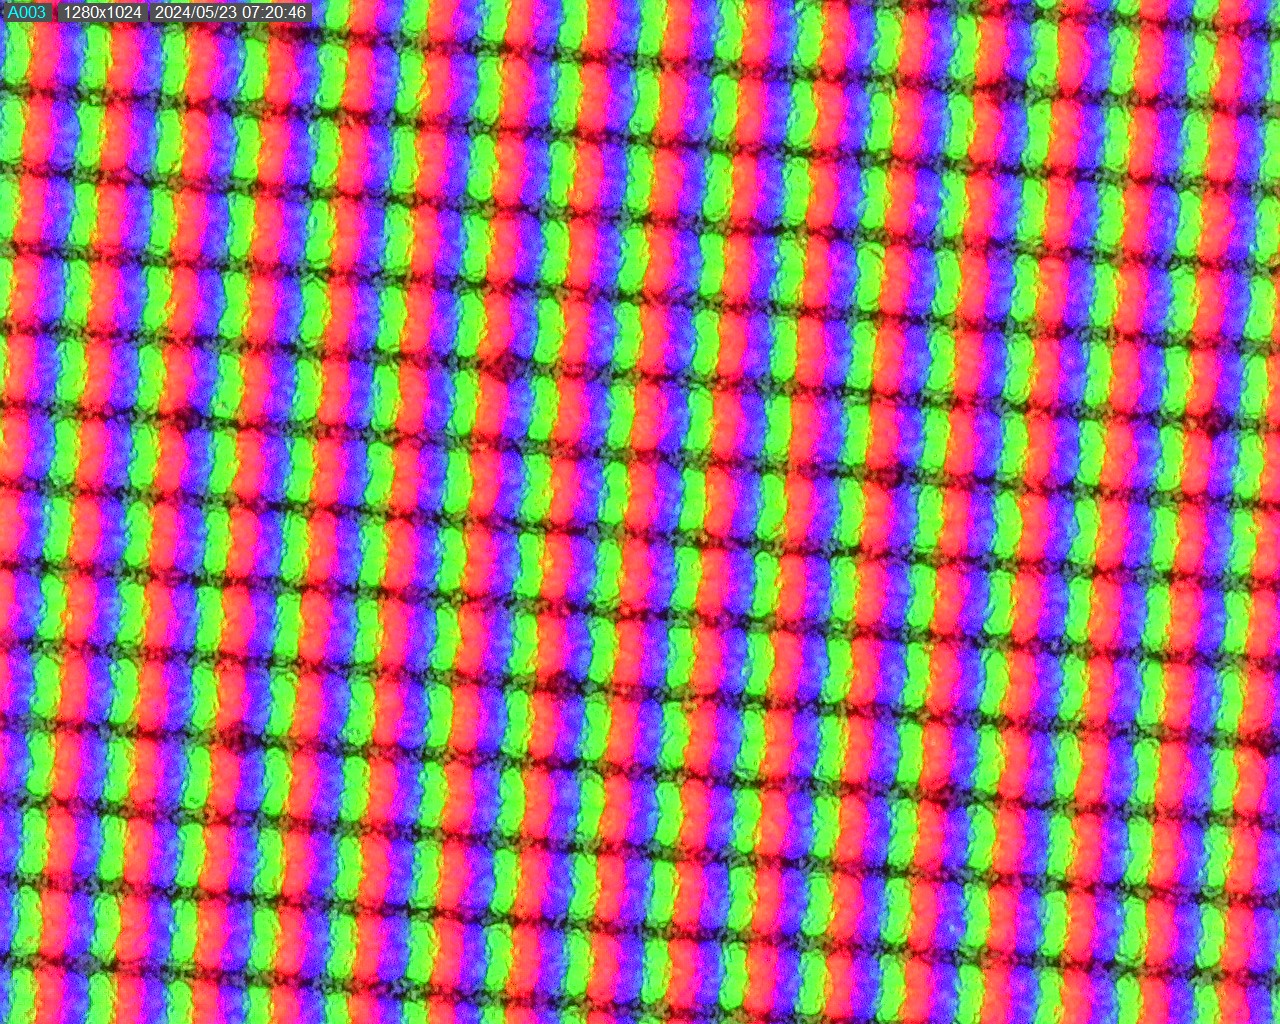
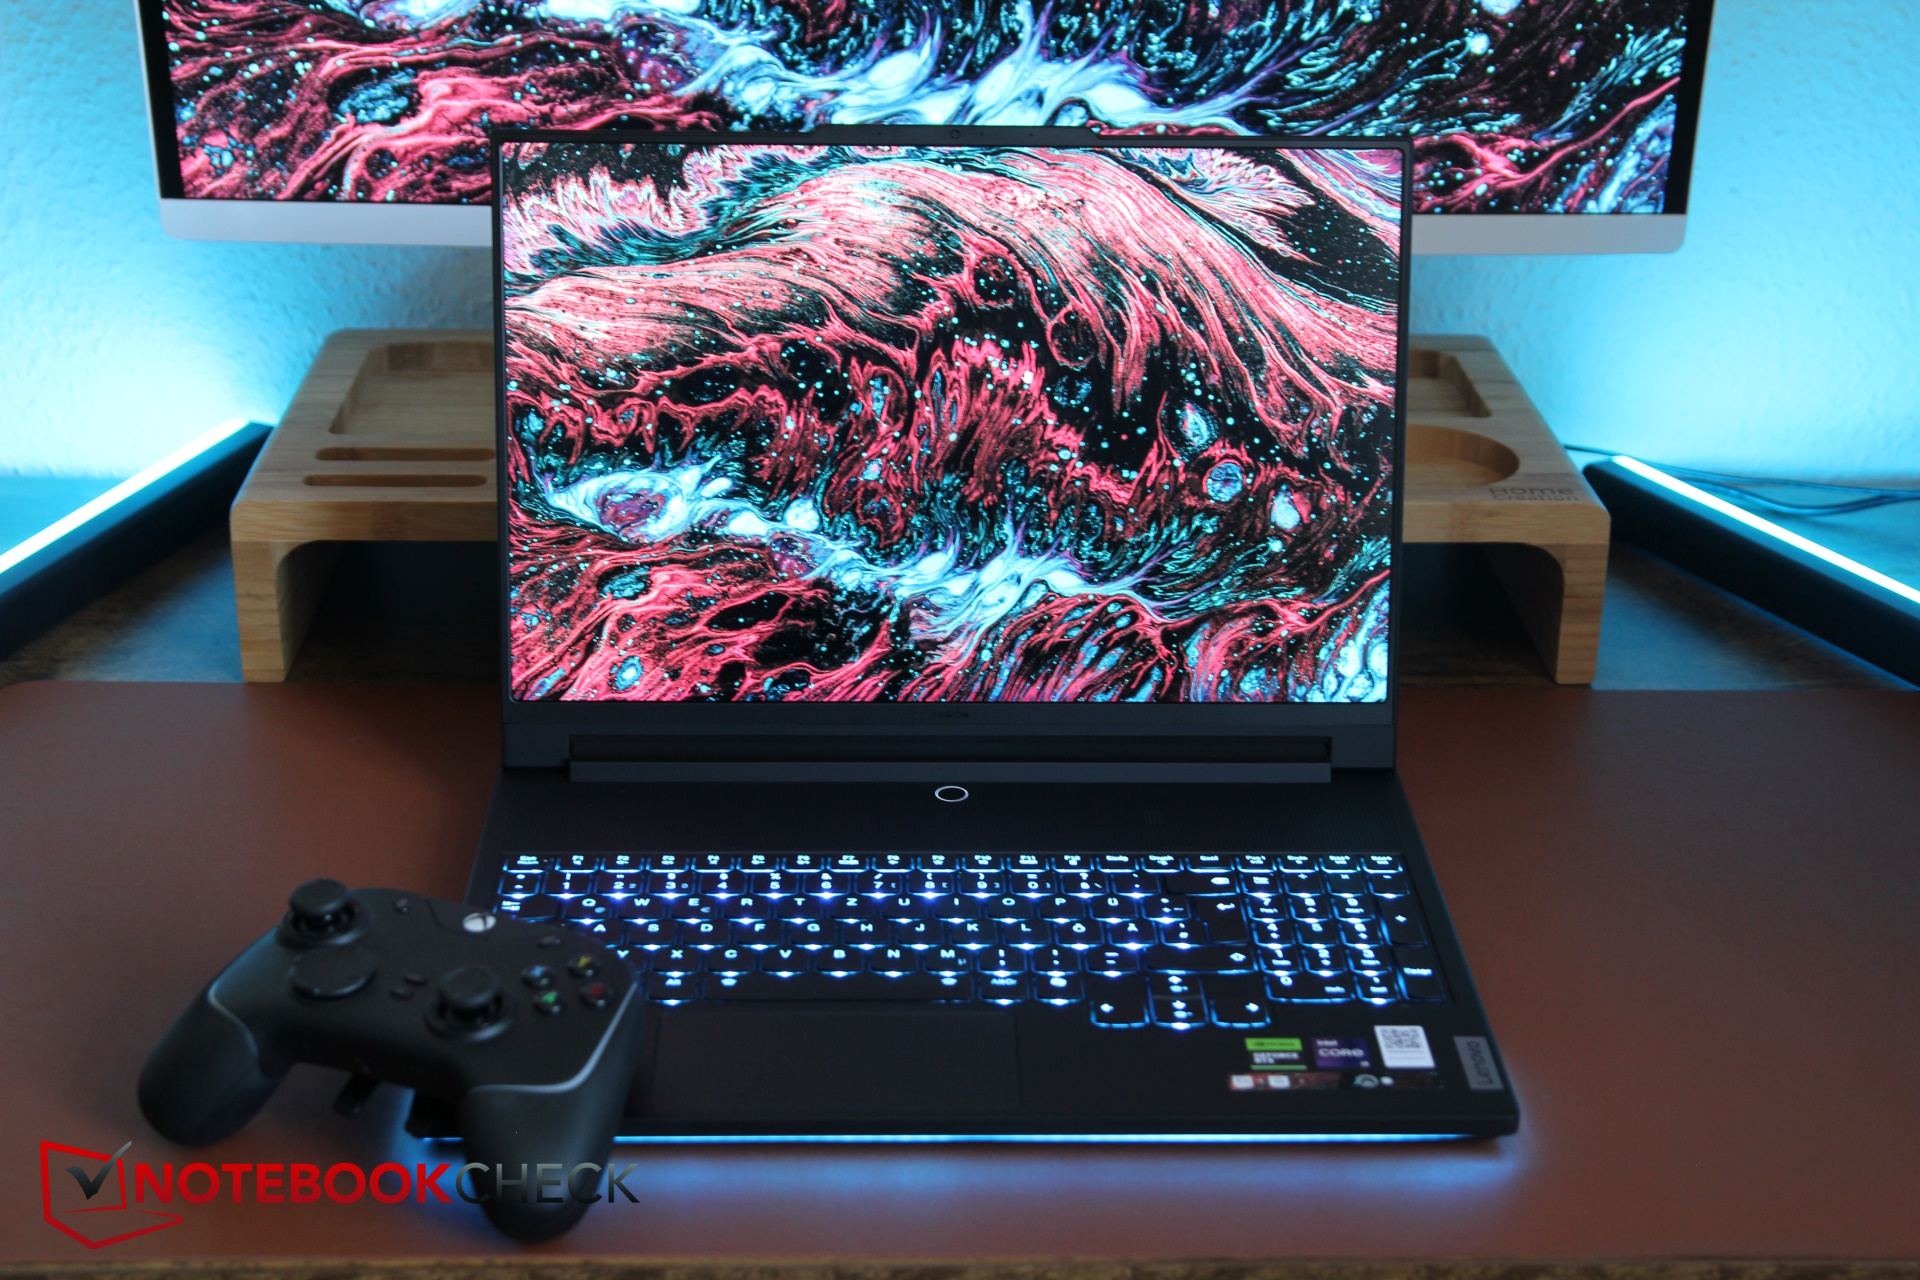
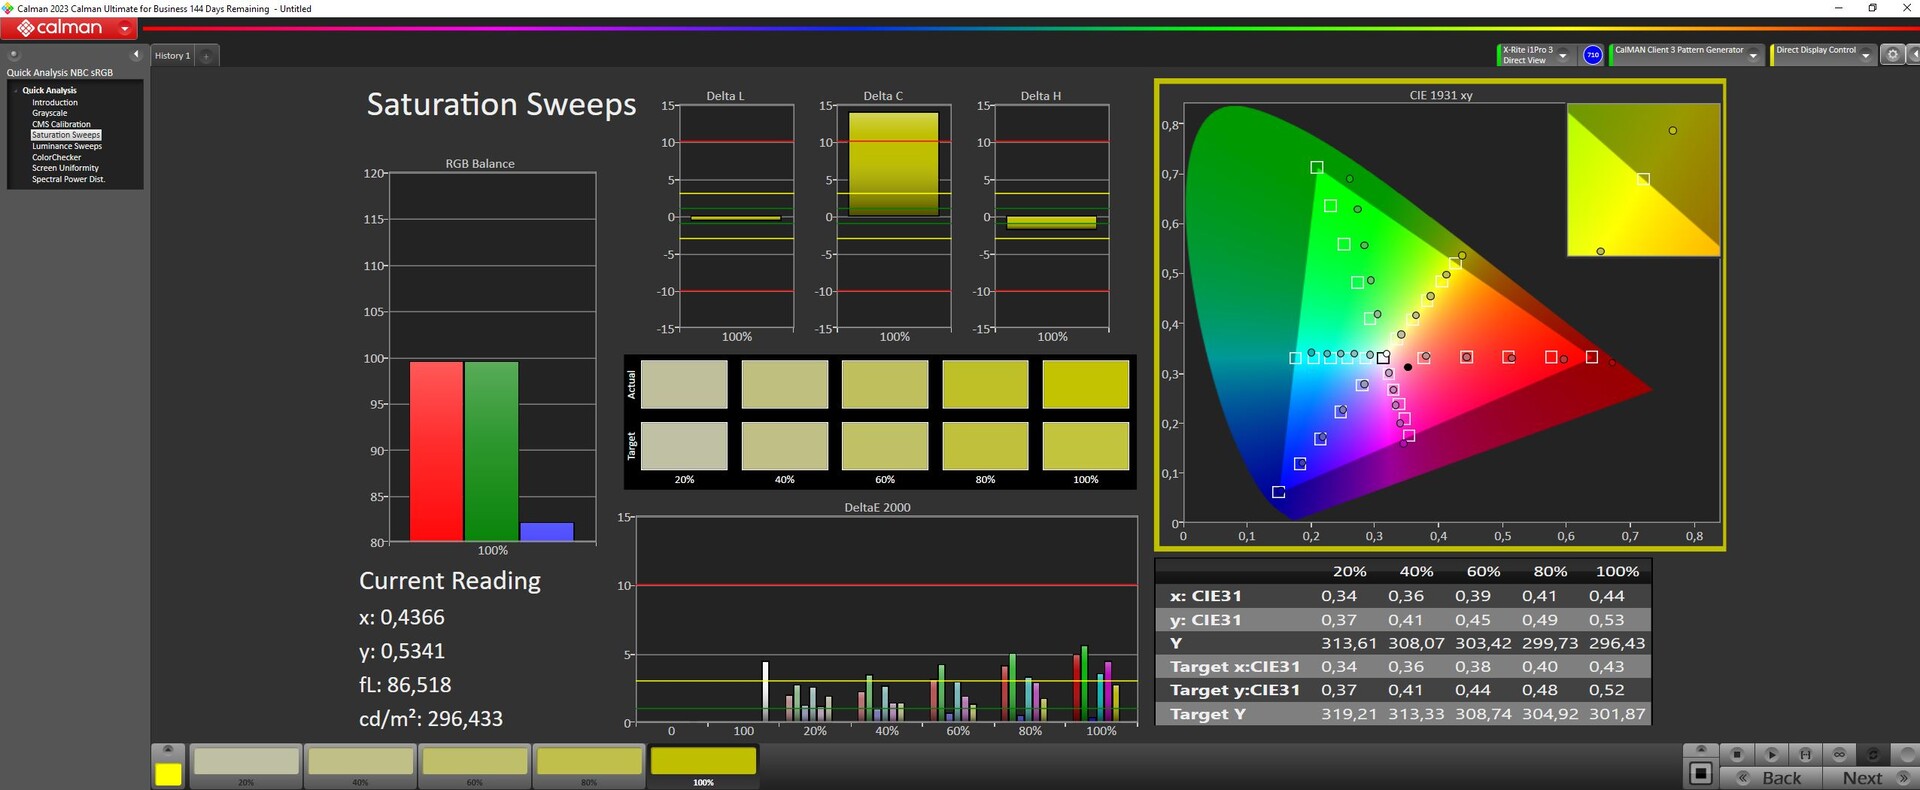
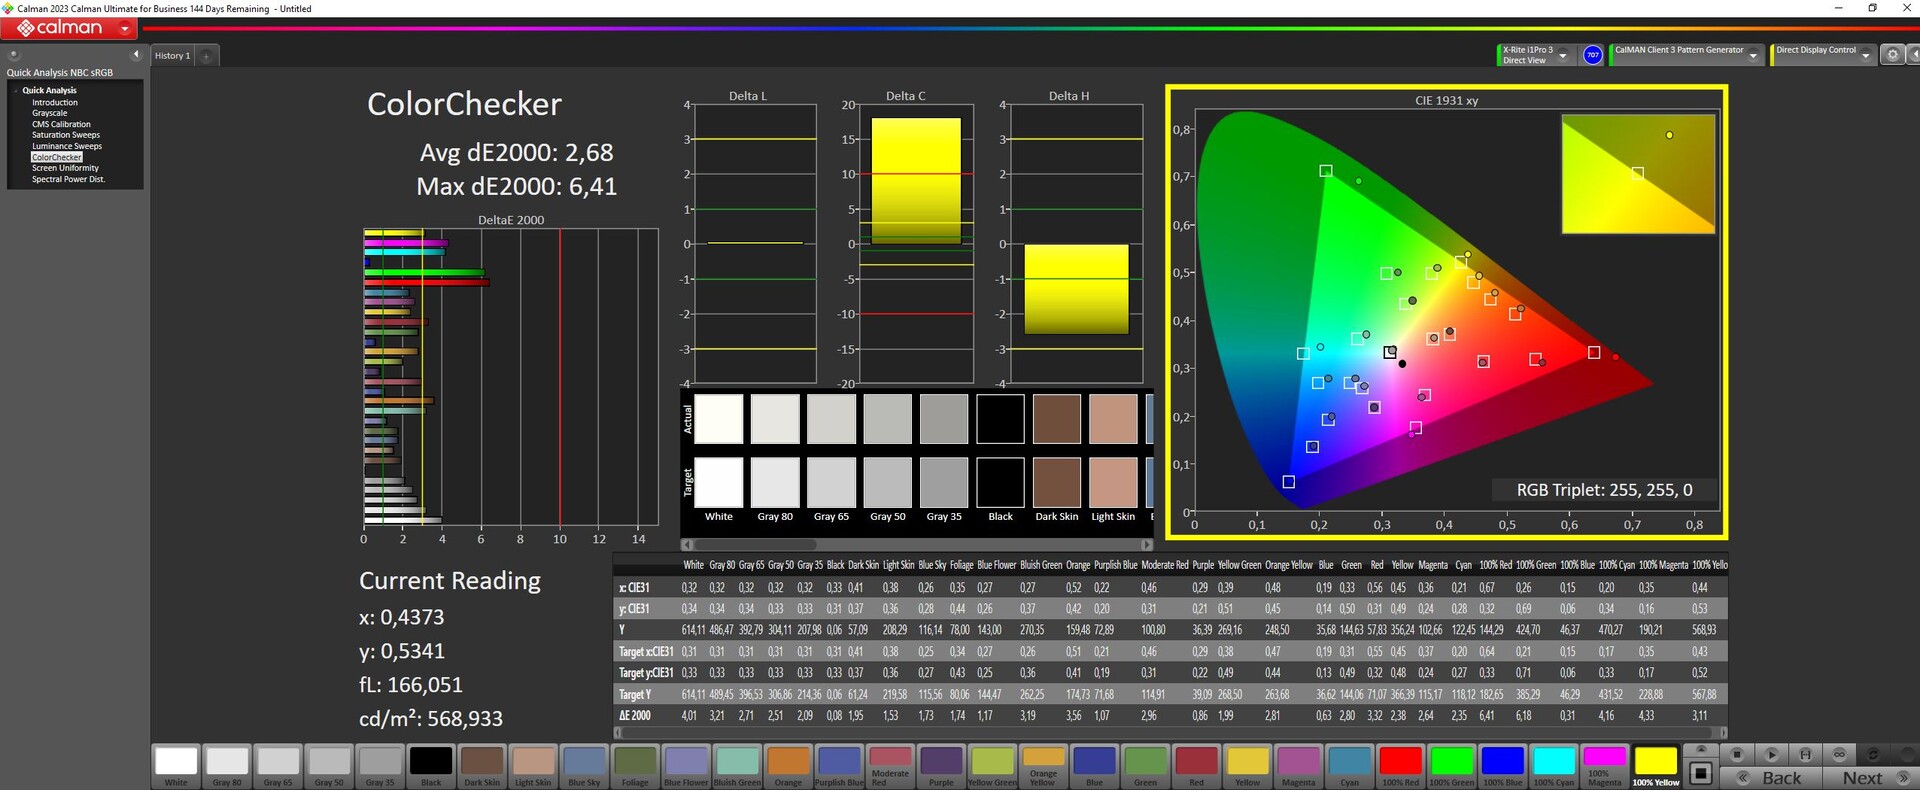
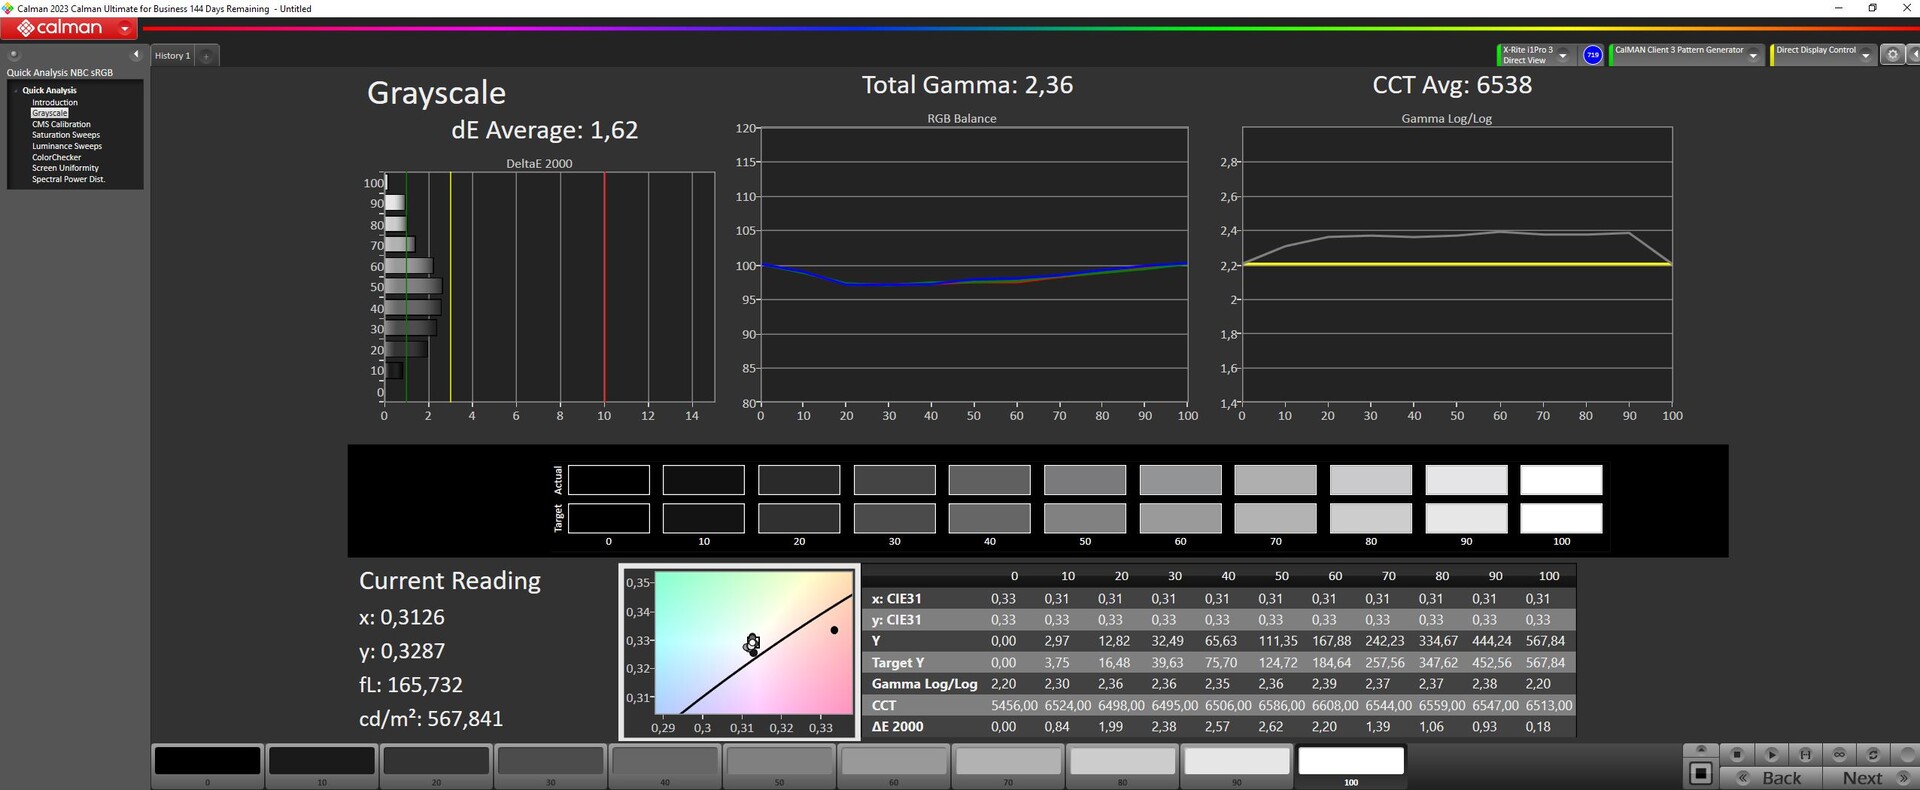
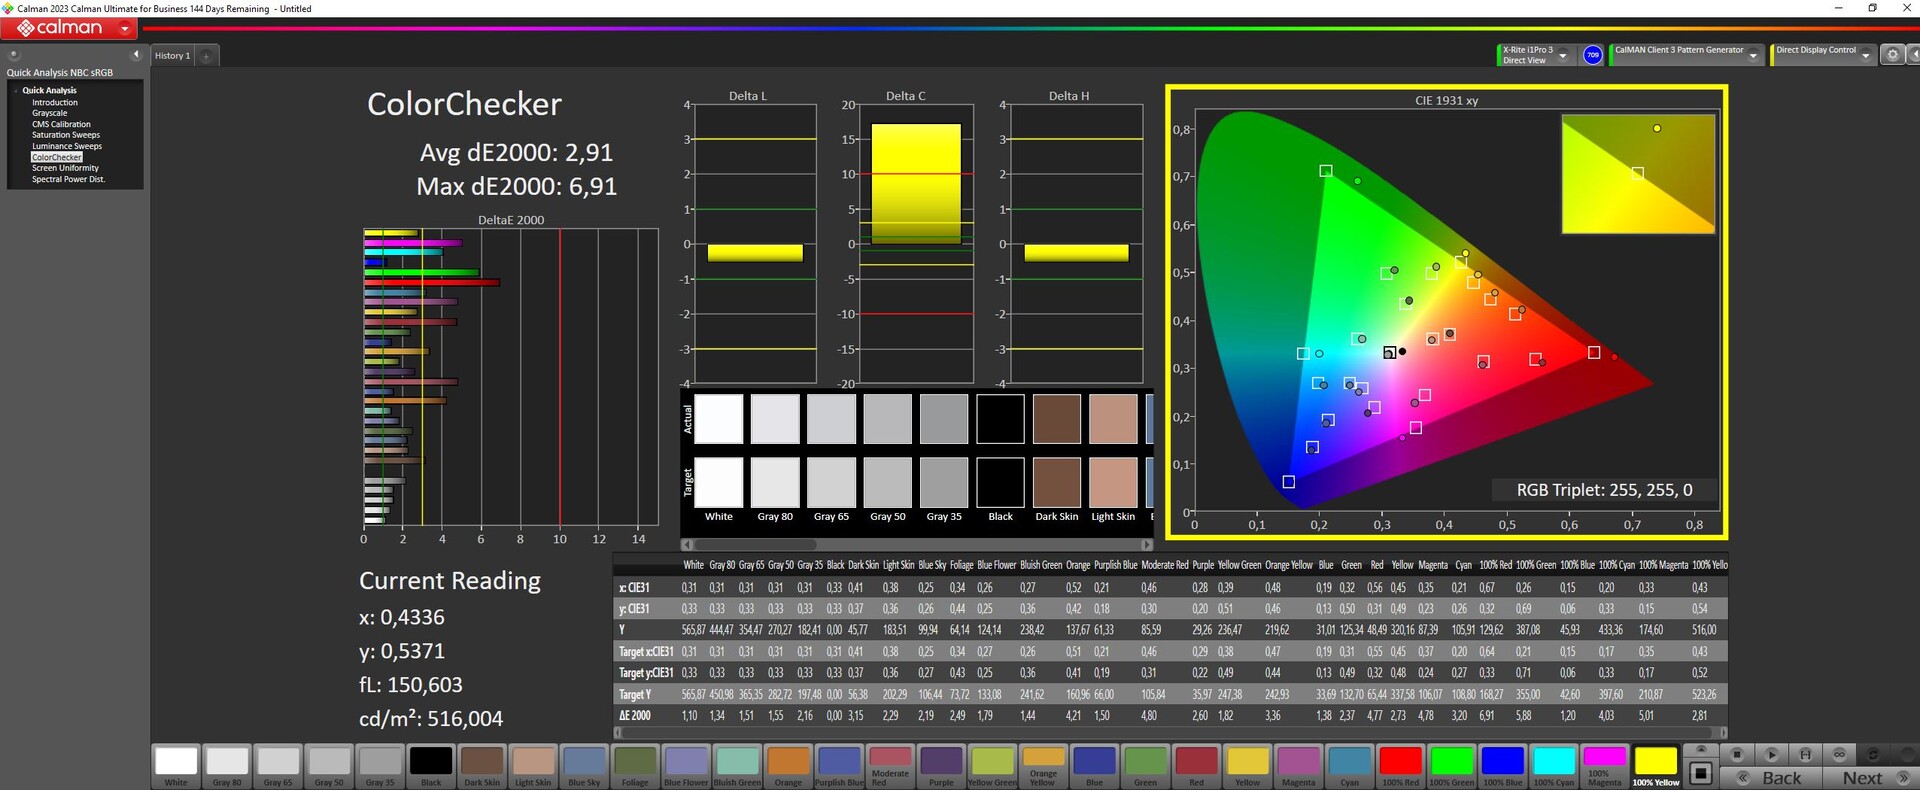
The 16-inch 3.2K (3,200 x 2,000) mini LED display with Dolby Vision and G-Sync is still one of the main attractions inside the Legion 9. It is said to have a brightness of up to 1,200 nits and therefore meets the HDR 1000 standard. We actually measured more than 1,000 nits in HDR mode.
In SD mode with better color accuracy, the display still shines at an average of 664 nits! At 43 per cent screen brightness, its brightness value is around 150 nits, which is the value we use for some of our battery tests. Its black level is excellent thanks to the mini LEDs that can be switched off in many zones, which leads to very high contrasts.
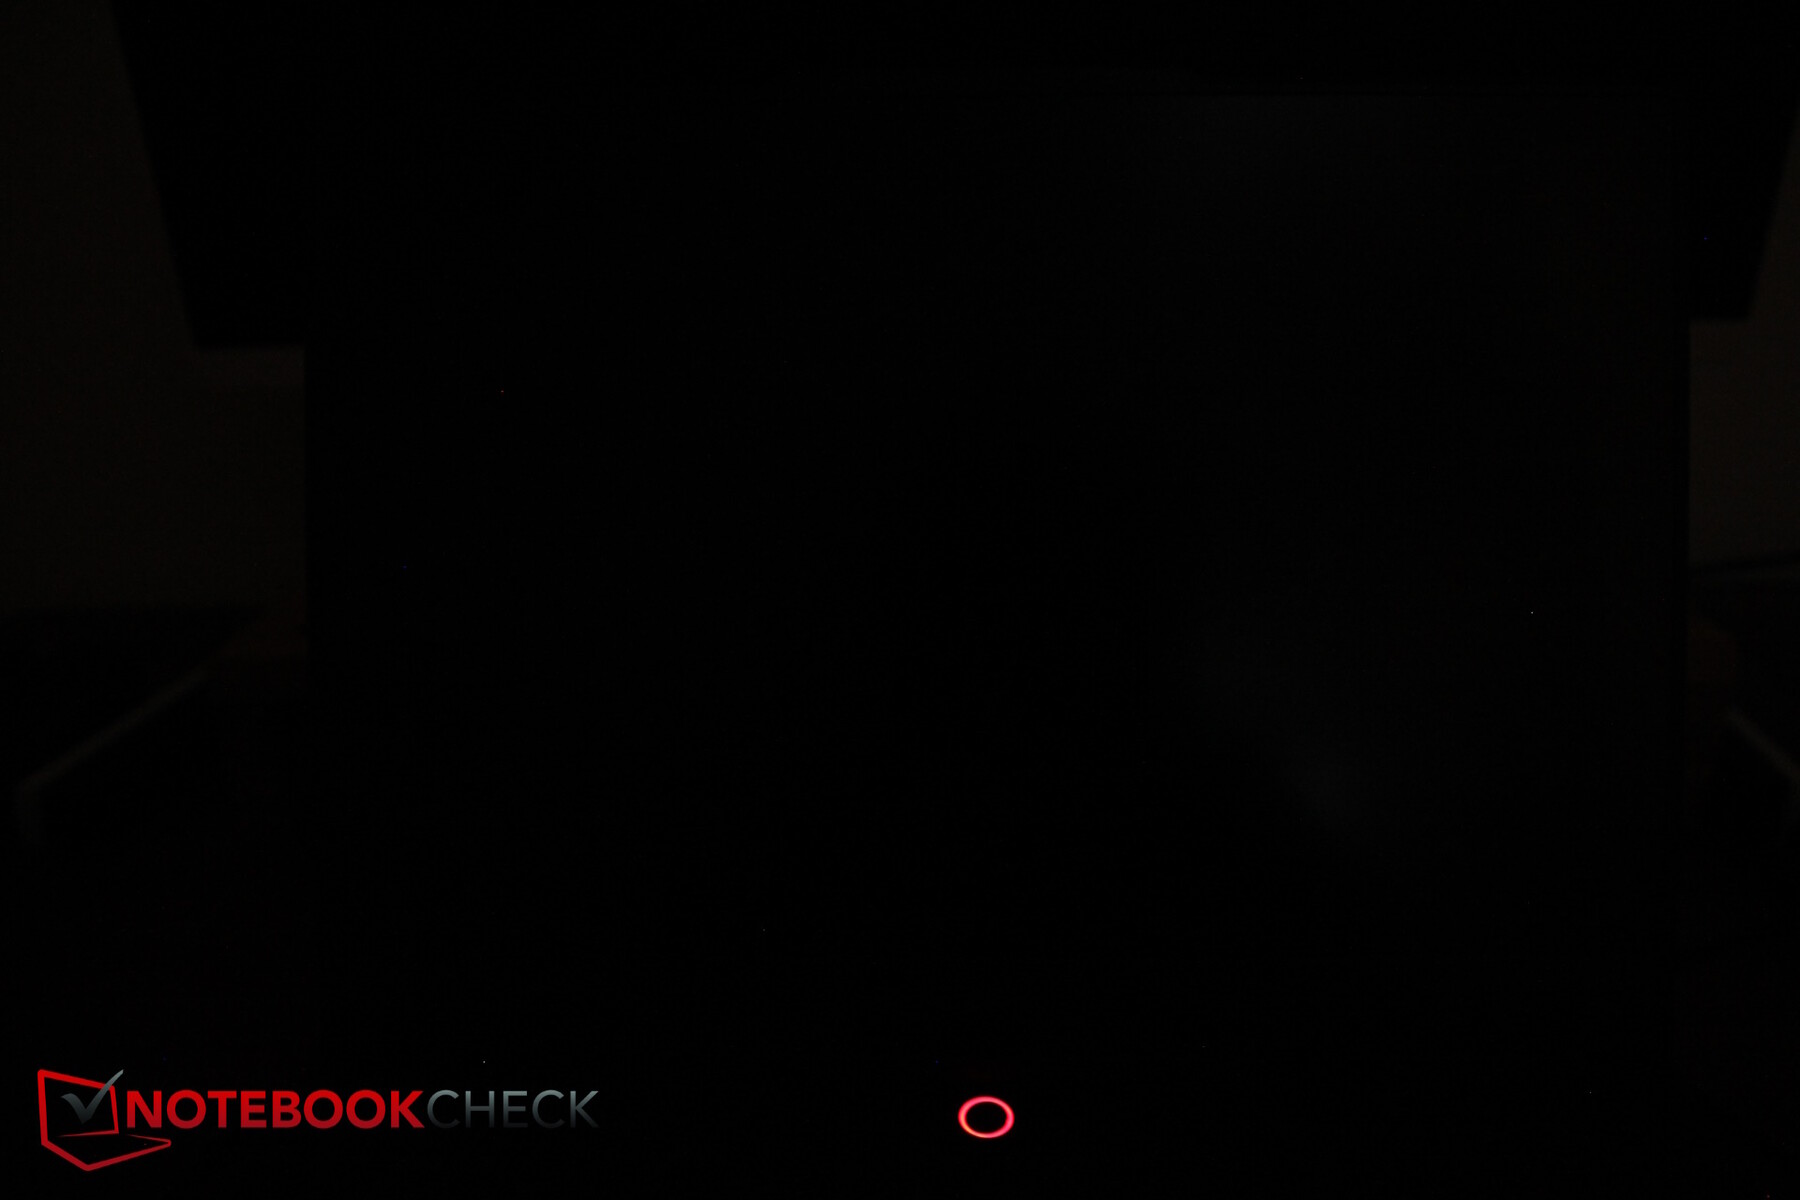
There is no backlight bleeding at all and its response times are also sufficiently fast, although not quite at OLED level of course. We could measure PWM, albeit at a fairly high frequency of 5 kHz to 40 kHz, which should not be a problem even for sensitive people.
| |||||||||||||||||||||||||
Brightness Distribution: 91 %
Center on Battery: 630 cd/m²
Contrast: 21033:1 (Black: 0.03 cd/m²)
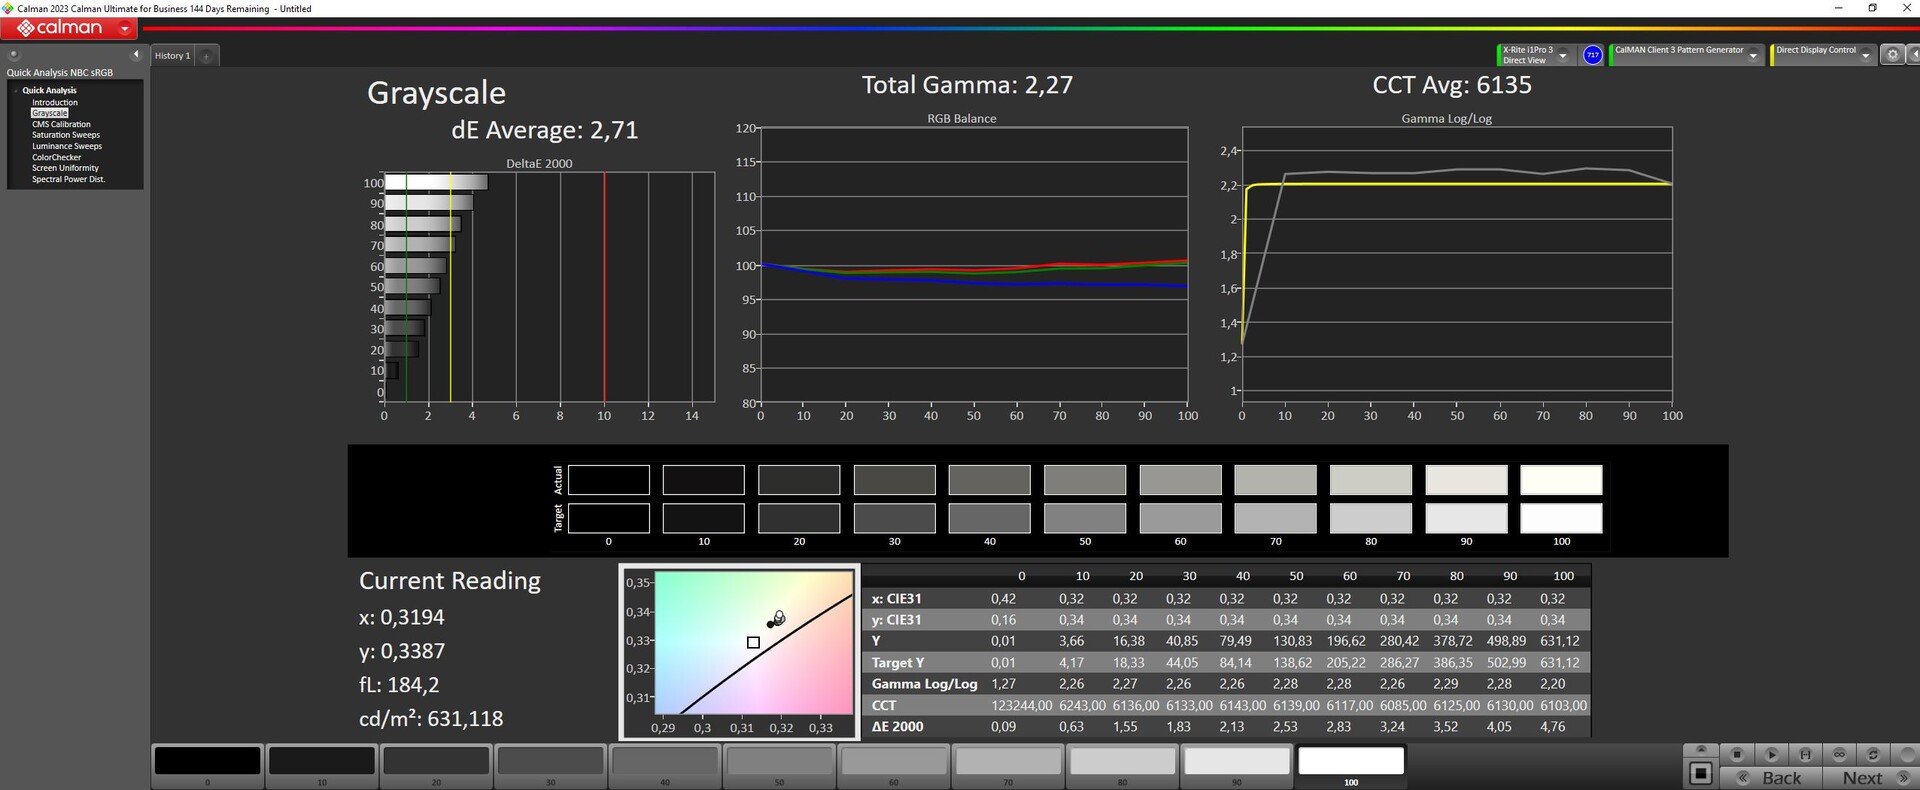
ΔE ColorChecker Calman: 2.68 | ∀{0.5-29.43 Ø4.73}
calibrated: 2.68
ΔE Greyscale Calman: 2.71 | ∀{0.09-98 Ø4.97}
86.6% AdobeRGB 1998 (Argyll 3D)
99.9% sRGB (Argyll 3D)
95.3% Display P3 (Argyll 3D)
Gamma: 2.27
CCT: 6135 K
| Lenovo Legion 9 16IRX9, RTX 4090 CSOT T3 MNG007ZA2-2, MiniLED, 3200x2000, 16" | Lenovo Legion 9 16IRX8 CSOT T3 MNG007ZA2-2, Mini-LED, 3200x2000, 16" | Razer Blade 16 2024, RTX 4090 Samsung SDC41AB (ATNA60DL03-0), OLED, 2560x1600, 16" | Alienware m18 R2 BOE NE18NZ1, IPS, 2560x1600, 18" | Asus ROG Strix Scar 18 G834JYR (2024) BOE NE180QDM-NM1, Mini LED, 2560x1600, 18" | Medion Erazer Beast X40 2024 BOE NE170QDM-NZ1, IPS, 2560x1600, 17" | |
|---|---|---|---|---|---|---|
| Display | 1% | 5% | 2% | 3% | -16% | |
| Display P3 Coverage (%) | 95.3 | 97.2 2% | 99.1 4% | 97.8 3% | 99.9 5% | 68.1 -29% |
| sRGB Coverage (%) | 99.9 | 99.9 0% | 99.9 0% | 99.5 0% | 100 0% | 99.5 0% |
| AdobeRGB 1998 Coverage (%) | 86.6 | 87 0% | 95.6 10% | 88.9 3% | 90 4% | 69 -20% |
| Response Times | -11% | 97% | 27% | -1% | 19% | |
| Response Time Grey 50% / Grey 80% * (ms) | 12.6 ? | 13.3 ? -6% | 0.24 ? 98% | 5.3 ? 58% | 12 ? 5% | 11.7 ? 7% |
| Response Time Black / White * (ms) | 10 ? | 11.6 ? -16% | 0.4 ? 96% | 10.4 ? -4% | 10.7 ? -7% | 6.9 ? 31% |
| PWM Frequency (Hz) | 5430 | 4742 | 960 | 5733 ? | ||
| PWM Amplitude * (%) | 8 | |||||
| Screen | -0% | 21% | -107% | 14% | -136% | |
| Brightness middle (cd/m²) | 631 | 674.9 7% | 418 -34% | 271.8 -57% | 937 48% | 422 -33% |
| Brightness (cd/m²) | 664 | 682 3% | 420 -37% | 275 -59% | 934 41% | 388 -42% |
| Brightness Distribution (%) | 91 | 96 5% | 98 8% | 78 -14% | 89 -2% | 87 -4% |
| Black Level * (cd/m²) | 0.03 | 0.04 -33% | 0.02 33% | 0.27 -800% | 0.066 -120% | 0.42 -1300% |
| Contrast (:1) | 21033 | 16873 -20% | 20900 -1% | 1007 -95% | 14197 -33% | 1005 -95% |
| Colorchecker dE 2000 * | 2.68 | 2.56 4% | 1.07 60% | 2.48 7% | 1.52 43% | 1.42 47% |
| Colorchecker dE 2000 max. * | 6.41 | 4.16 35% | 4.04 37% | 5.59 13% | 2.82 56% | 1.97 69% |
| Colorchecker dE 2000 calibrated * | 2.68 | 2.47 8% | 1.07 60% | 0.56 79% | 1.21 55% | 0.7 74% |
| Greyscale dE 2000 * | 2.71 | 3 -11% | 1.12 59% | 3.7 -37% | 1.7 37% | 1.2 56% |
| Gamma | 2.27 97% | 2.38 92% | 2.29 96% | 2.2 100% | 2.042 108% | 2.078 106% |
| CCT | 6135 106% | 6799 96% | 6417 101% | 6355 102% | 6578 99% | 6581 99% |
| Total Average (Program / Settings) | -3% /
-2% | 41% /
28% | -26% /
-65% | 5% /
9% | -44% /
-89% |
* ... smaller is better
DisplayP3 is covered by around 95 per cent, sRGB completely and AdobeRGB by 86 to 87 per cent.
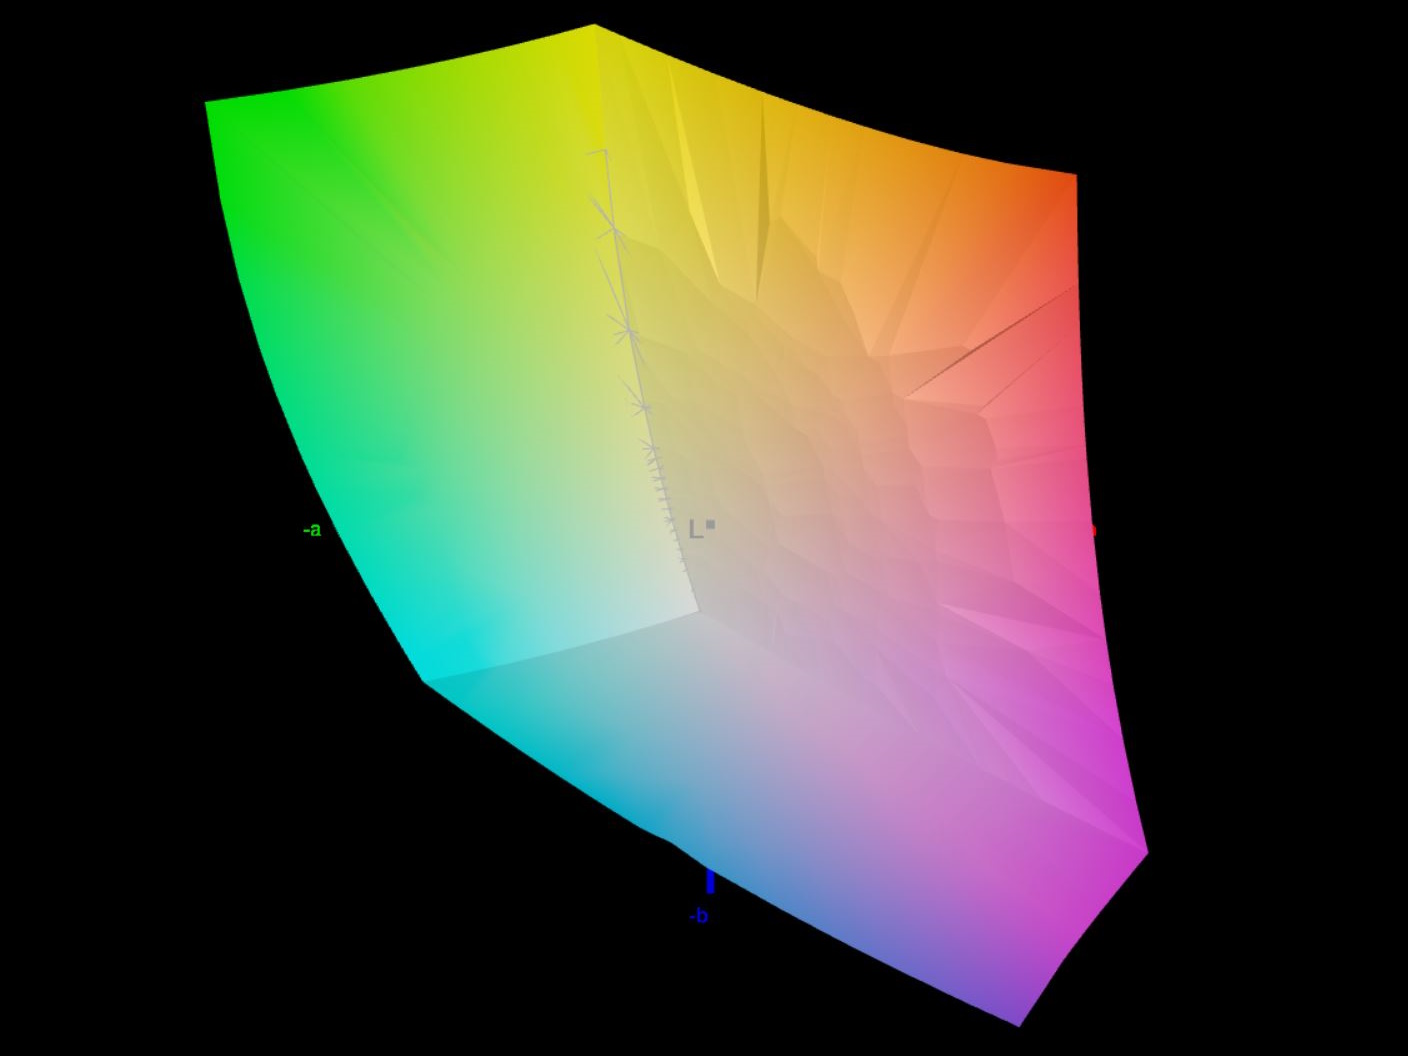
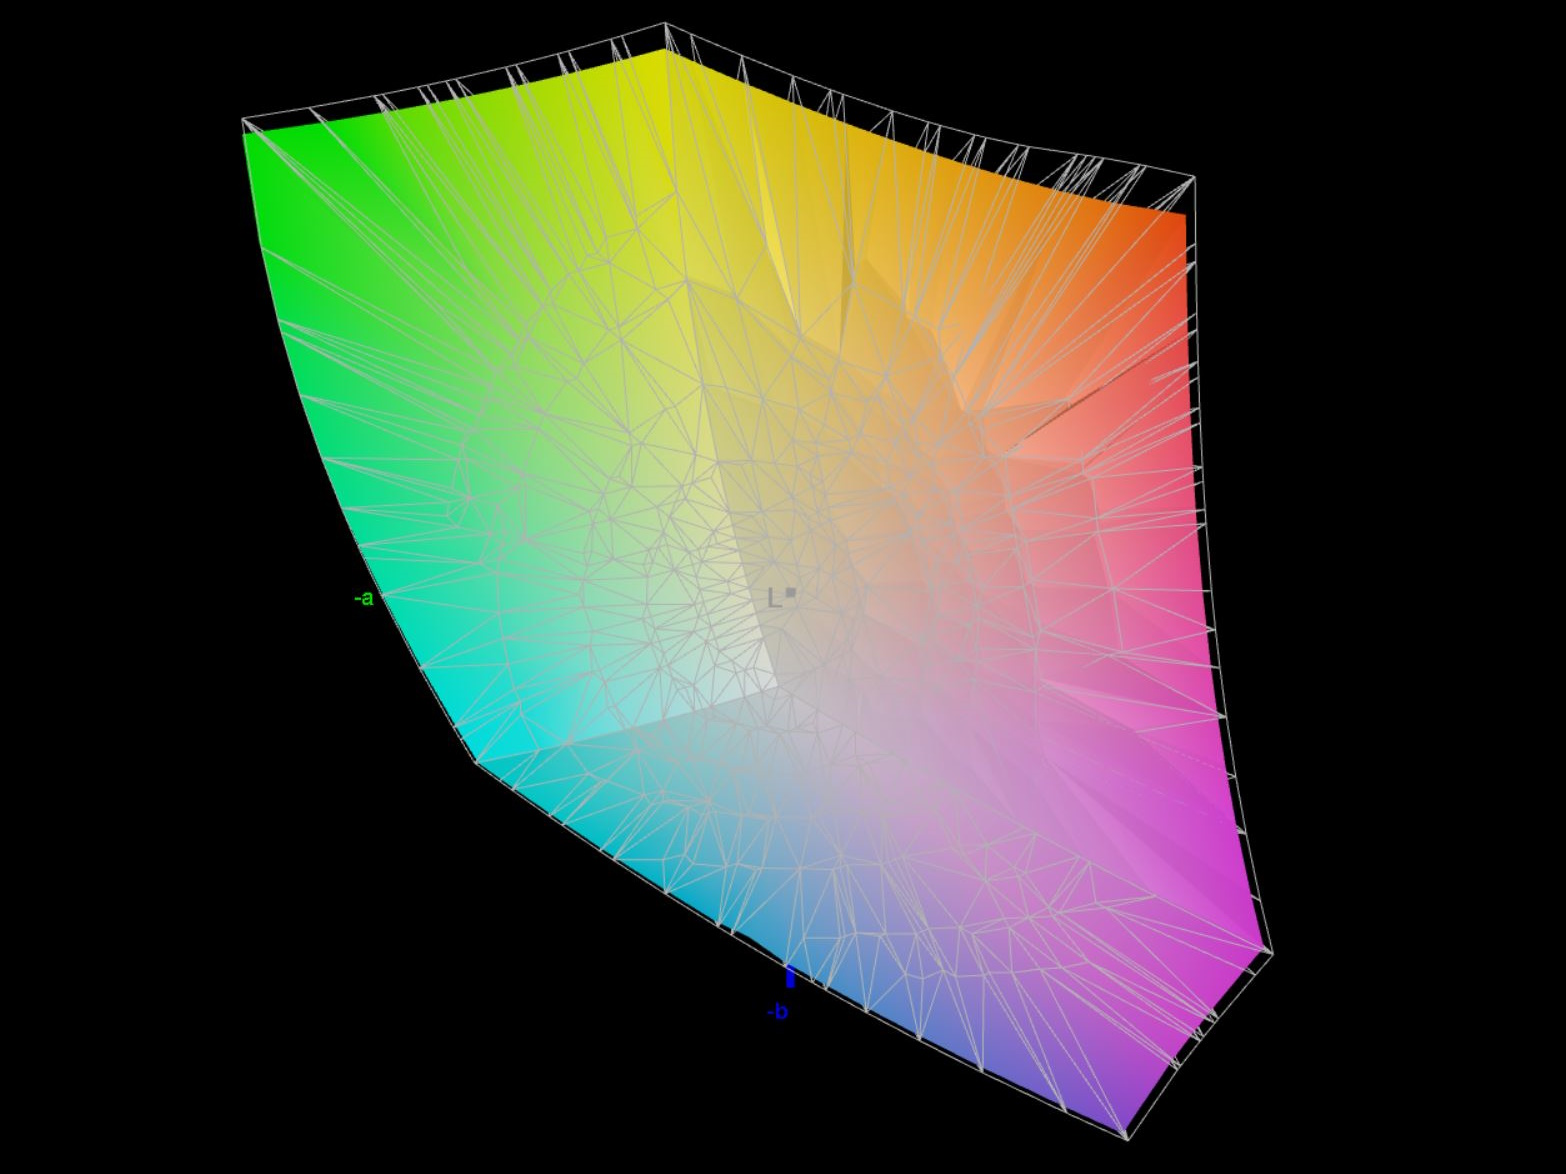
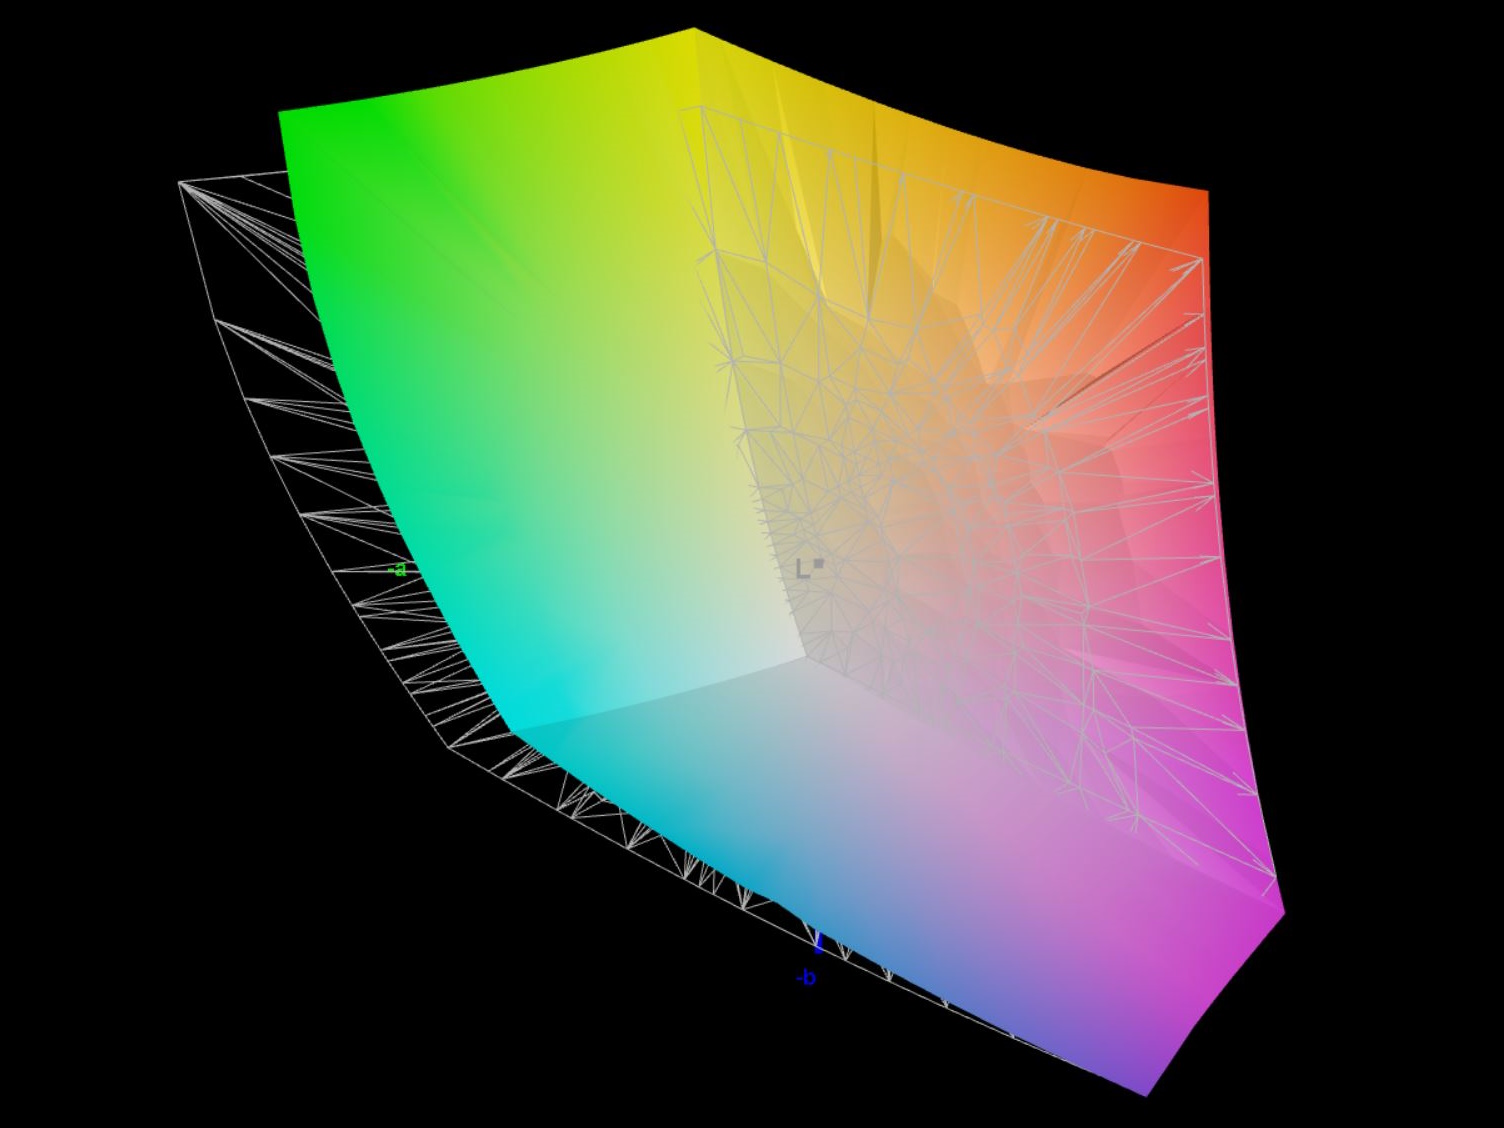
Ex works, the display is properly calibrated against the P3 standard. Our recalibration improved its grayscale DeltaE values but worsened its ClocChecker DeltaE values, which is why it is not worth the effort. However, its color deviations aren't ideal with an average of 2.68 and outliers of up to 6.41.

Display Response Times
| ↔ Response Time Black to White | ||
|---|---|---|
| 10 ms ... rise ↗ and fall ↘ combined | ↗ 5.2 ms rise | 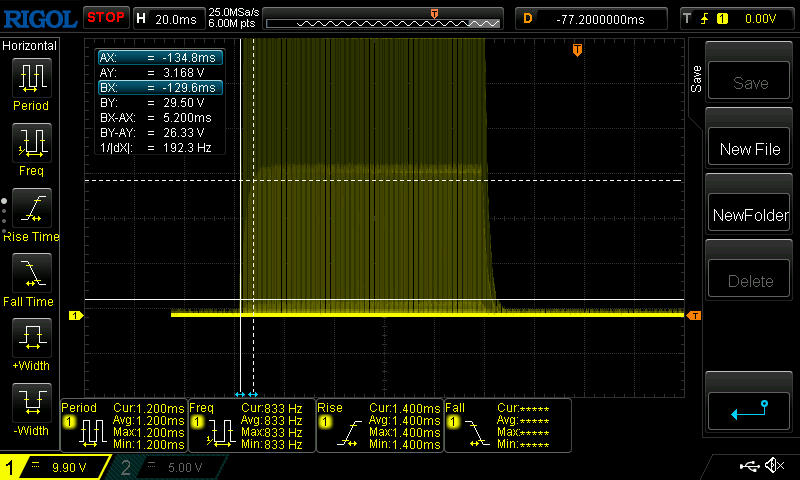 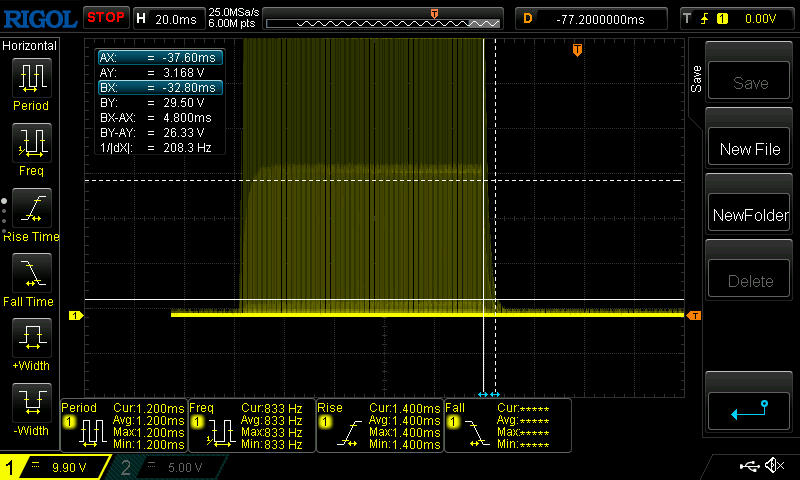 |
| ↘ 4.8 ms fall | ||
| The screen shows good response rates in our tests, but may be too slow for competitive gamers. In comparison, all tested devices range from 0.1 (minimum) to 240 (maximum) ms. » 27 % of all devices are better. This means that the measured response time is better than the average of all tested devices (19.9 ms). | ||
| ↔ Response Time 50% Grey to 80% Grey | ||
| 12.6 ms ... rise ↗ and fall ↘ combined | ↗ 6.6 ms rise | 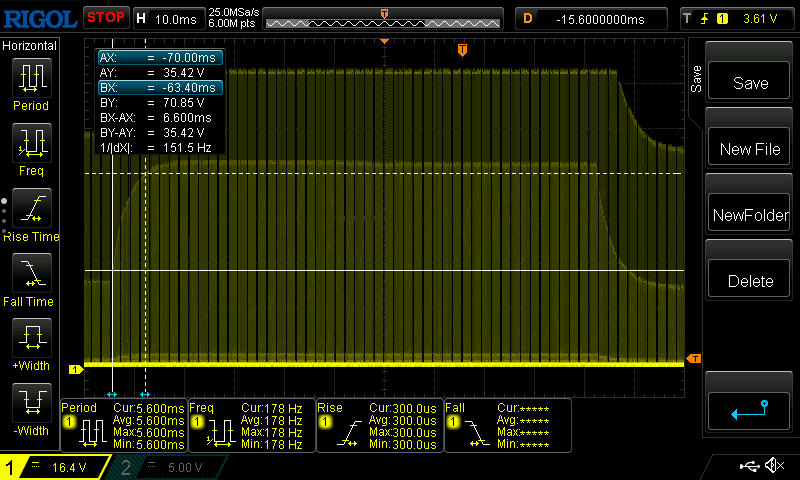 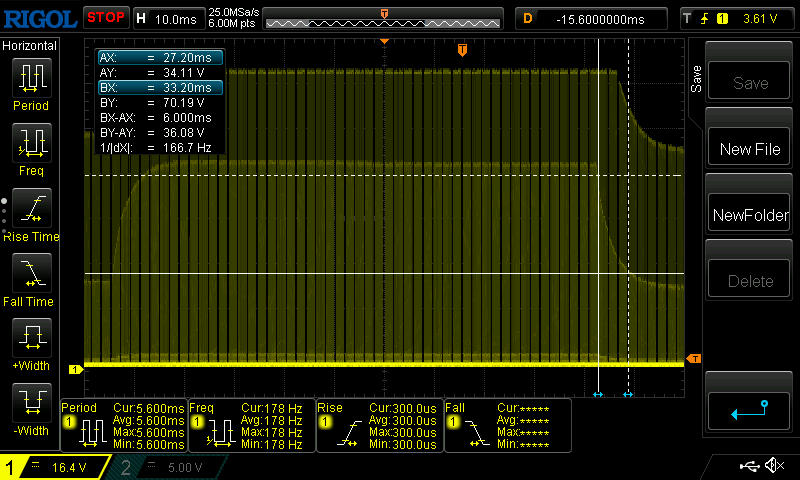 |
| ↘ 6 ms fall | ||
| The screen shows good response rates in our tests, but may be too slow for competitive gamers. In comparison, all tested devices range from 0.165 (minimum) to 636 (maximum) ms. » 26 % of all devices are better. This means that the measured response time is better than the average of all tested devices (31.1 ms). | ||
Screen Flickering / PWM (Pulse-Width Modulation)
| Screen flickering / PWM detected | 5430 Hz Amplitude: 8 % | |
The display backlight flickers at 5430 Hz (worst case, e.g., utilizing PWM) . The frequency of 5430 Hz is quite high, so most users sensitive to PWM should not notice any flickering. In comparison: 52 % of all tested devices do not use PWM to dim the display. If PWM was detected, an average of 7810 (minimum: 5 - maximum: 343500) Hz was measured. | ||

Outside, its visibility is quite good thanks to the screen's high brightness and matte surface. Even so, direct sunlight should be avoided.

Performance - High, but not without problems
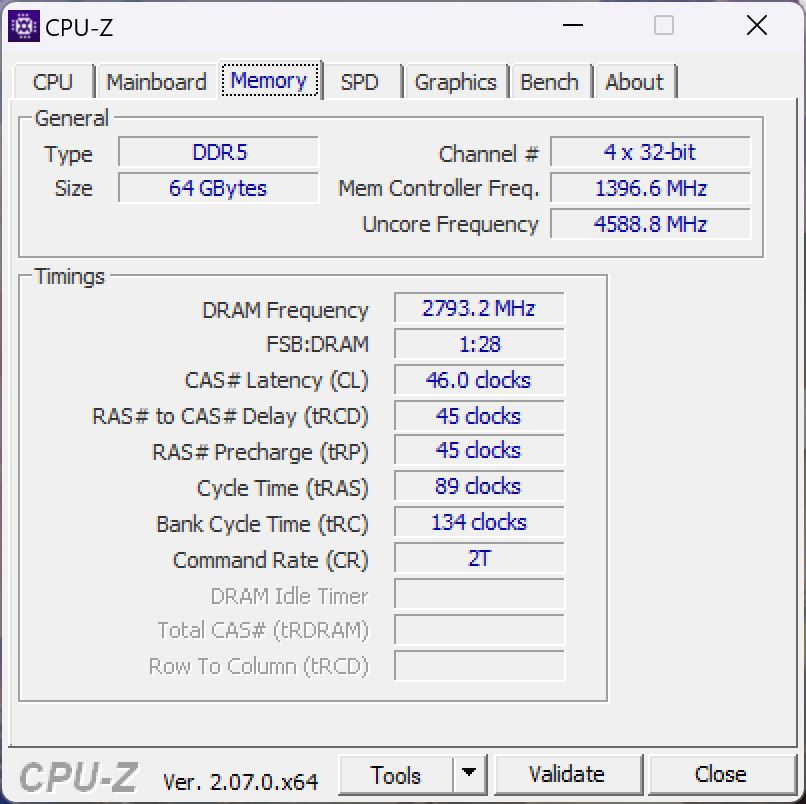
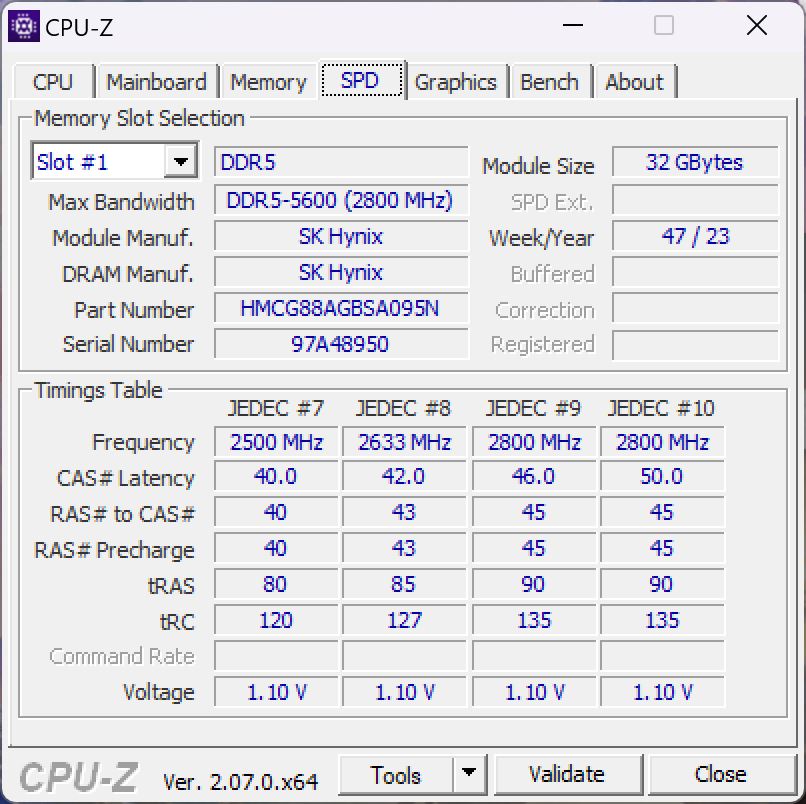
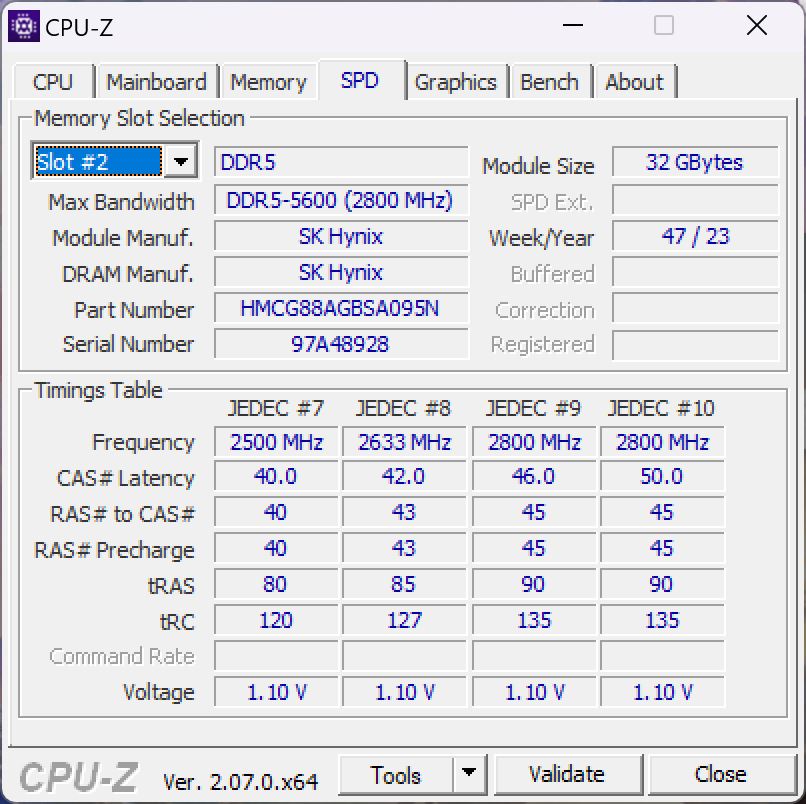
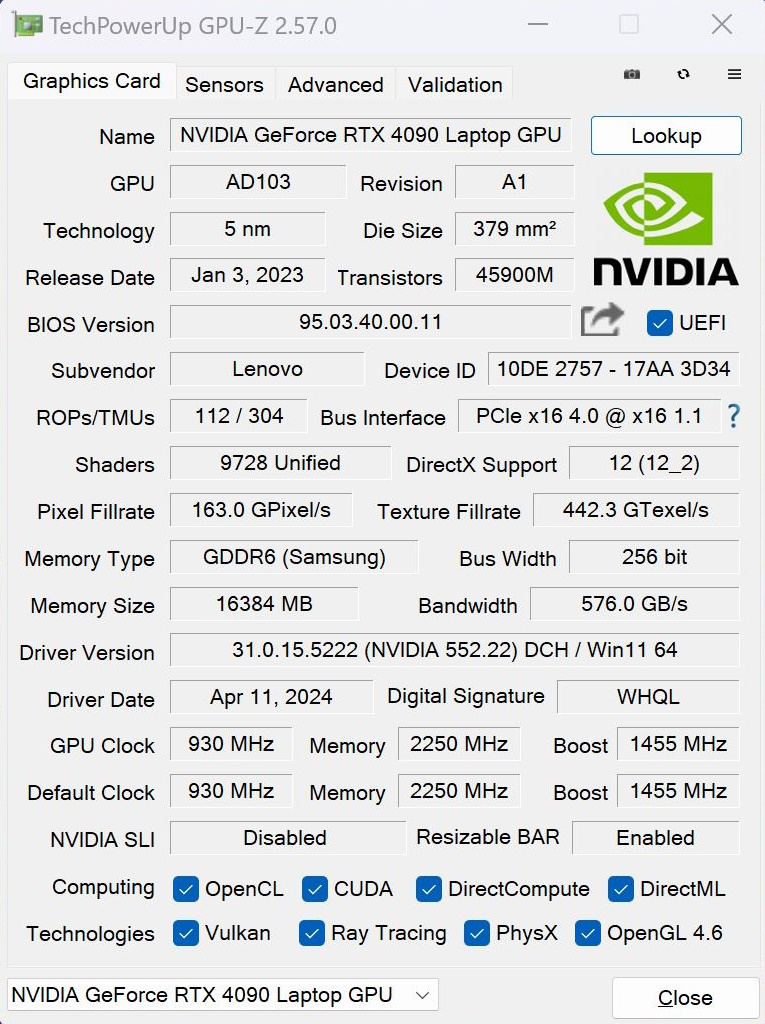
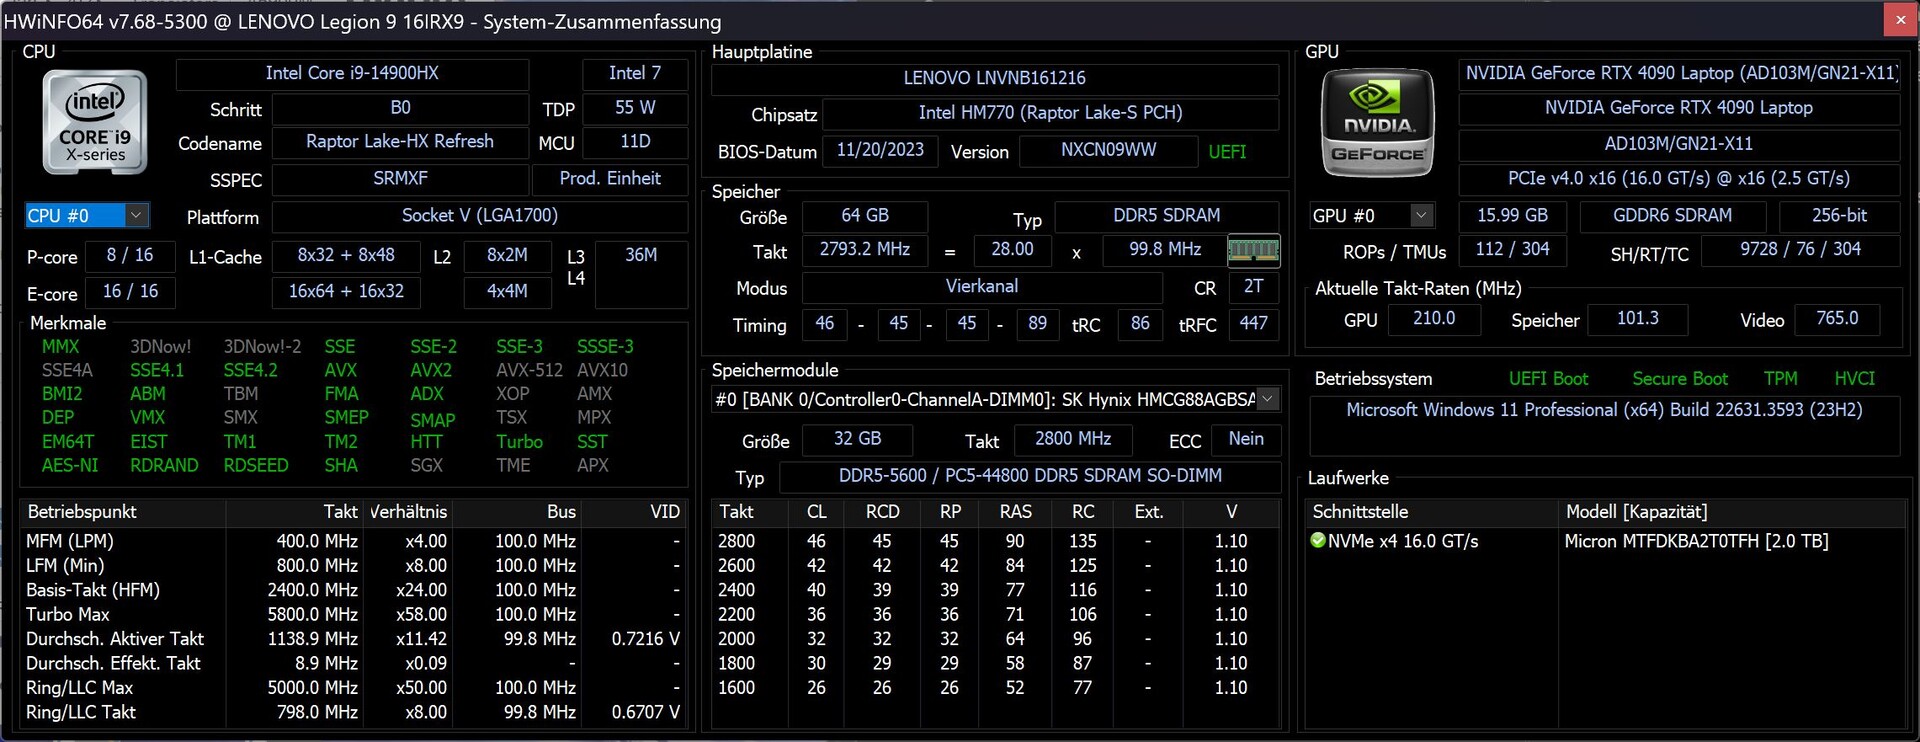
The new i9-14900HX in combination with the powerful RTX 4090 and 64 GB RAM clearly make the Legion 9i a high-end gamer. This is also suggested by its protruding design at the back, which is why creators may look for more subtle alternatives despite the device's potentially high performance.
Testing conditions
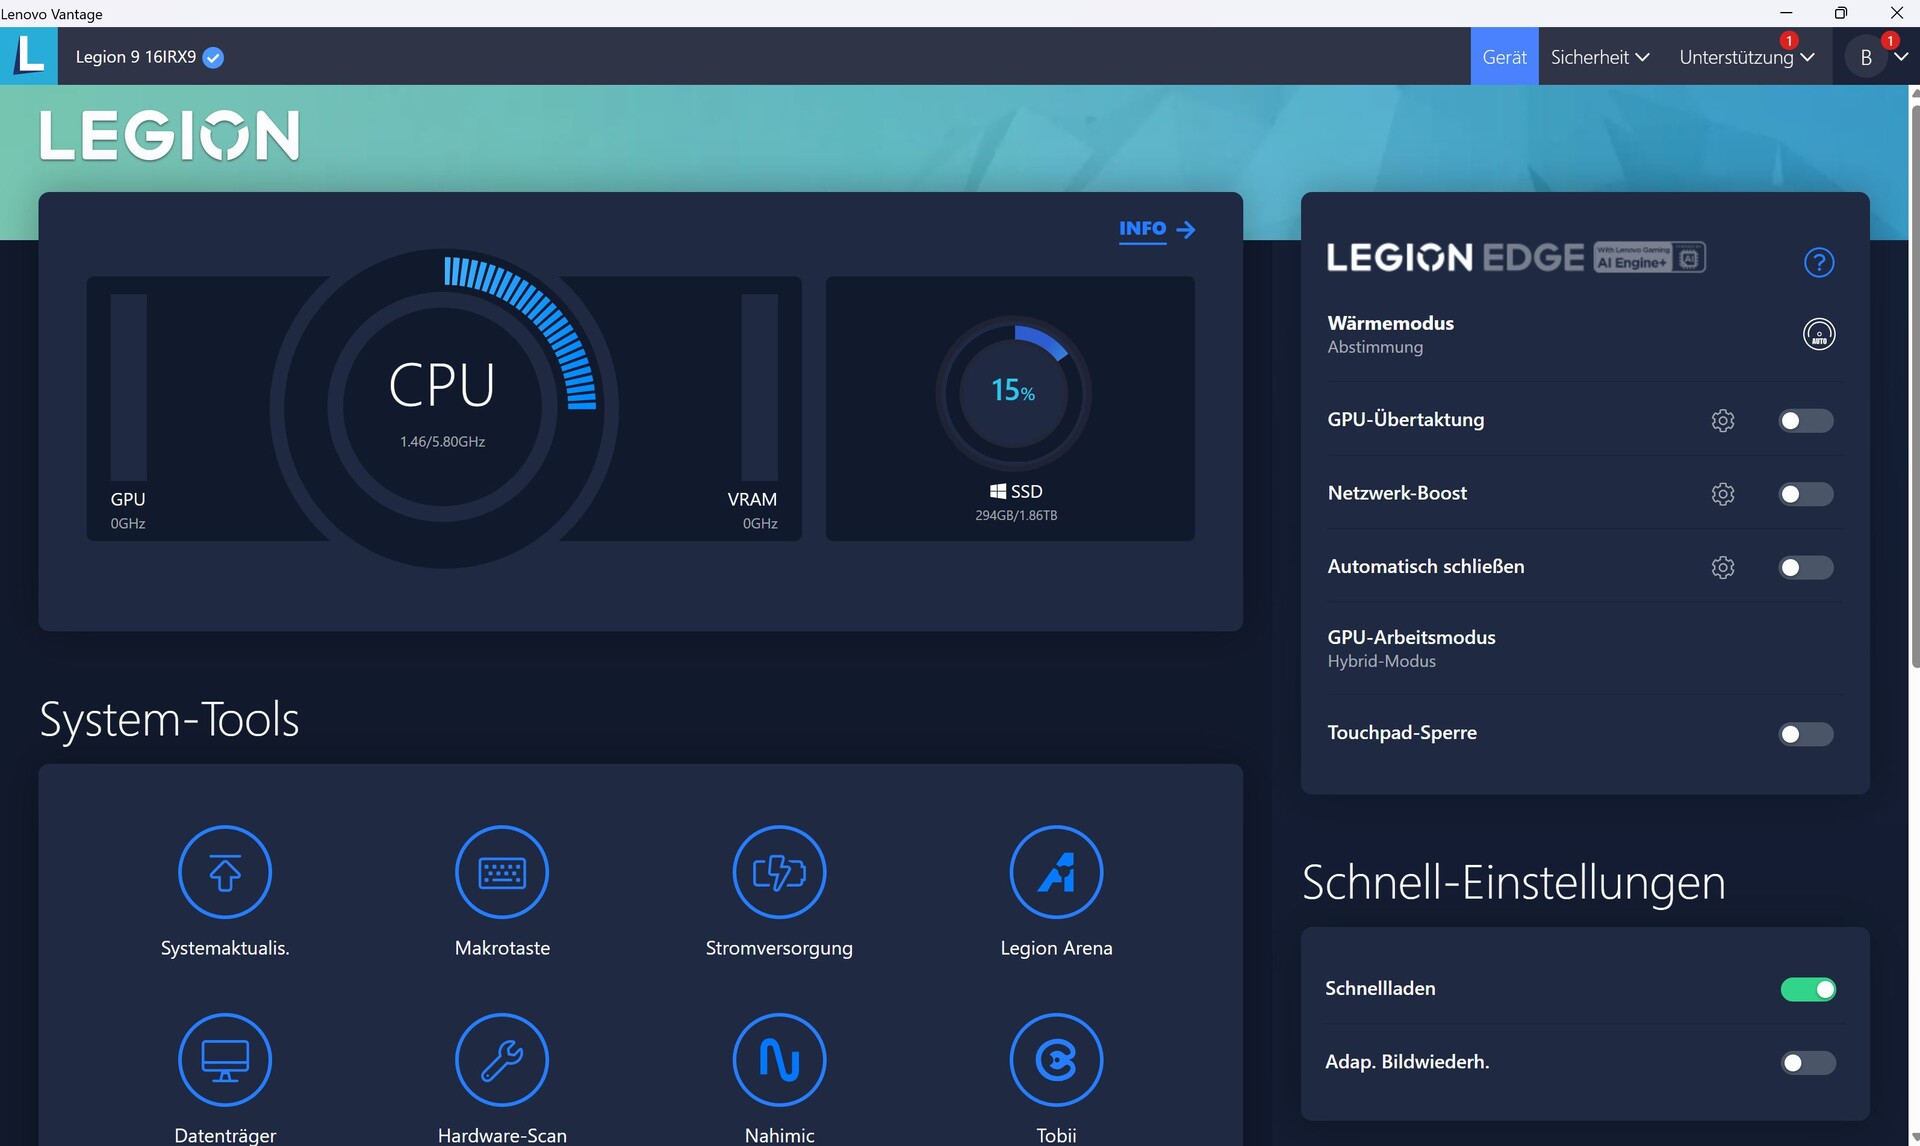
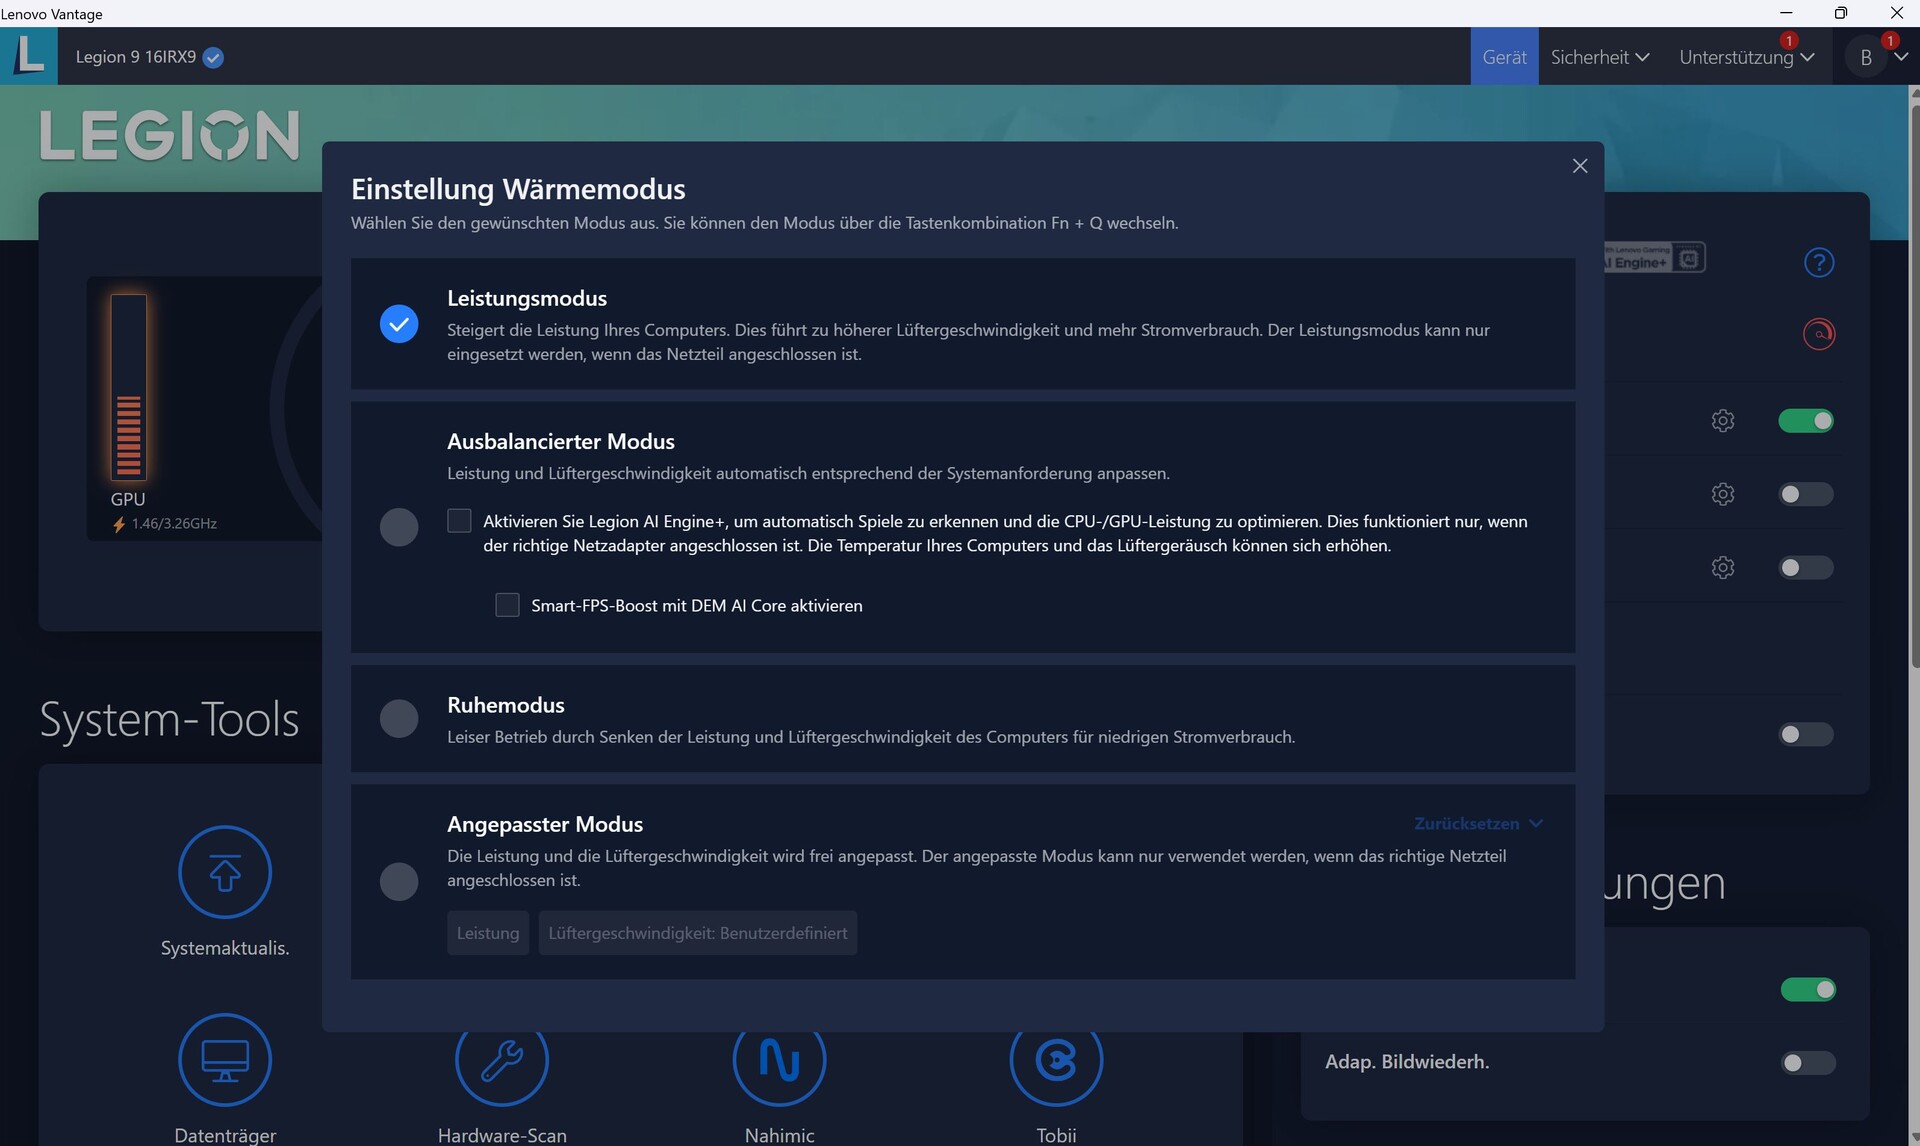
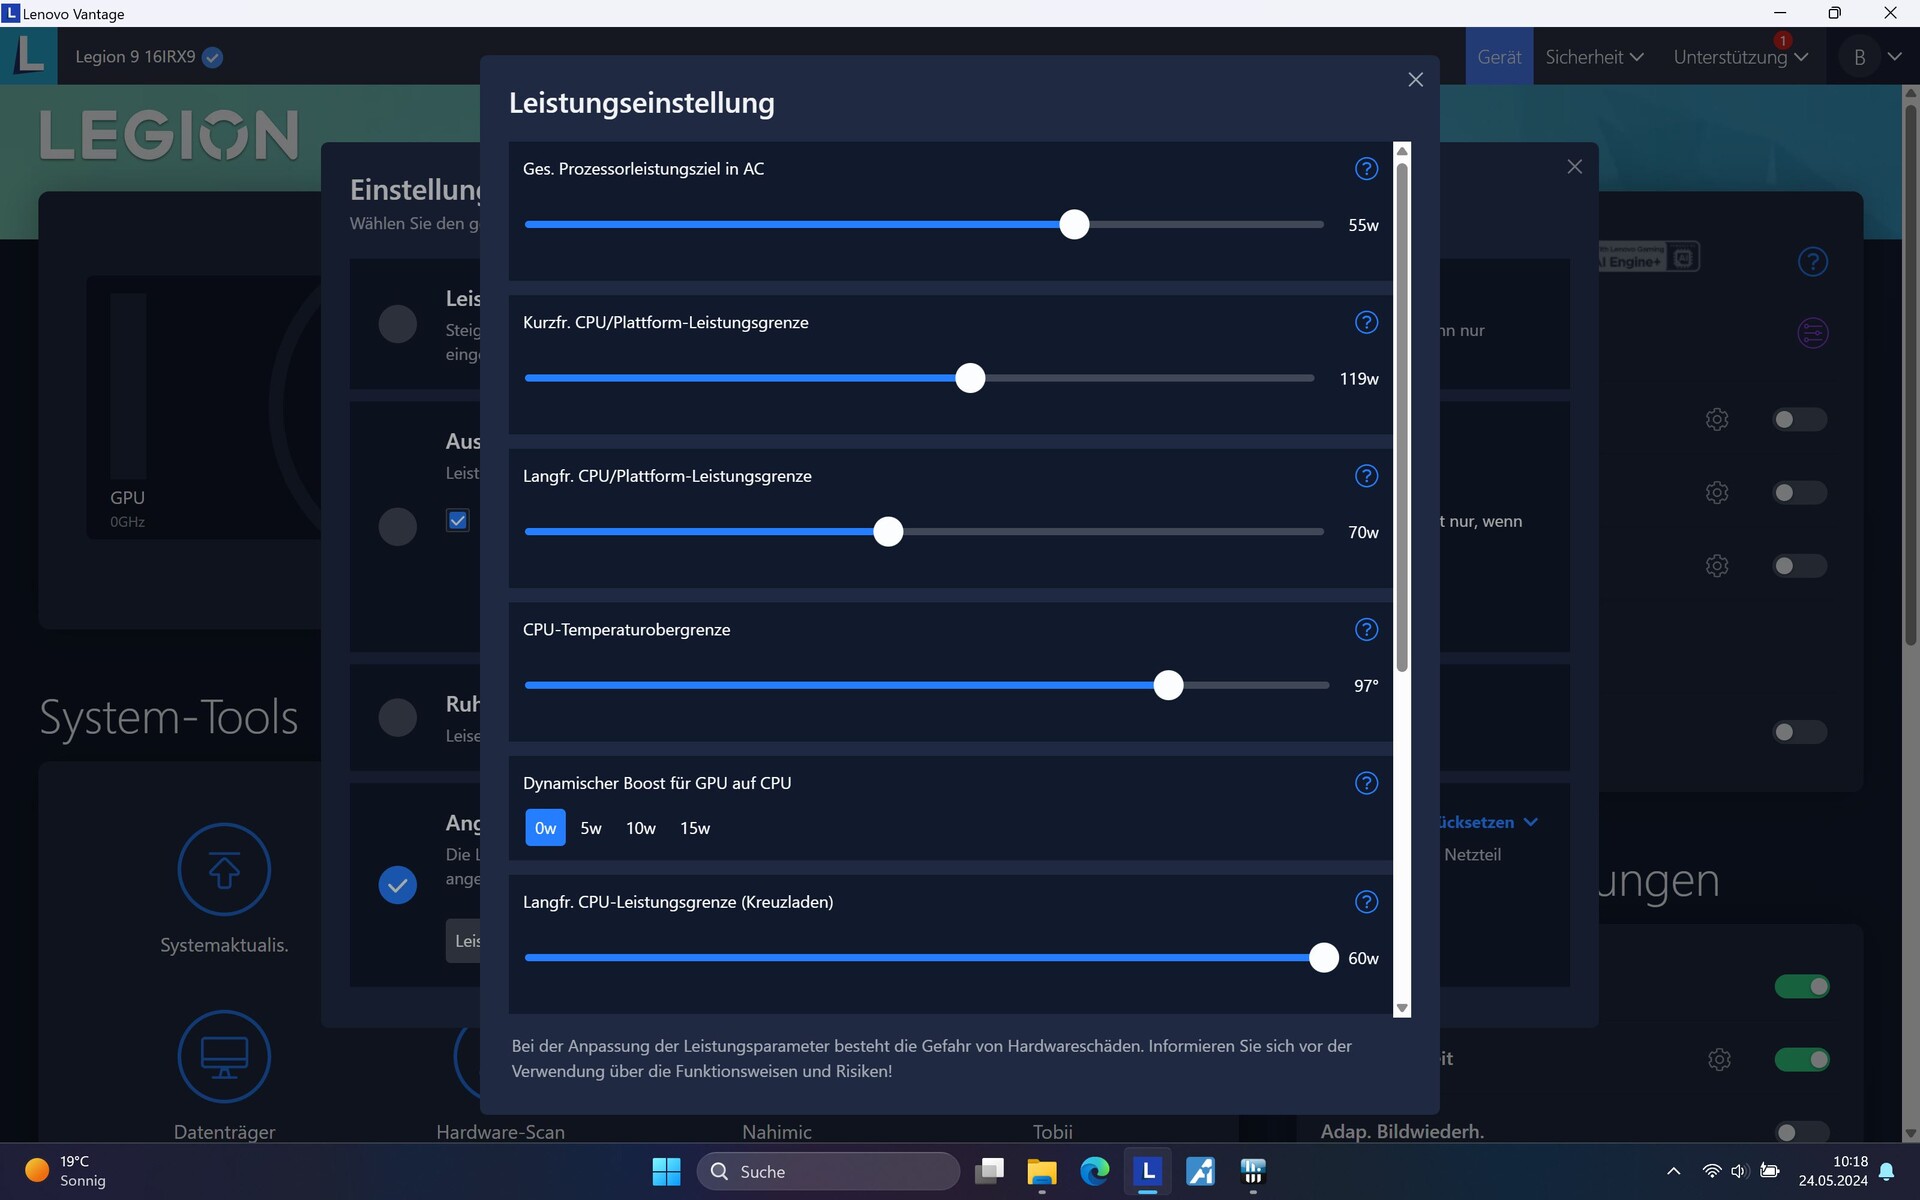
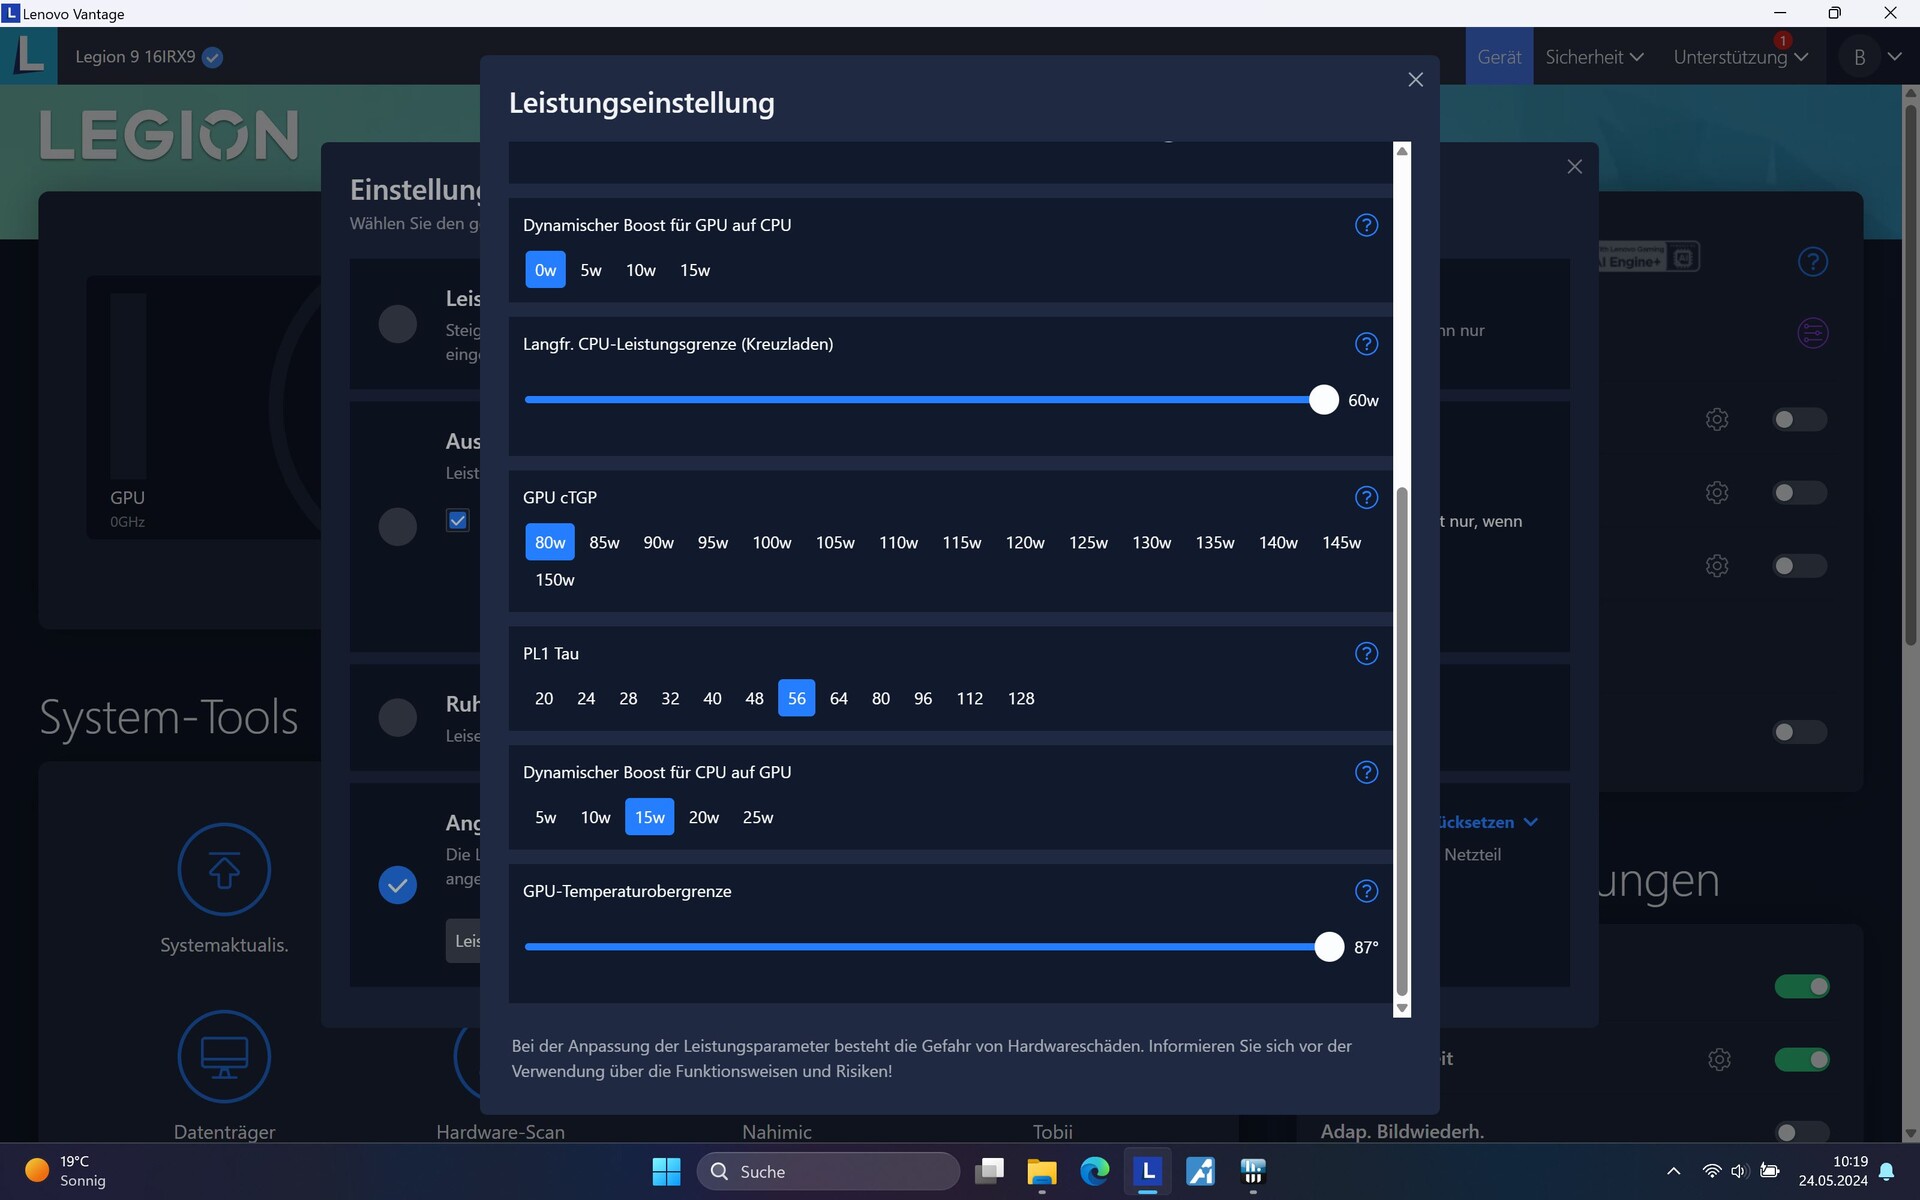
Lenovo Vantage is the name of the Legion 9's Control Center, and it includes the performance profiles Performance, Balanced (here you can also select AI for optimization) and Quiet. There is also the Customized mode which allows you to set various parameters manually.
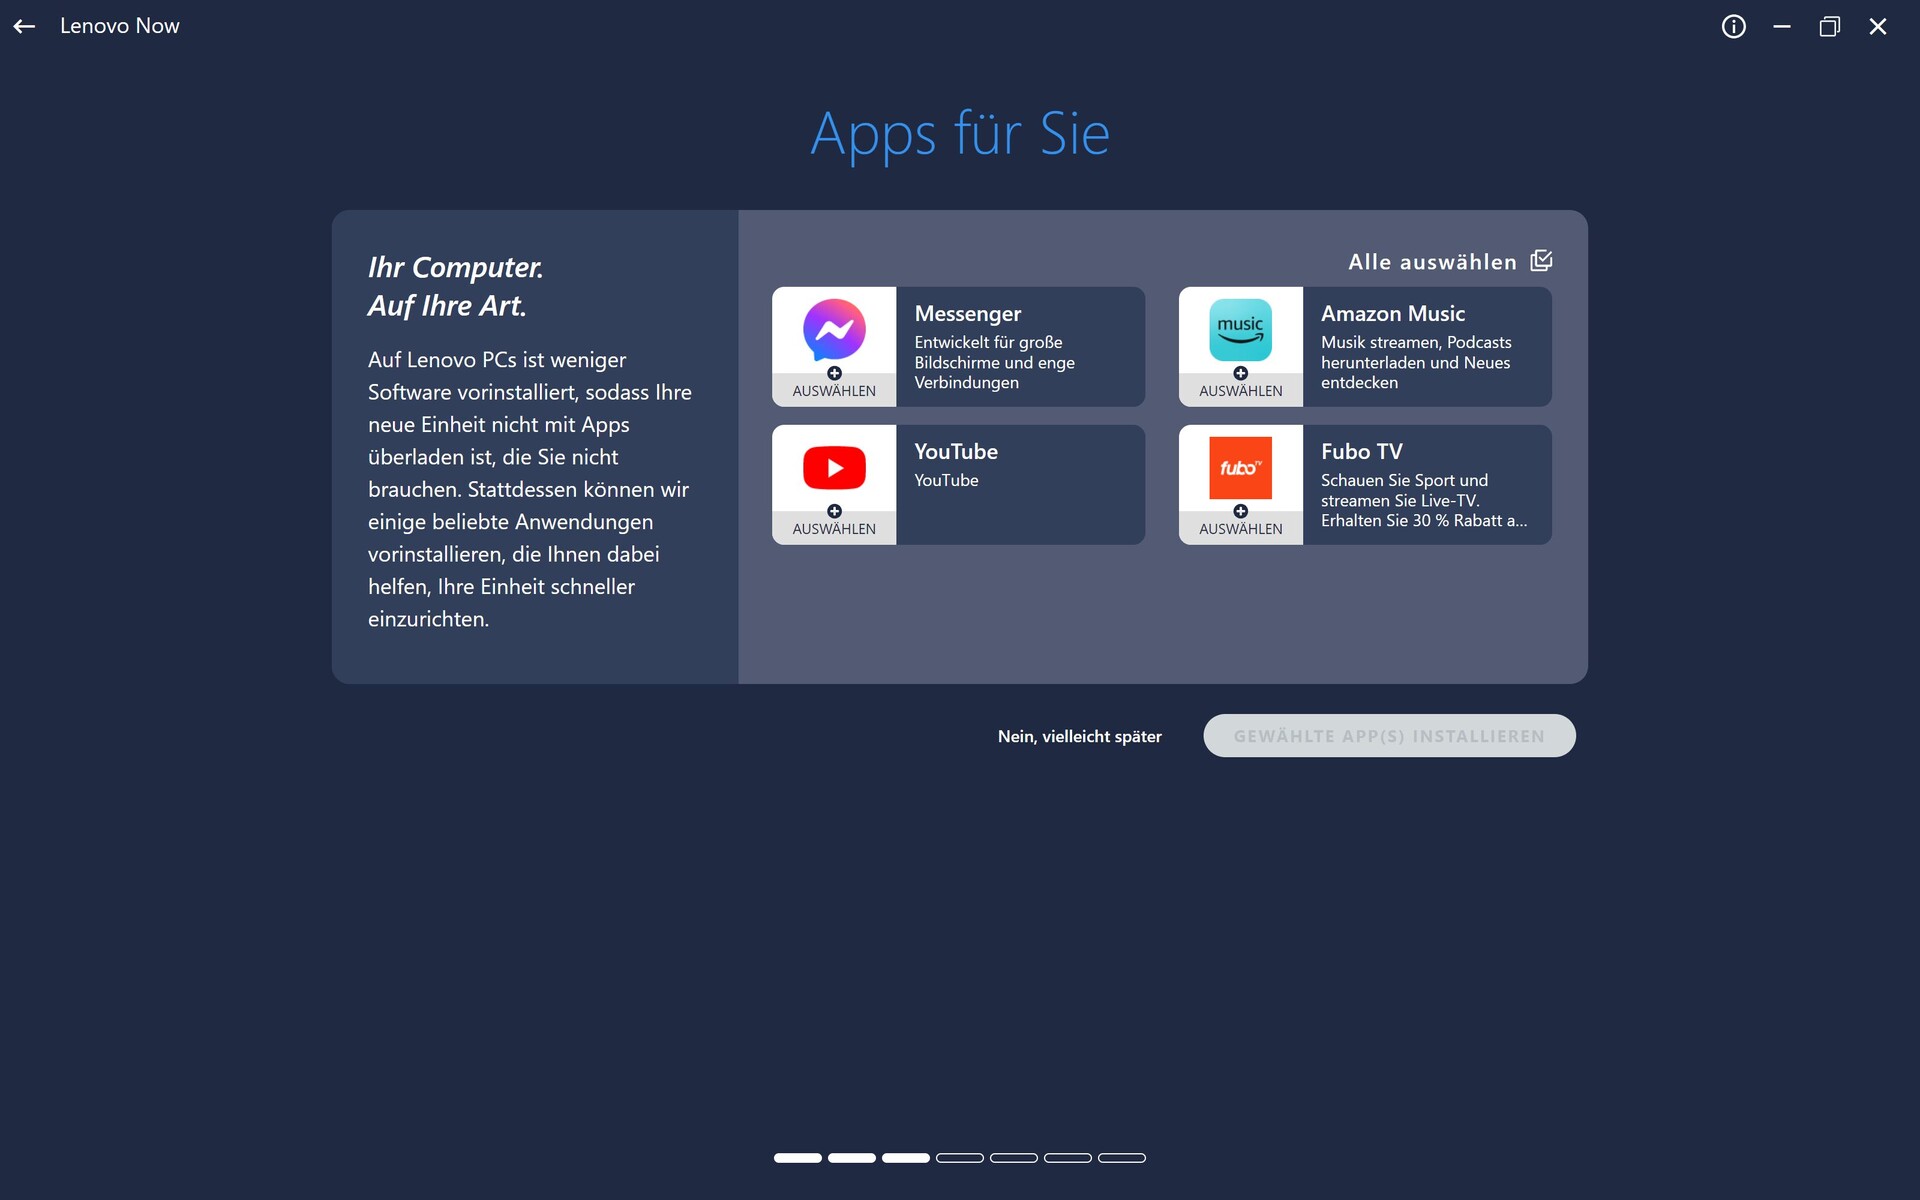
Unfortunately, Vantage sometimes annoyed us with advertising, for example for Amazon Music, YouTube apps, etc. This is because marketing messages are active by default in Vantage and you first have to turn them off to stop being bothered by them.
We selected the mode Performance for our benchmarks, but left the switch for GPU overclocking deactivated.

Processor
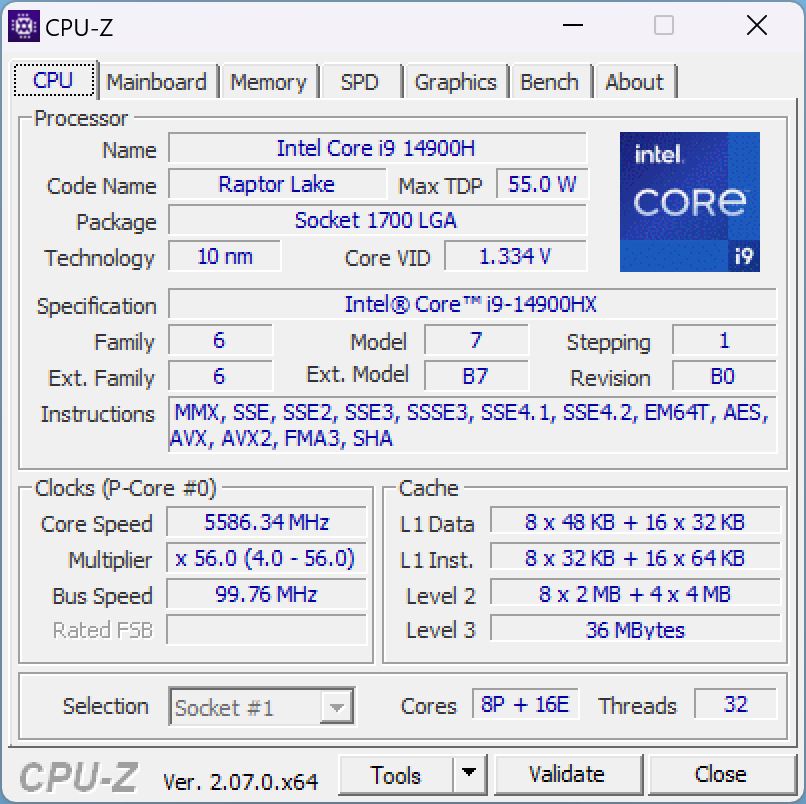
The i9-14900HX is a high-end CPU from the latest Raptor Lake Refresh series from Intel. Its 8 P cores clock at up to 5.8 GHz and the 16 E cores' base clock rate is 1.6 GHz. Together they can process a total of 32 threads.
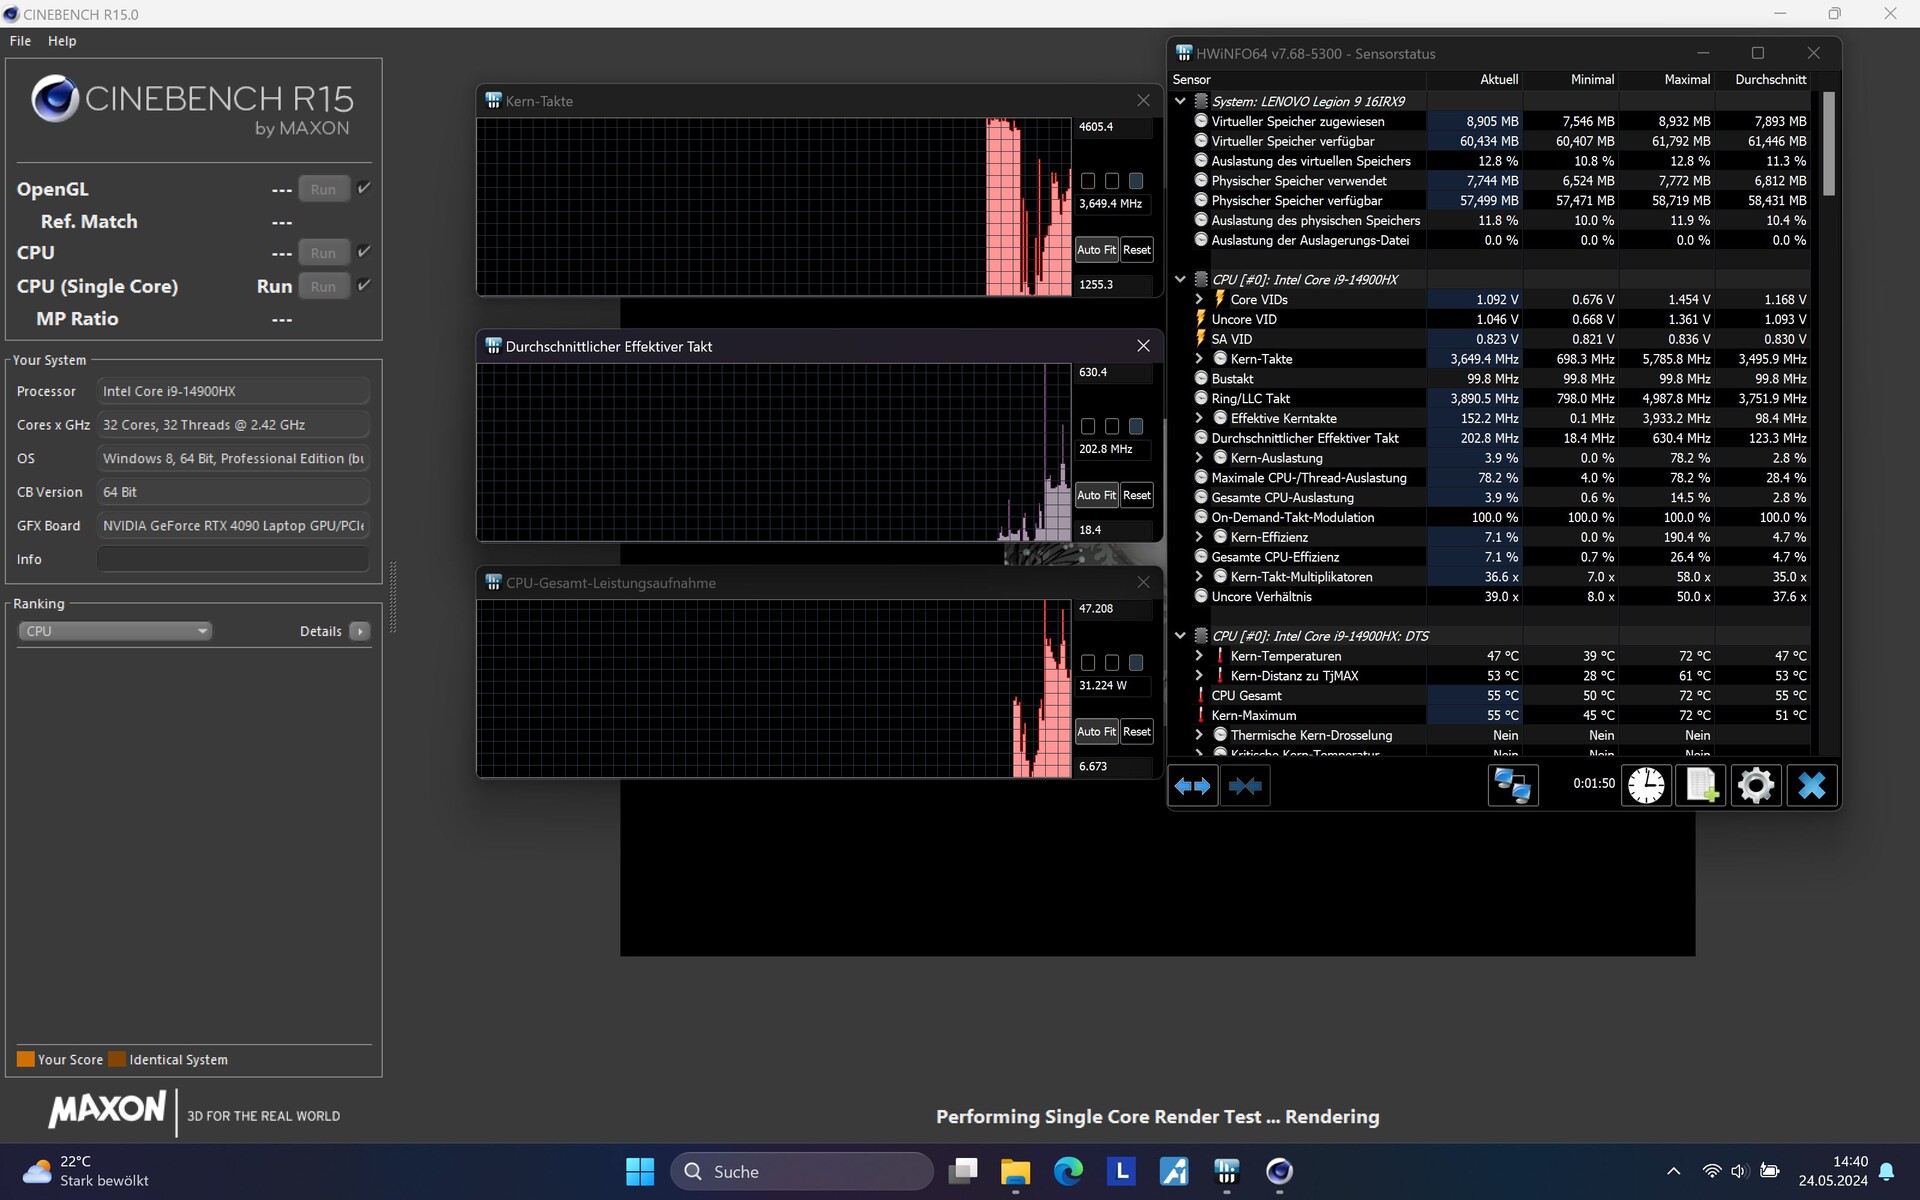
During the Cinebench R15 loop, our Legion 9i had the highest initial performance, however, different to the competition with the same CPU, its performance consistently dropped over time—by about 7.5 per cent after half an hour. Then, its performance was only just above that of its predecessor with the i9-13980HX. Even so, the CPU inside the Legion 9 is still one of the fastest in the comparison field although its performance increase over its predecessor is rather on the low side.
While its multi-thread performance is beyond any doubt, the Legion 9i clearly weakened when it came to its single-core performance in all CPU benchmarks. This was reproducible—apparently its single-core performance reserves are not exhausted in Performance mode, for which you would have to manually increase the key figures using Customized mode.
We therefore took a look at the key figures: In Cinebench R15 Single Core, the core initially clocked up to 4.6 GHz. After around 50 seconds, the core clock briefly dropped to just 1.2 GHz and then stabilized between 3 and 3.5 GHz. The TDP was around 30 watts. In another test, the drop was significantly less pronounced.
With the power plug pulled, its multi-thread performance in Cinebench R15 dropped by around 48.5 per cent, i.e. almost half compared to using the laptop connected to the mains!
| Performance profile/measurement value | Cinebench-15-Score 1st run | CPU power consumption in watts |
|---|---|---|
| Performance without CPU overclocking | 4,879 | 140 - 180 |
| Balanced with AI | 4,115 | 120 - 130 |
| Balanced without AI | 4,091 | 115 - 127 |
| Quiet | 2,938 | 65 - 70 |
| Battery | 2,516 | 40 - 58 |
Cinebench R15 Multi continuous test
Cinebench R23: Multi Core | Single Core
Cinebench R20: CPU (Multi Core) | CPU (Single Core)
Cinebench R15: CPU Multi 64Bit | CPU Single 64Bit
Blender: v2.79 BMW27 CPU
7-Zip 18.03: 7z b 4 | 7z b 4 -mmt1
Geekbench 6.6: Multi-Core | Single-Core
Geekbench 5.5: Multi-Core | Single-Core
HWBOT x265 Benchmark v2.2: 4k Preset
LibreOffice : 20 Documents To PDF
R Benchmark 2.5: Overall mean
| CPU Performance rating | |
| Alienware m18 R2 | |
| Lenovo Legion 9 16IRX8 | |
| Razer Blade 16 2024, RTX 4090 | |
| Asus ROG Strix Scar 18 G834JYR (2024) | |
| Average Intel Core i9-14900HX | |
| Lenovo Legion 9 16IRX9, RTX 4090 | |
| Medion Erazer Beast X40 2024 | |
| Average of class Gaming | |
| Cinebench R23 / Multi Core | |
| Lenovo Legion 9 16IRX9, RTX 4090 | |
| Alienware m18 R2 | |
| Lenovo Legion 9 16IRX8 | |
| Razer Blade 16 2024, RTX 4090 | |
| Average Intel Core i9-14900HX (17078 - 36249, n=37) | |
| Asus ROG Strix Scar 18 G834JYR (2024) | |
| Average of class Gaming (10488 - 40970, n=112, last 2 years) | |
| Medion Erazer Beast X40 2024 | |
| Cinebench R23 / Single Core | |
| Alienware m18 R2 | |
| Medion Erazer Beast X40 2024 | |
| Asus ROG Strix Scar 18 G834JYR (2024) | |
| Average Intel Core i9-14900HX (1720 - 2245, n=37) | |
| Lenovo Legion 9 16IRX8 | |
| Razer Blade 16 2024, RTX 4090 | |
| Average of class Gaming (1166 - 2356, n=112, last 2 years) | |
| Lenovo Legion 9 16IRX9, RTX 4090 | |
| Cinebench R20 / CPU (Multi Core) | |
| Lenovo Legion 9 16IRX9, RTX 4090 | |
| Alienware m18 R2 | |
| Lenovo Legion 9 16IRX8 | |
| Average Intel Core i9-14900HX (6579 - 13832, n=37) | |
| Razer Blade 16 2024, RTX 4090 | |
| Asus ROG Strix Scar 18 G834JYR (2024) | |
| Average of class Gaming (4029 - 16108, n=111, last 2 years) | |
| Medion Erazer Beast X40 2024 | |
| Cinebench R20 / CPU (Single Core) | |
| Medion Erazer Beast X40 2024 | |
| Alienware m18 R2 | |
| Asus ROG Strix Scar 18 G834JYR (2024) | |
| Average Intel Core i9-14900HX (657 - 859, n=37) | |
| Razer Blade 16 2024, RTX 4090 | |
| Average of class Gaming (442 - 895, n=111, last 2 years) | |
| Lenovo Legion 9 16IRX8 | |
| Lenovo Legion 9 16IRX9, RTX 4090 | |
| Cinebench R15 / CPU Multi 64Bit | |
| Lenovo Legion 9 16IRX9, RTX 4090 | |
| Alienware m18 R2 | |
| Lenovo Legion 9 16IRX8 | |
| Razer Blade 16 2024, RTX 4090 | |
| Average Intel Core i9-14900HX (3263 - 5589, n=38) | |
| Asus ROG Strix Scar 18 G834JYR (2024) | |
| Average of class Gaming (1578 - 6271, n=112, last 2 years) | |
| Medion Erazer Beast X40 2024 | |
| Cinebench R15 / CPU Single 64Bit | |
| Alienware m18 R2 | |
| Medion Erazer Beast X40 2024 | |
| Razer Blade 16 2024, RTX 4090 | |
| Average Intel Core i9-14900HX (247 - 323, n=37) | |
| Lenovo Legion 9 16IRX8 | |
| Asus ROG Strix Scar 18 G834JYR (2024) | |
| Average of class Gaming (188.8 - 343, n=111, last 2 years) | |
| Lenovo Legion 9 16IRX9, RTX 4090 | |
| Blender / v2.79 BMW27 CPU | |
| Average of class Gaming (80 - 330, n=109, last 2 years) | |
| Medion Erazer Beast X40 2024 | |
| Average Intel Core i9-14900HX (91 - 206, n=37) | |
| Asus ROG Strix Scar 18 G834JYR (2024) | |
| Razer Blade 16 2024, RTX 4090 | |
| Lenovo Legion 9 16IRX9, RTX 4090 | |
| Lenovo Legion 9 16IRX8 | |
| Alienware m18 R2 | |
| 7-Zip 18.03 / 7z b 4 | |
| Lenovo Legion 9 16IRX9, RTX 4090 | |
| Alienware m18 R2 | |
| Lenovo Legion 9 16IRX8 | |
| Razer Blade 16 2024, RTX 4090 | |
| Asus ROG Strix Scar 18 G834JYR (2024) | |
| Average Intel Core i9-14900HX (66769 - 136645, n=37) | |
| Medion Erazer Beast X40 2024 | |
| Average of class Gaming (33491 - 148086, n=110, last 2 years) | |
| 7-Zip 18.03 / 7z b 4 -mmt1 | |
| Medion Erazer Beast X40 2024 | |
| Asus ROG Strix Scar 18 G834JYR (2024) | |
| Alienware m18 R2 | |
| Average Intel Core i9-14900HX (5452 - 7545, n=37) | |
| Razer Blade 16 2024, RTX 4090 | |
| Lenovo Legion 9 16IRX8 | |
| Average of class Gaming (4199 - 7436, n=110, last 2 years) | |
| Lenovo Legion 9 16IRX9, RTX 4090 | |
| Geekbench 6.6 / Multi-Core | |
| Alienware m18 R2 | |
| Asus ROG Strix Scar 18 G834JYR (2024) | |
| Razer Blade 16 2024, RTX 4090 | |
| Lenovo Legion 9 16IRX9, RTX 4090 | |
| Lenovo Legion 9 16IRX8 | |
| Average Intel Core i9-14900HX (13158 - 19665, n=37) | |
| Medion Erazer Beast X40 2024 | |
| Average of class Gaming (6625 - 22104, n=110, last 2 years) | |
| Geekbench 6.6 / Single-Core | |
| Medion Erazer Beast X40 2024 | |
| Alienware m18 R2 | |
| Asus ROG Strix Scar 18 G834JYR (2024) | |
| Average Intel Core i9-14900HX (2419 - 3129, n=37) | |
| Razer Blade 16 2024, RTX 4090 | |
| Lenovo Legion 9 16IRX8 | |
| Average of class Gaming (1490 - 3259, n=110, last 2 years) | |
| Lenovo Legion 9 16IRX9, RTX 4090 | |
| Geekbench 5.5 / Multi-Core | |
| Lenovo Legion 9 16IRX9, RTX 4090 | |
| Alienware m18 R2 | |
| Lenovo Legion 9 16IRX8 | |
| Asus ROG Strix Scar 18 G834JYR (2024) | |
| Average Intel Core i9-14900HX (8618 - 23194, n=37) | |
| Razer Blade 16 2024, RTX 4090 | |
| Medion Erazer Beast X40 2024 | |
| Average of class Gaming (6460 - 27010, n=110, last 2 years) | |
| Geekbench 5.5 / Single-Core | |
| Alienware m18 R2 | |
| Medion Erazer Beast X40 2024 | |
| Lenovo Legion 9 16IRX8 | |
| Razer Blade 16 2024, RTX 4090 | |
| Asus ROG Strix Scar 18 G834JYR (2024) | |
| Average Intel Core i9-14900HX (1669 - 2210, n=37) | |
| Average of class Gaming (986 - 2474, n=110, last 2 years) | |
| Lenovo Legion 9 16IRX9, RTX 4090 | |
| HWBOT x265 Benchmark v2.2 / 4k Preset | |
| Alienware m18 R2 | |
| Lenovo Legion 9 16IRX8 | |
| Lenovo Legion 9 16IRX9, RTX 4090 | |
| Razer Blade 16 2024, RTX 4090 | |
| Average Intel Core i9-14900HX (16.8 - 38.9, n=37) | |
| Asus ROG Strix Scar 18 G834JYR (2024) | |
| Average of class Gaming (11.5 - 44.3, n=110, last 2 years) | |
| Medion Erazer Beast X40 2024 | |
| LibreOffice / 20 Documents To PDF | |
| Lenovo Legion 9 16IRX9, RTX 4090 | |
| Average of class Gaming (19 - 88.8, n=110, last 2 years) | |
| Razer Blade 16 2024, RTX 4090 | |
| Alienware m18 R2 | |
| Asus ROG Strix Scar 18 G834JYR (2024) | |
| Medion Erazer Beast X40 2024 | |
| Average Intel Core i9-14900HX (19 - 85.1, n=37) | |
| Lenovo Legion 9 16IRX8 | |
| R Benchmark 2.5 / Overall mean | |
| Lenovo Legion 9 16IRX9, RTX 4090 | |
| Average of class Gaming (0.3439 - 0.759, n=111, last 2 years) | |
| Asus ROG Strix Scar 18 G834JYR (2024) | |
| Average Intel Core i9-14900HX (0.3604 - 0.4859, n=37) | |
| Lenovo Legion 9 16IRX8 | |
| Razer Blade 16 2024, RTX 4090 | |
| Alienware m18 R2 | |
| Medion Erazer Beast X40 2024 | |
* ... smaller is better
AIDA64: FP32 Ray-Trace | FPU Julia | CPU SHA3 | CPU Queen | FPU SinJulia | FPU Mandel | CPU AES | CPU ZLib | FP64 Ray-Trace | CPU PhotoWorxx
| Performance rating | |
| Alienware m18 R2 | |
| Lenovo Legion 9 16IRX9, RTX 4090 | |
| Lenovo Legion 9 16IRX8 | |
| Razer Blade 16 2024, RTX 4090 | |
| Asus ROG Strix Scar 18 G834JYR (2024) | |
| Average Intel Core i9-14900HX | |
| Average of class Gaming | |
| Medion Erazer Beast X40 2024 | |
| AIDA64 / FP32 Ray-Trace | |
| Average of class Gaming (10227 - 85542, n=109, last 2 years) | |
| Alienware m18 R2 | |
| Lenovo Legion 9 16IRX9, RTX 4090 | |
| Lenovo Legion 9 16IRX8 | |
| Razer Blade 16 2024, RTX 4090 | |
| Asus ROG Strix Scar 18 G834JYR (2024) | |
| Average Intel Core i9-14900HX (13098 - 33474, n=36) | |
| Medion Erazer Beast X40 2024 | |
| AIDA64 / FPU Julia | |
| Alienware m18 R2 | |
| Lenovo Legion 9 16IRX9, RTX 4090 | |
| Average of class Gaming (51376 - 238426, n=109, last 2 years) | |
| Lenovo Legion 9 16IRX8 | |
| Asus ROG Strix Scar 18 G834JYR (2024) | |
| Razer Blade 16 2024, RTX 4090 | |
| Average Intel Core i9-14900HX (67573 - 166040, n=36) | |
| Medion Erazer Beast X40 2024 | |
| AIDA64 / CPU SHA3 | |
| Alienware m18 R2 | |
| Lenovo Legion 9 16IRX9, RTX 4090 | |
| Lenovo Legion 9 16IRX8 | |
| Asus ROG Strix Scar 18 G834JYR (2024) | |
| Razer Blade 16 2024, RTX 4090 | |
| Average Intel Core i9-14900HX (3589 - 7979, n=36) | |
| Average of class Gaming (2180 - 9817, n=109, last 2 years) | |
| Medion Erazer Beast X40 2024 | |
| AIDA64 / CPU Queen | |
| Asus ROG Strix Scar 18 G834JYR (2024) | |
| Alienware m18 R2 | |
| Razer Blade 16 2024, RTX 4090 | |
| Average Intel Core i9-14900HX (118405 - 148966, n=36) | |
| Lenovo Legion 9 16IRX8 | |
| Medion Erazer Beast X40 2024 | |
| Lenovo Legion 9 16IRX9, RTX 4090 | |
| Average of class Gaming (49785 - 173351, n=101, last 2 years) | |
| AIDA64 / FPU SinJulia | |
| Alienware m18 R2 | |
| Lenovo Legion 9 16IRX9, RTX 4090 | |
| Asus ROG Strix Scar 18 G834JYR (2024) | |
| Razer Blade 16 2024, RTX 4090 | |
| Lenovo Legion 9 16IRX8 | |
| Average Intel Core i9-14900HX (10475 - 18517, n=36) | |
| Average of class Gaming (4424 - 33636, n=109, last 2 years) | |
| Medion Erazer Beast X40 2024 | |
| AIDA64 / FPU Mandel | |
| Alienware m18 R2 | |
| Average of class Gaming (25115 - 128721, n=109, last 2 years) | |
| Lenovo Legion 9 16IRX9, RTX 4090 | |
| Lenovo Legion 9 16IRX8 | |
| Razer Blade 16 2024, RTX 4090 | |
| Asus ROG Strix Scar 18 G834JYR (2024) | |
| Average Intel Core i9-14900HX (32543 - 83662, n=36) | |
| Medion Erazer Beast X40 2024 | |
| AIDA64 / CPU AES | |
| Average Intel Core i9-14900HX (86964 - 241777, n=36) | |
| Alienware m18 R2 | |
| Lenovo Legion 9 16IRX9, RTX 4090 | |
| Lenovo Legion 9 16IRX8 | |
| Razer Blade 16 2024, RTX 4090 | |
| Asus ROG Strix Scar 18 G834JYR (2024) | |
| Average of class Gaming (39258 - 247074, n=109, last 2 years) | |
| Medion Erazer Beast X40 2024 | |
| AIDA64 / CPU ZLib | |
| Alienware m18 R2 | |
| Lenovo Legion 9 16IRX9, RTX 4090 | |
| Lenovo Legion 9 16IRX8 | |
| Razer Blade 16 2024, RTX 4090 | |
| Average Intel Core i9-14900HX (1054 - 2292, n=36) | |
| Asus ROG Strix Scar 18 G834JYR (2024) | |
| Average of class Gaming (574 - 2531, n=109, last 2 years) | |
| Medion Erazer Beast X40 2024 | |
| AIDA64 / FP64 Ray-Trace | |
| Average of class Gaming (5509 - 45446, n=109, last 2 years) | |
| Alienware m18 R2 | |
| Lenovo Legion 9 16IRX8 | |
| Lenovo Legion 9 16IRX9, RTX 4090 | |
| Razer Blade 16 2024, RTX 4090 | |
| Asus ROG Strix Scar 18 G834JYR (2024) | |
| Average Intel Core i9-14900HX (6809 - 18349, n=36) | |
| Medion Erazer Beast X40 2024 | |
| AIDA64 / CPU PhotoWorxx | |
| Lenovo Legion 9 16IRX9, RTX 4090 | |
| Lenovo Legion 9 16IRX8 | |
| Alienware m18 R2 | |
| Asus ROG Strix Scar 18 G834JYR (2024) | |
| Razer Blade 16 2024, RTX 4090 | |
| Medion Erazer Beast X40 2024 | |
| Average Intel Core i9-14900HX (23903 - 54702, n=36) | |
| Average of class Gaming (12271 - 89891, n=109, last 2 years) | |
System performance
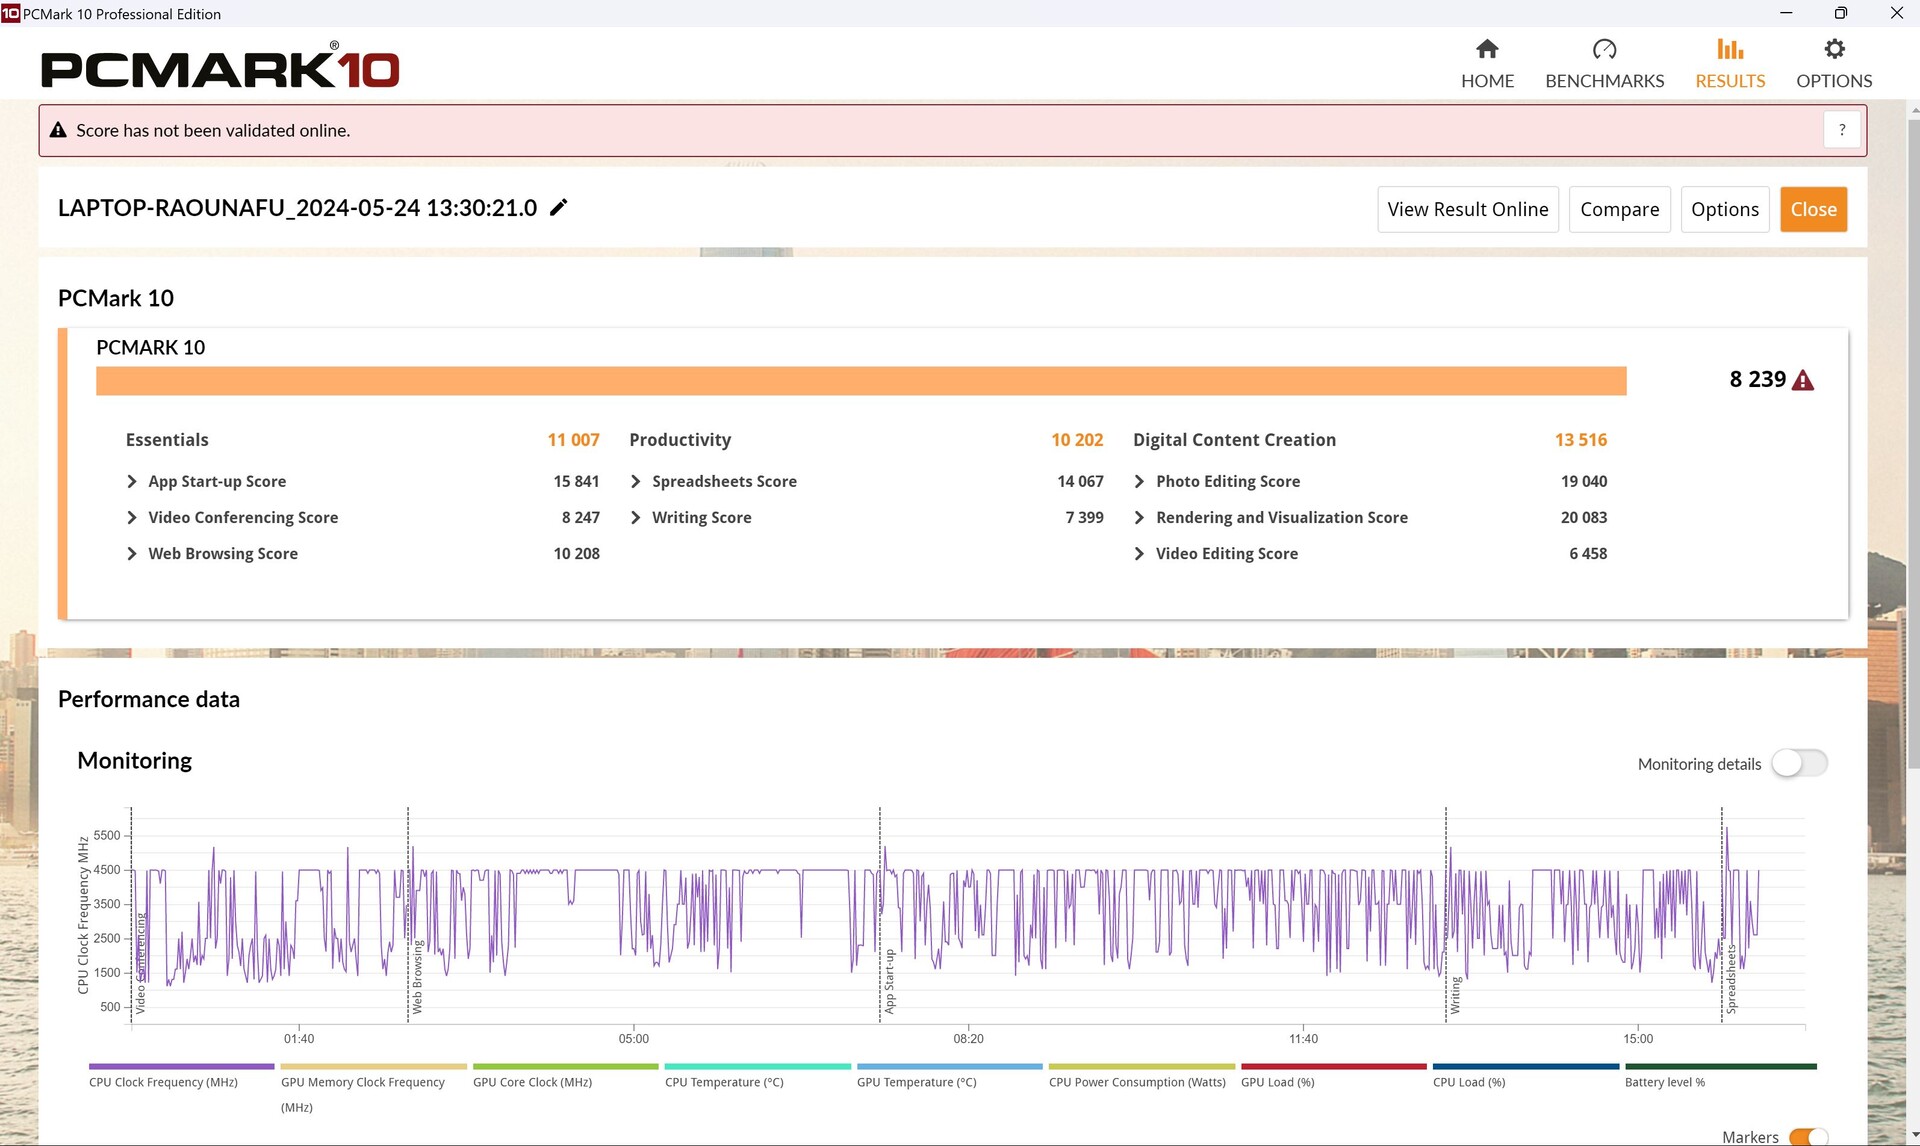
Its performance in PCMark 10 was around 5 per cent below the average laptop with the same CPU/GPU combination. Aida also showed that although its RAM offers good read and write rates, its memory latency is unusually high, leading to worse-than-expected results in some benchmarks, such as here.
Subjectively, we noticed that although the laptop runs smoothly most of the time, it occasionally "hitches" when running games. This was also confirmed by the frame rate graph for Far Cry 5, for example, where its frame rate appears to drop briefly, which seems to occur more often. Its DPC latencies are also quite high, see next section. Its results using web applications were also repeatedly weak.
CrossMark: Overall | Productivity | Creativity | Responsiveness
WebXPRT 3: Overall
WebXPRT 4: Overall
Mozilla Kraken 1.1: Total
| PCMark 10 / Score | |
| Alienware m18 R2 | |
| Lenovo Legion 9 16IRX8 | |
| Medion Erazer Beast X40 2024 | |
| Asus ROG Strix Scar 18 G834JYR (2024) | |
| Average Intel Core i9-14900HX, NVIDIA GeForce RTX 4090 Laptop GPU (8230 - 9234, n=13) | |
| Razer Blade 16 2024, RTX 4090 | |
| Average of class Gaming (5828 - 11574, n=95, last 2 years) | |
| Lenovo Legion 9 16IRX9, RTX 4090 | |
| PCMark 10 / Essentials | |
| Lenovo Legion 9 16IRX8 | |
| Alienware m18 R2 | |
| Asus ROG Strix Scar 18 G834JYR (2024) | |
| Average Intel Core i9-14900HX, NVIDIA GeForce RTX 4090 Laptop GPU (10778 - 11628, n=13) | |
| Lenovo Legion 9 16IRX9, RTX 4090 | |
| Razer Blade 16 2024, RTX 4090 | |
| Medion Erazer Beast X40 2024 | |
| Average of class Gaming (8810 - 12600, n=99, last 2 years) | |
| PCMark 10 / Productivity | |
| Medion Erazer Beast X40 2024 | |
| Alienware m18 R2 | |
| Razer Blade 16 2024, RTX 4090 | |
| Lenovo Legion 9 16IRX8 | |
| Average of class Gaming (6845 - 18766, n=97, last 2 years) | |
| Average Intel Core i9-14900HX, NVIDIA GeForce RTX 4090 Laptop GPU (9458 - 11759, n=13) | |
| Asus ROG Strix Scar 18 G834JYR (2024) | |
| Lenovo Legion 9 16IRX9, RTX 4090 | |
| PCMark 10 / Digital Content Creation | |
| Alienware m18 R2 | |
| Lenovo Legion 9 16IRX8 | |
| Asus ROG Strix Scar 18 G834JYR (2024) | |
| Medion Erazer Beast X40 2024 | |
| Average Intel Core i9-14900HX, NVIDIA GeForce RTX 4090 Laptop GPU (13219 - 16462, n=13) | |
| Average of class Gaming (7602 - 19657, n=97, last 2 years) | |
| Lenovo Legion 9 16IRX9, RTX 4090 | |
| Razer Blade 16 2024, RTX 4090 | |
| CrossMark / Overall | |
| Asus ROG Strix Scar 18 G834JYR (2024) | |
| Razer Blade 16 2024, RTX 4090 | |
| Medion Erazer Beast X40 2024 | |
| Average Intel Core i9-14900HX, NVIDIA GeForce RTX 4090 Laptop GPU (1877 - 2344, n=10) | |
| Alienware m18 R2 | |
| Average of class Gaming (1366 - 2409, n=97, last 2 years) | |
| Lenovo Legion 9 16IRX9, RTX 4090 | |
| Lenovo Legion 9 16IRX8 | |
| CrossMark / Productivity | |
| Medion Erazer Beast X40 2024 | |
| Asus ROG Strix Scar 18 G834JYR (2024) | |
| Razer Blade 16 2024, RTX 4090 | |
| Average Intel Core i9-14900HX, NVIDIA GeForce RTX 4090 Laptop GPU (1738 - 2162, n=10) | |
| Alienware m18 R2 | |
| Average of class Gaming (1386 - 2254, n=97, last 2 years) | |
| Lenovo Legion 9 16IRX8 | |
| Lenovo Legion 9 16IRX9, RTX 4090 | |
| CrossMark / Creativity | |
| Asus ROG Strix Scar 18 G834JYR (2024) | |
| Razer Blade 16 2024, RTX 4090 | |
| Alienware m18 R2 | |
| Average Intel Core i9-14900HX, NVIDIA GeForce RTX 4090 Laptop GPU (2195 - 2660, n=10) | |
| Medion Erazer Beast X40 2024 | |
| Lenovo Legion 9 16IRX8 | |
| Average of class Gaming (1343 - 2729, n=97, last 2 years) | |
| Lenovo Legion 9 16IRX9, RTX 4090 | |
| CrossMark / Responsiveness | |
| Asus ROG Strix Scar 18 G834JYR (2024) | |
| Medion Erazer Beast X40 2024 | |
| Average Intel Core i9-14900HX, NVIDIA GeForce RTX 4090 Laptop GPU (1478 - 2327, n=10) | |
| Razer Blade 16 2024, RTX 4090 | |
| Alienware m18 R2 | |
| Lenovo Legion 9 16IRX9, RTX 4090 | |
| Average of class Gaming (1226 - 2334, n=97, last 2 years) | |
| Lenovo Legion 9 16IRX8 | |
| WebXPRT 3 / Overall | |
| Lenovo Legion 9 16IRX8 | |
| Razer Blade 16 2024, RTX 4090 | |
| Medion Erazer Beast X40 2024 | |
| Alienware m18 R2 | |
| Average Intel Core i9-14900HX, NVIDIA GeForce RTX 4090 Laptop GPU (279 - 339, n=10) | |
| Asus ROG Strix Scar 18 G834JYR (2024) | |
| Average of class Gaming (242 - 532, n=100, last 2 years) | |
| Lenovo Legion 9 16IRX9, RTX 4090 | |
| WebXPRT 4 / Overall | |
| Alienware m18 R2 | |
| Lenovo Legion 9 16IRX8 | |
| Asus ROG Strix Scar 18 G834JYR (2024) | |
| Medion Erazer Beast X40 2024 | |
| Average Intel Core i9-14900HX, NVIDIA GeForce RTX 4090 Laptop GPU (246 - 309, n=8) | |
| Average of class Gaming (176.4 - 354, n=100, last 2 years) | |
| Lenovo Legion 9 16IRX9, RTX 4090 | |
| Mozilla Kraken 1.1 / Total | |
| Lenovo Legion 9 16IRX9, RTX 4090 | |
| Average of class Gaming (391 - 590, n=105, last 2 years) | |
| Average Intel Core i9-14900HX, NVIDIA GeForce RTX 4090 Laptop GPU (428 - 535, n=11) | |
| Razer Blade 16 2024, RTX 4090 | |
| Asus ROG Strix Scar 18 G834JYR (2024) | |
| Lenovo Legion 9 16IRX8 | |
| Medion Erazer Beast X40 2024 | |
| Alienware m18 R2 | |
* ... smaller is better
| PCMark 10 Score | 8239 points | |
Help | ||
| AIDA64 / Memory Copy | |
| Asus ROG Strix Scar 18 G834JYR (2024) | |
| Lenovo Legion 9 16IRX9, RTX 4090 | |
| Alienware m18 R2 | |
| Razer Blade 16 2024, RTX 4090 | |
| Lenovo Legion 9 16IRX8 | |
| Medion Erazer Beast X40 2024 | |
| Average Intel Core i9-14900HX (38028 - 83392, n=36) | |
| Average of class Gaming (21750 - 129946, n=109, last 2 years) | |
| AIDA64 / Memory Read | |
| Asus ROG Strix Scar 18 G834JYR (2024) | |
| Razer Blade 16 2024, RTX 4090 | |
| Alienware m18 R2 | |
| Lenovo Legion 9 16IRX8 | |
| Medion Erazer Beast X40 2024 | |
| Lenovo Legion 9 16IRX9, RTX 4090 | |
| Average Intel Core i9-14900HX (43306 - 87568, n=36) | |
| Average of class Gaming (22956 - 118858, n=109, last 2 years) | |
| AIDA64 / Memory Write | |
| Lenovo Legion 9 16IRX9, RTX 4090 | |
| Asus ROG Strix Scar 18 G834JYR (2024) | |
| Medion Erazer Beast X40 2024 | |
| Alienware m18 R2 | |
| Lenovo Legion 9 16IRX8 | |
| Average of class Gaming (22297 - 135096, n=109, last 2 years) | |
| Razer Blade 16 2024, RTX 4090 | |
| Average Intel Core i9-14900HX (37146 - 80589, n=36) | |
| AIDA64 / Memory Latency | |
| Average of class Gaming (75.3 - 259, n=109, last 2 years) | |
| Lenovo Legion 9 16IRX9, RTX 4090 | |
| Alienware m18 R2 | |
| Average Intel Core i9-14900HX (76.1 - 105, n=36) | |
| Lenovo Legion 9 16IRX8 | |
| Razer Blade 16 2024, RTX 4090 | |
| Asus ROG Strix Scar 18 G834JYR (2024) | |
| Medion Erazer Beast X40 2024 | |
* ... smaller is better
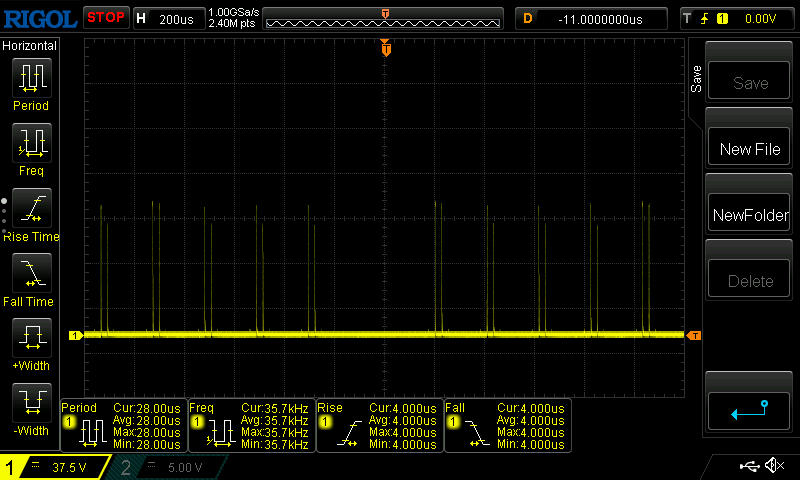
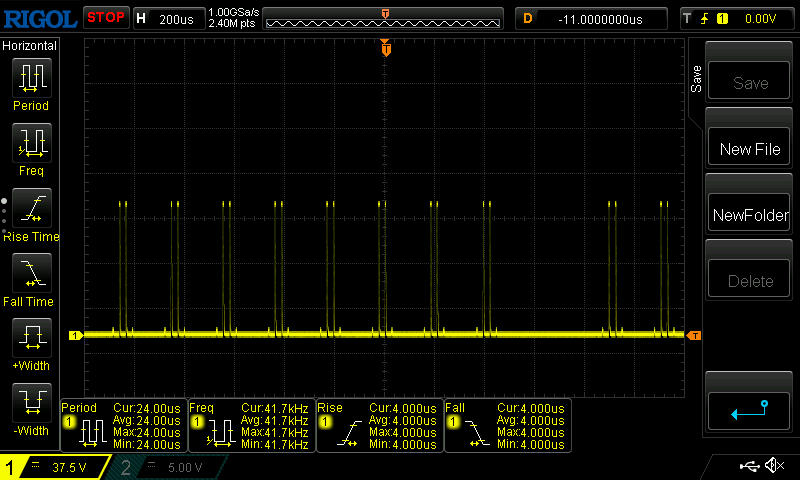
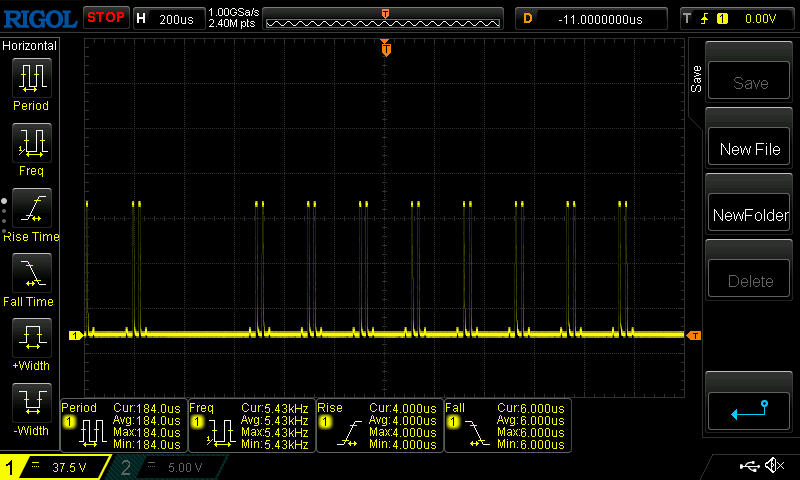
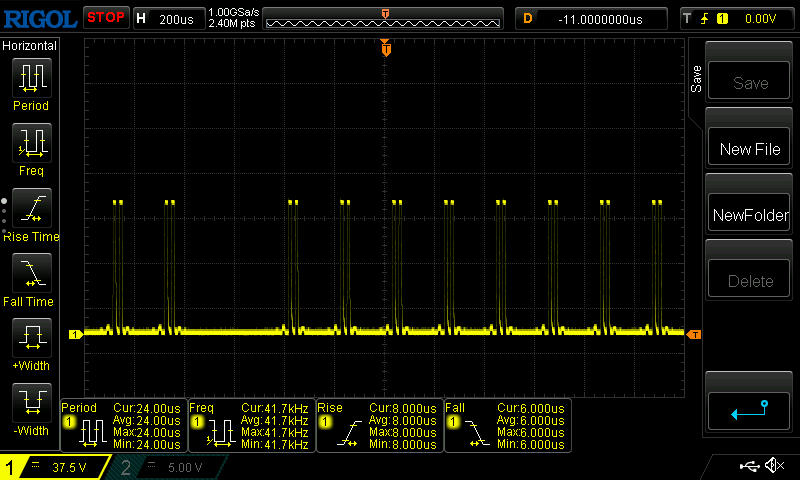
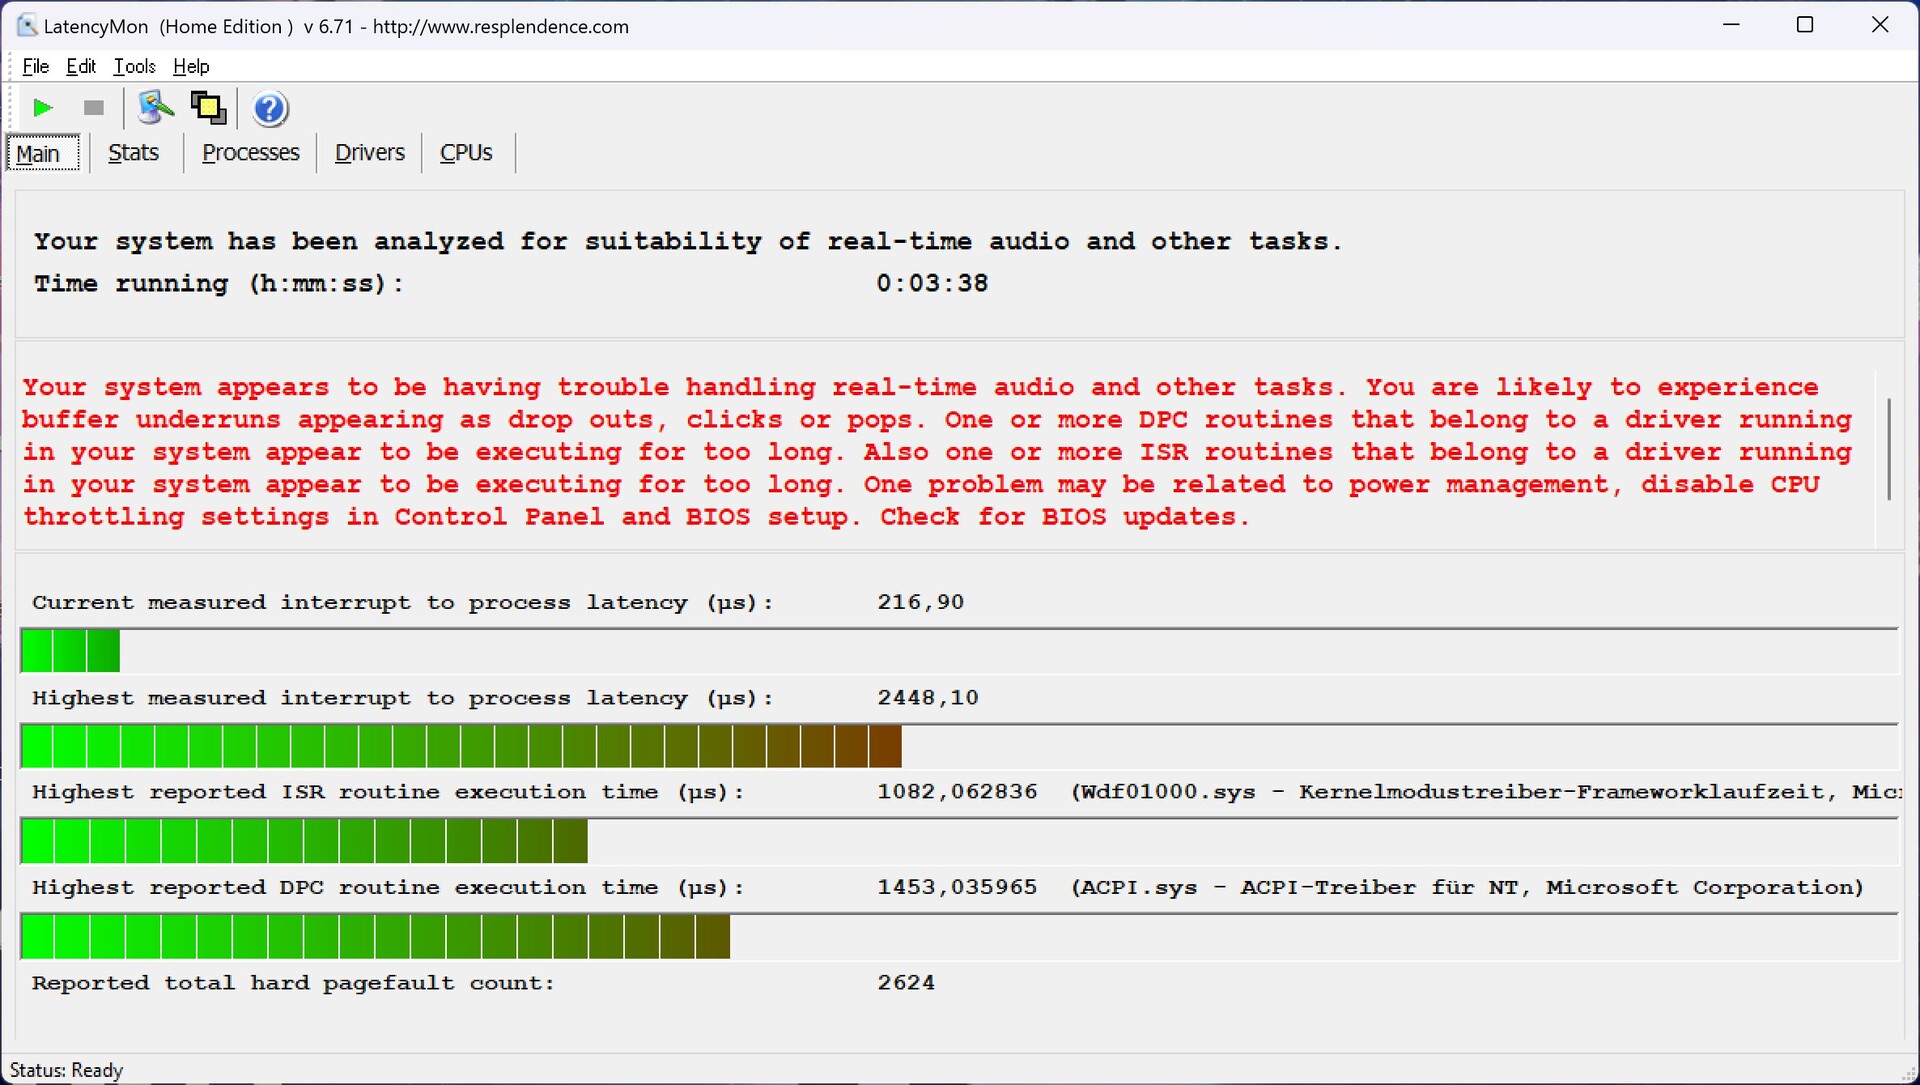
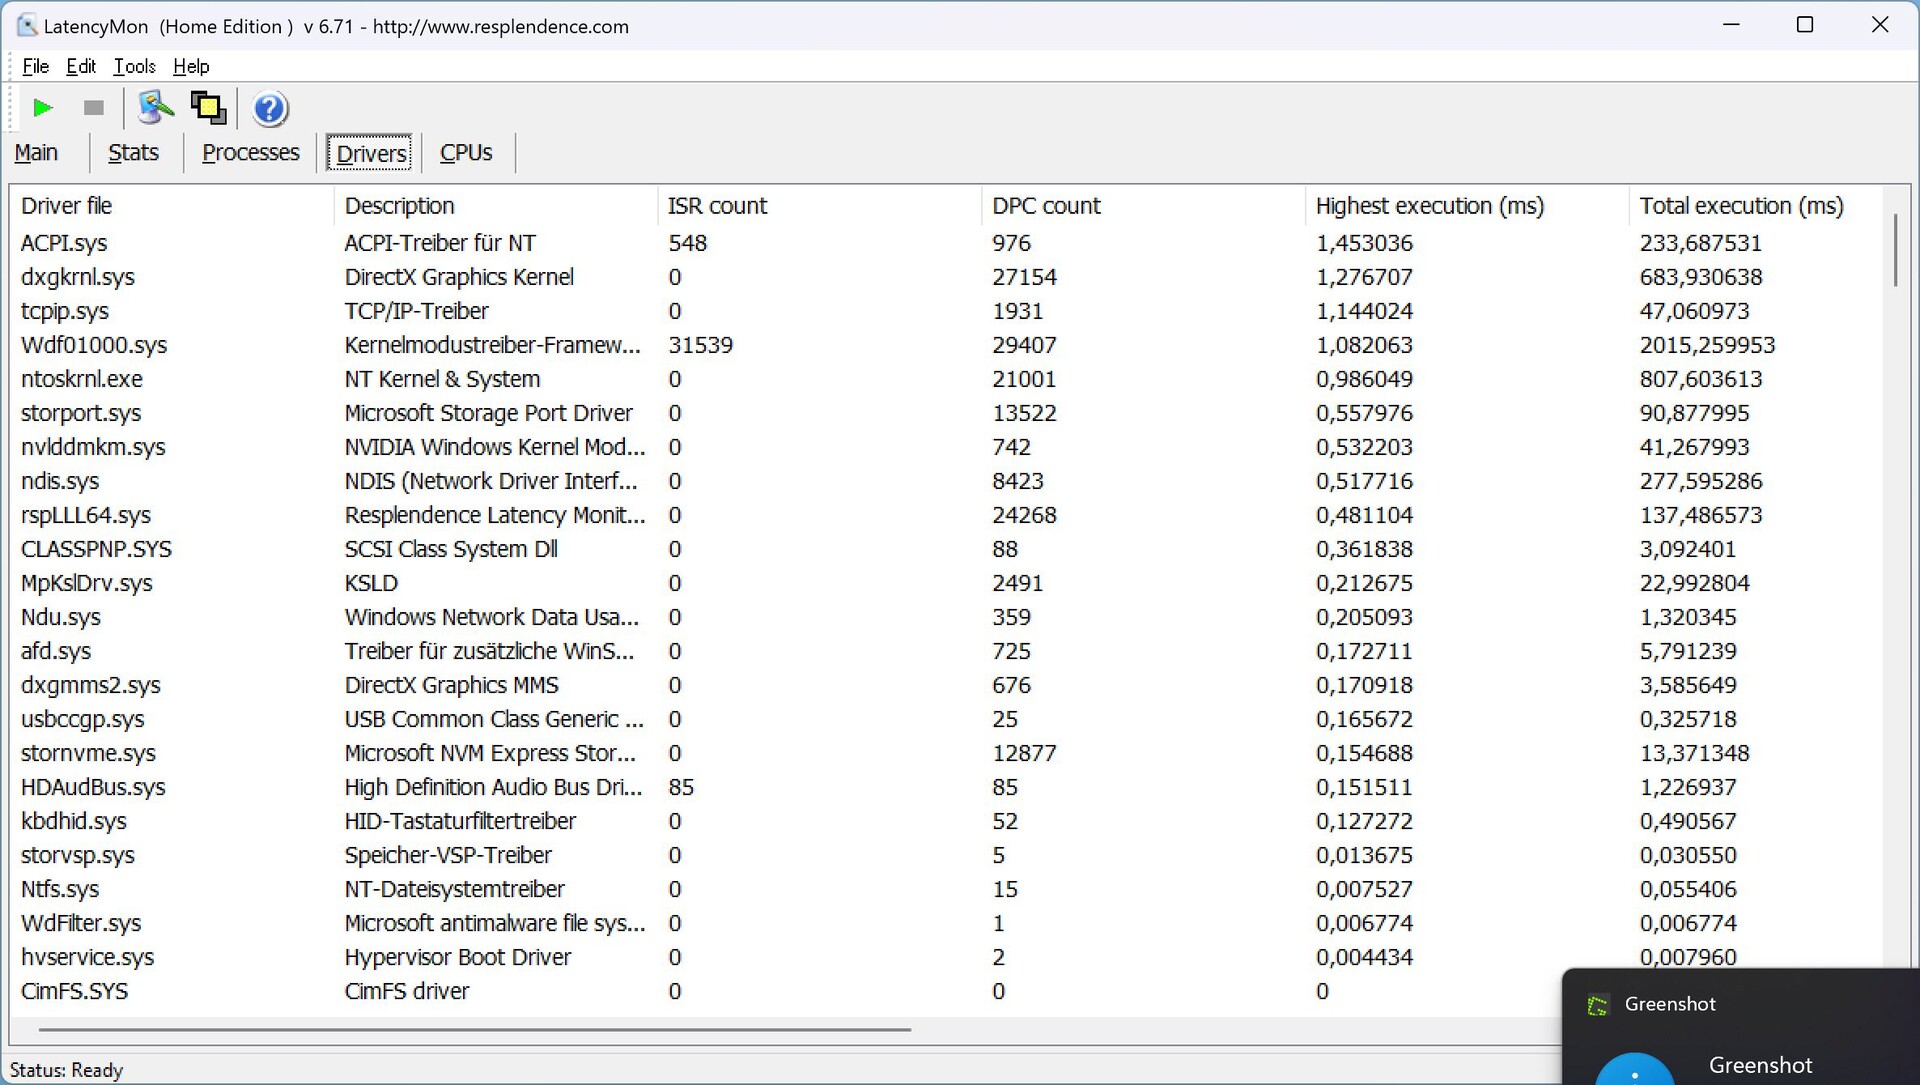
DPC latencies
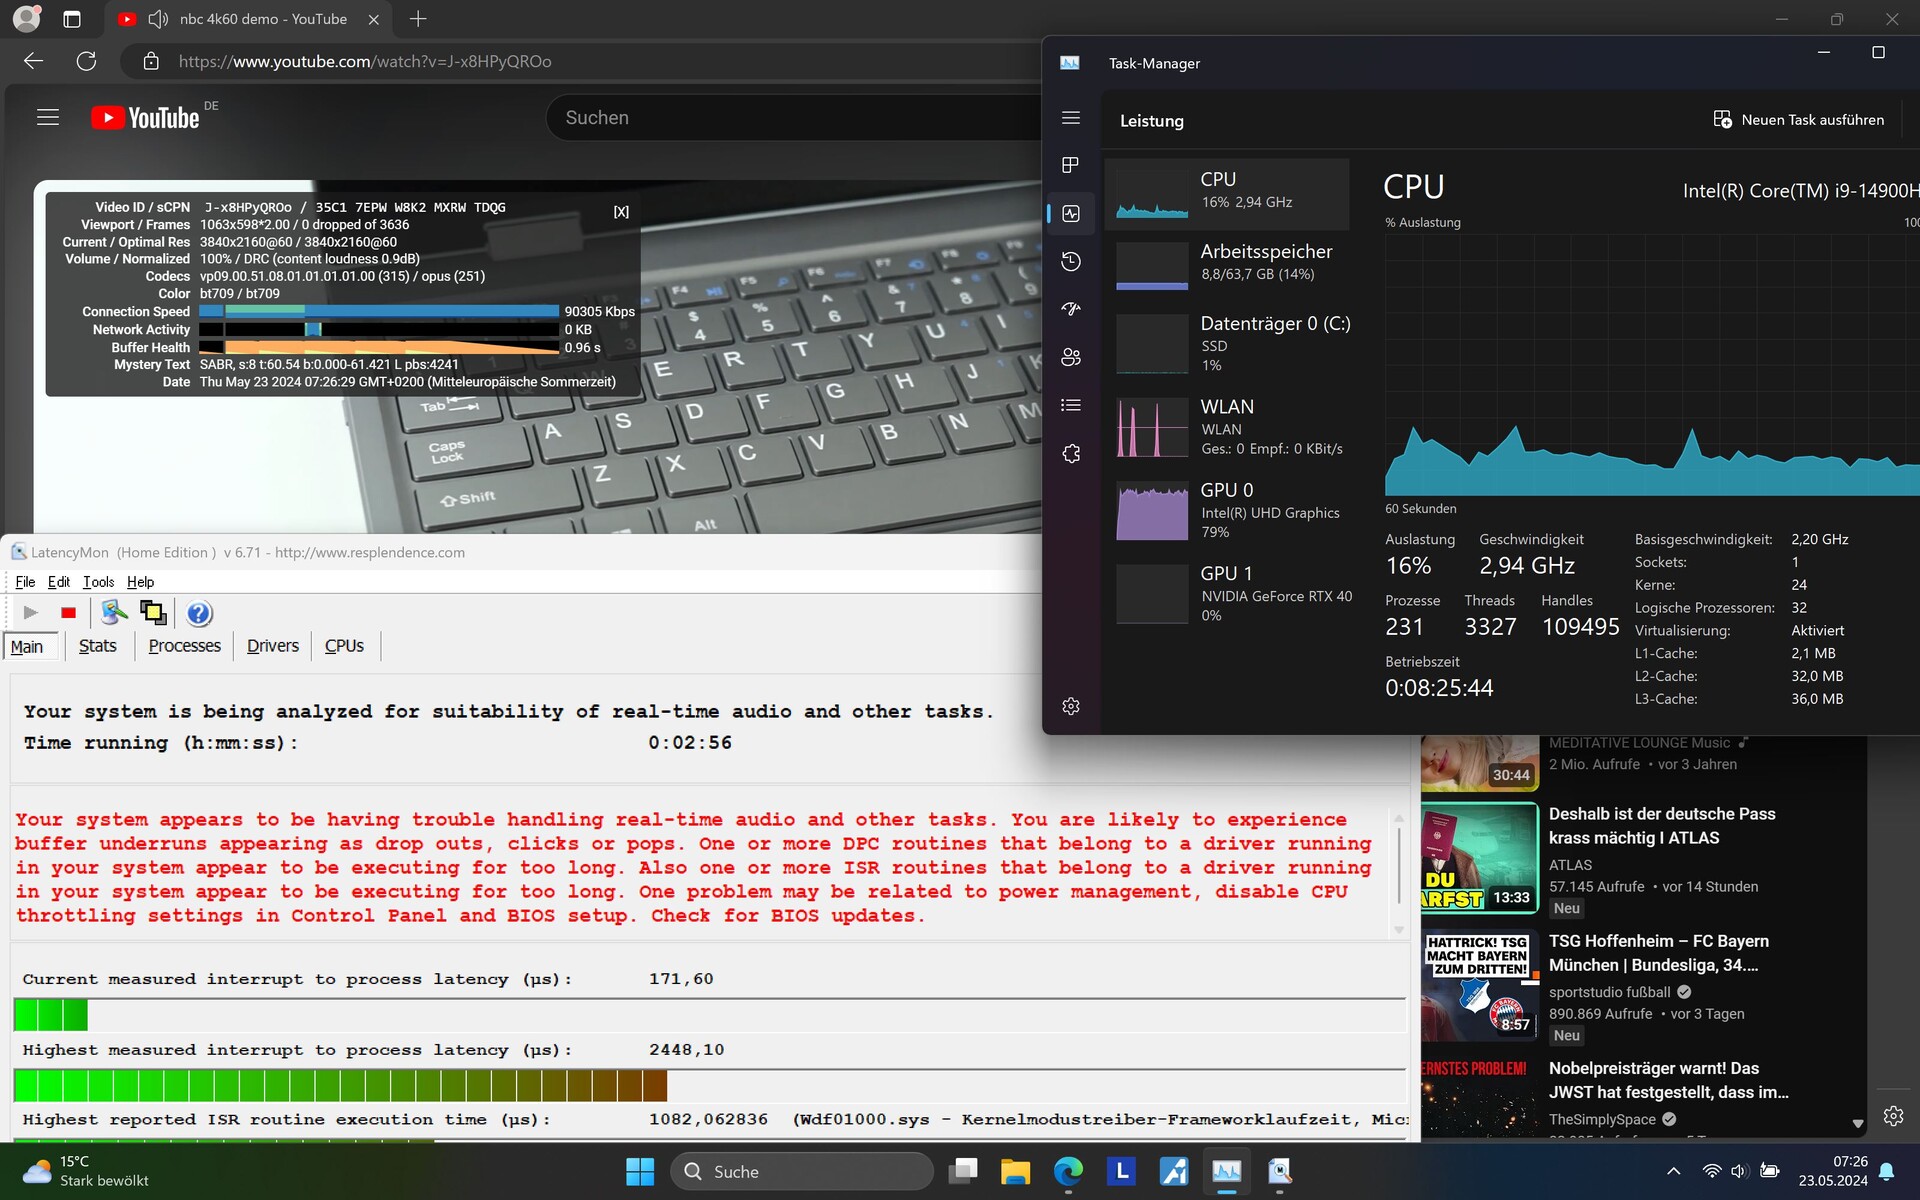
The first latencies occurred as soon as the browser was opened. The value increased minimally when opening several tabs on our website. However, it was primarily playing back our 4K/60 fps YouTube video that caused its latency value to skyrocket.
In addition, the internal GPU load—which was active in this case—was constantly at an unusually high 79 %; values of around 20 % would be normal! Nevertheless, there were no dropped frames to complain about.
| DPC Latencies / LatencyMon - interrupt to process latency (max), Web, Youtube, Prime95 | |
| Alienware m18 R2 | |
| Lenovo Legion 9 16IRX9, RTX 4090 | |
| Lenovo Legion 9 16IRX8 | |
| Razer Blade 16 2024, RTX 4090 | |
| Medion Erazer Beast X40 2024 | |
| Asus ROG Strix Scar 18 G834JYR (2024) | |
* ... smaller is better
Storage device
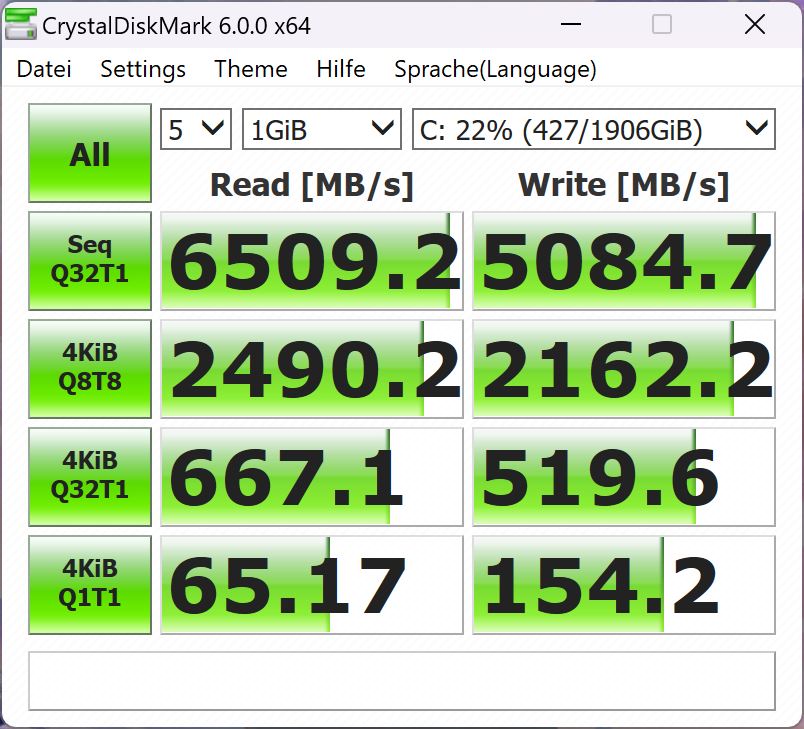
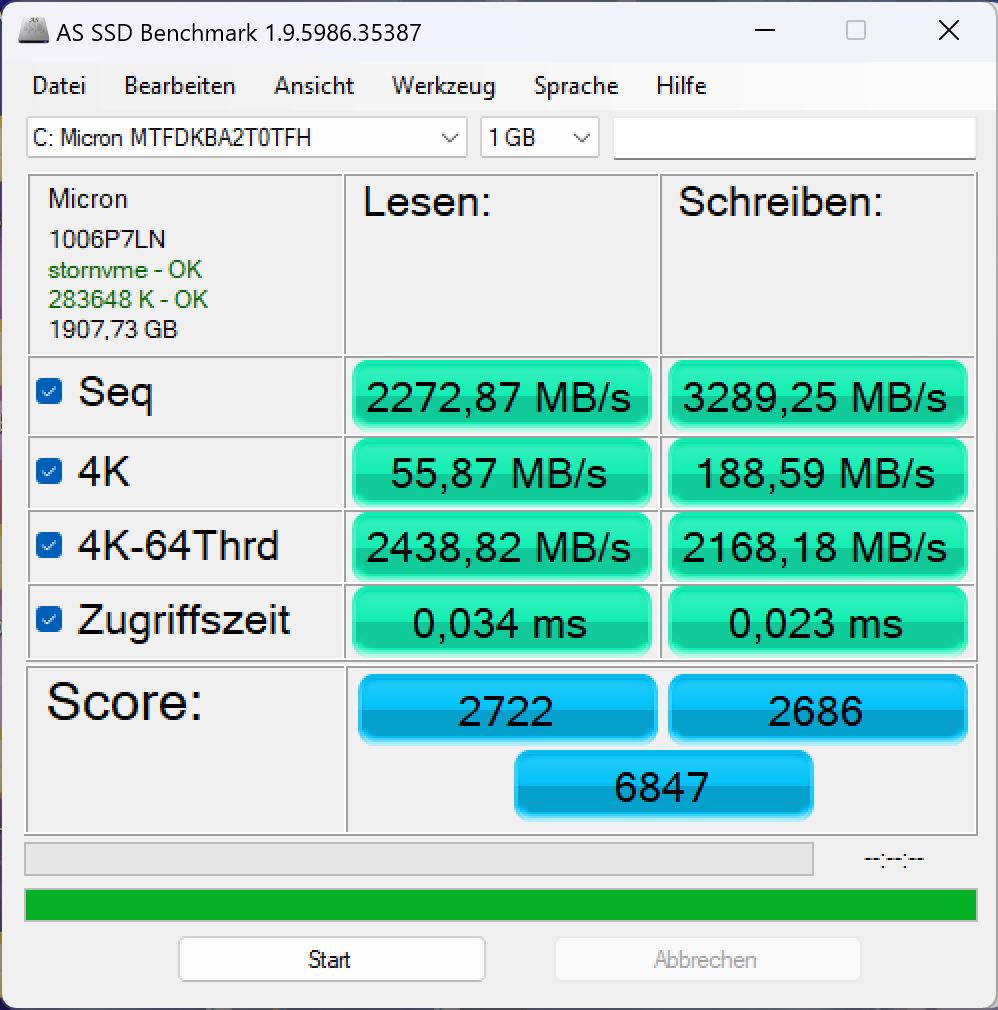
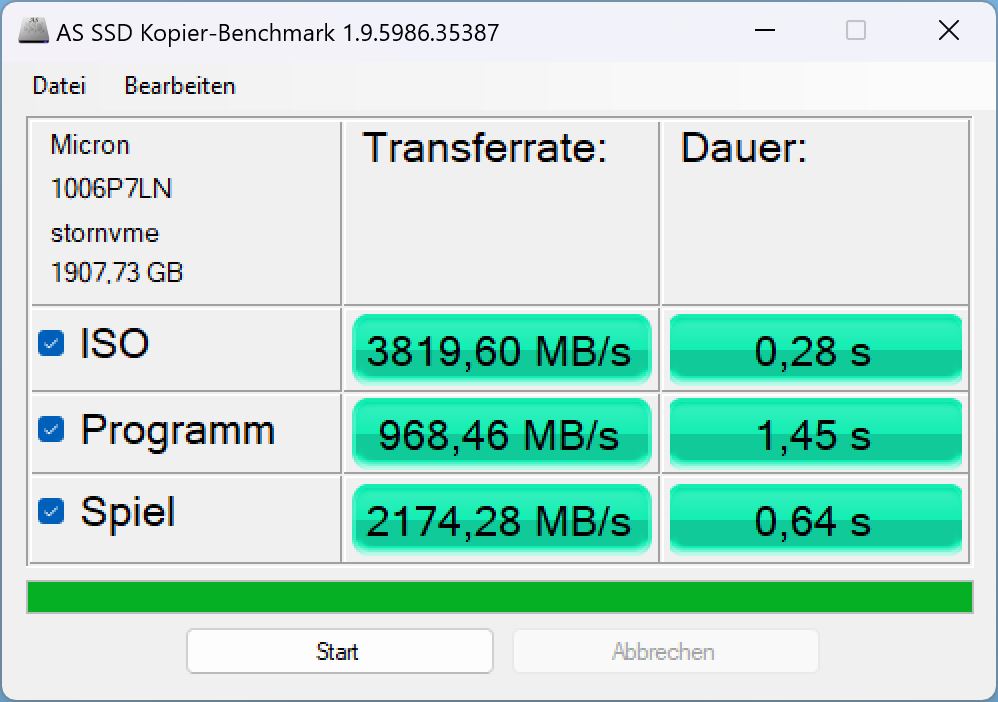
Lenovo has installed a Micron 3400 with 2 TB of storage into our test model. It is ranked 121st in our SSD best list, which means it is mid-range at best. According to Micron, it should achieve sequential read rates of up to 6,600 MB/s and sequential write rates of 5,000 MB/s, but our model was just as far away from this as the average laptop with the same SSD in our database. Only Crystaldiskmark could confirm high values, while DiskSpd and AS SSD measured significantly lower data rates.
The laptop's continuous load behavior is unusual: While other models sometimes heated up after a certain time and were then throttled, the storage device inside the Legion 9 behaved exactly the opposite. At the beginning of the test, its performance fluctuated greatly and repeatedly dropped. However, the SSD then ran constantly at maximum speed for the last two thirds of the test. This may be a sign that the Legion 9i's cooling system kicks in a little too late, or that it only reaches its optimum cooling capacity too late.

* ... smaller is better
Reading continuous performance: DiskSpd Read Loop, Queue Depth 8
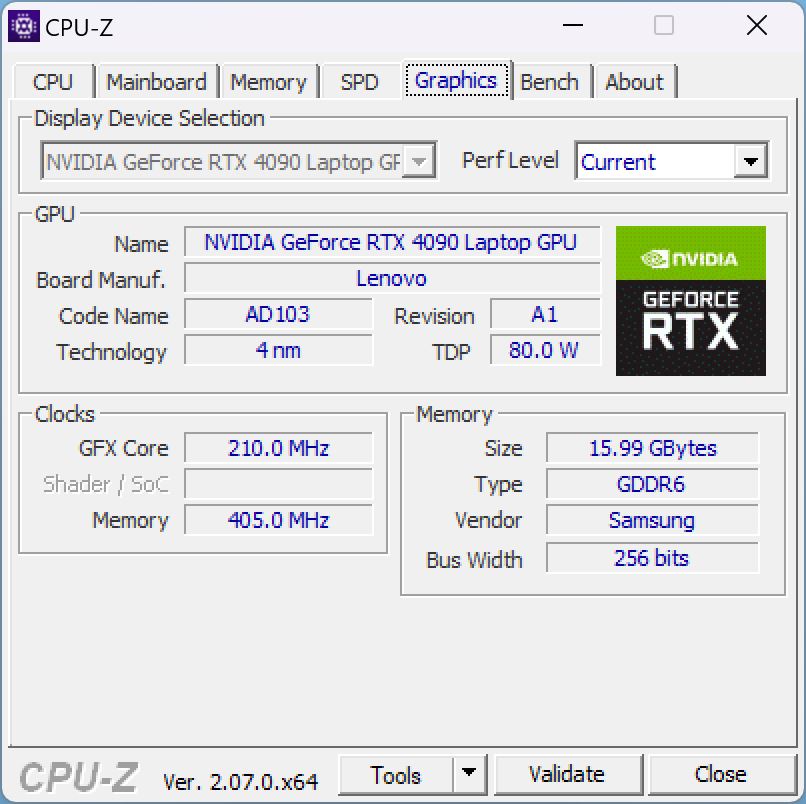
Graphics card
The Nvidia Geforce RTX 4090 inside the Legion 9i is the current spearhead of laptop graphics cards. Accordingly, it should be able to run all current games in high resolution and maximum details.
In the synthetic 3DMark tests, its performance was roughly at the expected level but again, it was a little on the lower side and the direct competition was oftentimes a few percentage points faster—incidentally also the significantly smaller and slimmer Blade 16.
If you disconnect the laptop from the power supply, its Fire Strike score drops by around 40 per cent when it comes to 3D performance.
When gaming, its performance is roughly comparable to that of the Razer Blade 16. Its results would possibly be higher if it weren't for the aforementioned brief frame rate drops. You can see the problem quite clearly in the frame rate values of our 1-hour Witcher 3 test. The frame rate drops mainly occurred in the early stages, after which the system ran stably and its performance was on par with the competition.
Only when running very current and demanding games such as Skull & Bones does its 4K frame rate sometimes slip below the 60 fps mark, otherwise all games run smoothly at over 60 fps, even in 4K.
| Performance profile/measurement value | Witcher 3 fps start | Witcher 3 fps after 10 min | Consumption in watts | GPU power consumption in watts | Avg GPU clock in MHz | Noise emissions in dB |
|---|---|---|---|---|---|---|
| Performance | 203 | 192 | 246 | 162 | 2,120 | 55.32 |
| Performance with GPU boost | 201 | 193 | 254 | 160.5 | 2,180 | 55.32 |
| Balanced with AI | 197 | 182 | 254 | 159 | 2,080 | 54.81 |
| Balanced without AI | 161 | 145 | 184 | 103 | 1,530 | 47.98 |
| Quiet | 108 | 60 | 101 | 43 | first 1,000, after 2 min 800 | 32.19 |
| 3DMark 11 Performance | 46826 points | |
| 3DMark Cloud Gate Standard Score | 67697 points | |
| 3DMark Fire Strike Score | 34686 points | |
| 3DMark Time Spy Score | 20099 points | |
Help | ||
* ... smaller is better
| The Witcher 3 - 1920x1080 Ultra Graphics & Postprocessing (HBAO+) | |
| Lenovo Legion 9 16IRX8 | |
| Alienware m18 R2 | |
| Medion Erazer Beast X40 2024 | |
| Lenovo Legion 9 16IRX9, RTX 4090 | |
| Razer Blade 16 2024, RTX 4090 | |
| Asus ROG Strix Scar 18 G834JYR (2024) | |
| Average of class Gaming (95 - 240, n=8, last 2 years) | |
| Final Fantasy XV Benchmark - 1920x1080 High Quality | |
| Alienware m18 R2 | |
| Lenovo Legion 9 16IRX8 | |
| Medion Erazer Beast X40 2024 | |
| Asus ROG Strix Scar 18 G834JYR (2024) | |
| Lenovo Legion 9 16IRX9, RTX 4090 | |
| Average of class Gaming (41 - 215, n=103, last 2 years) | |
| Razer Blade 16 2024, RTX 4090 | |
Witcher 3 FPS diagram
| low | med. | high | ultra | QHD | 4K DLSS | 4K FSR | 4K | |
|---|---|---|---|---|---|---|---|---|
| GTA V (2015) | 186.9 | 185.2 | 183.3 | 136.2 | 138.9 | 95 | ||
| The Witcher 3 (2015) | 540 | 494 | 370 | 203.4 | 165 | 104.5 | ||
| Dota 2 Reborn (2015) | 201 | 181.8 | 174.4 | 164.5 | 160.8 | |||
| Final Fantasy XV Benchmark (2018) | 228 | 194.9 | 165.1 | 142 | ||||
| X-Plane 11.11 (2018) | 193.5 | 166.3 | 125.6 | 109.6 | ||||
| Far Cry 5 (2018) | 201 | 173 | 166 | 155 | 146 | 104 | ||
| Strange Brigade (2018) | 499 | 403 | 387 | 369 | 290 | |||
| F1 23 (2023) | 151.5 | 149.2 | 144.6 | |||||
| Cyberpunk 2077 (2023) | 127 | 86 | ||||||
| Skull & Bones (2024) | 164 | 140 | 149 | 118 | 98 | 90 | 81 | 61 |
| F1 24 (2024) | 339 | 304 | 113.6 | 72.1 |
Emissions & power - Loud and warm
Noise emissions
When idle on the desktop, the laptop's fans are mostly silent. Occasionally, they may speed up briefly, but then calm down again. However, as soon as you place the device even under everyday loads such as surfing the web, the fans quickly get to work, even in Quiet mode.
During 3DMark06, the fans first continuously sped up to just over 40 dB, then calmed down again to 35 dB before leveling off at around 39 dB in the last third. This may also be a sign that the system adjusts its cooling and performance to the thermal conditions too late and only settles to the optimum values after some time.
When gaming and in Performance mode, the fans run at around 55 dB at most, which is quite loud in comparison; the Blade 16, for example, remains quieter. In Balanced mode (without AI), the laptop's noise emissions drop to a more moderate 47 dB, but its gaming performance then decreases noticeably, namely by 20 to 25 per cent.
Noise level
| Idle |
| 23 / 23 / 23 dB(A) |
| Load |
| 39 / 55.56 dB(A) |
 | ||
30 dB silent 40 dB(A) audible 50 dB(A) loud |
||
min: | ||
| Lenovo Legion 9 16IRX9, RTX 4090 GeForce RTX 4090 Laptop GPU, i9-14900HX, Micron 3400 2TB MTFDKBA2T0TFH | Lenovo Legion 9 16IRX8 GeForce RTX 4090 Laptop GPU, i9-13980HX, 2x SK Hynix HFS001TEJ9X115N (RAID 0) | Razer Blade 16 2024, RTX 4090 GeForce RTX 4090 Laptop GPU, i9-14900HX, Samsung PM9A1 MZVL22T0HBLB | Alienware m18 R2 GeForce RTX 4090 Laptop GPU, i9-14900HX, SK Hynix PC811 HFS002TEM9X152N | Asus ROG Strix Scar 18 G834JYR (2024) GeForce RTX 4090 Laptop GPU, i9-14900HX, Samsung PM9A1a MZVL22T0HDLB | Medion Erazer Beast X40 2024 GeForce RTX 4090 Laptop GPU, i9-14900HX, Phison E18-1TB-PHISON-SSD-BICS5 | |
|---|---|---|---|---|---|---|
| Noise | -2% | -1% | -5% | -13% | -15% | |
| off / environment * (dB) | 23 | 23.7 -3% | 23 -0% | 23.6 -3% | 24 -4% | 25 -9% |
| Idle Minimum * (dB) | 23 | 24 -4% | 23 -0% | 23.8 -3% | 27 -17% | 28 -22% |
| Idle Average * (dB) | 23 | 24 -4% | 23 -0% | 26.1 -13% | 28 -22% | 29 -26% |
| Idle Maximum * (dB) | 23 | 30.4 -32% | 27.66 -20% | 31.5 -37% | 32 -39% | 32 -39% |
| Load Average * (dB) | 39 | 30.4 22% | 43.76 -12% | 31.5 19% | 50 -28% | 48 -23% |
| Witcher 3 ultra * (dB) | 55.32 | 52.2 6% | 46.81 15% | 52.1 6% | 50 10% | 50 10% |
| Load Maximum * (dB) | 55.56 | 54.9 1% | 50.37 9% | 56.6 -2% | 52 6% | 52 6% |
* ... smaller is better
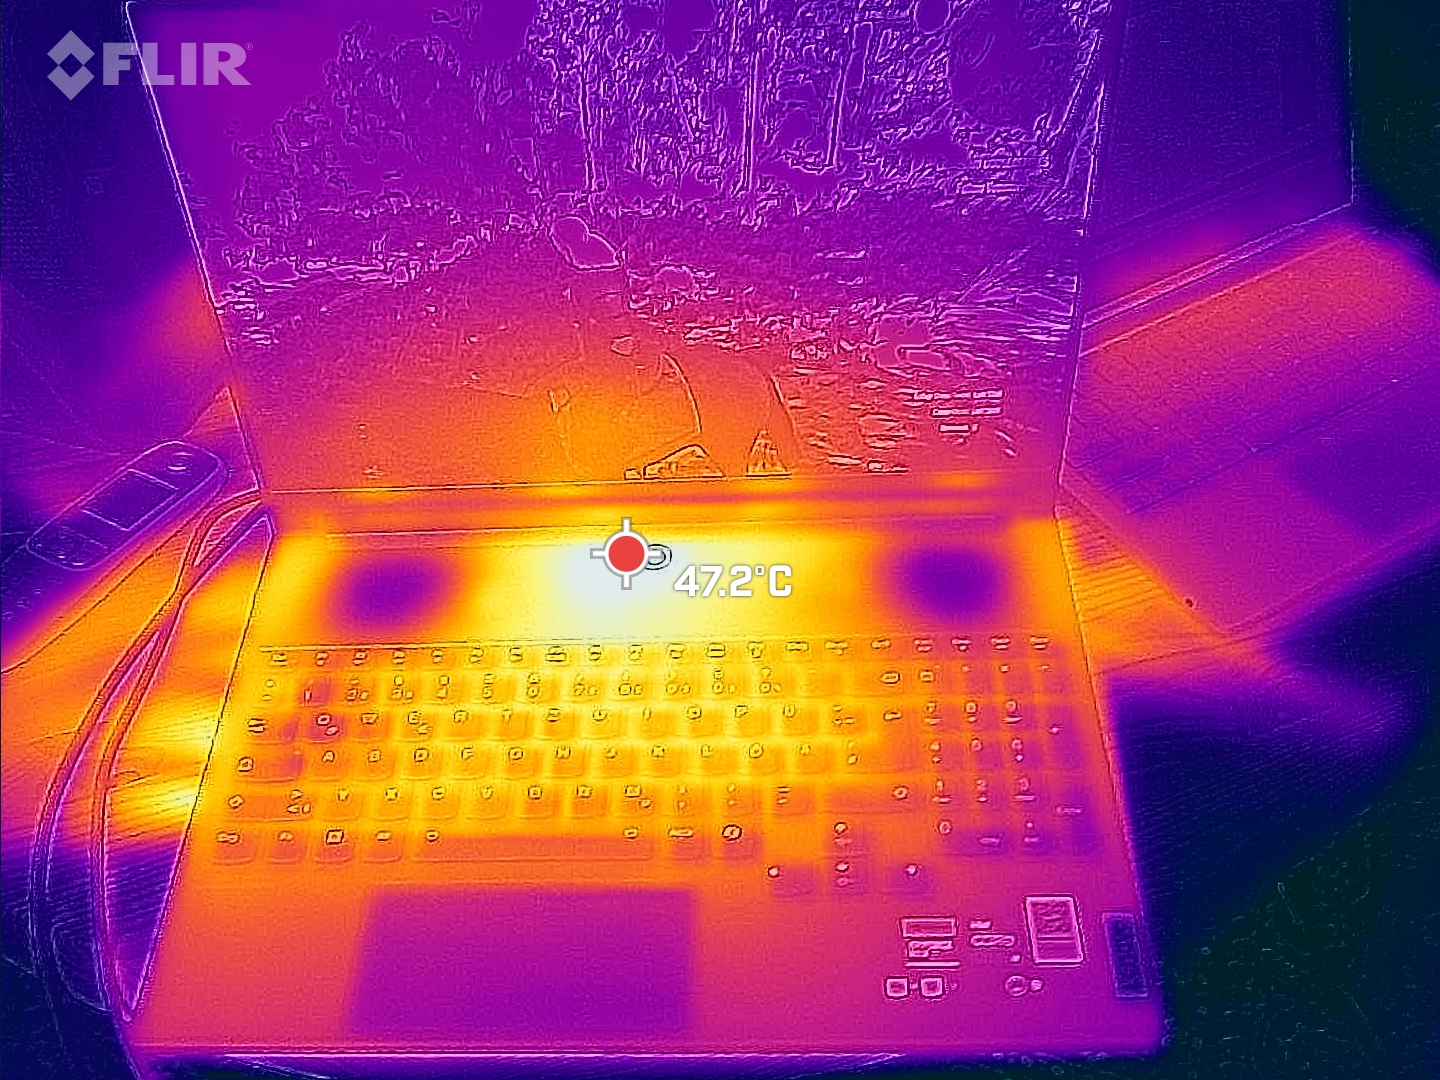
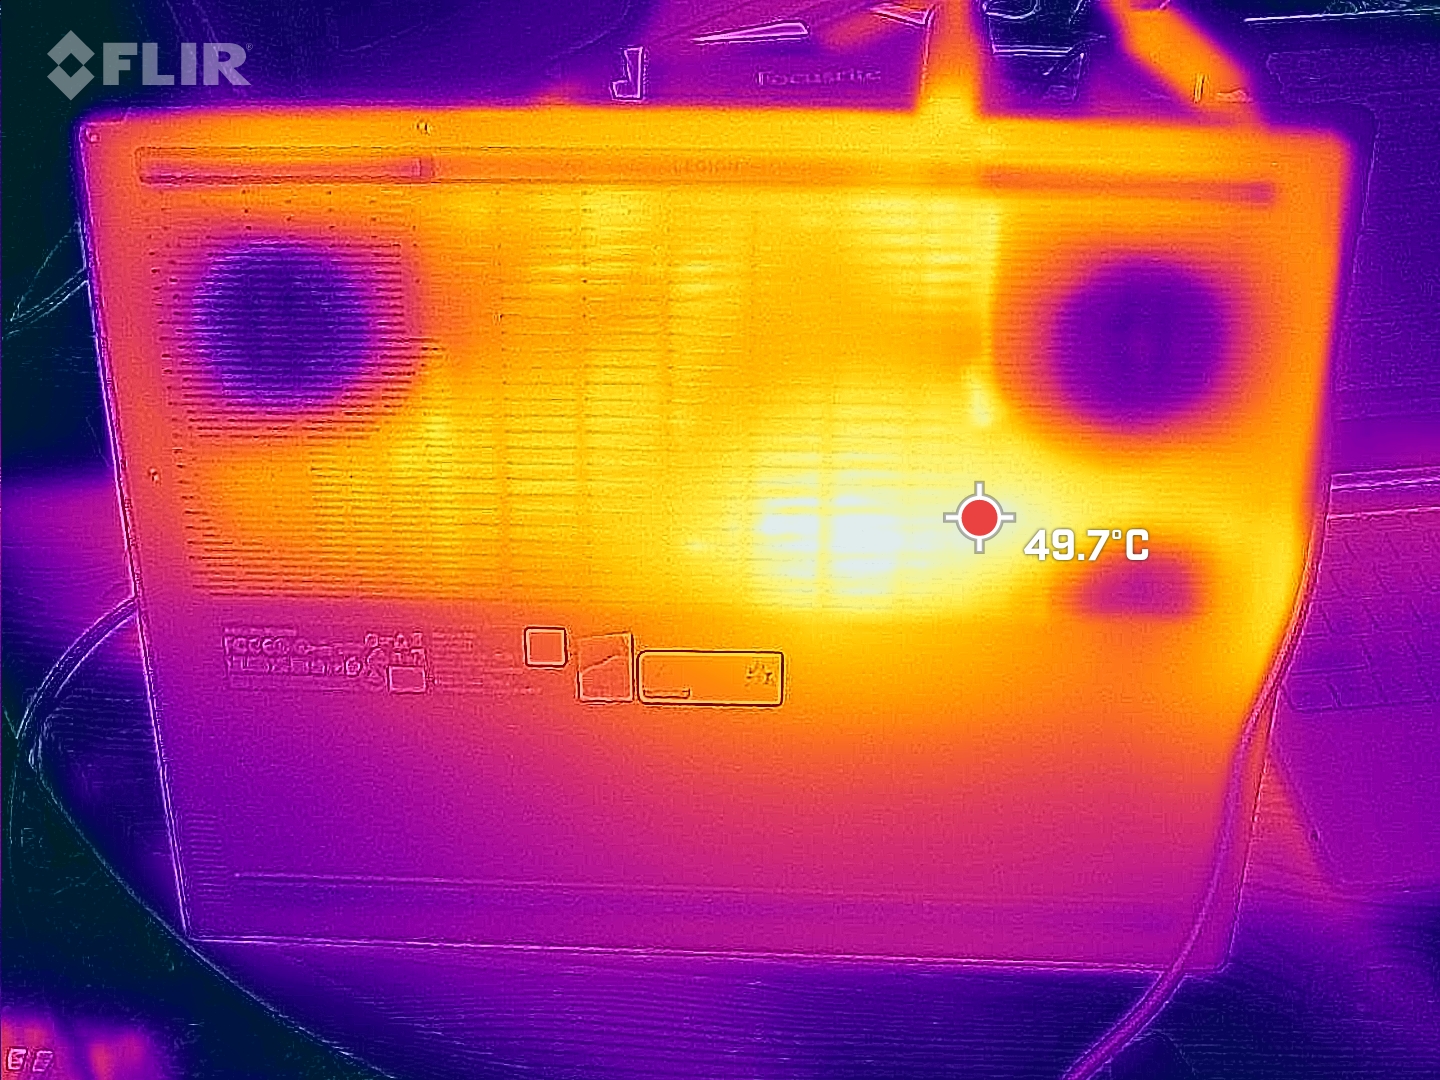
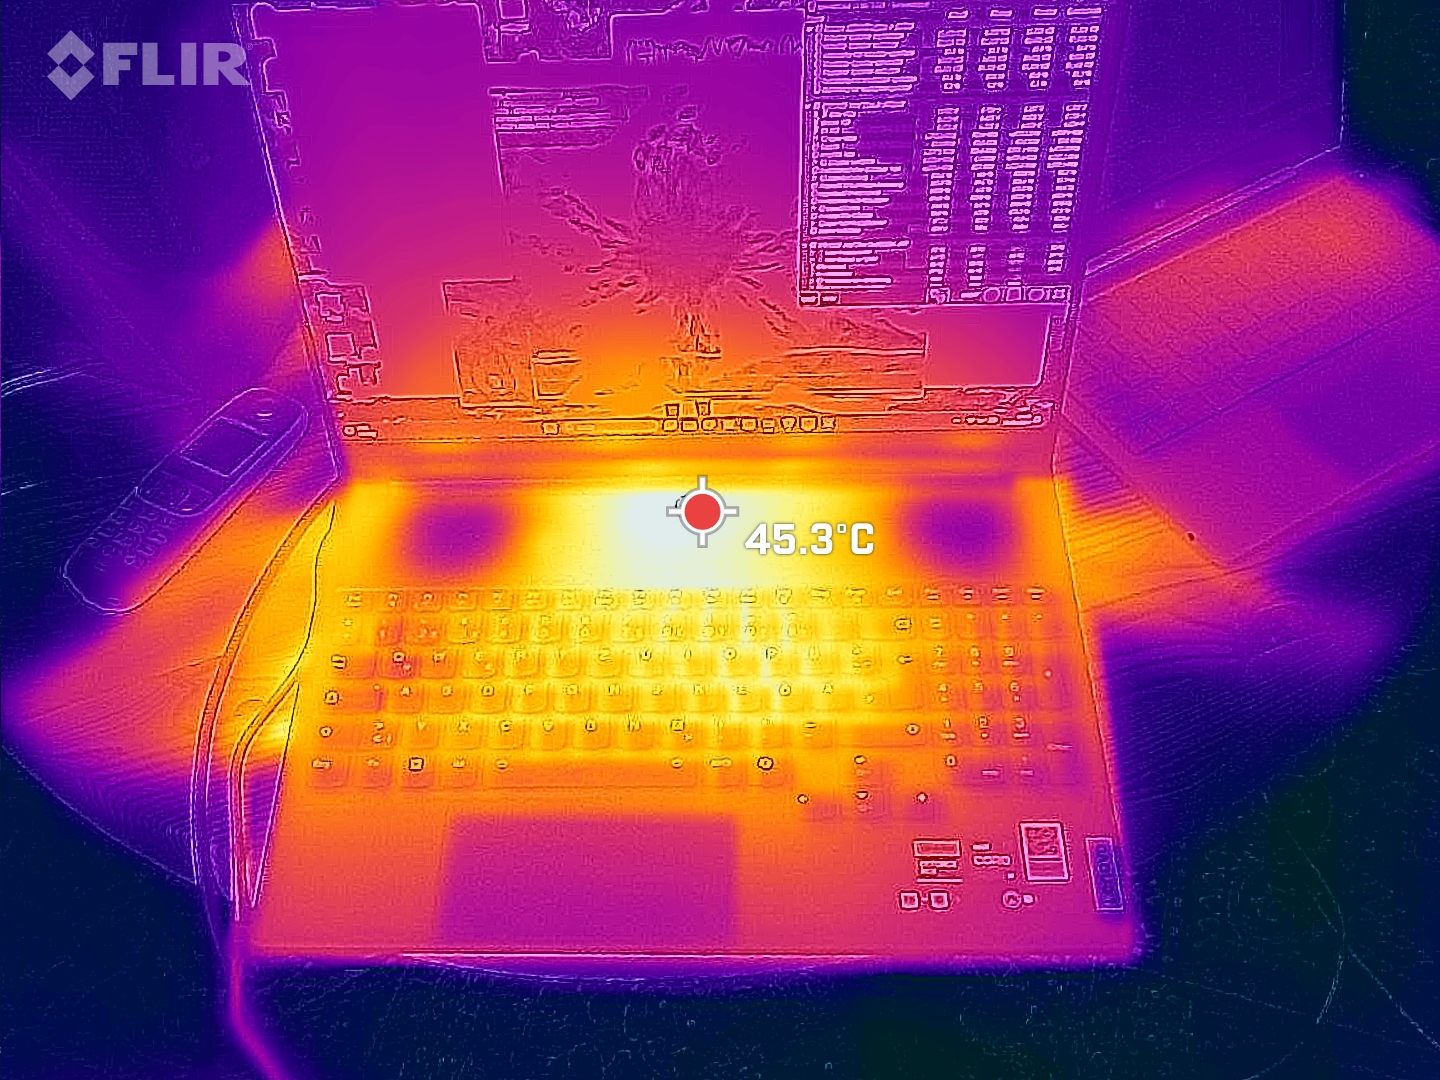
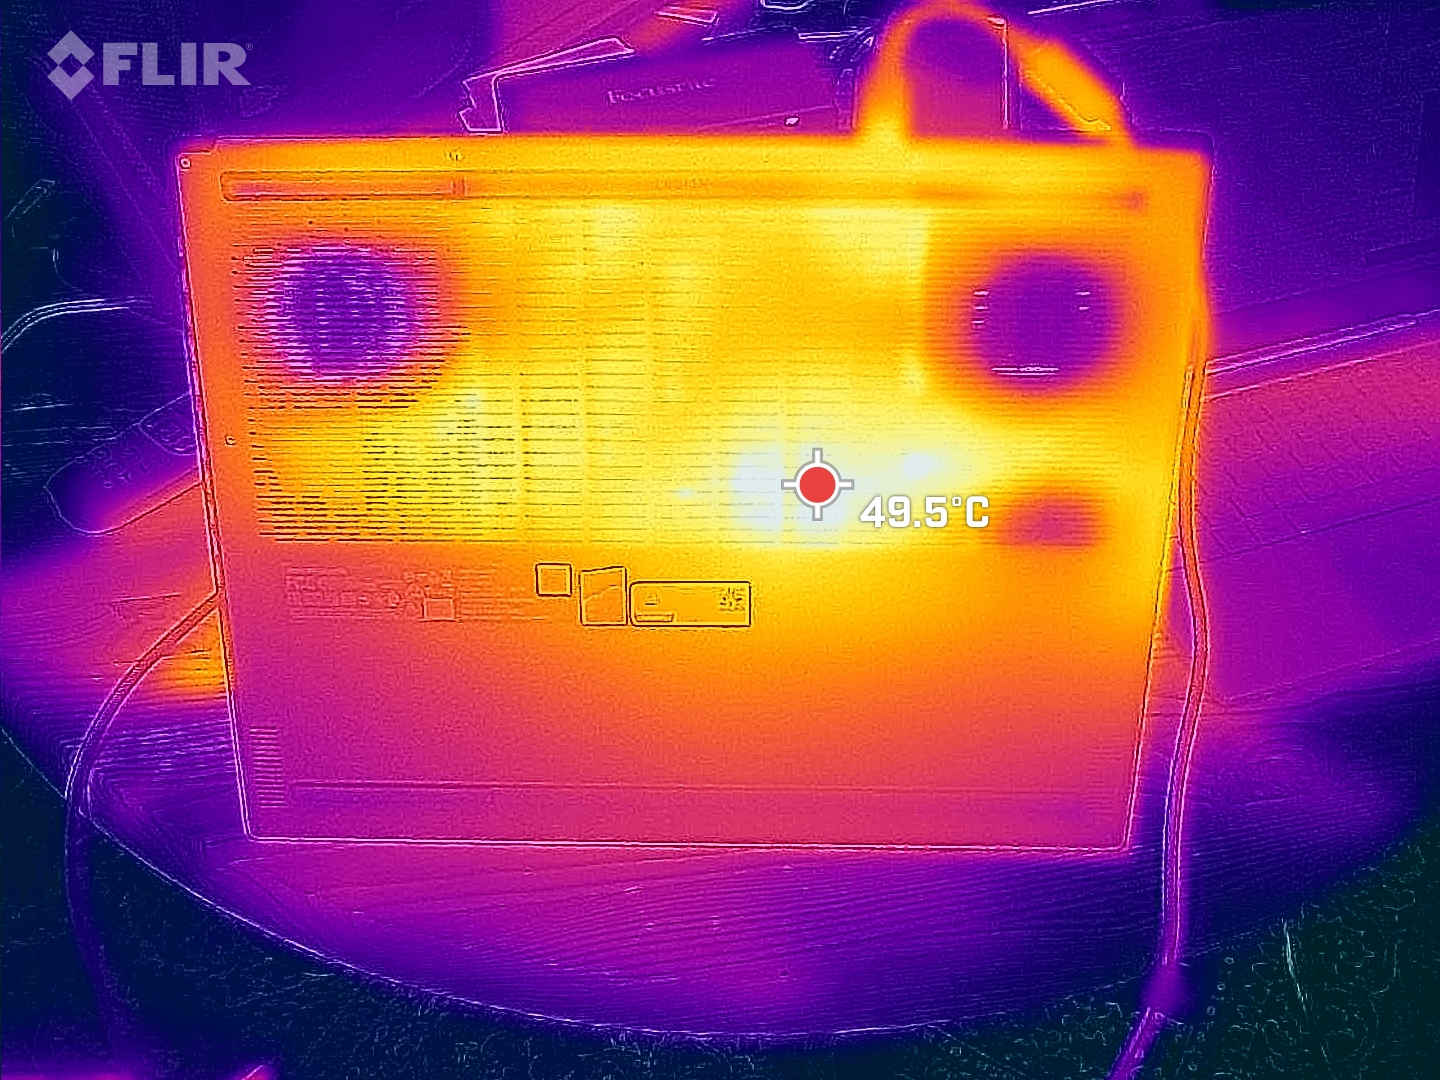
Temperature
Despite its rather loud cooling system, the laptop's temperatures are quite high in comparison. The hot spots when gaming and under other heavy loads are in the center and towards the screen. It can also get quite warm around the WASD keys—we measured 46 °C. At least the palm rests remain okay. Even its predecessor wasn't ideal in this aspect, but Lenovo has obviously not made any improvements.
(-) The maximum temperature on the upper side is 56 °C / 133 F, compared to the average of 40.4 °C / 105 F, ranging from 21.2 to 68.8 °C for the class Gaming.
(-) The bottom heats up to a maximum of 53 °C / 127 F, compared to the average of 43.2 °C / 110 F
(±) In idle usage, the average temperature for the upper side is 33.6 °C / 92 F, compared to the device average of 33.9 °C / 93 F.
(-) Playing The Witcher 3, the average temperature for the upper side is 42.3 °C / 108 F, compared to the device average of 33.9 °C / 93 F.
(±) The palmrests and touchpad can get very hot to the touch with a maximum of 36 °C / 96.8 F.
(-) The average temperature of the palmrest area of similar devices was 28.8 °C / 83.8 F (-7.2 °C / -13 F).
| Lenovo Legion 9 16IRX9, RTX 4090 Intel Core i9-14900HX, NVIDIA GeForce RTX 4090 Laptop GPU | Lenovo Legion 9 16IRX8 Intel Core i9-13980HX, NVIDIA GeForce RTX 4090 Laptop GPU | Razer Blade 16 2024, RTX 4090 Intel Core i9-14900HX, NVIDIA GeForce RTX 4090 Laptop GPU | Alienware m18 R2 Intel Core i9-14900HX, NVIDIA GeForce RTX 4090 Laptop GPU | Asus ROG Strix Scar 18 G834JYR (2024) Intel Core i9-14900HX, NVIDIA GeForce RTX 4090 Laptop GPU | Medion Erazer Beast X40 2024 Intel Core i9-14900HX, NVIDIA GeForce RTX 4090 Laptop GPU | |
|---|---|---|---|---|---|---|
| Heat | 11% | 21% | 9% | 17% | 13% | |
| Maximum Upper Side * (°C) | 56 | 49.6 11% | 45 20% | 41.2 26% | 49 12% | 47 16% |
| Maximum Bottom * (°C) | 53 | 48.6 8% | 45 15% | 34.6 35% | 47 11% | 54 -2% |
| Idle Upper Side * (°C) | 38 | 33.2 13% | 29 24% | 42.8 -13% | 29 24% | 30 21% |
| Idle Bottom * (°C) | 39 | 34.2 12% | 30 23% | 43.6 -12% | 31 21% | 32 18% |
* ... smaller is better
Speakers
The audible range is very linear, the high and mid tones are well-balanced. However, the bass is naturally reduced, but still perceptible. The speakers could also do with being a little more powerful, i.e. louder.
Lenovo Legion 9 16IRX9, RTX 4090 audio analysis
(±) | speaker loudness is average but good (78.96 dB)
Bass 100 - 315 Hz
(±) | reduced bass - on average 13.2% lower than median
(±) | linearity of bass is average (8.9% delta to prev. frequency)
Mids 400 - 2000 Hz
(+) | balanced mids - only 3.2% away from median
(+) | mids are linear (3.4% delta to prev. frequency)
Highs 2 - 16 kHz
(+) | balanced highs - only 1.8% away from median
(+) | highs are linear (4% delta to prev. frequency)
Overall 100 - 16.000 Hz
(+) | overall sound is linear (11.3% difference to median)
Compared to same class
» 8% of all tested devices in this class were better, 3% similar, 88% worse
» The best had a delta of 6%, average was 18%, worst was 132%
Compared to all devices tested
» 7% of all tested devices were better, 2% similar, 91% worse
» The best had a delta of 4%, average was 24%, worst was 134%
Razer Blade 16 2024, RTX 4090 audio analysis
(±) | speaker loudness is average but good (81.16 dB)
Bass 100 - 315 Hz
(±) | reduced bass - on average 8.2% lower than median
(±) | linearity of bass is average (7.4% delta to prev. frequency)
Mids 400 - 2000 Hz
(+) | balanced mids - only 3.3% away from median
(+) | mids are linear (5.9% delta to prev. frequency)
Highs 2 - 16 kHz
(+) | balanced highs - only 1.6% away from median
(+) | highs are linear (3.1% delta to prev. frequency)
Overall 100 - 16.000 Hz
(+) | overall sound is linear (9.2% difference to median)
Compared to same class
» 3% of all tested devices in this class were better, 1% similar, 96% worse
» The best had a delta of 6%, average was 18%, worst was 132%
Compared to all devices tested
» 3% of all tested devices were better, 1% similar, 96% worse
» The best had a delta of 4%, average was 24%, worst was 134%
Power consumption
Its consumption may be slightly improved compared to the predecessor model, both when idling and otherwise. However, not by much—even the 18-inch competition is often more frugal, at least when idling.
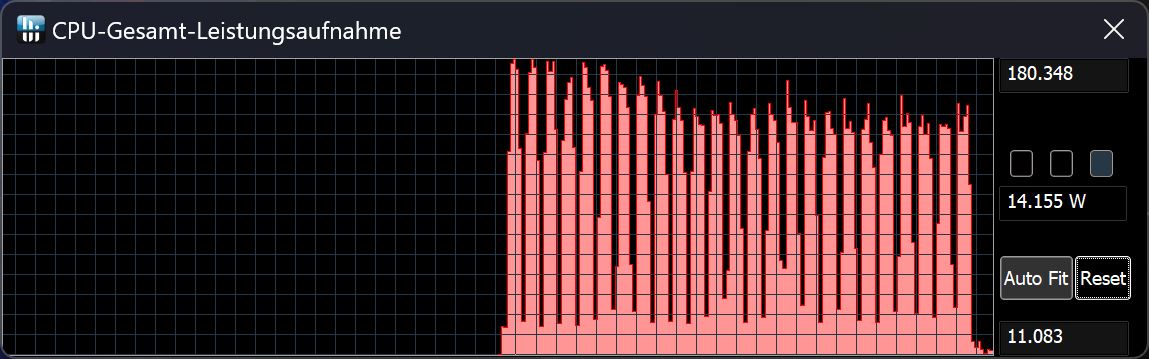
The supposed problem of the new Legion 9 can be seen again in its consumption graphs, as its consumption (and therefore also its performance) dropped very briefly from time to time across various tests. What was still normal in Cinebench 23 was no longer so in the Witcher 3 or Furmark tests.
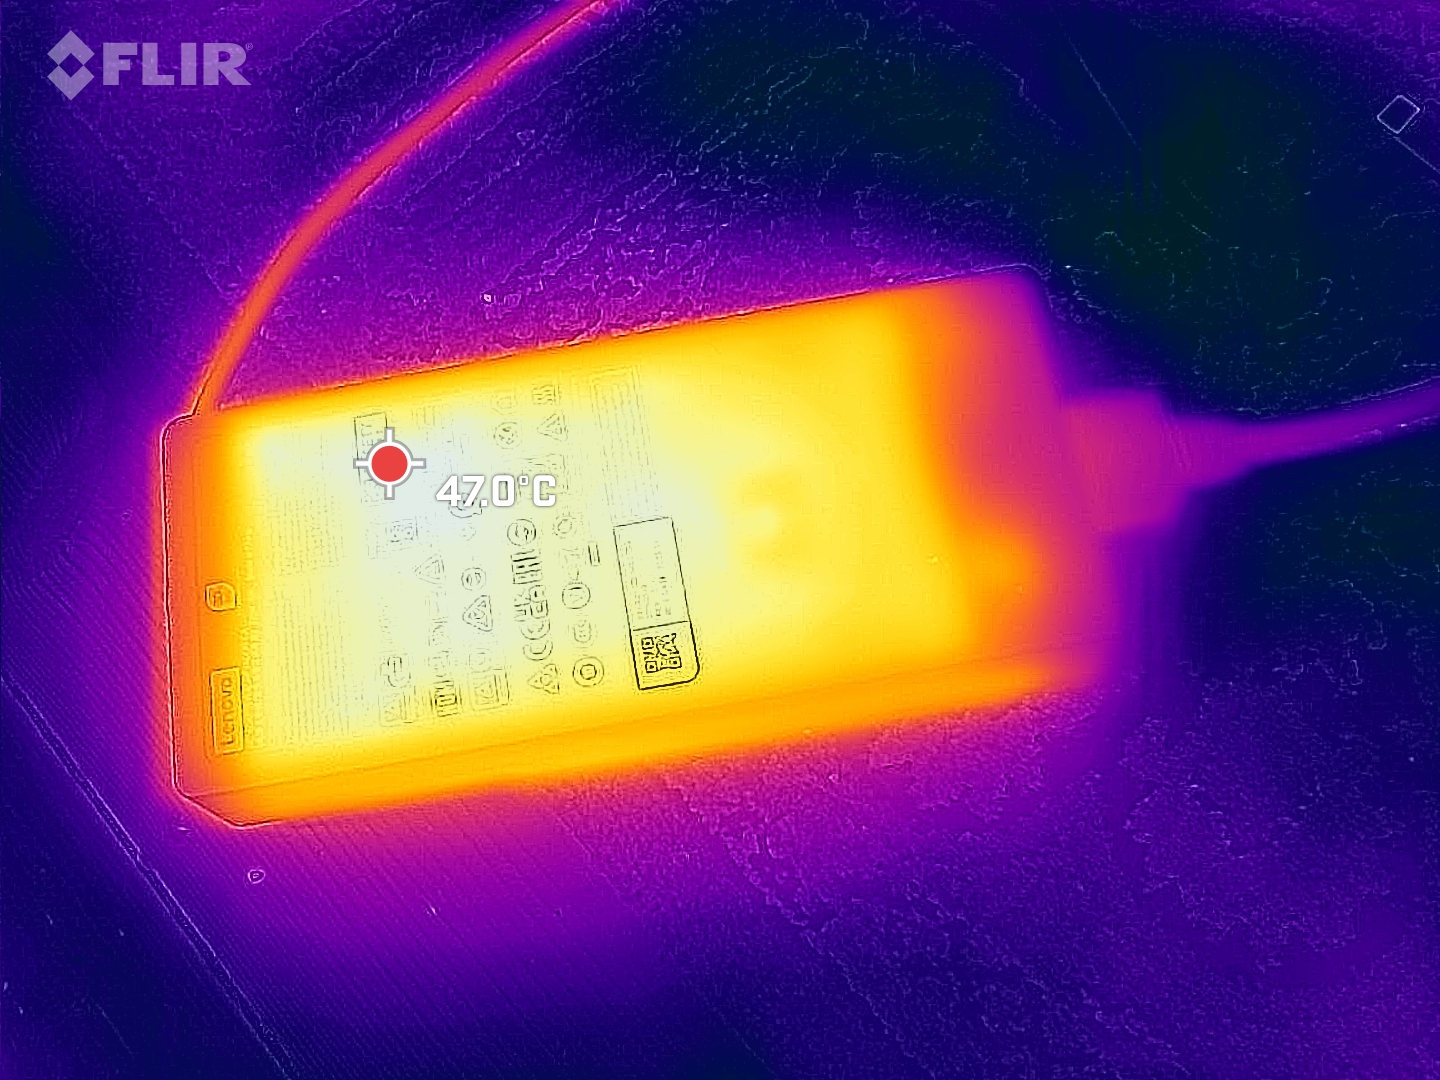
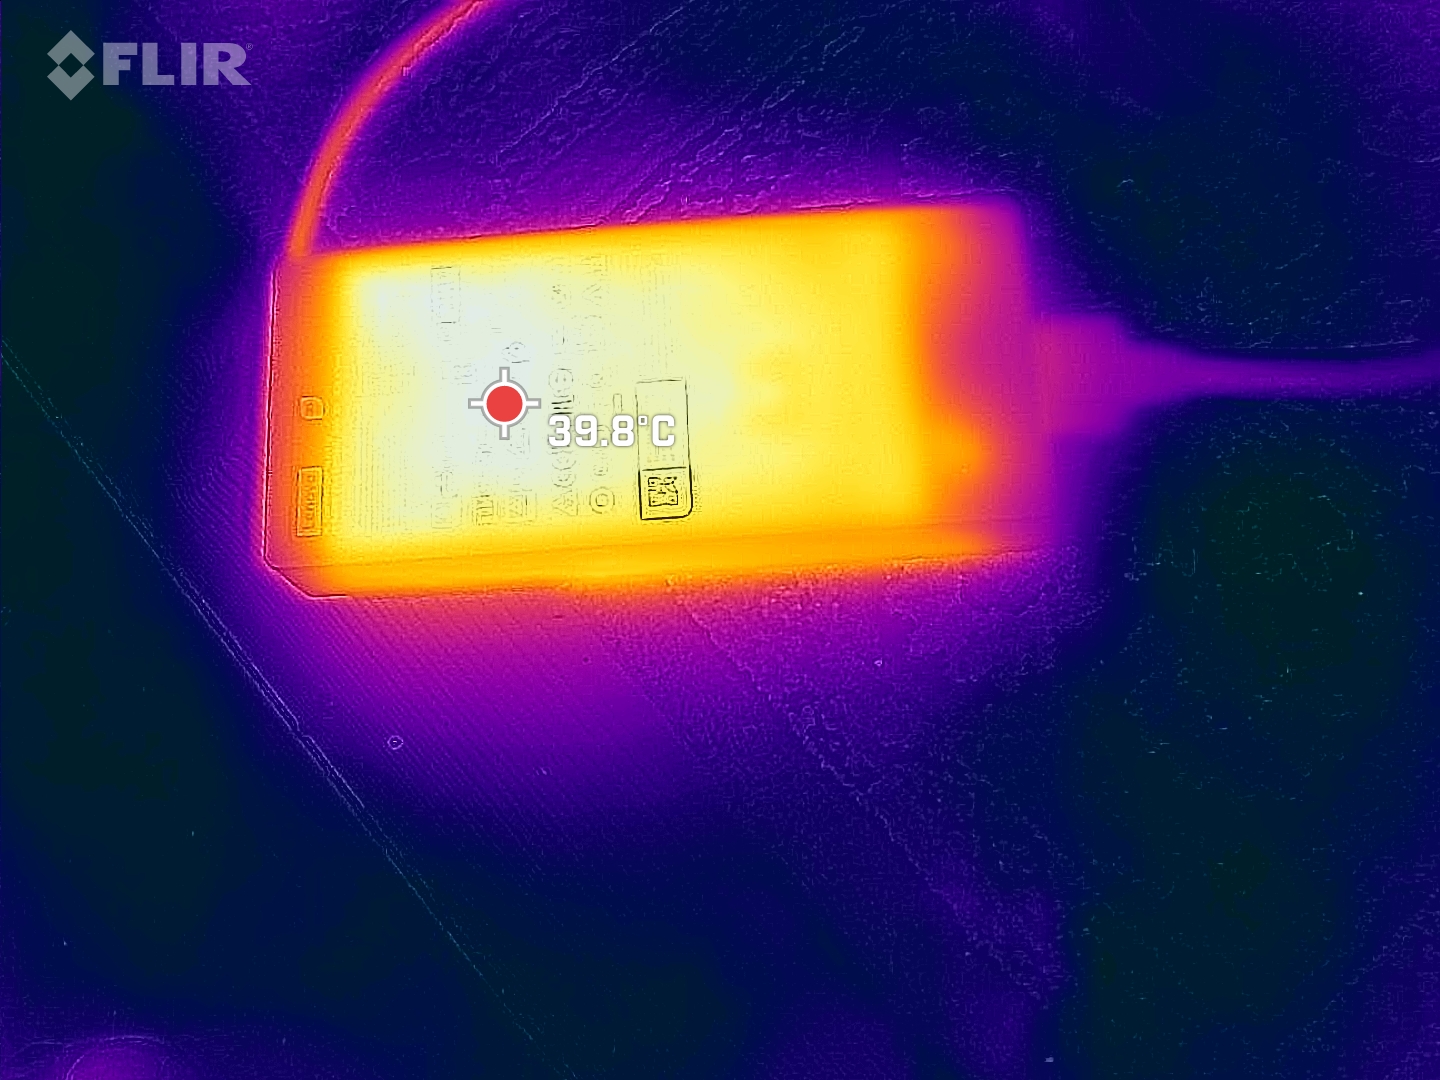
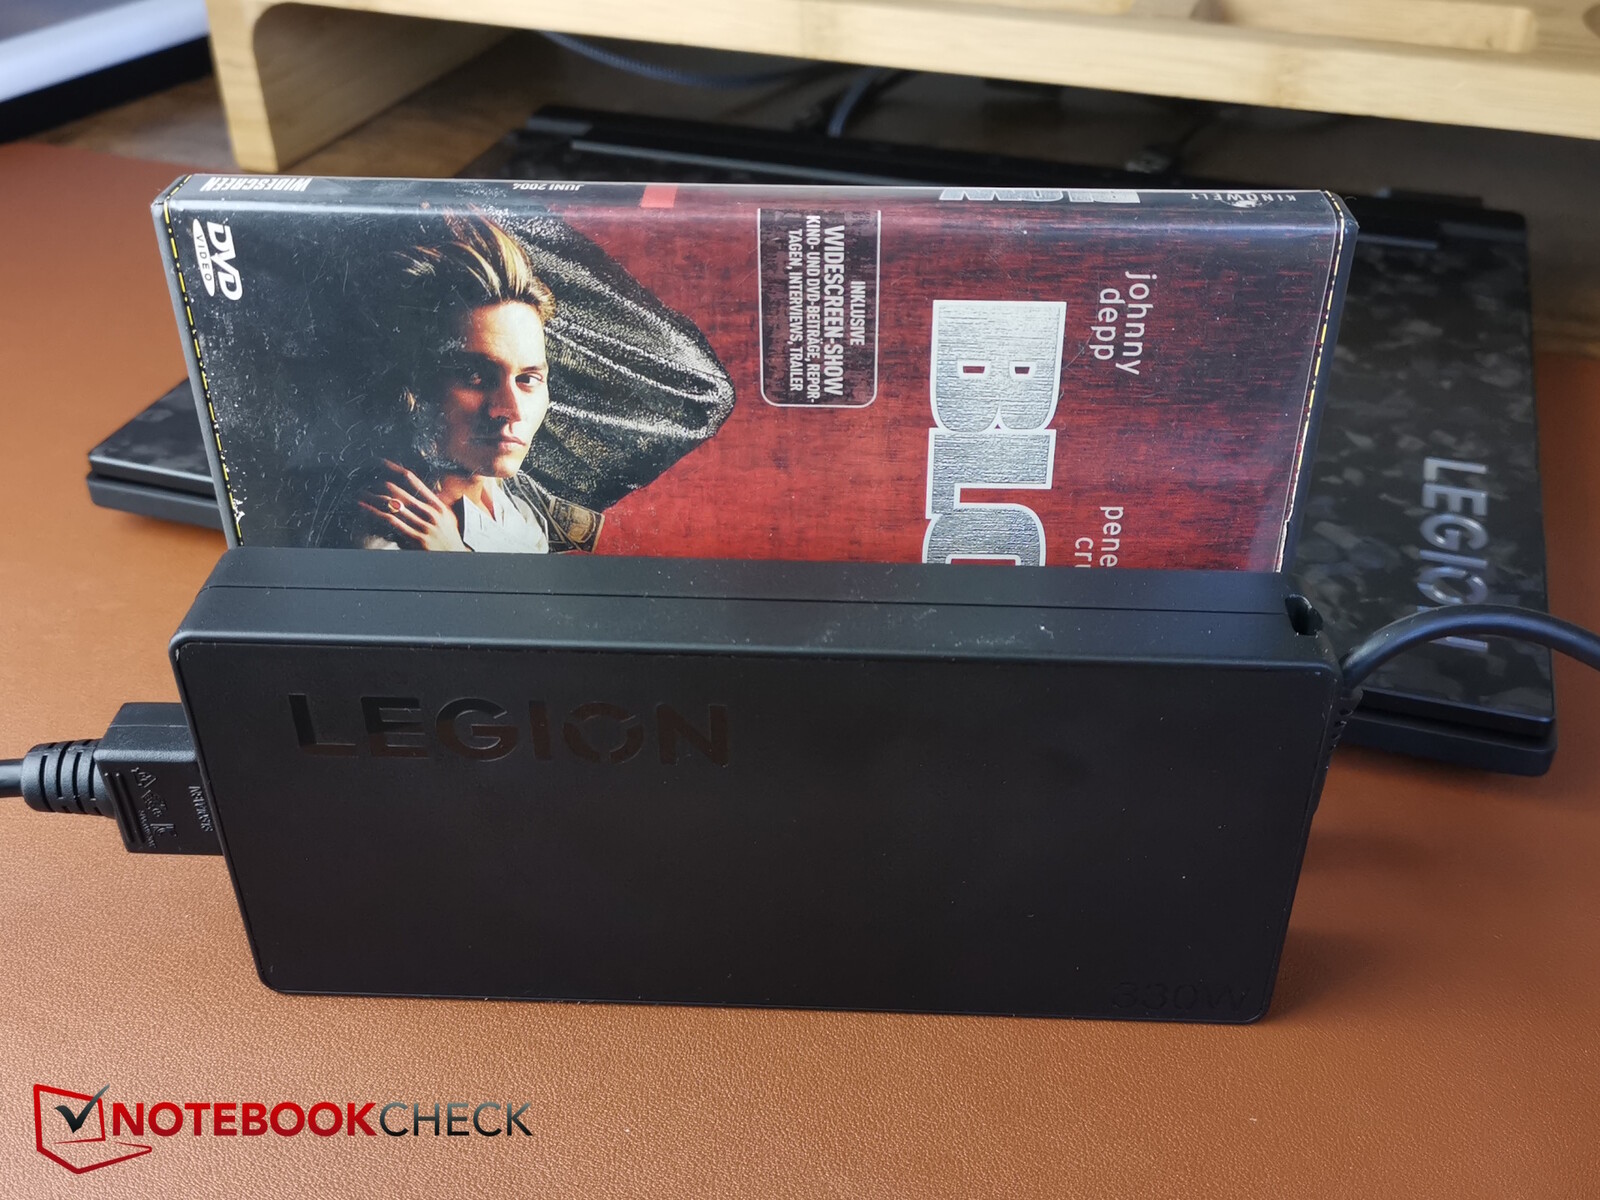
We measured a short-term maximum consumption of 323 watts using the flat and comparatively small power supply unit. This unit is designed for 330 watts and should therefore have no problems supplying the laptop with power in all situations.
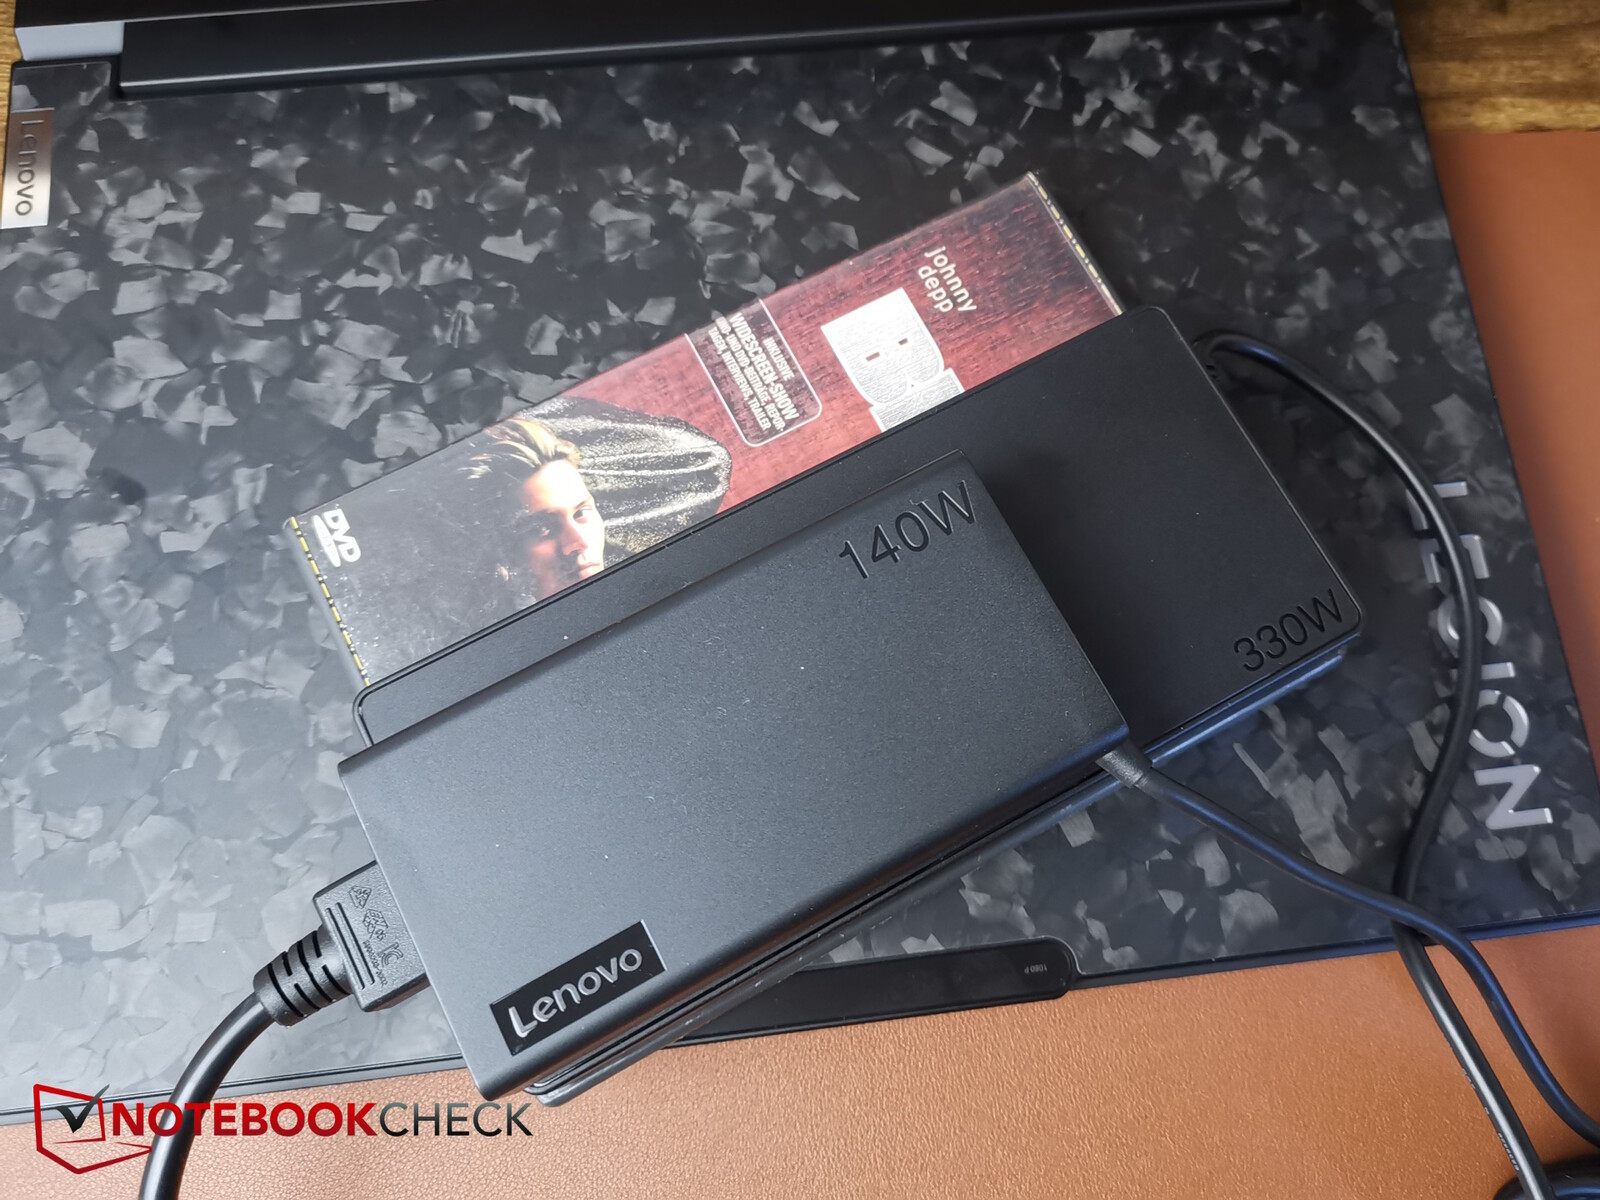
A unique feature: The Legion 9 also comes with a second power supply unit, a much smaller 140-watt USB-C power supply unit. If you're not gaming, the smaller adapter is of course even better suited for use on the go.
| Off / Standby | |
| Idle | |
| Load |
|
Key:
min: | |
| Lenovo Legion 9 16IRX9, RTX 4090 i9-14900HX, GeForce RTX 4090 Laptop GPU, Micron 3400 2TB MTFDKBA2T0TFH, MiniLED, 3200x2000, 16" | Lenovo Legion 9 16IRX8 i9-13980HX, GeForce RTX 4090 Laptop GPU, 2x SK Hynix HFS001TEJ9X115N (RAID 0), Mini-LED, 3200x2000, 16" | Razer Blade 16 2024, RTX 4090 i9-14900HX, GeForce RTX 4090 Laptop GPU, Samsung PM9A1 MZVL22T0HBLB, OLED, 2560x1600, 16" | Asus ROG Strix Scar 18 G834JYR (2024) i9-14900HX, GeForce RTX 4090 Laptop GPU, Samsung PM9A1a MZVL22T0HDLB, Mini LED, 2560x1600, 18" | Medion Erazer Beast X40 2024 i9-14900HX, GeForce RTX 4090 Laptop GPU, Phison E18-1TB-PHISON-SSD-BICS5, IPS, 2560x1600, 17" | Average NVIDIA GeForce RTX 4090 Laptop GPU | Average of class Gaming | |
|---|---|---|---|---|---|---|---|
| Power Consumption | -34% | 12% | 11% | 13% | 1% | 21% | |
| Idle Minimum * (Watt) | 20.5 | 32.3 -58% | 16.9 18% | 14 32% | 7 66% | 16.2 ? 21% | 13.4 ? 35% |
| Idle Average * (Watt) | 27.7 | 42.6 -54% | 17.8 36% | 17 39% | 15 46% | 23.1 ? 17% | 19.1 ? 31% |
| Idle Maximum * (Watt) | 32.1 | 57.9 -80% | 19.6 39% | 24 25% | 33 -3% | 34.2 ? -7% | 24.7 ? 23% |
| Load Average * (Watt) | 105 | 121 -15% | 128 -22% | 143 -36% | 134 -28% | 130.5 ? -24% | 108.4 ? -3% |
| Witcher 3 ultra * (Watt) | 246 | 254 -3% | 243 1% | 251 -2% | 280 -14% | ||
| Load Maximum * (Watt) | 323 | 297.7 8% | 328 -2% | 302 7% | 294 9% | 324 ? -0% | 254 ? 21% |
* ... smaller is better
Power consumption Witcher 3 / stress test
Power consumption with external monitor
Runtimes
The built-in battery has a capacity of around 100 Wh, which is similar to the competition. Nevertheless, its runtimes are often shorter—a problem that its predecessor and other laptops with MiniLED screens already have to contend with. Although its runtimes have been improved, the comparison devices (apart from the Alienware laptop) get longer runtimes out of their batteries. The same applies to the Asus ROG Scar Strix, for example, which also has a MiniLED display.
Still, it is enough for just under 5 hours of watching videos or surfing the web with the brightness reduced to 150 nits. The Asus device lasts over 6 hours here.
The Lenovo laptop supports a fast-charging function, which first needs to be activated in the Vantage software. After that, a full charge only takes around an hour.
| Lenovo Legion 9 16IRX9, RTX 4090 i9-14900HX, GeForce RTX 4090 Laptop GPU, 99.99 Wh | Lenovo Legion 9 16IRX8 i9-13980HX, GeForce RTX 4090 Laptop GPU, 99.9 Wh | Razer Blade 16 2024, RTX 4090 i9-14900HX, GeForce RTX 4090 Laptop GPU, 95.2 Wh | Alienware m18 R2 i9-14900HX, GeForce RTX 4090 Laptop GPU, 97 Wh | Asus ROG Strix Scar 18 G834JYR (2024) i9-14900HX, GeForce RTX 4090 Laptop GPU, 90 Wh | Medion Erazer Beast X40 2024 i9-14900HX, GeForce RTX 4090 Laptop GPU, 99.8 Wh | Average of class Gaming | |
|---|---|---|---|---|---|---|---|
| Battery runtime | -50% | 10% | 0% | 24% | 29% | 27% | |
| H.264 (h) | 4.9 | 7.6 55% | 7.5 53% | 8.26 ? 69% | |||
| WiFi v1.3 (h) | 4.8 | 2.7 -44% | 5.5 15% | 4.8 0% | 7.7 60% | 6.2 29% | 6.94 ? 45% |
| Load (h) | 2.2 | 1 -55% | 1.3 -41% | 1.3 -41% | 1.47 ? -33% | ||
| Reader / Idle (h) | 6.7 | 10.2 | 8.71 ? |
Pros
Cons
Verdict - More problems than expected
When it comes to its price, the Lenovo Legion 9i is a high-end gamer with an attractive design, good materials, good build quality and a bright Mini LED display with HDR1000. Its flat power supply which can't be found with its competition as well as its additional 140-watt USB-C power supply can be classed as further plus points.
However, while the smaller Legion models impress with their good system optimization, the top model suffers from considerably more weaknesses and problems than expected. First and foremost are its latency problems that didn't just become apparent during the LatencyMon test—we also noticed them when testing its RAM latency and even when playing games, you can see some visible dropped frames. Adding to this is its unusually weak single-core performance. Another larger issue is its suboptimal cooling system. It seems that it cools too late and at times too little, resulting in the SSD being throttled, for example. Moreover, it gets very loud under load, while not preventing high surface temperatures as well as its competitors do. Although its battery life has been improved, it isn't as good as that of the competition. So in total, lots of room for improvement.
The Legion 9i is a stylish high-end gamer but different to the smaller Legion models, the expensive high-end model ends up being the one to suffer from annoying issues such as a suboptimal cooling system and big latency problems.
An alternative could be the Razer Blade 16, for example, which delivers comparable performance within a smaller case and doesn't have quite as many issues as the Legion 9i. Aside from this, its predecessor actually felt like a more mature system and it even boasts higher performance as a result of the successor model's many problems. As a result, the new Legion 9i currently isn't worth purchasing.
Price and availability
Our configuration of the Lenovo Legion 9 16IRX9 or the Lenovo Legion 9i can be purchased directly from Lenovo for US$3,804.66.
Note: We have recently updated our rating system and the results of version 8 are not comparable with the results of version 7. More information is available here .
Lenovo Legion 9 16IRX9, RTX 4090
- 09/27/2024 v8
Christian Hintze
 Total Sustainability Score:
 Transparency
The selection of devices to be reviewed is made by our editorial team. The test sample was provided to the author as a loan by the manufacturer or retailer for the purpose of this review. The lender had no influence on this review, nor did the manufacturer receive a copy of this review before publication. There was no obligation to publish this review. As an independent media company, Notebookcheck is not subjected to the authority of manufacturers, retailers or publishers.
This is how Notebookcheck is testing
Every year, Notebookcheck independently reviews hundreds of laptops and smartphones using standardized procedures to ensure that all results are comparable. We have continuously developed our test methods for around 20 years and set industry standards in the process. In our test labs, high-quality measuring equipment is utilized by experienced technicians and editors. These tests involve a multi-stage validation process. Our complex rating system is based on hundreds of well-founded measurements and benchmarks, which maintains objectivity. Further information on our test methods can be found here.
Price comparison

