Intel Iris Pro Graphics 580 vs NVIDIA Quadro P1000 vs Intel HD Graphics 515
Intel Iris Pro Graphics 580 ► remove from comparison
The Intel Iris Pro Graphics 580 (GT4e) is an integrated graphics unit of the Skylake generation (top version). As successors of the Iris Graphics 6200 (Broadwell), the Iris 580 can be found in some high-end quad core CPUs and offers 128 MB of dedicated eDRAM memory. Furthermore, the so-called GT4e-version features 72 Execution Units (EUs). Besides the eDRAM cache, the Iris 580 is able to access the main memory (2x 64bit DDR3L-1600 / DDR4-2133).
Compared to the Iris Graphics 550 (28 W GT3e), the Iris Pro Graphics 580 offers more EUs (72 vs. 48) and a larger eDRAM Cache (128 vs. 64 MB).
Performance
The exact performance of the Iris Graphics 580 depends on memory configuration and CPU model (different clock speeds). However, it should be clearly faster than the old Broadwell Iris Pro 6200 and may compete with a dedicated GeForce 945M . Modern games of 2015/2016 should be playable in medium settings.
Features
The revised video engine now decodes H.265/HEVC completely in hardware and thereby much more efficiently than before. Displays can be connected via DP 1.2 / eDP 1.3 (max. 3840 x 2160 @ 60 Hz), whereas HDMI is limited to the older version 1.4 (max. 3840 x 2160 @ 30 Hz). However, HDMI 2.0 can be added using a DisplayPort converter. Up to three displays can be controlled simultaneously.
Power Consumption
The Iris Graphics 580 can be found in some mobile high-end quad core processors (45 W). Therefore, they are most likely not used in thin and light laptops.
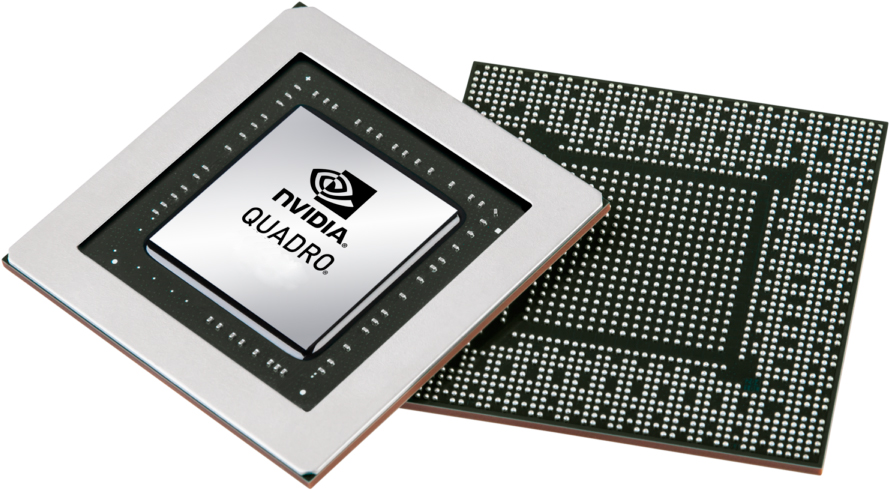
NVIDIA Quadro P1000 ► remove from comparison
The Nvidia Quadro P1000 is a mobile entry-level workstation graphics card for notebooks. Similar to the consumer GeForce GTX 1050 (Laptop) , it is based on the GP107 chip but offers only 512 shaders (1050 offers 640, 1050 Ti 768). The graphics card is designed for the Kaby Lake / Coffee Lake generation.
The Quadro GPUs offer certified drivers , which are optimized for stability and performance in professional applications (CAD, DCC, medical, prospection, and visualizing applications). The performance in these areas is therefore much better compared to corresponding consumer GPUs.
Performance
The theoretical performance should be below the GeForce GTX 1050 due to the lower shader count.
Intel HD Graphics 515 ► remove from comparison
The Intel HD Graphics 515 (GT2) is a low-end integrated graphics unit, which can be found in the Core m-series of the Skylake generation. This "GT2" version of the Skylake GPU offers 24 Execution Units (EUs) clocked at up to 1000 MHz (depending on the CPU model). Due to its lack of dedicated graphics memory or eDRAM cache, the HD 515 has to access the main memory (2x 64bit DDR3L-1600 / LPDDR3-1866).
Performance
According to Intel, the HD Graphics 515 is up to 41 percent faster than the previous HD Graphics 5300 (Broadwell). Nevertheless, the GPU will handle only simple games like Counter-Strike or Dota with decent frame rates. Depending on the specific CPU model, memory configuration and TDP (4.5 W, configurable), performance may vary substantially.
Features
The revised video engine now decodes H.265/HEVC completely in hardware and thereby much more efficiently than before. Displays can be connected via DP 1.2 / eDP 1.3 (max. 3840 x 2160 @ 60 Hz), whereas HDMI is limited to the older version 1.4a (max. 3840 x 2160 @ 30 Hz). However, HDMI 2.0 can be added using a DisplayPort converter. Up to three displays can be controlled simultaneously.
Power Consumption
The HD Graphics 515 can be found in Core m processors with 4.5 W TDP (3.5/3.8 W cTDP down, 7 W cTDP up) and is therefore suited for very thin, mostly passively cooled 2-in-1 notebooks and tablets.
Intel Iris Pro Graphics 580 NVIDIA Quadro P1000 Intel HD Graphics 515 Gen. 9 Series Codename Skylake GT4e Skylake GT2 Architecture Gen. 9 Skylake Pascal Gen. 9 Skylake Pipelines 72 - unified 512 - unified 24 - unified Core Speed 350 - 1050 (Boost) MHz 1493 - 1519 (Boost) MHz 300 - 1000 (Boost) MHz Memory Bus Width eDRAM + 64/128 Bit 128 Bit 64/128 Bit Memory Type eDRAM GDDR5 DDR3L/LPDDR3 Max. Amount of Memory 128 MB 4 GB Shared Memory yes no yes API DirectX 12_1, OpenGL 4.4 DirectX 12_1, Shader 5.0, OpenGL 4.6 DirectX 12_1, OpenGL 4.4 technology 14 nm 14 nm 14 nm Features QuickSync Optimus,
PhysX, 3D Vision Pro, nView, Optimus QuickSync Date of Announcement 24.01.2016 01.02.2017 01.09.2015 Memory Speed 6008 MHz Power Consumption 40 Watt Transistors 3.3 Billion Notebook Size large Link to Manufacturer Page www.nvidia.com
Benchmarks Performance Rating - 3DMark 11 + Fire Strike + Time Spy - Iris Pro Graphics 580
0.9 pt (3%)
...
Intel Iris Pro Graphics 580
...
max:
Performance Rating - 3DMark 11 + Fire Strike + Time Spy - Quadro P1000
2.2 pt (7%)
...
...
max:
Performance Rating - 3DMark 11 + Fire Strike + Time Spy - HD Graphics 515
0.3 pt (1%)
...
...
max:
3DMark - 3DMark Time Spy Score
1560 Points (4%)
3DMark - 3DMark Time Spy Graphics
1395 Points (4%)
3DMark - 3DMark Ice Storm Unlimited Graphics
184880 Points (21%)
min: 43449 avg: 58940 median: 56787 (6%) max: 78808 Points
3DMark - 3DMark Ice Storm Extreme Graphics
98218 Points (13%)
min: 18749 avg: 24669 median: 23314 (3%) max: 33413 Points
3DMark - 3DMark Cloud Gate Score
11346 Points (12%)
min: 16596 avg: 19513 median: 20654 (22%) max: 21290 Points
min: 2705 avg: 3940 median: 3850.5 (4%) max: 5257 Points
3DMark - 3DMark Cloud Gate Graphics
14594 Points (4%)
min: 21391 avg: 27836 median: 30721 (8%) max: 31396 Points
min: 3982 avg: 5440 median: 5467 (1%) max: 7035 Points
3DMark - 3DMark Fire Strike Standard Score
1836 Points (3%)
min: 4453 avg: 4502 median: 4508 (8%) max: 4545 Points
min: 453 avg: 617 median: 623.5 (1%) max: 780 Points
3DMark - 3DMark Fire Strike Standard Graphics
1903 Points (2%)
min: 4756 avg: 4795 median: 4787 (5%) max: 4843 Points
min: 494 avg: 679 median: 691.5 (1%) max: 892 Points
3DMark - 3DMark Ice Storm Graphics
149585 Points (18%)
80331 Points (10%)
min: 31627 avg: 44439 median: 45108 (5%) max: 54558 Points
3DMark 11 - 3DM11 Performance Score
3510 Points (5%)
min: 6363 avg: 6415 median: 6377 (9%) max: 6506 Points
min: 785 avg: 1105 median: 1115 (2%) max: 1360 Points
3DMark 11 - 3DM11 Performance GPU
3220 Points (3%)
min: 5982 avg: 6033 median: 6001 (5%) max: 6115 Points
min: 714 avg: 1013 median: 1014 (1%) max: 1254 Points
3DMark Vantage + NVIDIA Quadro P1000 3DMark Vantage - 3DM Vant. Perf. total
24240 Points (7%)
3DM Vant. Perf. total + Intel HD Graphics 515
4672 Points (1%)
3DM Vant. Perf. GPU no PhysX + NVIDIA Quadro P1000 3DMark Vantage - 3DM Vant. Perf. GPU no PhysX
21687 Points (12%)
3DM Vant. Perf. GPU no PhysX + Intel HD Graphics 515
4218 Points (2%)
3DMark 2001SE - 3DMark 2001 - Standard
20345 Points (21%)
3DMark 03 - 3DMark 03 - Standard
18019 Points (9%)
3DMark 05 - 3DMark 05 - Standard
9173 Points (10%)
3DMark 06 3DMark 06 - Standard 1280x1024 + NVIDIA Quadro P1000
32223 Points (42%)
3DMark 06 - Standard 1280x1024 + Intel HD Graphics 515
min: 4968 avg: 6621 median: 6446 (8%) max: 7912 Points
Unigine Valley 1.0 - Unigine Valley 1.0 DX
min: 25.8 avg: 25.9 median: 26 (9%) max: 26 fps
Unigine Heaven 2.1 - Heaven 2.1 high
63.5 fps (12%)
min: 15.7 avg: 16.9 median: 16.9 (3%) max: 18 fps
SPECviewperf 11 + NVIDIA Quadro P1000 SPECviewperf 11 - specvp11 snx-01
min: 49.1 avg: 49.3 median: 49.3 (29%) max: 49.36 fps
specvp11 tcvis-02 + NVIDIA Quadro P1000 SPECviewperf 11 - specvp11 tcvis-02
min: 39.2 avg: 40.4 median: 40.9 (23%) max: 41.21 fps
specvp11 sw-02 + NVIDIA Quadro P1000 SPECviewperf 11 - specvp11 sw-02
min: 37 avg: 39.2 median: 38.8 (29%) max: 41.79 fps
specvp11 proe-05 + NVIDIA Quadro P1000 SPECviewperf 11 - specvp11 proe-05
min: 15.3 avg: 15.8 median: 15.6 (18%) max: 16.53 fps
specvp11 maya-03 + NVIDIA Quadro P1000 SPECviewperf 11 - specvp11 maya-03
min: 54.5 avg: 56.3 median: 57 (43%) max: 57.5 fps
specvp11 lightwave-01 + NVIDIA Quadro P1000 SPECviewperf 11 - specvp11 lightwave-01
min: 45.02 avg: 45.7 median: 45.6 (49%) max: 46.46 fps
specvp11 ensight-04 + NVIDIA Quadro P1000 SPECviewperf 11 - specvp11 ensight-04
min: 52.4 avg: 52.7 median: 52.5 (25%) max: 53.1 fps
specvp11 catia-03 + NVIDIA Quadro P1000 SPECviewperf 11 - specvp11 catia-03
min: 38.12 avg: 39.3 median: 39.8 (21%) max: 40.1 fps
SPECviewperf 12 + NVIDIA Quadro P1000 SPECviewperf 12 - specvp12 sw-03
min: 75.2 avg: 83.9 median: 86.6 (21%) max: 89.8 fps
specvp12 sw-03 + Intel HD Graphics 515
17.6 fps (4%)
specvp12 snx-02 + NVIDIA Quadro P1000 SPECviewperf 12 - specvp12 snx-02
min: 55.4 avg: 56.2 median: 55.7 (8%) max: 57.4 fps
specvp12 snx-02 + Intel HD Graphics 515 2.1 fps (0%)
specvp12 showcase-01 + NVIDIA Quadro P1000 SPECviewperf 12 - specvp12 showcase-01
min: 27.4 avg: 27.5 median: 27.4 (6%) max: 27.56 fps
specvp12 showcase-01 + Intel HD Graphics 515
5 fps (1%)
specvp12 mediacal-01 + NVIDIA Quadro P1000 SPECviewperf 12 - specvp12 mediacal-01
min: 14.89 avg: 15.1 median: 14.9 (4%) max: 15.41 fps
specvp12 mediacal-01 + Intel HD Graphics 515 1.8 fps (0%)
specvp12 maya-04 + NVIDIA Quadro P1000 SPECviewperf 12 - specvp12 maya-04
min: 36.99 avg: 40.5 median: 42.3 (12%) max: 42.3 fps
specvp12 maya-04 + Intel HD Graphics 515
9 fps (2%)
specvp12 energy-01 + NVIDIA Quadro P1000 SPECviewperf 12 - specvp12 energy-01
min: 3.66 avg: 4 median: 3.9 (3%) max: 4.57 fps
specvp12 energy-01 + Intel HD Graphics 515 0.1 fps (0%)
specvp12 creo-01 + NVIDIA Quadro P1000 SPECviewperf 12 - specvp12 creo-01
min: 51.2 avg: 55.8 median: 57.1 (23%) max: 59 fps
specvp12 creo-01 + Intel HD Graphics 515
7.9 fps (3%)
specvp12 catia-04 + NVIDIA Quadro P1000 SPECviewperf 12 - specvp12 catia-04
min: 53.8 avg: 54.4 median: 54 (9%) max: 55.3 fps
specvp12 catia-04 + Intel HD Graphics 515
9.8 fps (2%)
specvp12 3dsmax-05 + NVIDIA Quadro P1000 SPECviewperf 12 - specvp12 3dsmax-05
min: 50.8 avg: 53 median: 52.9 (9%) max: 55.4 fps
SPECviewperf 13 specvp13 sw-04 + NVIDIA Quadro P1000 SPECviewperf 13 - specvp13 sw-04
min: 76.6 avg: 80.4 median: 80.4 (22%) max: 84.2 fps
specvp13 snx-03 + NVIDIA Quadro P1000 SPECviewperf 13 - specvp13 snx-03
min: 102.6 avg: 103.2 median: 103.2 (11%) max: 103.7 fps
specvp13 showcase-02 + NVIDIA Quadro P1000 SPECviewperf 13 - specvp13 showcase-02
min: 27.23 avg: 27.4 median: 27.4 (6%) max: 27.56 fps
specvp13 medical-02 + NVIDIA Quadro P1000 SPECviewperf 13 - specvp13 medical-02
min: 11.93 avg: 12.8 median: 12.8 (3%) max: 13.58 fps
specvp13 maya-05 + NVIDIA Quadro P1000 SPECviewperf 13 - specvp13 maya-05
min: 71 avg: 71.7 median: 71.7 (8%) max: 72.3 fps
specvp13 energy-02 + NVIDIA Quadro P1000 SPECviewperf 13 - specvp13 energy-02
min: 3.15 avg: 3.2 median: 3.2 (1%) max: 3.28 fps
specvp13 creo-02 + NVIDIA Quadro P1000 SPECviewperf 13 - specvp13 creo-02
min: 66.9 avg: 67.9 median: 67.9 (10%) max: 68.8 fps
specvp13 catia-05 + NVIDIA Quadro P1000 SPECviewperf 13 - specvp13 catia-05
min: 78.1 avg: 78.8 median: 78.8 (9%) max: 79.4 fps
specvp13 3dsmax-06 + NVIDIA Quadro P1000 SPECviewperf 13 - specvp13 3dsmax-06
min: 50.7 avg: 51.9 median: 51.9 (9%) max: 53.1 fps
Cinebench R10 Cinebench R10 Shading (32bit) + Intel Iris Pro Graphics 580 Cinebench R10 - Cinebench R10 Shading (32bit)
11355 Points (8%)
Cinebench R10 Shading (32bit) + NVIDIA Quadro P1000
5759 Points (4%)
Cinebench R10 Shading (32bit) + Intel HD Graphics 515
min: 4740 avg: 6063 median: 6088 (4%) max: 7263 Points
Cinebench R11.5 Cinebench R11.5 OpenGL 64 Bit + Intel Iris Pro Graphics 580 Cinebench R11.5 - Cinebench R11.5 OpenGL 64 Bit
63 fps (22%)
Cinebench R11.5 OpenGL 64 Bit + NVIDIA Quadro P1000
110.5 fps (38%)
Cinebench R11.5 OpenGL 64 Bit + Intel HD Graphics 515
min: 16.86 avg: 23.6 median: 23.1 (8%) max: 31.86 fps
Cinebench R15 + Intel Iris Pro Graphics 580 Cinebench R15 - Cinebench R15 OpenGL 64 Bit
min: 85.1 avg: 85.6 median: 85.6 (5%) max: 86 fps
Cinebench R15 OpenGL 64 Bit + NVIDIA Quadro P1000
min: 122.9 avg: 136.2 median: 136.5 (8%) max: 149.2 fps
Cinebench R15 OpenGL 64 Bit + Intel HD Graphics 515
min: 18.93 avg: 28.6 median: 29.4 (2%) max: 35.98 fps
Cinebench R15 OpenGL Ref. Match 64 Bit + Intel Iris Pro Graphics 580 Cinebench R15 - Cinebench R15 OpenGL Ref. Match 64 Bit
min: 97.8 avg: 97.9 median: 97.8 (98%) max: 98 %
Cinebench R15 OpenGL Ref. Match 64 Bit + NVIDIA Quadro P1000
99.6 % (100%)
Cinebench R15 OpenGL Ref. Match 64 Bit + Intel HD Graphics 515
min: 97.7 avg: 98 median: 97.8 (98%) max: 99.3 %
GFXBench - GFXBench Car Chase Offscreen
89.9 fps (10%)
20.9 fps (2%)
GFXBench 3.1 - GFXBench Manhattan ES 3.1 Offscreen
144.3 fps (3%)
min: 25.5 avg: 27.7 median: 27.7 (1%) max: 29.9 fps
GFXBench 3.0 - GFXBench 3.0 Manhattan Offscreen
187.9 fps (11%)
min: 31.9 avg: 36.5 median: 36.7 (2%) max: 43.6 fps
GFXBench (DX / GLBenchmark) 2.7 + NVIDIA Quadro P1000 GFXBench (DX / GLBenchmark) 2.7 - GFXBench T-Rex HD Offscreen C24Z16
374.7 fps (3%)
GFXBench T-Rex HD Offscreen C24Z16 + Intel HD Graphics 515
min: 70 avg: 75.4 median: 73.2 (1%) max: 87 fps
LuxMark v2.0 64Bit - LuxMark v2.0 Room GPU
362 Samples/s (2%)
min: 712 avg: 734 median: 713 (3%) max: 777 Samples/s
min: 173 avg: 183 median: 183 (1%) max: 193 Samples/s
LuxMark v2.0 64Bit - LuxMark v2.0 Sala GPU
875 Samples/s (2%)
min: 1260 avg: 1294 median: 1260 (2%) max: 1361 Samples/s
min: 395 avg: 413.5 median: 416 (1%) max: 427 Samples/s
ComputeMark v2.1 - ComputeMark v2.1 Result
2308 Points (2%)
3531 Points (4%)
min: 476 avg: 660 median: 704 (1%) max: 741 Points
Power Consumption - Witcher 3 Power Consumption *
min: 64 avg: 68 median: 66 (15%) max: 74 Watt
Power Consumption - Witcher 3 ultra Power Efficiency
min: 0.2122 avg: 0.2 median: 0.3 (23%) max: 0.2561 fps per Watt
Emissions Witcher 3 Fan Noise + NVIDIA Quadro P1000 Emissions - Witcher 3 Fan Noise
min: 33.1 avg: 34.3 median: 34.8 (56%) max: 35 dB(A)
Average Benchmarks Intel Iris Pro Graphics 580 → 100% n=14 Average Benchmarks NVIDIA Quadro P1000 → 164% n=14 Average Benchmarks Intel HD Graphics 515 → 42% n=14
- Range of benchmark values for this graphics card
- Average benchmark values for this graphics card
* Smaller numbers mean a higher performance
1 This benchmark is not used for the average calculation
Game Benchmarks The following benchmarks stem from our benchmarks of review laptops. The performance depends on the used graphics memory, clock rate, processor, system settings, drivers, and operating systems. So the results don't have to be representative for all laptops with this GPU. For detailed information on the benchmark results, click on the fps number.
HD Graphics 515:
21 (!) [X] Cube i9 Intel Core m3-6Y30 0.9GHz
HD Graphics 515
max:
30 fps
fps
HD Graphics 515:
14.4 [X] Cube i9 Intel Core m3-6Y30 0.9GHz
HD Graphics 515
fps
HD Graphics 515:
42 48 [X] Cube i9 Intel Core m3-6Y30 0.9GHz
HD Graphics 515
min:
42 fps
~ 45 fps
HD Graphics 515:
30 36 [X] Cube i9 Intel Core m3-6Y30 0.9GHz
HD Graphics 515
min:
32 fps
~ 33 fps
HD Graphics 515:
14 24 [X] Cube i9 Intel Core m3-6Y30 0.9GHz
HD Graphics 515
min:
20 fps
~ 19 fps
HD Graphics 515:
26.6 [X] Cube i9 Intel Core m3-6Y30 0.9GHz
HD Graphics 515
min:
23 fps, max:
29 fps
fps
HD Graphics 515:
28 30.1 [X] Cube i9 Intel Core m3-6Y30 0.9GHz
HD Graphics 515
min:
15 fps, max:
44 fps
~ 29 fps
HD Graphics 515:
10.7 [X] Cube i9 Intel Core m3-6Y30 0.9GHz
HD Graphics 515
max:
16 fps
11 ~ 11 fps
HD Graphics 515:
9.4 [X] Medion Akoya P3401T 2in1 Intel Core m5-6Y54 1.1GHz
HD Graphics 515
fps
HD Graphics 515:
4.3 [X] Medion Akoya P3401T 2in1 Intel Core m5-6Y54 1.1GHz
HD Graphics 515
fps
HD Graphics 515:
17.2 [X] Medion Akoya P3401T 2in1 Intel Core m5-6Y54 1.1GHz
HD Graphics 515
fps
HD Graphics 515:
6.6 [X] Medion Akoya P3401T 2in1 Intel Core m5-6Y54 1.1GHz
HD Graphics 515
fps
HD Graphics 515:
22.3 [X] Medion Akoya P3401T 2in1 Intel Core m5-6Y54 1.1GHz
HD Graphics 515
fps
HD Graphics 515:
10.3 [X] Medion Akoya P3401T 2in1 Intel Core m5-6Y54 1.1GHz
HD Graphics 515
fps
HD Graphics 515:
48 [X] Cube i9 Intel Core m3-6Y30 0.9GHz
HD Graphics 515
min:
42 fps, max:
60 fps
fps
HD Graphics 515:
24.1 [X] Cube i9 Intel Core m3-6Y30 0.9GHz
HD Graphics 515
min:
19 fps, max:
30 fps
fps
HD Graphics 515:
10.1 [X] Cube i9 Intel Core m3-6Y30 0.9GHz
HD Graphics 515
min:
8 fps, max:
14 fps
fps
HD Graphics 515:
21.5 [X] Medion Akoya P3401T 2in1 Intel Core m5-6Y54 1.1GHz
HD Graphics 515
fps
HD Graphics 515:
10.3 [X] Medion Akoya P3401T 2in1 Intel Core m5-6Y54 1.1GHz
HD Graphics 515
fps
HD Graphics 515:
10.7 [X] Medion Akoya P3401T 2in1 Intel Core m5-6Y54 1.1GHz
HD Graphics 515
fps
HD Graphics 515:
7.8 [X] Medion Akoya P3401T 2in1 Intel Core m5-6Y54 1.1GHz
HD Graphics 515
fps
HD Graphics 515:
11.4 [X] Cube i9 Intel Core m3-6Y30 0.9GHz
HD Graphics 515
min:
5 fps, max:
15 fps
fps
100%
Iris Pro Graphics 580:
60.5 fps
30%
HD Graphics 515:
13.8 21.7 [X] Cube i9 Intel Core m3-6Y30 0.9GHz
HD Graphics 515
min:
14 fps, max:
30 fps
~ 18 fps
100%
Iris Pro Graphics 580:
53.3 fps
16%
HD Graphics 515:
8.4 fps
100%
Iris Pro Graphics 580:
42.9 fps
100%
Iris Pro Graphics 580:
23.1 fps
Iris Pro Graphics 580:
0 (!) fps
HD Graphics 515:
6.1 8.4 ~ 7 fps
100%
Iris Pro Graphics 580:
30.2 fps
100%
Iris Pro Graphics 580:
18.2 fps
100%
Iris Pro Graphics 580:
12.2 fps
100%
Iris Pro Graphics 580:
8.9 fps
Iris Pro Graphics 580:
0 (!) fps
HD Graphics 515:
32 [X] Cube i9 Intel Core m3-6Y30 0.9GHz
HD Graphics 515
min:
13 fps, max:
48 fps
32.1 42.8 ~ 36 fps
HD Graphics 515:
23.6 [X] Cube i9 Intel Core m3-6Y30 0.9GHz
HD Graphics 515
min:
10 fps, max:
42 fps
26.3 30.2 ~ 27 fps
100%
Iris Pro Graphics 580:
59.9 fps
43%
HD Graphics 515:
25.7 fps
100%
Iris Pro Graphics 580:
58.6 fps
26%
HD Graphics 515:
15.3 fps
100%
Iris Pro Graphics 580:
23 fps
100%
Iris Pro Graphics 580:
14.9 fps
100%
Iris Pro Graphics 580:
59.8 fps
80%
HD Graphics 515:
48 [X] Cube i9 Intel Core m3-6Y30 0.9GHz
HD Graphics 515
min:
42.2 fps
fps
100%
Iris Pro Graphics 580:
37.2 fps
75%
HD Graphics 515:
25.4 [X] Cube i9 Intel Core m3-6Y30 0.9GHz
HD Graphics 515
min:
21.5 fps
30 [X] Cube i9 Intel Core m3-6Y30 0.9GHz
HD Graphics 515
~ 28 fps
100%
Iris Pro Graphics 580:
15.3 fps
61%
HD Graphics 515:
9.4 [X] Cube i9 Intel Core m3-6Y30 0.9GHz
HD Graphics 515
min:
8.7 fps
fps
100%
Iris Pro Graphics 580:
14 fps
58%
HD Graphics 515:
8.1 [X] Cube i9 Intel Core m3-6Y30 0.9GHz
HD Graphics 515
min:
7.1 fps
fps
Iris Pro Graphics 580:
0 (!) fps
HD Graphics 515:
57 [X] Dell Latitude 12 E7275 Intel Core m7-6Y75 1.2GHz
HD Graphics 515
57.8 65.7 67.2 ~ 62 fps
HD Graphics 515:
13.9 [X] Dell Latitude 12 E7275 Intel Core m7-6Y75 1.2GHz
HD Graphics 515
14.4 15.8 16 ~ 15 fps
HD Graphics 515:
6.8 8.3 ~ 8 fps
HD Graphics 515:
41 41 ~ 41 fps
HD Graphics 515:
27 28 ~ 28 fps
HD Graphics 515:
15 17 ~ 16 fps
HD Graphics 515:
161.1 fps
100%
Iris Pro Graphics 580:
43.8 fps
100%
Iris Pro Graphics 580:
30.1 fps
27%
HD Graphics 515:
6.7 10.1 ~ 8 fps
100%
Iris Pro Graphics 580:
25 fps
30%
HD Graphics 515:
7.5 fps
100%
Iris Pro Graphics 580:
12.4 fps
100%
Iris Pro Graphics 580:
63.7 fps
100%
Iris Pro Graphics 580:
50.8 fps
100%
Iris Pro Graphics 580:
28.5 fps
100%
Iris Pro Graphics 580:
14.3 fps
63%
HD Graphics 515:
9 fps
100%
Iris Pro Graphics 580:
101.3 fps
100%
Iris Pro Graphics 580:
57.9 fps
100%
Iris Pro Graphics 580:
51 fps
100%
Iris Pro Graphics 580:
14.9 fps
34%
HD Graphics 515:
3.8 4 4.3 4.4 4.6 [X] Dell Latitude 12 E7275 Intel Core m7-6Y75 1.2GHz
HD Graphics 515
4.7 4.7 4.9 5.1 5.3 5.9 6 6.5 [X] Panasonic Toughbook CF-20 Intel Core m5-6Y57 1.1GHz
HD Graphics 515
6.7 [X] Medion Akoya P3401T 2in1 Intel Core m5-6Y54 1.1GHz
HD Graphics 515
~ 5 fps
100%
Iris Pro Graphics 580:
380.6 fps
21%
HD Graphics 515:
80.8 fps
100%
Iris Pro Graphics 580:
127.1 fps
20%
HD Graphics 515:
24.9 fps
100%
Iris Pro Graphics 580:
73.6 fps
20%
HD Graphics 515:
14.6 fps
100%
Iris Pro Graphics 580:
36.2 fps
100%
Iris Pro Graphics 580:
115.8 fps
100%
Iris Pro Graphics 580:
38.7 fps
100%
Iris Pro Graphics 580:
16.7 fps
100%
Iris Pro Graphics 580:
107.2 fps
100%
Iris Pro Graphics 580:
81.2 fps
100%
Iris Pro Graphics 580:
37.3 fps
100%
Iris Pro Graphics 580:
8.8 fps
Average Gaming Intel Iris Pro Graphics 580 → 100% Average Gaming 30-70 fps → 100%
Average Gaming NVIDIA Quadro P1000 → 287% Average Gaming 30-70 fps → 303%
Average Gaming Intel HD Graphics 515 → 38% Average Gaming 30-70 fps → 58%
NVIDIA Quadro P1000 low med. high ultra QHD 4K FIFA 19 204.6 107.8 99.9 89.5 F1 2018 96 53 41 25 Far Cry 5 64 32 29 27 Final Fantasy XV Benchmark 51.9 25.3 18.2 Star Wars Battlefront 2 114.4 44.6 37.9 26.6 Call of Duty WWII 127.1 81 41.1 33.4 Rocket League 235.5 123.8 81.8 Ghost Recon Wildlands 71.7 31.9 29.1 15.8 For Honor 117.6 44.3 42 33 Battlefield 1 135.8 80.5 38.7 35.3 Civilization VI 114.7 71.3 33.5 27 Doom 91.7 78.4 43.3 41.6 Rise of the Tomb Raider 97 57 31 26 10.6 Rainbow Six Siege 172.7 115.1 62.8 56.1 The Witcher 3 89 54 29 16 BioShock Infinite 252 152 133 51 < 30 fps < 60 fps < 120 fps ≥ 120 fps 1 9 6 1 7 6 2 4 8 3 1 7 6 1 1
Intel Iris Pro Graphics 580 low med. high ultra QHD 4K Overwatch 60.5 53.3 42.9 23.1 Doom Rise of the Tomb Raider 30.2 18.2 12.2 8.9 Fallout 4 Metal Gear Solid V 59.9 58.6 23 14.9 Dota 2 Reborn 59.8 37.2 15.3 14 Batman: Arkham Knight Thief 43.8 30.1 25 12.4 Metro: Last Light 63.7 50.8 28.5 14.3 BioShock Infinite 101.3 57.9 51 14.9 StarCraft II: Heart of the Swarm 380.6 127.1 73.6 36.2 Guild Wars 2 115.8 38.7 16.7 Sleeping Dogs 107.2 81.2 37.3 8.8 < 30 fps < 60 fps < 120 fps ≥ 120 fps 4 5 1 1 6 1 1 5 4 1 9 1
For more games that might be playable and a list of all games and graphics cards visit our Gaming List
v1.28
log 02. 05:41:42
#0 checking url part for id 7236 +0s ... 0s
#1 checking url part for id 8846 +0s ... 0s
#2 checking url part for id 6450 +0s ... 0s
#3 redirected to Ajax server, took 1719891701 +0s ... 0s
#4 did not recreate cache, as it is less than 5 days old! Created at Mon, 01 Jul 2024 05:16:07 +0200 +0s ... 0s
#5 composed specs +0.029s ... 0.029s
#6 did output specs +0s ... 0.029s
#7 start showIntegratedCPUs +0s ... 0.029s
#8 getting avg benchmarks for device 7236 +0.034s ... 0.063s
#9 got single benchmarks 7236 +0.004s ... 0.068s
#10 getting avg benchmarks for device 8846 +0.005s ... 0.072s
#11 got single benchmarks 8846 +0.007s ... 0.079s
#12 getting avg benchmarks for device 6450 +0.004s ... 0.083s
#13 got single benchmarks 6450 +0.032s ... 0.115s
#14 got avg benchmarks for devices +0s ... 0.115s
#15 min, max, avg, median took s +0.055s ... 0.169s
#16 before gaming benchmark output +0s ... 0.169s
#17 Got 428 rows for game benchmarks. +0.03s ... 0.2s
#18 composed SQL query for gamebenchmarks +0s ... 0.2s
#19 got data and put it in $dataArray +0.003s ... 0.202s
#20 benchmarks composed for output. +0.019s ... 0.222s
#21 calculated avg scores. +0s ... 0.222s
#22 return log +0.001s ... 0.223s
Please share our article, every link counts!
Redaktion, 2017-09- 8 (Update: 2023-07- 1)
 Deutsch
 English
 Español
 Français
 Italiano
 Nederlands
 Polski
 Português
 Русский
 Türkçe
 Svenska
 Chinese
 Magyar