Intel HD Graphics P530 vs NVIDIA GeForce RTX 3090 Ti vs Intel HD Graphics (Ivy Bridge)
Intel HD Graphics P530 ► remove from comparison
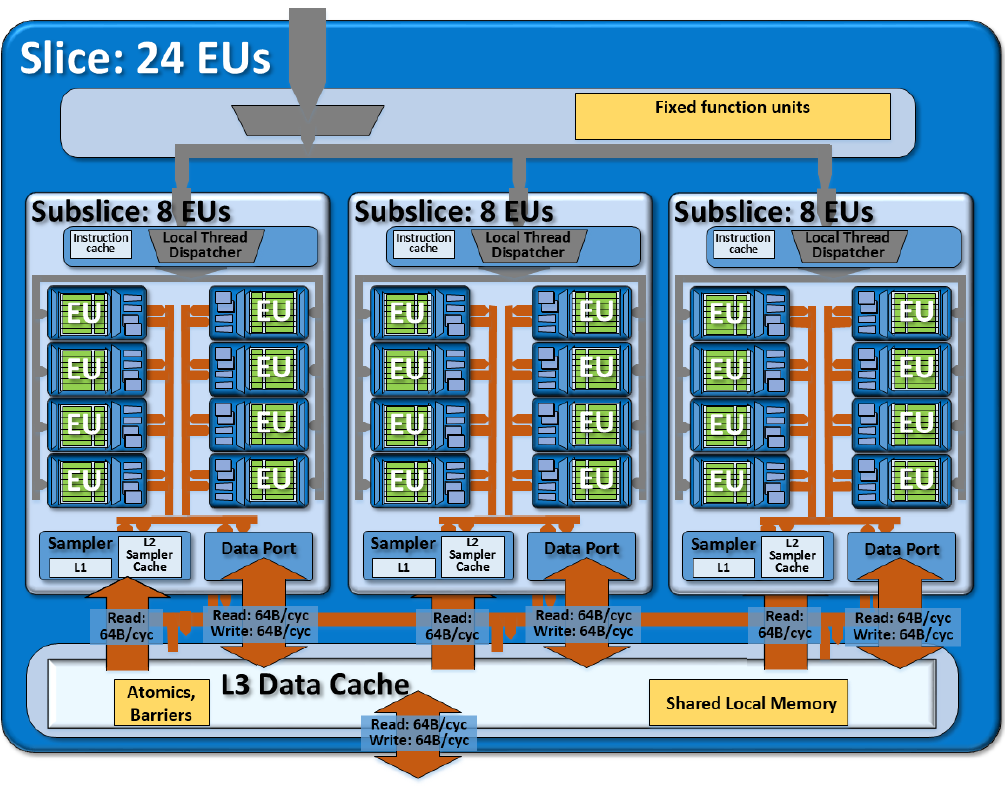
The Intel HD Graphics P530 (GT2) is an integrated graphics unit, which can be found in various Xeon workstation processors of the Skylake generation. The "GT2" version of the Skylake GPU offers 24 Execution Units (EUs) clocked at up to 1050 MHz (depending on the CPU model). Due to its lack of dedicated graphics memory or eDRAM cache, the P530 has to access the main memory (2x 64bit DDR3L-1600 / DDR4-2133).
Performance
Depending on the memory configuration, the HD Graphics P530 is just slightly behind a dedicated GeForce 920M and will handle modern games (as of 2015) in low or medium settings.
Features
The revised video engine now decodes H.265/HEVC completely in hardware and thereby much more efficiently than before. Displays can be connected via DP 1.2 / eDP 1.3 (max. 3840 x 2160 @ 60 Hz), whereas HDMI is limited to the older version 1.4a (max. 3840 x 2160 @ 30 Hz). However, HDMI 2.0 can be added using a DisplayPort converter. Up to three displays can be controlled simultaneously.
Power Consumption
The HD Graphics P530 can be found in mobile quad-core Xeon processors with 45 W TDP.
NVIDIA GeForce RTX 3090 Ti ► remove from comparison
The Nvidia GeForce RTX 3090 Ti is a high-end desktop graphics card based on the Ampere generation. It was announced early 2022 the fastest desktop gaming graphics card.
It uses the big GA102 chip and offers 10,752 shaders and 24 GB GDDR6X graphics memory. The RTX3090ti is rated at 450 Watt.
Intel HD Graphics (Ivy Bridge) ► remove from comparison
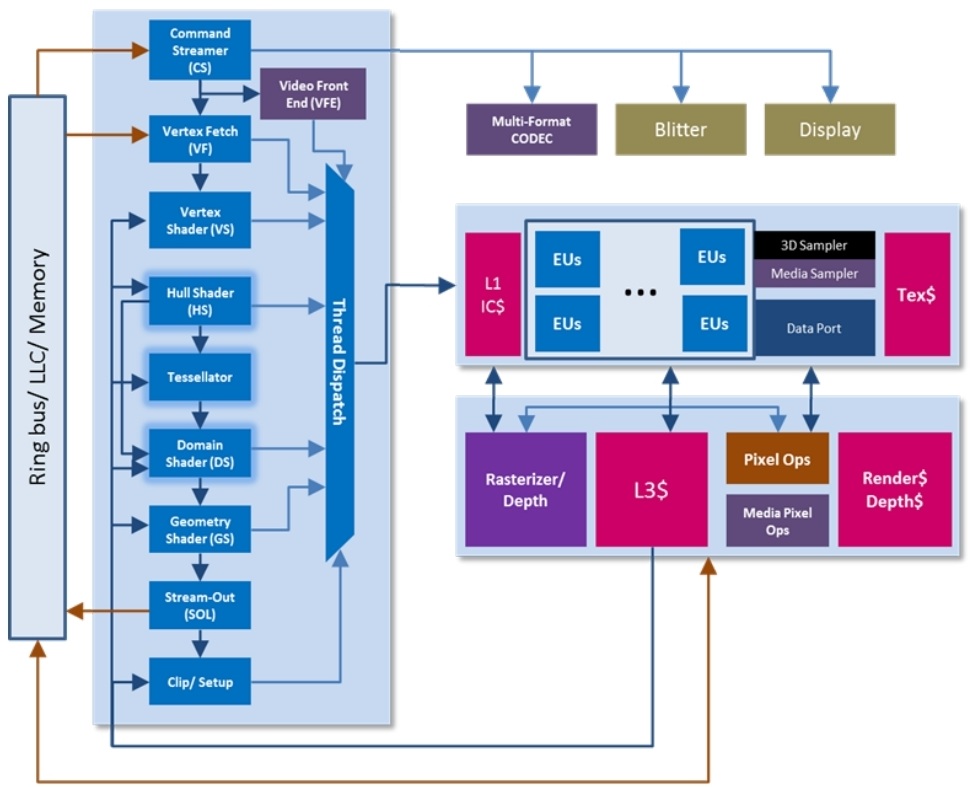
The Intel HD Graphics (Ivy Bridge) is an integrated graphics card in the mobile Ivy Bridge codenamed processors (Celeron and Pentium). It is the successor the the Intel HD Graphics 2000 in the Sandy Bridge CPUs and performs between the old HD 2000 and 3000 GPU .
Compared to the faster HD Graphics 4000 , the HD Graphics features less Execution Units (6 versus 16) and only one texture sampler. Therefore, the performance is clearly worse and only suited for low demanding gaming. Intel states a 10 to 15% higher performance compared to the old Sandy Bridge based HD Graphics 2000 (see our benchmarks below), which is similar to AMDs low-end GPUs like the integrated Radeon HD 8210 . Therefore, only casual games with low requirements are playable.
A speciality of the Ivy Bridge GPUs is that 4x MSAA is supported in hardware now. However, 2x is only supported through software. The algorithm to support 2x is going through the 4x pipeline with a software algorithm, so performance is similar to 4x MSAA.
The integrated video decoder called Multi Format Codec Engine (MFX) was also improved and should allow even simultaneus 4K video decoding. DXVAChecker lists MPEG2, VC1, WMV9, and H264 as supported codecs. QuickSync for fast transcoding of videos was also optimized for higher performance and better image quality.
Another new feature is the support for up to 3 independent displays (maybe only with a DisplayPort) as AMD offers with theirs Eyefinity support (up to 6 displays).
Due to the 22nm 3D Tri-Gate production process, the power consumption should be relatively low (the development was focused on performance per Watt).
Intel HD Graphics P530 NVIDIA GeForce RTX 3090 Ti Intel HD Graphics (Ivy Bridge) HD Graphics Series Codename Skylake GT2 Ampere GA102 Ivy Bridge GT1 Architecture Gen. 9 Skylake Ampere Gen. 7 Ivy Bridge Pipelines 24 - unified 10752 - unified 6 - unified Core Speed 350 - 1050 (Boost) MHz 1560 - 1860 (Boost) MHz 350 - 1100 (Boost) MHz Memory Bus Width 64/128 Bit 384 Bit 64/128 Bit Memory Type DDR3/DDR4 GDDR6X Shared Memory yes no yes API DirectX 12_1, OpenGL 4.4 DirectX 12_2, Shader 6.7, OpenGL 4.6 DirectX 11.0, Shader 5.0 technology 14 nm 8 nm 22 nm Features QuickSync Date of Announcement 01.09.2015 27.01.2022 01.10.2012 TMUs 336 ROPs 112 Raytracing Cores 84 Tensor / AI Cores 336 Theoretical Performance 40 TFLOPS FP16, 40 TFLOPS FP32, 625 TFLOPS FP64 Cache L1: 10.5 MB, L2: 6 MB Memory Speed 21000 effective = 1313 MHz Max. Amount of Memory 24 GB Memory Bandwidth 1008 GB/s Power Consumption 450 Watt Transistors 28.3 Billion Die Size 628 mm² PCIe 4.0 x16 Displays 4 Displays (max.), HDMI 2.1, DisplayPort 1.4a Predecessor GeForce RTX 2080 Ti (Desktop)
CPU in HD Graphics P530 GPU Base Speed GPU Boost / Turbo Intel Xeon E3-1535M v5 4 x 2900 MHz, 45 W 350 MHz 1050 MHz Intel Xeon E3-1505M v5 4 x 2800 MHz, 45 W 350 MHz 1050 MHz min. - max. 350 MHz 1050 MHz
CPU in HD Graphics (Ivy Bridge) GPU Base Speed GPU Boost / Turbo Intel Pentium 2030M 2 x 2500 MHz, 35 W 650 MHz 1100 MHz Intel Pentium 2020M 2 x 2400 MHz, 35 W 650 MHz 1100 MHz Intel Celeron 1020E 2 x 2200 MHz, 35 W 650 MHz 1000 MHz » show 12 more Intel Celeron 1020M 2 x 2100 MHz, 35 W 650 MHz 1000 MHz Intel Pentium 2127U 2 x 1900 MHz, 17 W 350 MHz 1100 MHz Intel Celeron 1005M 2 x 1900 MHz, 35 W 650 MHz 1000 MHz Intel Pentium 2117U 2 x 1800 MHz, 17 W 350 MHz 1000 MHz Intel Celeron 1000M 2 x 1800 MHz, 35 W 650 MHz 1000 MHz Intel Celeron 1037U 2 x 1800 MHz, 17 W 350 MHz 1000 MHz Intel Celeron 1017U 2 x 1600 MHz, 17 W 350 MHz 1000 MHz Intel Celeron 1007U 2 x 1500 MHz, 17 W 350 MHz 1000 MHz Intel Celeron 1047UE 2 x 1400 MHz, 17 W 350 MHz 900 MHz Intel Pentium 2129Y 2 x 1100 MHz, 10 W 350 MHz 850 MHz Intel Celeron 1019Y 2 x 1000 MHz, 10 W 350 MHz 800 MHz Intel Celeron 927UE 1 x 1500 MHz, 17 W 350 MHz 900 MHz min. - max. 350 - 650 MHz 800 - 1100 MHz
Benchmarks Performance Rating - 3DMark 11 + Fire Strike + Time Spy - NVIDIA GeForce RTX 3090 Ti
24.2 pt (73%)
...
NVIDIA GeForce RTX 3090 Ti
...
max:
Performance Rating - 3DMark 11 + Fire Strike + Time Spy - HD Graphics (Ivy Bridge)
0.1 pt (0%)
...
Intel HD Graphics (Ivy Bridge)
...
max:
3DMark - 3DMark Time Spy Score
19241 Points (55%)
GPU TDP ? TDP 450 W 100% 100%
3DMark - 3DMark Time Spy Graphics
21645 Points (57%)
GPU TDP ? TDP 450 W 100% 100%
3DMark - 3DMark Ice Storm Unlimited Graphics
564087 Points (64%)
GPU TDP ? TDP 450 W 100% 100%
3DMark - 3DMark Ice Storm Extreme Graphics
444102 Points (57%)
GPU TDP ? TDP 450 W 100% 100%
3DMark - 3DMark Cloud Gate Score
75753 Points (81%)
GPU TDP ? TDP 450 W 100% 100%
min: 1478 avg: 1898 median: 1906.5 (2%) max: 2207 Points
GPU TDP ? TDP 450 W 10% 100%
3DMark - 3DMark Cloud Gate Graphics
246319 Points (65%)
GPU TDP ? TDP 450 W 100% 100%
min: 2116 avg: 2283 median: 2286 (1%) max: 2470 Points
GPU TDP ? TDP 450 W 9% 100%
3DMark - 3DMark Fire Strike Standard Score
36563 Points (65%)
GPU TDP ? TDP 450 W 100% 100%
min: 208 avg: 253.6 median: 254.5 (0%) max: 275 Points
GPU TDP ? TDP 450 W 10% 100%
3DMark - 3DMark Fire Strike Standard Graphics
53110 Points (60%)
GPU TDP ? TDP 450 W 100% 100%
min: 248 avg: 286.2 median: 285.5 (0%) max: 305 Points
GPU TDP ? TDP 450 W 10% 100%
3DMark - 3DMark Ice Storm Graphics
465704 Points (56%)
GPU TDP ? TDP 450 W 100% 100%
min: 22834 avg: 24734 median: 24209.5 (3%) max: 29149 Points
GPU TDP ? TDP 450 W 13% 100%
3DMark - 3DMark Wild Life Unlimited
118439 Points (60%)
GPU TDP ? TDP 450 W 100% 100%
3DMark - 3DMark Wild Life Extreme Unlimited
46562 Points (54%)
GPU TDP ? TDP 450 W 100% 100%
3DMark - 3DMark Night Raid
64315 Points (61%)
GPU TDP ? TDP 450 W 100% 100%
3DMark - 3DMark Night Raid Graphics Score
139165 Points (54%)
GPU TDP ? TDP 450 W 100% 100%
3DMark 11 - 3DM11 Performance Score
49471 Points (69%)
GPU TDP ? TDP 450 W 100% 100%
min: 258 avg: 363.3 median: 370.5 (1%) max: 413 Points
GPU TDP ? TDP 450 W 8% 100%
3DMark 11 - 3DM11 Performance GPU
69481 Points (60%)
GPU TDP ? TDP 450 W 100% 100%
min: 218 avg: 310.6 median: 315 (0%) max: 352 Points
GPU TDP ? TDP 450 W 8% 100%
3DMark Vantage + Intel HD Graphics (Ivy Bridge) 3DMark Vantage - 3DM Vant. Perf. total
min: 930 avg: 1465 median: 1491 (0%) max: 1691 Points
3DM Vant. Perf. GPU no PhysX + Intel HD Graphics (Ivy Bridge) 3DMark Vantage - 3DM Vant. Perf. GPU no PhysX
min: 728 avg: 1186 median: 1213 (1%) max: 1360 Points
3DMark 2001SE - 3DMark 2001 - Standard
min: 8075 avg: 9212 median: 9212 (10%) max: 10349 Points
3DMark 03 - 3DMark 03 - Standard
min: 5909 avg: 7584 median: 7434 (4%) max: 10124 Points
3DMark 05 - 3DMark 05 - Standard
min: 3839 avg: 5085 median: 5186 (6%) max: 6252 Points
3DMark 06 3DMark 06 - Standard 1280x1024 + Intel HD Graphics (Ivy Bridge)
min: 2186 avg: 2949 median: 2930 (4%) max: 3573 Points
Unigine Valley 1.0 - Unigine Valley 1.0 DX
201.7 fps (66%)
GPU TDP ? TDP 450 W 100% 100%
SPECviewperf 11 + Intel HD Graphics (Ivy Bridge) SPECviewperf 11 - specvp11 snx-01
min: 0.75 avg: 0.8 median: 0.8 (0%) max: 0.87 fps
specvp11 tcvis-02 + Intel HD Graphics (Ivy Bridge) SPECviewperf 11 - specvp11 tcvis-02
min: 1.31 avg: 1.5 median: 1.5 (1%) max: 1.66 fps
specvp11 sw-02 + Intel HD Graphics (Ivy Bridge) SPECviewperf 11 - specvp11 sw-02
min: 4.68 avg: 5.3 median: 5.3 (4%) max: 5.88 fps
specvp11 proe-05 + Intel HD Graphics (Ivy Bridge) SPECviewperf 11 - specvp11 proe-05
min: 0.91 avg: 1.1 median: 1.1 (1%) max: 1.19 fps
specvp11 maya-03 + Intel HD Graphics (Ivy Bridge) SPECviewperf 11 - specvp11 maya-03
min: 8.71 avg: 8.8 median: 8.8 (7%) max: 8.93 fps
specvp11 lightwave-01 + Intel HD Graphics (Ivy Bridge) SPECviewperf 11 - specvp11 lightwave-01
min: 7.83 avg: 8.9 median: 8.9 (10%) max: 10.03 fps
specvp11 ensight-04 + Intel HD Graphics (Ivy Bridge) SPECviewperf 11 - specvp11 ensight-04
min: 1.27 avg: 1.4 median: 1.4 (1%) max: 1.51 fps
specvp11 catia-03 + Intel HD Graphics (Ivy Bridge) SPECviewperf 11 - specvp11 catia-03
0 fps (0%)
SPECviewperf 12 + NVIDIA GeForce RTX 3090 Ti SPECviewperf 12 - specvp12 sw-03
85.7 fps (21%)
GPU TDP ? TDP 450 W 100% 100%
specvp12 snx-02 + NVIDIA GeForce RTX 3090 Ti SPECviewperf 12 - specvp12 snx-02
15.6 fps (2%)
GPU TDP ? TDP 450 W 100% 100%
specvp12 showcase-01 + NVIDIA GeForce RTX 3090 Ti SPECviewperf 12 - specvp12 showcase-01
265 fps (58%)
GPU TDP ? TDP 450 W 100% 100%
specvp12 mediacal-01 + NVIDIA GeForce RTX 3090 Ti SPECviewperf 12 - specvp12 mediacal-01
87.1 fps (22%)
GPU TDP ? TDP 450 W 100% 100%
specvp12 maya-04 + NVIDIA GeForce RTX 3090 Ti SPECviewperf 12 - specvp12 maya-04
197 fps (54%)
GPU TDP ? TDP 450 W 100% 100%
specvp12 energy-01 + NVIDIA GeForce RTX 3090 Ti SPECviewperf 12 - specvp12 energy-01
27.6 fps (25%)
GPU TDP ? TDP 450 W 100% 100%
specvp12 creo-01 + NVIDIA GeForce RTX 3090 Ti SPECviewperf 12 - specvp12 creo-01
76.4 fps (31%)
GPU TDP ? TDP 450 W 100% 100%
specvp12 catia-04 + NVIDIA GeForce RTX 3090 Ti SPECviewperf 12 - specvp12 catia-04
150 fps (25%)
GPU TDP ? TDP 450 W 100% 100%
specvp12 3dsmax-05 + NVIDIA GeForce RTX 3090 Ti SPECviewperf 12 - specvp12 3dsmax-05
371 fps (65%)
GPU TDP ? TDP 450 W 100% 100%
SPECviewperf 13 specvp13 sw-04 + NVIDIA GeForce RTX 3090 Ti SPECviewperf 13 - specvp13 sw-04
118 fps (32%)
GPU TDP ? TDP 450 W 100% 100%
specvp13 snx-03 + NVIDIA GeForce RTX 3090 Ti SPECviewperf 13 - specvp13 snx-03
28 fps (3%)
GPU TDP ? TDP 450 W 100% 100%
specvp13 showcase-02 + NVIDIA GeForce RTX 3090 Ti SPECviewperf 13 - specvp13 showcase-02
265 fps (58%)
GPU TDP ? TDP 450 W 100% 100%
specvp13 medical-02 + NVIDIA GeForce RTX 3090 Ti SPECviewperf 13 - specvp13 medical-02
113 fps (24%)
GPU TDP ? TDP 450 W 100% 100%
specvp13 maya-05 + NVIDIA GeForce RTX 3090 Ti SPECviewperf 13 - specvp13 maya-05
493 fps (56%)
GPU TDP ? TDP 450 W 100% 100%
specvp13 energy-02 + NVIDIA GeForce RTX 3090 Ti SPECviewperf 13 - specvp13 energy-02
48.4 fps (16%)
GPU TDP ? TDP 450 W 100% 100%
specvp13 creo-02 + NVIDIA GeForce RTX 3090 Ti SPECviewperf 13 - specvp13 creo-02
353 fps (52%)
GPU TDP ? TDP 450 W 100% 100%
specvp13 catia-05 + NVIDIA GeForce RTX 3090 Ti SPECviewperf 13 - specvp13 catia-05
230 fps (26%)
GPU TDP ? TDP 450 W 100% 100%
specvp13 3dsmax-06 + NVIDIA GeForce RTX 3090 Ti SPECviewperf 13 - specvp13 3dsmax-06
373 fps (65%)
GPU TDP ? TDP 450 W 100% 100%
SPECviewperf 2020 specvp2020 solidworks-05 4k + NVIDIA GeForce RTX 3090 Ti SPECviewperf 2020 - specvp2020 solidworks-05 4k
197 fps (58%)
GPU TDP ? TDP 450 W 100% 100%
specvp2020 snx-04 4k + NVIDIA GeForce RTX 3090 Ti SPECviewperf 2020 - specvp2020 snx-04 4k
23.7 fps (2%)
GPU TDP ? TDP 450 W 100% 100%
specvp2020 medical-03 4k + NVIDIA GeForce RTX 3090 Ti SPECviewperf 2020 - specvp2020 medical-03 4k
22.2 fps (21%)
GPU TDP ? TDP 450 W 100% 100%
specvp2020 maya-06 4k + NVIDIA GeForce RTX 3090 Ti SPECviewperf 2020 - specvp2020 maya-06 4k
353 fps (57%)
GPU TDP ? TDP 450 W 100% 100%
specvp2020 energy-03 4k + NVIDIA GeForce RTX 3090 Ti SPECviewperf 2020 - specvp2020 energy-03 4k
31.6 fps (7%)
GPU TDP ? TDP 450 W 100% 100%
specvp2020 creo-03 4k + NVIDIA GeForce RTX 3090 Ti SPECviewperf 2020 - specvp2020 creo-03 4k
84.5 fps (40%)
GPU TDP ? TDP 450 W 100% 100%
specvp2020 catia-06 4k + NVIDIA GeForce RTX 3090 Ti SPECviewperf 2020 - specvp2020 catia-06 4k
58.6 fps (38%)
GPU TDP ? TDP 450 W 100% 100%
specvp2020 3dsmax-07 4k + NVIDIA GeForce RTX 3090 Ti SPECviewperf 2020 - specvp2020 3dsmax-07 4k
145 fps (60%)
GPU TDP ? TDP 450 W 100% 100%
Windows 7 Experience Index - Win7 Gaming graphics
6.2 Points (78%)
Windows 7 Experience Index - Win7 Graphics
min: 4.6 avg: 4.7 median: 4.7 (59%) max: 4.7 Points
Cinebench R10 Cinebench R10 Shading (32bit) + Intel HD Graphics (Ivy Bridge) Cinebench R10 - Cinebench R10 Shading (32bit)
min: 2410 avg: 3337 median: 3382 (2%) max: 4037 Points
Cinebench R11.5 Cinebench R11.5 OpenGL 64 Bit + NVIDIA GeForce RTX 3090 Ti Cinebench R11.5 - Cinebench R11.5 OpenGL 64 Bit
108.2 fps (37%)
Cinebench R11.5 OpenGL 64 Bit + Intel HD Graphics (Ivy Bridge)
min: 6.62 avg: 9.1 median: 9.2 (3%) max: 11.32 fps
Cinebench R15 + NVIDIA GeForce RTX 3090 Ti Cinebench R15 - Cinebench R15 OpenGL 64 Bit
204 fps (12%)
Cinebench R15 OpenGL Ref. Match 64 Bit + NVIDIA GeForce RTX 3090 Ti Cinebench R15 - Cinebench R15 OpenGL Ref. Match 64 Bit
99.6 % (100%)
GFXBench (DX / GLBenchmark) 2.7 + Intel HD Graphics (Ivy Bridge) GFXBench (DX / GLBenchmark) 2.7 - GFXBench T-Rex HD Offscreen C24Z16
27 fps (0%)
LuxMark v2.0 64Bit - LuxMark v2.0 Room GPU
6221 Samples/s (28%)
min: 27 avg: 38.3 median: 44 (0%) max: 44 Samples/s
GPU TDP ? TDP 450 W 1% 100%
LuxMark v2.0 64Bit - LuxMark v2.0 Sala GPU
16046 Samples/s (28%)
44 Samples/s (0%)
GPU TDP ? TDP 450 W 0% 100%
ComputeMark v2.1 - ComputeMark v2.1 Result
52258 Points (56%)
min: 190 avg: 266.4 median: 275 (0%) max: 290 Points
GPU TDP ? TDP 450 W 1% 100%
Power Consumption - Furmark Stress Test Power Consumption - external Monitor *
min: 598 avg: 615 median: 599 (85%) max: 648 Watt
Power Consumption - The Witcher 3 Power Consumption - external Monitor *
min: 561 avg: 564 median: 561 (78%) max: 569 Watt
GPU TDP ? TDP 450 W 103% 100%
Power Consumption - Witcher 3 ultra Power Efficiency - external Monitor
min: 0.3447 avg: 0.3 median: 0.3 (29%) max: 0.345 fps per Watt
GPU TDP ? TDP 450 W 100% 100%
Average Benchmarks NVIDIA GeForce RTX 3090 Ti → 0% n= Average Benchmarks Intel HD Graphics (Ivy Bridge) → 0% n=
- Range of benchmark values for this graphics card
- Average benchmark values for this graphics card
* Smaller numbers mean a higher performance
1 This benchmark is not used for the average calculation
Game Benchmarks The following benchmarks stem from our benchmarks of review laptops. The performance depends on the used graphics memory, clock rate, processor, system settings, drivers, and operating systems. So the results don't have to be representative for all laptops with this GPU. For detailed information on the benchmark results, click on the fps number.
NVIDIA GeForce RTX 3090 Ti:
263 263 [X] AMD Ryzen 7 5800X3D AMD Ryzen 7 5800X3D 3.4GHz
NVIDIA GeForce RTX 3090 Ti
min:
46.1 fps, P0.1:
75.9 fps, P1:
201 fps, max:
403 fps
~ 263 fps
NVIDIA GeForce RTX 3090 Ti:
260 260 [X] AMD Ryzen 7 5800X3D AMD Ryzen 7 5800X3D 3.4GHz
NVIDIA GeForce RTX 3090 Ti
min:
41.5 fps, P0.1:
79.1 fps, P1:
196.1 fps, max:
403 fps
~ 260 fps
NVIDIA GeForce RTX 3090 Ti:
261 261 [X] AMD Ryzen 7 5800X3D AMD Ryzen 7 5800X3D 3.4GHz
NVIDIA GeForce RTX 3090 Ti
min:
27.3 fps, P0.1:
83.4 fps, P1:
198.3 fps, max:
413 fps
~ 261 fps
NVIDIA GeForce RTX 3090 Ti:
261 261 [X] AMD Ryzen 7 5800X3D AMD Ryzen 7 5800X3D 3.4GHz
NVIDIA GeForce RTX 3090 Ti
min:
32.3 fps, P0.1:
79.8 fps, P1:
179.6 fps, max:
410 fps
~ 261 fps
NVIDIA GeForce RTX 3090 Ti:
210 210 [X] AMD Ryzen 7 5800X3D AMD Ryzen 7 5800X3D 3.4GHz
NVIDIA GeForce RTX 3090 Ti
min:
33 fps, P0.1:
72.3 fps, P1:
144.7 fps, max:
319 fps
~ 210 fps
NVIDIA GeForce RTX 3090 Ti:
113.2 113.2 [X] AMD Ryzen 7 5800X3D AMD Ryzen 7 5800X3D 3.4GHz
NVIDIA GeForce RTX 3090 Ti
min:
28.8 fps, P0.1:
56.8 fps, P1:
68.3 fps, max:
281 fps
~ 113 fps
NVIDIA GeForce RTX 3090 Ti:
324 fps
NVIDIA GeForce RTX 3090 Ti:
277 277 ~ 277 fps
NVIDIA GeForce RTX 3090 Ti:
231 231 ~ 231 fps
NVIDIA GeForce RTX 3090 Ti:
81.1 81.1 ~ 81 fps
NVIDIA GeForce RTX 3090 Ti:
219 219 ~ 219 fps
NVIDIA GeForce RTX 3090 Ti:
201 201 ~ 201 fps
NVIDIA GeForce RTX 3090 Ti:
53.3 53.3 ~ 53 fps
NVIDIA GeForce RTX 3090 Ti:
228 228 ~ 228 fps
NVIDIA GeForce RTX 3090 Ti:
202 202 ~ 202 fps
NVIDIA GeForce RTX 3090 Ti:
60 60 [X] AMD Ryzen 7 5800X3D AMD Ryzen 7 5800X3D 3.4GHz
NVIDIA GeForce RTX 3090 Ti
min:
33.1 fps, P0.1:
40 fps, P1:
54.8 fps, max:
125.9 fps
~ 60 fps
NVIDIA GeForce RTX 3090 Ti:
60 60 [X] AMD Ryzen 7 5800X3D AMD Ryzen 7 5800X3D 3.4GHz
NVIDIA GeForce RTX 3090 Ti
min:
33.7 fps, P0.1:
38.6 fps, P1:
54.4 fps, max:
142.2 fps
~ 60 fps
NVIDIA GeForce RTX 3090 Ti:
60 60 [X] AMD Ryzen 7 5800X3D AMD Ryzen 7 5800X3D 3.4GHz
NVIDIA GeForce RTX 3090 Ti
min:
32.8 fps, P0.1:
40 fps, P1:
54.1 fps, max:
130.7 fps
~ 60 fps
NVIDIA GeForce RTX 3090 Ti:
60 60 [X] AMD Ryzen 7 5800X3D AMD Ryzen 7 5800X3D 3.4GHz
NVIDIA GeForce RTX 3090 Ti
min:
33.1 fps, P0.1:
39.3 fps, P1:
53.7 fps, max:
123.9 fps
~ 60 fps
NVIDIA GeForce RTX 3090 Ti:
60 60 [X] AMD Ryzen 7 5800X3D AMD Ryzen 7 5800X3D 3.4GHz
NVIDIA GeForce RTX 3090 Ti
min:
32.5 fps, P0.1:
36.7 fps, P1:
53 fps, max:
138.9 fps
~ 60 fps
NVIDIA GeForce RTX 3090 Ti:
60 60 [X] AMD Ryzen 7 5800X3D AMD Ryzen 7 5800X3D 3.4GHz
NVIDIA GeForce RTX 3090 Ti
min:
30.1 fps, P0.1:
39.7 fps, P1:
52.4 fps, max:
127.2 fps
~ 60 fps
NVIDIA GeForce RTX 3090 Ti:
202 202 [X] AMD Ryzen 7 5800X3D AMD Ryzen 7 5800X3D 3.4GHz
NVIDIA GeForce RTX 3090 Ti
min:
89.3 fps, P0.1:
148.3 fps, P1:
185.1 fps, max:
249 fps
~ 202 fps
NVIDIA GeForce RTX 3090 Ti:
171.4 171.4 [X] AMD Ryzen 7 5800X3D AMD Ryzen 7 5800X3D 3.4GHz
NVIDIA GeForce RTX 3090 Ti
min:
37.5 fps, P0.1:
134.1 fps, P1:
156.7 fps, max:
193.6 fps
~ 171 fps
NVIDIA GeForce RTX 3090 Ti:
153 153 [X] AMD Ryzen 7 5800X3D AMD Ryzen 7 5800X3D 3.4GHz
NVIDIA GeForce RTX 3090 Ti
min:
36.2 fps, P0.1:
88.3 fps, P1:
140.6 fps, max:
185.8 fps
~ 153 fps
NVIDIA GeForce RTX 3090 Ti:
113.2 113.2 [X] AMD Ryzen 7 5800X3D AMD Ryzen 7 5800X3D 3.4GHz
NVIDIA GeForce RTX 3090 Ti
min:
40.3 fps, P0.1:
79.1 fps, P1:
105.2 fps, max:
133.5 fps
~ 113 fps
NVIDIA GeForce RTX 3090 Ti:
64.3 64.3 [X] AMD Ryzen 7 5800X3D AMD Ryzen 7 5800X3D 3.4GHz
NVIDIA GeForce RTX 3090 Ti
min:
27.7 fps, P0.1:
40.2 fps, P1:
60 fps, max:
71.2 fps
~ 64 fps
NVIDIA GeForce RTX 3090 Ti:
411 411 ~ 411 fps
NVIDIA GeForce RTX 3090 Ti:
347 347 ~ 347 fps
NVIDIA GeForce RTX 3090 Ti:
315 315 ~ 315 fps
NVIDIA GeForce RTX 3090 Ti:
290 290 ~ 290 fps
NVIDIA GeForce RTX 3090 Ti:
208 208 ~ 208 fps
NVIDIA GeForce RTX 3090 Ti:
116 116 ~ 116 fps
NVIDIA GeForce RTX 3090 Ti:
231 fps
NVIDIA GeForce RTX 3090 Ti:
200 200 ~ 200 fps
NVIDIA GeForce RTX 3090 Ti:
188 188 ~ 188 fps
NVIDIA GeForce RTX 3090 Ti:
127 127 ~ 127 fps
NVIDIA GeForce RTX 3090 Ti:
114 114 ~ 114 fps
NVIDIA GeForce RTX 3090 Ti:
89 89 ~ 89 fps
NVIDIA GeForce RTX 3090 Ti:
195.5 195.5 [X] AMD Ryzen 7 5800X3D AMD Ryzen 7 5800X3D 3.4GHz
NVIDIA GeForce RTX 3090 Ti
min:
117 fps, P0.1:
128.1 fps, P1:
161.1 fps, max:
406 fps
~ 196 fps
NVIDIA GeForce RTX 3090 Ti:
207 207 [X] AMD Ryzen 7 5800X3D AMD Ryzen 7 5800X3D 3.4GHz
NVIDIA GeForce RTX 3090 Ti
min:
115 fps, P0.1:
130.5 fps, P1:
168.7 fps, max:
414 fps
~ 207 fps
NVIDIA GeForce RTX 3090 Ti:
191.2 191.2 [X] AMD Ryzen 7 5800X3D AMD Ryzen 7 5800X3D 3.4GHz
NVIDIA GeForce RTX 3090 Ti
min:
79.1 fps, P0.1:
121.3 fps, P1:
152.5 fps, max:
408 fps
~ 191 fps
NVIDIA GeForce RTX 3090 Ti:
149.9 149.9 [X] AMD Ryzen 7 5800X3D AMD Ryzen 7 5800X3D 3.4GHz
NVIDIA GeForce RTX 3090 Ti
min:
75.1 fps, P0.1:
117.6 fps, P1:
127 fps, max:
395 fps
~ 150 fps
NVIDIA GeForce RTX 3090 Ti:
93.7 93.7 [X] AMD Ryzen 7 5800X3D AMD Ryzen 7 5800X3D 3.4GHz
NVIDIA GeForce RTX 3090 Ti
min:
72.7 fps, P0.1:
81.2 fps, P1:
83.7 fps, max:
154.8 fps
~ 94 fps
NVIDIA GeForce RTX 3090 Ti:
179 179 ~ 179 fps
NVIDIA GeForce RTX 3090 Ti:
161.6 162 ~ 162 fps
NVIDIA GeForce RTX 3090 Ti:
142 142 ~ 142 fps
NVIDIA GeForce RTX 3090 Ti:
89.9 90 ~ 90 fps
NVIDIA GeForce RTX 3090 Ti:
537 537 [X] AMD Ryzen 7 5800X3D 874931
AMD Ryzen 7 5800X3D 3.4GHz
NVIDIA GeForce RTX 3090 Ti
min:
421 fps, P1:
347 fps, max:
585 fps
~ 537 fps
NVIDIA GeForce RTX 3090 Ti:
470 470 [X] AMD Ryzen 7 5800X3D 874931
AMD Ryzen 7 5800X3D 3.4GHz
NVIDIA GeForce RTX 3090 Ti
min:
395 fps, P1:
316 fps, max:
516 fps
~ 470 fps
NVIDIA GeForce RTX 3090 Ti:
242 242 [X] AMD Ryzen 7 5800X3D 874931
AMD Ryzen 7 5800X3D 3.4GHz
NVIDIA GeForce RTX 3090 Ti
min:
172 fps, P1:
179 fps, max:
271 fps
~ 242 fps
NVIDIA GeForce RTX 3090 Ti:
189.3 189.3 [X] AMD Ryzen 7 5800X3D 874931
AMD Ryzen 7 5800X3D 3.4GHz
NVIDIA GeForce RTX 3090 Ti
min:
161 fps, P1:
161 fps, max:
209 fps
~ 189 fps
NVIDIA GeForce RTX 3090 Ti:
114.9 114.9 [X] AMD Ryzen 7 5800X3D 874931
AMD Ryzen 7 5800X3D 3.4GHz
NVIDIA GeForce RTX 3090 Ti
min:
99 fps, P1:
100 fps, max:
128 fps
~ 115 fps
NVIDIA GeForce RTX 3090 Ti:
160 160 ~ 160 fps
NVIDIA GeForce RTX 3090 Ti:
138 138 ~ 138 fps
NVIDIA GeForce RTX 3090 Ti:
123 123 ~ 123 fps
NVIDIA GeForce RTX 3090 Ti:
108 108 ~ 108 fps
NVIDIA GeForce RTX 3090 Ti:
73 73 ~ 73 fps
NVIDIA GeForce RTX 3090 Ti:
171.4 171.4 [X] AMD Ryzen 7 5800X3D AMD Ryzen 7 5800X3D 3.4GHz
NVIDIA GeForce RTX 3090 Ti
min:
75.65 fps, P1:
123.08 fps, max:
245.68 fps
~ 171 fps
NVIDIA GeForce RTX 3090 Ti:
154.2 154.2 [X] AMD Ryzen 7 5800X3D AMD Ryzen 7 5800X3D 3.4GHz
NVIDIA GeForce RTX 3090 Ti
min:
88.03 fps, P1:
113.17 fps, max:
222.42 fps
~ 154 fps
NVIDIA GeForce RTX 3090 Ti:
130.2 130.2 [X] AMD Ryzen 7 5800X3D AMD Ryzen 7 5800X3D 3.4GHz
NVIDIA GeForce RTX 3090 Ti
min:
80.06 fps, P1:
100.27 fps, max:
192.77 fps
~ 130 fps
NVIDIA GeForce RTX 3090 Ti:
107.8 107.8 [X] AMD Ryzen 7 5800X3D AMD Ryzen 7 5800X3D 3.4GHz
NVIDIA GeForce RTX 3090 Ti
min:
37.5 fps, P1:
87.55 fps, max:
159.3 fps
~ 108 fps
NVIDIA GeForce RTX 3090 Ti:
70.1 70.1 [X] AMD Ryzen 7 5800X3D AMD Ryzen 7 5800X3D 3.4GHz
NVIDIA GeForce RTX 3090 Ti
min:
42.4 fps, P1:
58.37 fps, max:
143.5 fps
~ 70 fps
NVIDIA GeForce RTX 3090 Ti:
240 240 [X] AMD Ryzen 7 5800X3D AMD Ryzen 7 5800X3D 3.4GHz
NVIDIA GeForce RTX 3090 Ti
min:
24 fps, P0.1:
112.2 fps, P1:
170.4 fps, max:
468 fps
240 [X] AMD Ryzen 7 5800X3D AMD Ryzen 7 5800X3D 3.4GHz
NVIDIA GeForce RTX 3090 Ti
min:
24 fps, P0.1:
112.2 fps, P1:
170.4 fps, max:
468 fps
~ 240 fps
NVIDIA GeForce RTX 3090 Ti:
231 231 [X] AMD Ryzen 7 5800X3D AMD Ryzen 7 5800X3D 3.4GHz
NVIDIA GeForce RTX 3090 Ti
min:
84.7 fps, P0.1:
116.2 fps, P1:
160.4 fps, max:
402 fps
~ 231 fps
NVIDIA GeForce RTX 3090 Ti:
173.9 173.9 [X] AMD Ryzen 7 5800X3D AMD Ryzen 7 5800X3D 3.4GHz
NVIDIA GeForce RTX 3090 Ti
min:
73.1 fps, P0.1:
101.4 fps, P1:
134.6 fps, max:
324 fps
~ 174 fps
NVIDIA GeForce RTX 3090 Ti:
99.2 99.2 [X] AMD Ryzen 7 5800X3D AMD Ryzen 7 5800X3D 3.4GHz
NVIDIA GeForce RTX 3090 Ti
min:
29.7 fps, P0.1:
56 fps, P1:
77.1 fps, max:
331 fps
~ 99 fps
NVIDIA GeForce RTX 3090 Ti:
204 204 ~ 204 fps
NVIDIA GeForce RTX 3090 Ti:
83.8 83.8 ~ 84 fps
NVIDIA GeForce RTX 3090 Ti:
240 240 [X] AMD Ryzen 7 5800X3D AMD Ryzen 7 5800X3D 3.4GHz
NVIDIA GeForce RTX 3090 Ti
min:
111.7 fps, P0.1:
137.1 fps, P1:
150 fps, max:
576 fps
~ 240 fps
NVIDIA GeForce RTX 3090 Ti:
209 209 [X] AMD Ryzen 7 5800X3D AMD Ryzen 7 5800X3D 3.4GHz
NVIDIA GeForce RTX 3090 Ti
min:
55.6 fps, P0.1:
119.8 fps, P1:
162.7 fps, max:
646 fps
~ 209 fps
NVIDIA GeForce RTX 3090 Ti:
142.5 142.5 [X] AMD Ryzen 7 5800X3D AMD Ryzen 7 5800X3D 3.4GHz
NVIDIA GeForce RTX 3090 Ti
min:
51.8 fps, P0.1:
81.9 fps, P1:
115.5 fps, max:
567 fps
~ 143 fps
NVIDIA GeForce RTX 3090 Ti:
73.9 73.9 [X] AMD Ryzen 7 5800X3D AMD Ryzen 7 5800X3D 3.4GHz
NVIDIA GeForce RTX 3090 Ti
min:
46.2 fps, P0.1:
53.2 fps, P1:
62.6 fps, max:
167 fps
~ 74 fps
NVIDIA GeForce RTX 3090 Ti:
59.9 59.9 ~ 60 fps
NVIDIA GeForce RTX 3090 Ti:
213 213 ~ 213 fps
NVIDIA GeForce RTX 3090 Ti:
84.3 84.3 ~ 84 fps
NVIDIA GeForce RTX 3090 Ti:
265 265 ~ 265 fps
NVIDIA GeForce RTX 3090 Ti:
257 257 ~ 257 fps
NVIDIA GeForce RTX 3090 Ti:
244 244 ~ 244 fps
NVIDIA GeForce RTX 3090 Ti:
184 184 ~ 184 fps
NVIDIA GeForce RTX 3090 Ti:
106 106 ~ 106 fps
NVIDIA GeForce RTX 3090 Ti:
222 222 ~ 222 fps
NVIDIA GeForce RTX 3090 Ti:
226 226 ~ 226 fps
NVIDIA GeForce RTX 3090 Ti:
96.3 96.3 ~ 96 fps
NVIDIA GeForce RTX 3090 Ti:
394 394 [X] AMD Ryzen 7 5800X3D AMD Ryzen 7 5800X3D 3.4GHz
NVIDIA GeForce RTX 3090 Ti
min:
335 fps, P1:
342.98 fps, max:
440 fps
~ 394 fps
NVIDIA GeForce RTX 3090 Ti:
172.9 172.9 [X] AMD Ryzen 7 5800X3D AMD Ryzen 7 5800X3D 3.4GHz
NVIDIA GeForce RTX 3090 Ti
min:
152 fps, P1:
152.57 fps, max:
188 fps
~ 173 fps
HD Graphics (Ivy Bridge):
34.5 fps
HD Graphics (Ivy Bridge):
14.3 fps
HD Graphics (Ivy Bridge):
8.6 fps
HD Graphics (Ivy Bridge):
5.9 fps
HD Graphics (Ivy Bridge):
3.6 fps
HD Graphics (Ivy Bridge):
15 fps
HD Graphics (Ivy Bridge):
7.6 fps
HD Graphics (Ivy Bridge):
20 fps
HD Graphics (Ivy Bridge):
14 fps
HD Graphics (Ivy Bridge):
54.4 fps
HD Graphics (Ivy Bridge):
32 fps
HD Graphics (Ivy Bridge):
18.4 30.5 ~ 24 fps
HD Graphics (Ivy Bridge):
8.2 24.5 ~ 16 fps
HD Graphics (Ivy Bridge):
27.5 fps
HD Graphics (Ivy Bridge):
12.8 fps
HD Graphics (Ivy Bridge):
12.5 fps
HD Graphics (Ivy Bridge):
10.5 fps
HD Graphics (Ivy Bridge):
8.1 fps
HD Graphics (Ivy Bridge):
4.4 fps
HD Graphics (Ivy Bridge):
8.6 8.9 9 ~ 9 fps
HD Graphics (Ivy Bridge):
7.7 fps
HD Graphics (Ivy Bridge):
80.8 112 [X] Medion Akoya E7221-MD98297 Intel Pentium 2020M 2.4GHz
HD Graphics (Ivy Bridge)
~ 96 fps
HD Graphics (Ivy Bridge):
19.3 24 [X] Medion Akoya E7221-MD98297 Intel Pentium 2020M 2.4GHz
HD Graphics (Ivy Bridge)
~ 22 fps
HD Graphics (Ivy Bridge):
10.8 15 [X] Medion Akoya E7221-MD98297 Intel Pentium 2020M 2.4GHz
HD Graphics (Ivy Bridge)
~ 13 fps
HD Graphics (Ivy Bridge):
4 [X] Medion Akoya E7221-MD98297 Intel Pentium 2020M 2.4GHz
HD Graphics (Ivy Bridge)
fps
HD Graphics (Ivy Bridge):
5.1 7.4 7.6 8 [X] Medion Akoya E7221-MD98297 Intel Pentium 2020M 2.4GHz
HD Graphics (Ivy Bridge)
~ 7 fps
HD Graphics (Ivy Bridge):
42 [X] Medion Akoya E7221-MD98297 Intel Pentium 2020M 2.4GHz
HD Graphics (Ivy Bridge)
fps
HD Graphics (Ivy Bridge):
17 [X] Medion Akoya E7221-MD98297 Intel Pentium 2020M 2.4GHz
HD Graphics (Ivy Bridge)
fps
HD Graphics (Ivy Bridge):
12 [X] Medion Akoya E7221-MD98297 Intel Pentium 2020M 2.4GHz
HD Graphics (Ivy Bridge)
fps
HD Graphics (Ivy Bridge):
6 [X] Medion Akoya E7221-MD98297 Intel Pentium 2020M 2.4GHz
HD Graphics (Ivy Bridge)
fps
HD Graphics (Ivy Bridge):
13 [X] Medion Akoya E7221-MD98297 Intel Pentium 2020M 2.4GHz
HD Graphics (Ivy Bridge)
fps
HD Graphics (Ivy Bridge):
11 [X] Medion Akoya E7221-MD98297 Intel Pentium 2020M 2.4GHz
HD Graphics (Ivy Bridge)
fps
HD Graphics (Ivy Bridge):
4 [X] Medion Akoya E7221-MD98297 Intel Pentium 2020M 2.4GHz
HD Graphics (Ivy Bridge)
fps
HD Graphics (Ivy Bridge):
18 19 ~ 19 fps
HD Graphics (Ivy Bridge):
14 15.2 ~ 15 fps
HD Graphics (Ivy Bridge):
18.3 52 69.7 90 [X] Medion Akoya E7221-MD98297 Intel Pentium 2020M 2.4GHz
HD Graphics (Ivy Bridge)
~ 58 fps
HD Graphics (Ivy Bridge):
13.2 32.8 42.7 54 [X] Medion Akoya E7221-MD98297 Intel Pentium 2020M 2.4GHz
HD Graphics (Ivy Bridge)
~ 36 fps
HD Graphics (Ivy Bridge):
8.6 20.9 23 29 [X] Medion Akoya E7221-MD98297 Intel Pentium 2020M 2.4GHz
HD Graphics (Ivy Bridge)
~ 20 fps
HD Graphics (Ivy Bridge):
13 [X] Medion Akoya E7221-MD98297 Intel Pentium 2020M 2.4GHz
HD Graphics (Ivy Bridge)
fps
HD Graphics (Ivy Bridge):
20 25 [X] Medion Akoya E7221-MD98297 Intel Pentium 2020M 2.4GHz
HD Graphics (Ivy Bridge)
~ 23 fps
HD Graphics (Ivy Bridge):
18 20 [X] Medion Akoya E7221-MD98297 Intel Pentium 2020M 2.4GHz
HD Graphics (Ivy Bridge)
~ 19 fps
HD Graphics (Ivy Bridge):
16 [X] Medion Akoya E7221-MD98297 Intel Pentium 2020M 2.4GHz
HD Graphics (Ivy Bridge)
16 ~ 16 fps
HD Graphics (Ivy Bridge):
12 [X] Medion Akoya E7221-MD98297 Intel Pentium 2020M 2.4GHz
HD Graphics (Ivy Bridge)
fps
HD Graphics (Ivy Bridge):
30 [X] Medion Akoya E7221-MD98297 Intel Pentium 2020M 2.4GHz
HD Graphics (Ivy Bridge)
fps
HD Graphics (Ivy Bridge):
8 [X] Medion Akoya E7221-MD98297 Intel Pentium 2020M 2.4GHz
HD Graphics (Ivy Bridge)
fps
HD Graphics (Ivy Bridge):
5 [X] Medion Akoya E7221-MD98297 Intel Pentium 2020M 2.4GHz
HD Graphics (Ivy Bridge)
fps
HD Graphics (Ivy Bridge):
37 [X] Medion Akoya E7221-MD98297 Intel Pentium 2020M 2.4GHz
HD Graphics (Ivy Bridge)
fps
HD Graphics (Ivy Bridge):
20 [X] Medion Akoya E7221-MD98297 Intel Pentium 2020M 2.4GHz
HD Graphics (Ivy Bridge)
fps
HD Graphics (Ivy Bridge):
11 [X] Medion Akoya E7221-MD98297 Intel Pentium 2020M 2.4GHz
HD Graphics (Ivy Bridge)
fps
HD Graphics (Ivy Bridge):
33.3 [X] Wortmann Terra Mobile 1512 Intel Celeron 1037U 1.8GHz
HD Graphics (Ivy Bridge)
38 ~ 36 fps
HD Graphics (Ivy Bridge):
13.2 [X] Wortmann Terra Mobile 1512 Intel Celeron 1037U 1.8GHz
HD Graphics (Ivy Bridge)
13.5 ~ 13 fps
HD Graphics (Ivy Bridge):
29.2 fps
HD Graphics (Ivy Bridge):
17.5 fps
HD Graphics (Ivy Bridge):
14.6 fps
HD Graphics (Ivy Bridge):
11.1 23.1 26 26.5 27.6 27.8 28.4 28.5 [X] Wortmann Terra Mobile 1512 Intel Celeron 1037U 1.8GHz
HD Graphics (Ivy Bridge)
37.1 [X] Lenovo B590 (59-362559) Intel Pentium 2020M 2.4GHz
HD Graphics (Ivy Bridge)
~ 26 fps
HD Graphics (Ivy Bridge):
5.5 11.2 11.4 11.5 [X] Wortmann Terra Mobile 1512 Intel Celeron 1037U 1.8GHz
HD Graphics (Ivy Bridge)
11.7 11.9 13 15.4 16.8 [X] Lenovo B590 (59-362559) Intel Pentium 2020M 2.4GHz
HD Graphics (Ivy Bridge)
~ 12 fps
HD Graphics (Ivy Bridge):
12.7 16.9 17.4 18.3 [X] Wortmann Terra Mobile 1512 Intel Celeron 1037U 1.8GHz
HD Graphics (Ivy Bridge)
~ 16 fps
HD Graphics (Ivy Bridge):
7.3 9.4 9.6 [X] Wortmann Terra Mobile 1512 Intel Celeron 1037U 1.8GHz
HD Graphics (Ivy Bridge)
~ 9 fps
HD Graphics (Ivy Bridge):
4.6 fps
HD Graphics (Ivy Bridge):
55.8 [X] Lenovo B590 (59-362559) Intel Pentium 2020M 2.4GHz
HD Graphics (Ivy Bridge)
fps
HD Graphics (Ivy Bridge):
21.2 [X] Lenovo B590 (59-362559) Intel Pentium 2020M 2.4GHz
HD Graphics (Ivy Bridge)
fps
HD Graphics (Ivy Bridge):
25.4 fps
HD Graphics (Ivy Bridge):
11.4 fps
HD Graphics (Ivy Bridge):
41.4 fps
HD Graphics (Ivy Bridge):
16.5 fps
HD Graphics (Ivy Bridge):
90 fps
HD Graphics (Ivy Bridge):
20.7 fps
HD Graphics (Ivy Bridge):
78.3 fps
HD Graphics (Ivy Bridge):
28.3 fps
NVIDIA GeForce RTX 3090 Ti low med. high ultra QHD 4K Ghostwire Tokyo 263 260 261 261 210 113 Tiny Tina's Wonderlands 324 277 231 190 143 81 Cyberpunk 2077 1.6 219 201 173 152 104 53 GRID Legends 228 202 173 157 153 121 Elden Ring 60 60 60 60 60 60 Dying Light 2 202 171 153 113 64 Rainbow Six Extraction 411 347 315 290 208 116 Forza Horizon 5 231 200 188 127 114 89 Call of Duty Vanguard 196 207 191 150 94 Far Cry 6 179 162 142 133 90 F1 2021 537 470 242 189 115 Assassin´s Creed Valhalla 160 138 123 108 73 Watch Dogs Legion 171 154 130 108 70 Mafia Definitive Edition 240 231 174 99 Borderlands 3 204 188 173 143 84 Control 240 209 143 74 Total War: Three Kingdoms 343 249 177 118 60 Metro Exodus 213 175 146 125 84 Shadow of the Tomb Raider 265 257 244 184 106 X-Plane 11.11 169 158 136 116 Final Fantasy XV Benchmark 222 226 186 152 96 Dota 2 Reborn 258 231 217 195 184 The Witcher 3 394 194 173 GTA V 183 156 151 181 < 30 fps < 60 fps < 120 fps ≥ 120 fps 1 10 1 21 1 23 1 18 7 14 1 19 4
For more games that might be playable and a list of all games and graphics cards visit our Gaming List
v1.28
log 04. 06:12:08
#0 checking url part for id 6452 +0s ... 0s
#1 checking url part for id 11324 +0s ... 0s
#2 checking url part for id 3563 +0s ... 0s
#3 redirected to Ajax server, took 1720066328 +0s ... 0s
#4 did not recreate cache, as it is less than 5 days old! Created at Thu, 04 Jul 2024 05:15:44 +0200 +0s ... 0s
#5 composed specs +0.005s ... 0.005s
#6 did output specs +0s ... 0.005s
#7 start showIntegratedCPUs +0s ... 0.005s
#8 getting avg benchmarks for device 6452 +0.02s ... 0.025s
#9 got single benchmarks 6452 +0s ... 0.025s
#10 getting avg benchmarks for device 11324 +0.004s ... 0.029s
#11 got single benchmarks 11324 +0.006s ... 0.036s
#12 getting avg benchmarks for device 3563 +0.004s ... 0.04s
#13 got single benchmarks 3563 +0.016s ... 0.055s
#14 got avg benchmarks for devices +0s ... 0.055s
#15 No cached benchmark found, getting uncached values +0.019s ... 0.074s
#16 min, max, avg, median took s +0.023s ... 0.098s
#17 before gaming benchmark output +0s ... 0.098s
#18 Got 385 rows for game benchmarks. +0.02s ... 0.118s
#19 composed SQL query for gamebenchmarks +0s ... 0.118s
#20 got data and put it in $dataArray +0.003s ... 0.121s
#21 benchmarks composed for output. +0.018s ... 0.14s
#22 calculated avg scores. +0s ... 0.14s
#23 return log +0.001s ... 0.14s
Please share our article, every link counts!
Redaktion, 2017-09- 8 (Update: 2023-07- 1)
 Deutsch
 English
 Español
 Français
 Italiano
 Nederlands
 Polski
 Português
 Русский
 Türkçe
 Svenska
 Chinese
 Magyar