Intel HD Graphics P530 vs NVIDIA GeForce RTX 3050 6GB Laptop GPU vs Intel HD Graphics (Haswell)
Intel HD Graphics P530 ► remove from comparison
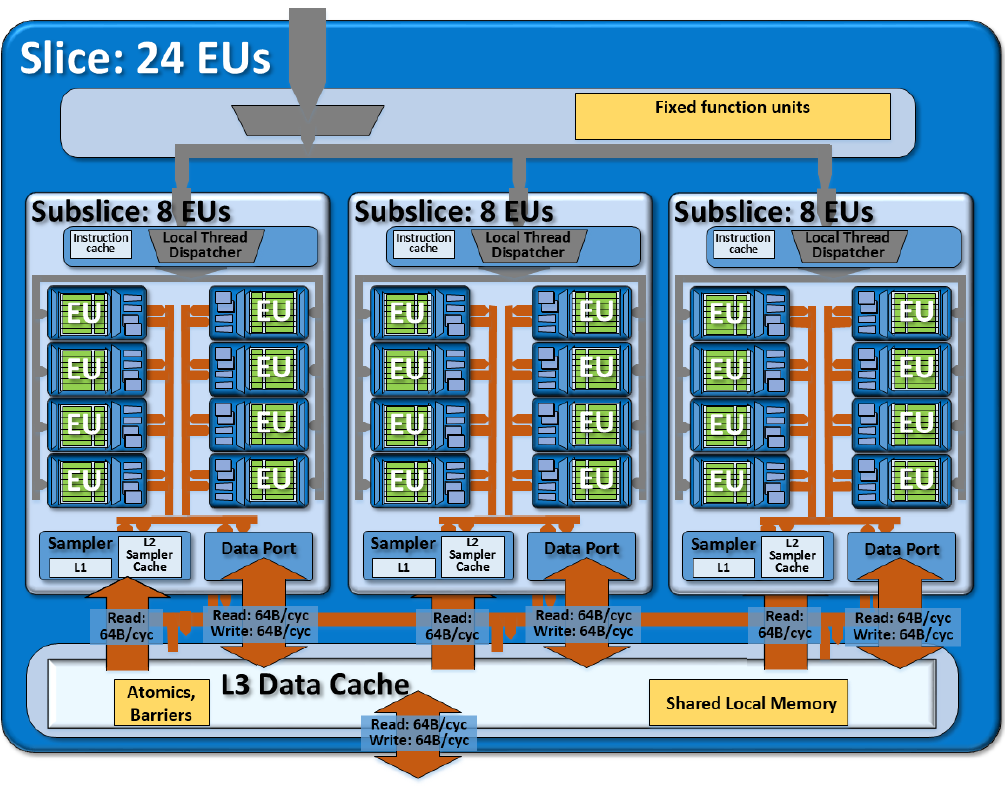
The Intel HD Graphics P530 (GT2) is an integrated graphics unit, which can be found in various Xeon workstation processors of the Skylake generation. The "GT2" version of the Skylake GPU offers 24 Execution Units (EUs) clocked at up to 1050 MHz (depending on the CPU model). Due to its lack of dedicated graphics memory or eDRAM cache, the P530 has to access the main memory (2x 64bit DDR3L-1600 / DDR4-2133).
Performance
Depending on the memory configuration, the HD Graphics P530 is just slightly behind a dedicated GeForce 920M and will handle modern games (as of 2015) in low or medium settings.
Features
The revised video engine now decodes H.265/HEVC completely in hardware and thereby much more efficiently than before. Displays can be connected via DP 1.2 / eDP 1.3 (max. 3840 x 2160 @ 60 Hz), whereas HDMI is limited to the older version 1.4a (max. 3840 x 2160 @ 30 Hz). However, HDMI 2.0 can be added using a DisplayPort converter. Up to three displays can be controlled simultaneously.
Power Consumption
The HD Graphics P530 can be found in mobile quad-core Xeon processors with 45 W TDP.
NVIDIA GeForce RTX 3050 6GB Laptop GPU ► remove from comparison
The Nvidia GeForce RTX 3050 6GB Laptop GPU (mobile, GN20-P0-R, 2023 Refresh) is the refresh of the RTX 3050 4GB Laptop GPU (slowest RTX 3000 mobile card) and also based on the GA107 Ampere chip. The 6GB variant offers more CUDA cores (2,560, +25%) but a cut down memory bus to 96 Bit. The clock speed depends on the TGP variant and can range from 713 - 1530 (base) and 1058 - 1740 (boost) for the TGP variants of 35 to 80 Watt (see table below).
The performance is between the old 4GB RTX 3050 and the RTX 3050 Ti and therefore best suited for full HD gaming (1920 x 1080) in medium to high graphic settings. The performance is not sufficient to enable Raytracing in most games, but the Tensor cores can be used for DLSS in some games (and get performance boost with slight quality reduction). Beware, that the low TGP variants will offer a significantly lower performance.
The GA107 chip offers 3,072 FP32 ALUs of which half can also execute INT32 instructions (i.e. 1,536 INT32 ALUs). The RTX 3050 however maybe won't use all ALUs on the chip. With Turing all shaders could still execute FP32 or INT32 instructions. The raytracing and tensor cores on the chip were also improved according to Nvidia. The Ampere chips also include an improved 5th generation video encoder (NVENC for H.264 and H.265) and a 7th generation decoder (for various formats now including AV1).
The GA107 chip is manufactured by Samsung in 8nm (8N), which is not quite able to keep up with the 7nm node at TSMC (e.g. used by AMD and also for the professional GA100 Ampere chip).
Intel HD Graphics (Haswell) ► remove from comparison
The Intel HD Graphics (Haswell) is an integrated graphics card in the Haswell codenamed processors (Celeron and Pentium). It is the successor the the Intel HD Graphics in the Ivy Bridge CPUs and performs slightly better. Depending on the processor model, the base and turbo clock rates may differ, resulting in varying graphics performance between CPU models.
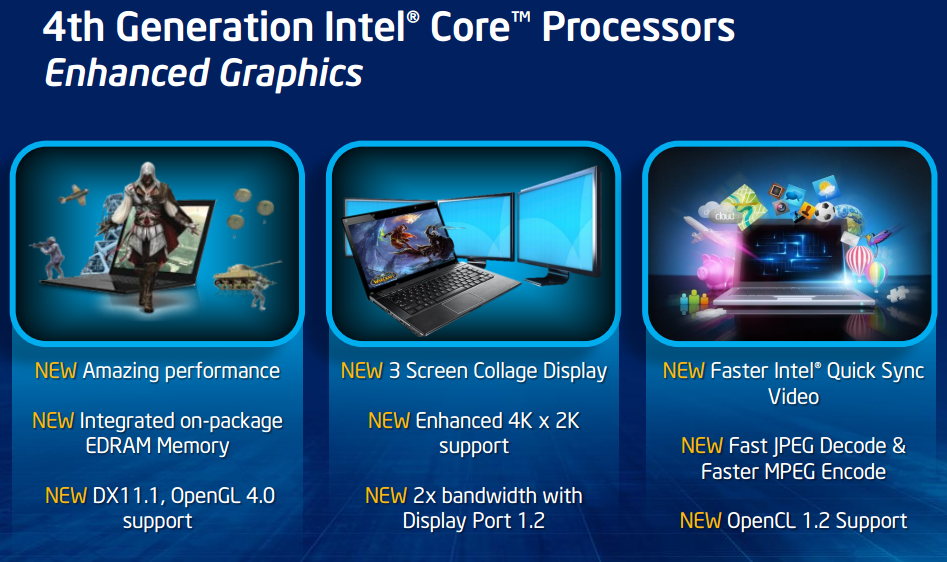
In comparison to the HD 4000, the graphics core has been modified extensively. The GPU supports DirectX 11.1, OpenCL 1.2 and OpenGL 4.0. It also features an improved decoder for 4K videos and the fast Quick Sync encoder (deactivated in many entry level models).
The Performance of the HD Graphics (Haswell) is similar to the old HD Graphics 3000 or the AMD Radeon HD 8250 . Only a few modern games like Dota 2 can be played fluently in very low details and resolutions.
Due to the 22nm 3D Tri-Gate production process, the power consumption should be relatively low (the development was focused on performance per Watt). The GPU can be found in ULV models and regular (37 W) dual core CPUs.
Intel HD Graphics P530 NVIDIA GeForce RTX 3050 6GB Laptop GPU Intel HD Graphics (Haswell) HD Graphics Series Codename Skylake GT2 GN20-P0-R 6GB Haswell GT1 Architecture Gen. 9 Skylake Ampere Gen. 7.5 Haswell Pipelines 24 - unified 2560 - unified 10 - unified Core Speed 350 - 1050 (Boost) MHz 1237 - 1492 (Boost) MHz 200 - 1000 (Boost) MHz Memory Bus Width 64/128 Bit 96 Bit 64/128 Bit Memory Type DDR3/DDR4 GDDR6 Shared Memory yes no yes API DirectX 12_1, OpenGL 4.4 DirectX 12_2, Shader 6.7, OpenGL 4.6 DirectX 11.1, Shader 5.0 technology 14 nm 8 nm 22 nm Features QuickSync NVIDIA DLSS, NVIDIA Reflex, Resizable BAR, NVIDIA Broadcast, NVIDIA Ansel, NVIDIA ShadowPlay, NVIDIA G-SYNC, Advanced Optimus, Nvidia Max-Q, Dynamic Boost Date of Announcement 01.09.2015 06.01.2023 01.10.2012 TMUs 80 ROPs 32 Raytracing Cores 16 Tensor / AI Cores 64 Memory Speed 12000 effective = 1500 MHz Max. Amount of Memory 6 GB Memory Bandwidth 144 GB/s Power Consumption 60 Watt (35 - 80 Watt TGP) PCIe 4.0 Displays HDMI 2.1, DisplayPort 1.4a Notebook Size large Predecessor GeForce RTX 3050 4GB Laptop GPU
CPU in HD Graphics P530 GPU Base Speed GPU Boost / Turbo Intel Xeon E3-1535M v5 4 x 2900 MHz, 45 W 350 MHz 1050 MHz Intel Xeon E3-1505M v5 4 x 2800 MHz, 45 W 350 MHz 1050 MHz min. - max. 350 MHz 1050 MHz
CPU in HD Graphics (Haswell) GPU Base Speed GPU Boost / Turbo Intel Pentium 3560M 2 x 2400 MHz, 37 W 400 MHz 1100 MHz Intel Pentium 3550M 2 x 2300 MHz, 37 W 400 MHz 1100 MHz Intel Celeron 2970M 2 x 2200 MHz, 37 W 400 MHz 1100 MHz » show 10 more Intel Celeron 2950M 2 x 2000 MHz, 37 W 400 MHz 1100 MHz Intel Pentium 3558U 2 x 1700 MHz, 15 W 200 MHz 1000 MHz Intel Pentium 3556U 2 x 1700 MHz, 15 W 200 MHz 1000 MHz Intel Celeron 2981U 2 x 1600 MHz, 15 W 200 MHz 1000 MHz Intel Celeron 2980U 2 x 1600 MHz, 15 W 200 MHz 1000 MHz Intel Celeron 2957U 2 x 1400 MHz, 15 W 200 MHz 1000 MHz Intel Celeron 2955U 2 x 1400 MHz, 15 W 200 MHz 1000 MHz Intel Pentium 3561Y 2 x 1200 MHz, 11.5 W 200 MHz 850 MHz Intel Pentium 3560Y 2 x 1200 MHz, 11.5 W 200 MHz 850 MHz Intel Celeron 2961Y 2 x 1100 MHz, 11.5 W 200 MHz 850 MHz min. - max. 200 - 400 MHz 850 - 1100 MHz
Benchmarks Performance Rating - 3DMark 11 + Fire Strike + Time Spy - GeForce RTX 3050 6GB Laptop GPU
5.5 pt (16%)
...
NVIDIA GeForce RTX 3050 6GB Laptop GPU
...
max:
Performance Rating - 3DMark 11 + Fire Strike + Time Spy - HD Graphics (Haswell)
0.2 pt (0%)
...
Intel HD Graphics (Haswell)
...
max:
3DMark - 3DMark Time Spy Score
min: 4933 avg: 5058 median: 5057.5 (15%) max: 5182 Points
GPU TDP 50 W TDP 63 W 95% 100%
3DMark - 3DMark Time Spy Graphics
min: 4501 avg: 4661 median: 4660.5 (12%) max: 4820 Points
GPU TDP 50 W TDP 63 W 93% 100%
3DMark - 3DMark Ice Storm Unlimited Graphics
500518 Points (57%)
43493 Points (5%)
3DMark - 3DMark Ice Storm Extreme Graphics
80214 Points (10%)
3DMark - 3DMark Cloud Gate Score
43015 Points (46%)
min: 2141 avg: 2403 median: 2335.5 (2%) max: 3011 Points
3DMark - 3DMark Cloud Gate Graphics
72486 Points (19%)
min: 3111 avg: 3415 median: 3278 (1%) max: 4199 Points
3DMark - 3DMark Fire Strike Standard Score
min: 10765 avg: 10995 median: 10890 (19%) max: 11330 Points
GPU TDP 50 W TDP 60 W TDP 63 W 95% 96% 100%
min: 300 avg: 323.8 median: 314 (1%) max: 383 Points
GPU TDP ? TDP 50 W TDP 60 W TDP 63 W 3% 95% 96% 100%
3DMark - 3DMark Fire Strike Standard Graphics
min: 11887 avg: 12155 median: 11960 (14%) max: 12618 Points
GPU TDP 50 W TDP 60 W TDP 63 W 94% 95% 100%
min: 340 avg: 370.8 median: 362.5 (0%) max: 433 Points
GPU TDP ? TDP 50 W TDP 60 W TDP 63 W 3% 94% 95% 100%
3DMark - 3DMark Ice Storm Graphics
80553 Points (10%)
min: 29291 avg: 34138 median: 34675 (4%) max: 40515 Points
GPU TDP ? TDP 60 W 42% 100%
3DMark - 3DMark Wild Life Extreme Unlimited
8916 Points (10%)
3DMark 11 - 3DM11 Performance Score
min: 15844 avg: 16783 median: 17223 (24%) max: 17282 Points
GPU TDP 50 W TDP 60 W TDP 63 W 92% 100% 100%
min: 435 avg: 543 median: 544 (1%) max: 688 Points
GPU TDP ? TDP 50 W TDP 60 W TDP 63 W 3% 92% 100% 100%
3DMark 11 - 3DM11 Performance GPU
min: 15860 avg: 17113 median: 17421 (15%) max: 18059 Points
GPU TDP 50 W TDP 60 W TDP 63 W 88% 96% 100%
min: 384 avg: 479.6 median: 484 (0%) max: 602 Points
GPU TDP ? TDP 50 W TDP 60 W TDP 63 W 3% 88% 96% 100%
3DMark Vantage + Intel HD Graphics (Haswell) 3DMark Vantage - 3DM Vant. Perf. total
min: 2146 avg: 2163 median: 2163 (1%) max: 2180 Points
3DM Vant. Perf. GPU no PhysX + Intel HD Graphics (Haswell) 3DMark Vantage - 3DM Vant. Perf. GPU no PhysX
min: 1848 avg: 1859 median: 1859 (1%) max: 1870 Points
3DMark 06 3DMark 06 - Standard 1280x1024 + Intel HD Graphics (Haswell)
min: 2917 avg: 3274 median: 3357.5 (4%) max: 3463 Points
Blender - Blender 3.3 Classroom CUDA *
min: 107 avg: 110.7 median: 110 (16%) max: 115 Seconds
GPU TDP 50 W TDP 60 W TDP 63 W 100% 101% 101%
Blender - Blender 3.3 Classroom OPTIX *
min: 68 avg: 69.3 median: 68 (25%) max: 72 Seconds
GPU TDP 50 W TDP 60 W TDP 63 W 100% 102% 102%
Windows 7 Experience Index - Win7 Gaming graphics
6.3 Points (80%)
Windows 7 Experience Index - Win7 Graphics
4.7 Points (59%)
Cinebench R10 Cinebench R10 Shading (32bit) + Intel HD Graphics (Haswell) Cinebench R10 - Cinebench R10 Shading (32bit)
min: 3867 avg: 4235 median: 4215.5 (3%) max: 4642 Points
Cinebench R11.5 Cinebench R11.5 OpenGL 64 Bit + Intel HD Graphics (Haswell) Cinebench R11.5 - Cinebench R11.5 OpenGL 64 Bit
min: 9.38 avg: 11.4 median: 11.6 (4%) max: 12.78 fps
Cinebench R15 + NVIDIA GeForce RTX 3050 6GB Laptop GPU Cinebench R15 - Cinebench R15 OpenGL 64 Bit
min: 117.6 avg: 186.5 median: 221 (13%) max: 221 fps
GPU TDP 50 W TDP 60 W TDP 63 W 100% 100% 53%
Cinebench R15 OpenGL 64 Bit + Intel HD Graphics (Haswell)
min: 10.28 avg: 13.2 median: 13.9 (1%) max: 14.59 fps
GPU TDP ? TDP 50 W TDP 60 W TDP 63 W 6% 100% 100% 53%
Cinebench R15 OpenGL Ref. Match 64 Bit + NVIDIA GeForce RTX 3050 6GB Laptop GPU Cinebench R15 - Cinebench R15 OpenGL Ref. Match 64 Bit
99.6 % (100%)
GPU TDP 50 W TDP 60 W TDP 63 W 100% 100% 100%
Cinebench R15 OpenGL Ref. Match 64 Bit + Intel HD Graphics (Haswell)
98 % (98%)
GPU TDP ? TDP 50 W TDP 60 W TDP 63 W 98% 100% 100% 100%
GFXBench - GFXBench Car Chase Offscreen
11.6 fps (1%)
GFXBench 3.1 - GFXBench Manhattan ES 3.1 Offscreen
20.1 fps (0%)
GFXBench 3.0 - GFXBench 3.0 Manhattan Offscreen
28.7 fps (2%)
GFXBench (DX / GLBenchmark) 2.7 + Intel HD Graphics (Haswell) GFXBench (DX / GLBenchmark) 2.7 - GFXBench T-Rex HD Offscreen C24Z16
53.5 fps (0%)
Basemark GPU 1.2 - Basemark GPU 1.2 Vulkan Official Medium Offscreen 1080
min: 104.6 avg: 166.1 median: 104.6 (1%) max: 289 fps
GPU TDP 50 W TDP 60 W TDP 63 W 100% 36% 36%
Basemark GPU 1.2 - Basemark GPU 1.2 Vulkan Official High Offscreen 2160
3.6 fps (1%)
Geekbench 6.2 - Geekbench 6.2 GPU OpenCL
min: 52427 avg: 53591 median: 53590.5 (16%) max: 54754 Points
GPU TDP 50 W TDP 60 W 96% 100%
Geekbench 6.2 - Geekbench 6.2 GPU Vulkan
min: 18152 avg: 19500 median: 19499.5 (6%) max: 20847 Points
GPU TDP 50 W TDP 60 W 100% 87%
LuxMark v2.0 64Bit - LuxMark v2.0 Room GPU
min: 77 avg: 93 median: 93 (0%) max: 109 Samples/s
LuxMark v2.0 64Bit - LuxMark v2.0 Sala GPU
min: 115 avg: 140 median: 140 (0%) max: 165 Samples/s
ComputeMark v2.1 - ComputeMark v2.1 Result
min: 355 avg: 370 median: 370 (0%) max: 385 Points
Power Consumption - Furmark Stress Test Power Consumption - external Monitor *
min: 79.4 avg: 87.6 median: 87.3 (12%) max: 96.1 Watt
GPU TDP 50 W TDP 60 W TDP 63 W 101% 100% 103%
43.7 Watt (6%)
GPU TDP ? TDP 50 W TDP 60 W TDP 63 W 109% 101% 100% 103%
Power Consumption - The Witcher 3 Power Consumption - external Monitor *
min: 83 avg: 87.2 median: 86.1 (12%) max: 92.6 Watt
GPU TDP 50 W TDP 60 W TDP 63 W 102% 100% 101%
30.5 Watt (4%)
GPU TDP ? TDP 50 W TDP 60 W TDP 63 W 110% 102% 100% 101%
Power Consumption - Witcher 3 Power Consumption *
min: 86.8 avg: 90.8 median: 89.5 (20%) max: 96.2 Watt
GPU TDP 50 W TDP 60 W TDP 63 W 103% 100% 102%
Power Consumption - Witcher 3 ultra Power Efficiency
min: 0.503 avg: 0.5 median: 0.5 (47%) max: 0.591 fps per Watt
GPU TDP 50 W TDP 60 W TDP 63 W 85% 88% 100%
Power Consumption - Witcher 3 ultra Power Efficiency - external Monitor
min: 0.527 avg: 0.6 median: 0.5 (45%) max: 0.614 fps per Watt
GPU TDP 50 W TDP 60 W TDP 63 W 86% 88% 100%
Emissions Witcher 3 Fan Noise + NVIDIA GeForce RTX 3050 6GB Laptop GPU Emissions - Witcher 3 Fan Noise
min: 42.1 avg: 44.9 median: 43.8 (70%) max: 48.7 dB(A)
GPU TDP 50 W TDP 60 W TDP 63 W 100% 86% 90%
Average Benchmarks NVIDIA GeForce RTX 3050 6GB Laptop GPU → 0% n= Average Benchmarks Intel HD Graphics (Haswell) → 0% n=
- Range of benchmark values for this graphics card
- Average benchmark values for this graphics card
* Smaller numbers mean a higher performance
1 This benchmark is not used for the average calculation
Game Benchmarks The following benchmarks stem from our benchmarks of review laptops. The performance depends on the used graphics memory, clock rate, processor, system settings, drivers, and operating systems. So the results don't have to be representative for all laptops with this GPU. For detailed information on the benchmark results, click on the fps number.
GeForce RTX 3050 6GB Laptop GPU:
39.5 fps
GeForce RTX 3050 6GB Laptop GPU:
36.3 fps
GeForce RTX 3050 6GB Laptop GPU:
31.5 fps
GeForce RTX 3050 6GB Laptop GPU:
23.4 fps
GeForce RTX 3050 6GB Laptop GPU:
15.1 fps
GeForce RTX 3050 6GB Laptop GPU:
70 fps
GeForce RTX 3050 6GB Laptop GPU:
63 fps
GeForce RTX 3050 6GB Laptop GPU:
55 fps
GeForce RTX 3050 6GB Laptop GPU:
41 fps
GeForce RTX 3050 6GB Laptop GPU:
31 fps
GeForce RTX 3050 6GB Laptop GPU:
55.2 67.6 ~ 61 fps
GeForce RTX 3050 6GB Laptop GPU:
43.7 52.1 ~ 48 fps
GeForce RTX 3050 6GB Laptop GPU:
36.6 43.2 ~ 40 fps
GeForce RTX 3050 6GB Laptop GPU:
31.4 36.9 ~ 34 fps
GeForce RTX 3050 6GB Laptop GPU:
21.3 fps
GeForce RTX 3050 6GB Laptop GPU:
113.9 150.1 ~ 132 fps
GeForce RTX 3050 6GB Laptop GPU:
109 141.2 ~ 125 fps
GeForce RTX 3050 6GB Laptop GPU:
86.9 97.5 ~ 92 fps
GeForce RTX 3050 6GB Laptop GPU:
20.5 26 ~ 23 fps
GeForce RTX 3050 6GB Laptop GPU:
10.6 14.3 ~ 12 fps
GeForce RTX 3050 6GB Laptop GPU:
40 fps
GeForce RTX 3050 6GB Laptop GPU:
38 fps
GeForce RTX 3050 6GB Laptop GPU:
34 fps
GeForce RTX 3050 6GB Laptop GPU:
29 fps
GeForce RTX 3050 6GB Laptop GPU:
30.7 33.6 34 ~ 33 fps
GeForce RTX 3050 6GB Laptop GPU:
18.1 20.1 ~ 19 fps
GeForce RTX 3050 6GB Laptop GPU:
113.3 fps
GeForce RTX 3050 6GB Laptop GPU:
89.7 fps
GeForce RTX 3050 6GB Laptop GPU:
59.2 fps
GeForce RTX 3050 6GB Laptop GPU:
46.4 fps
GeForce RTX 3050 6GB Laptop GPU:
80.8 fps
GeForce RTX 3050 6GB Laptop GPU:
64.2 fps
GeForce RTX 3050 6GB Laptop GPU:
46.4 fps
GeForce RTX 3050 6GB Laptop GPU:
38.5 fps
GeForce RTX 3050 6GB Laptop GPU:
218 fps
GeForce RTX 3050 6GB Laptop GPU:
127.4 fps
GeForce RTX 3050 6GB Laptop GPU:
104.8 fps
GeForce RTX 3050 6GB Laptop GPU:
61.9 fps
GeForce RTX 3050 6GB Laptop GPU:
40 fps
HD Graphics (Haswell):
0 (!) [X] MSI CX61 2QC 2970M MS-16GD Intel Celeron 2970M 2.2GHz
HD Graphics (Haswell)
fps
HD Graphics (Haswell):
4.9 (!) [X] MSI CX61 2QC 2970M MS-16GD Intel Celeron 2970M 2.2GHz
HD Graphics (Haswell)
min:
1 fps, max:
7 fps
fps
GeForce RTX 3050 6GB Laptop GPU:
210 256 ~ 233 fps
GeForce RTX 3050 6GB Laptop GPU:
96.5 112.8 ~ 105 fps
GeForce RTX 3050 6GB Laptop GPU:
80.9 91.9 ~ 86 fps
GeForce RTX 3050 6GB Laptop GPU:
70.7 80.5 ~ 76 fps
GeForce RTX 3050 6GB Laptop GPU:
57.1 fps
GeForce RTX 3050 6GB Laptop GPU:
132 fps
GeForce RTX 3050 6GB Laptop GPU:
76 89 ~ 83 fps
GeForce RTX 3050 6GB Laptop GPU:
70 82 ~ 76 fps
GeForce RTX 3050 6GB Laptop GPU:
65 76 ~ 71 fps
GeForce RTX 3050 6GB Laptop GPU:
52 fps
HD Graphics (Haswell):
14.3 [X] MSI CX61 2QC 2970M MS-16GD Intel Celeron 2970M 2.2GHz
HD Graphics (Haswell)
fps
GeForce RTX 3050 6GB Laptop GPU:
76 116.2 117 ~ 103 fps
HD Graphics (Haswell):
8 [X] MSI CX61 2QC 2970M MS-16GD Intel Celeron 2970M 2.2GHz
HD Graphics (Haswell)
fps
GeForce RTX 3050 6GB Laptop GPU:
44.2 51.2 52 ~ 49 fps
GeForce RTX 3050 6GB Laptop GPU:
32 37.4 ~ 35 fps
HD Graphics (Haswell):
5.9 [X] MSI CX61 2QC 2970M MS-16GD Intel Celeron 2970M 2.2GHz
HD Graphics (Haswell)
min:
5 fps, max:
7 fps
fps
HD Graphics (Haswell):
13 [X] MSI CX61 2QC 2970M MS-16GD Intel Celeron 2970M 2.2GHz
HD Graphics (Haswell)
min:
7 fps, max:
13 fps
fps
HD Graphics (Haswell):
62 [X] MSI CX61 2QC 2970M MS-16GD Intel Celeron 2970M 2.2GHz
HD Graphics (Haswell)
min:
54 fps
fps
HD Graphics (Haswell):
28.6 [X] MSI CX61 2QC 2970M MS-16GD Intel Celeron 2970M 2.2GHz
HD Graphics (Haswell)
min:
19 fps
fps
HD Graphics (Haswell):
16.4 [X] MSI CX61 2QC 2970M MS-16GD Intel Celeron 2970M 2.2GHz
HD Graphics (Haswell)
min:
14 fps, max:
19 fps
fps
HD Graphics (Haswell):
45.1 [X] MSI CX61 2QC 2970M MS-16GD Intel Celeron 2970M 2.2GHz
HD Graphics (Haswell)
min:
37 fps, max:
54 fps
fps
HD Graphics (Haswell):
15.9 [X] MSI CX61 2QC 2970M MS-16GD Intel Celeron 2970M 2.2GHz
HD Graphics (Haswell)
min:
13 fps, max:
19 fps
fps
HD Graphics (Haswell):
0 (!) [X] MSI CX61 2QC 2970M MS-16GD Intel Celeron 2970M 2.2GHz
HD Graphics (Haswell)
fps
HD Graphics (Haswell):
17.8 [X] MSI CX61 2QC 2970M MS-16GD Intel Celeron 2970M 2.2GHz
HD Graphics (Haswell)
min:
15 fps, max:
21 fps
fps
HD Graphics (Haswell):
38.6 [X] MSI CX61 2QC 2970M MS-16GD Intel Celeron 2970M 2.2GHz
HD Graphics (Haswell)
min:
35 fps, max:
52 fps
fps
HD Graphics (Haswell):
21.6 [X] MSI CX61 2QC 2970M MS-16GD Intel Celeron 2970M 2.2GHz
HD Graphics (Haswell)
min:
19 fps, max:
28 fps
fps
HD Graphics (Haswell):
6.3 [X] MSI CX61 2QC 2970M MS-16GD Intel Celeron 2970M 2.2GHz
HD Graphics (Haswell)
min:
5 fps, max:
8 fps
fps
HD Graphics (Haswell):
14.1 [X] MSI CX61 2QC 2970M MS-16GD Intel Celeron 2970M 2.2GHz
HD Graphics (Haswell)
min:
12 fps, max:
15 fps
fps
HD Graphics (Haswell):
12.4 [X] MSI CX61 2QC 2970M MS-16GD Intel Celeron 2970M 2.2GHz
HD Graphics (Haswell)
min:
11 fps, max:
14 fps
fps
HD Graphics (Haswell):
7.1 [X] MSI CX61 2QC 2970M MS-16GD Intel Celeron 2970M 2.2GHz
HD Graphics (Haswell)
min:
6 fps, max:
8 fps
fps
HD Graphics (Haswell):
26.1 [X] MSI CX61 2QC 2970M MS-16GD Intel Celeron 2970M 2.2GHz
HD Graphics (Haswell)
min:
19 fps, max:
33 fps
fps
HD Graphics (Haswell):
16.3 [X] MSI CX61 2QC 2970M MS-16GD Intel Celeron 2970M 2.2GHz
HD Graphics (Haswell)
min:
12 fps, max:
21 fps
fps
HD Graphics (Haswell):
0 (!) [X] MSI CX61 2QC 2970M MS-16GD Intel Celeron 2970M 2.2GHz
HD Graphics (Haswell)
fps
HD Graphics (Haswell):
6 [X] MSI CX61 2QC 2970M MS-16GD Intel Celeron 2970M 2.2GHz
HD Graphics (Haswell)
min:
3 fps, max:
9 fps
fps
HD Graphics (Haswell):
8.5 [X] MSI CX61 2QC 2970M MS-16GD Intel Celeron 2970M 2.2GHz
HD Graphics (Haswell)
min:
6 fps, max:
11 fps
fps
HD Graphics (Haswell):
9 [X] MSI CX61 2QC 2970M MS-16GD Intel Celeron 2970M 2.2GHz
HD Graphics (Haswell)
min:
8 fps, max:
11 fps
fps
HD Graphics (Haswell):
9.4 [X] MSI CX61 2QC 2970M MS-16GD Intel Celeron 2970M 2.2GHz
HD Graphics (Haswell)
min:
8 fps, max:
11 fps
fps
HD Graphics (Haswell):
5.3 [X] MSI CX61 2QC 2970M MS-16GD Intel Celeron 2970M 2.2GHz
HD Graphics (Haswell)
fps
HD Graphics (Haswell):
2.5 [X] MSI CX61 2QC 2970M MS-16GD Intel Celeron 2970M 2.2GHz
HD Graphics (Haswell)
fps
HD Graphics (Haswell):
1.8 [X] MSI CX61 2QC 2970M MS-16GD Intel Celeron 2970M 2.2GHz
HD Graphics (Haswell)
fps
HD Graphics (Haswell):
13.7 [X] MSI CX61 2QC 2970M MS-16GD Intel Celeron 2970M 2.2GHz
HD Graphics (Haswell)
min:
5 fps, max:
75 fps
fps
HD Graphics (Haswell):
8.9 [X] MSI CX61 2QC 2970M MS-16GD Intel Celeron 2970M 2.2GHz
HD Graphics (Haswell)
min:
4 fps, max:
65 fps
fps
HD Graphics (Haswell):
11.7 [X] MSI CX61 2QC 2970M MS-16GD Intel Celeron 2970M 2.2GHz
HD Graphics (Haswell)
min:
10 fps, max:
14 fps
fps
HD Graphics (Haswell):
0 (!) [X] MSI CX61 2QC 2970M MS-16GD Intel Celeron 2970M 2.2GHz
HD Graphics (Haswell)
fps
HD Graphics (Haswell):
41.4 [X] MSI CX61 2QC 2970M MS-16GD Intel Celeron 2970M 2.2GHz
HD Graphics (Haswell)
min:
21 fps, max:
51 fps
fps
HD Graphics (Haswell):
24.1 [X] MSI CX61 2QC 2970M MS-16GD Intel Celeron 2970M 2.2GHz
HD Graphics (Haswell)
min:
11 fps, max:
35 fps
fps
HD Graphics (Haswell):
11.4 [X] MSI CX61 2QC 2970M MS-16GD Intel Celeron 2970M 2.2GHz
HD Graphics (Haswell)
min:
5 fps, max:
18 fps
fps
GeForce RTX 3050 6GB Laptop GPU:
98 99.5 116.9 ~ 105 fps
GeForce RTX 3050 6GB Laptop GPU:
187 236 244 ~ 222 fps
HD Graphics (Haswell):
8.9 [X] MSI CX61 2QC 2970M MS-16GD Intel Celeron 2970M 2.2GHz
HD Graphics (Haswell)
min:
5 fps, max:
12 fps
fps
GeForce RTX 3050 6GB Laptop GPU:
118 159.1 ~ 139 fps
HD Graphics (Haswell):
5.2 [X] MSI CX61 2QC 2970M MS-16GD Intel Celeron 2970M 2.2GHz
HD Graphics (Haswell)
min:
3 fps, max:
8 fps
5.8 ~ 6 fps
GeForce RTX 3050 6GB Laptop GPU:
71 91.4 96.5 ~ 86 fps
HD Graphics (Haswell):
3.1 fps
GeForce RTX 3050 6GB Laptop GPU:
37 fps
HD Graphics (Haswell):
52.4 fps
HD Graphics (Haswell):
12.8 fps
GeForce RTX 3050 6GB Laptop GPU:
172 172.6 ~ 172 fps
GeForce RTX 3050 6GB Laptop GPU:
53 62.7 63.8 ~ 60 fps
GeForce RTX 3050 6GB Laptop GPU:
36.5 42.7 ~ 40 fps
HD Graphics (Haswell):
15.9 fps
HD Graphics (Haswell):
11.2 fps
HD Graphics (Haswell):
7.7 fps
HD Graphics (Haswell):
5.7 fps
HD Graphics (Haswell):
9.7 fps
HD Graphics (Haswell):
8.4 fps
HD Graphics (Haswell):
10.9 fps
HD Graphics (Haswell):
7 fps
HD Graphics (Haswell):
31 fps
HD Graphics (Haswell):
20 fps
HD Graphics (Haswell):
9 fps
HD Graphics (Haswell):
5.8 fps
HD Graphics (Haswell):
21.6 fps
HD Graphics (Haswell):
12.9 fps
HD Graphics (Haswell):
13.5 fps
HD Graphics (Haswell):
8.3 fps
HD Graphics (Haswell):
16.4 fps
HD Graphics (Haswell):
11.3 fps
HD Graphics (Haswell):
123.6 fps
HD Graphics (Haswell):
26.2 fps
HD Graphics (Haswell):
13.3 fps
HD Graphics (Haswell):
9.7 fps
HD Graphics (Haswell):
58.2 fps
HD Graphics (Haswell):
19.6 fps
HD Graphics (Haswell):
2.2 fps
HD Graphics (Haswell):
19.9 fps
HD Graphics (Haswell):
14 fps
HD Graphics (Haswell):
35.2 fps
HD Graphics (Haswell):
13.6 fps
HD Graphics (Haswell):
9 fps
HD Graphics (Haswell):
23.1 fps
HD Graphics (Haswell):
13.7 fps
HD Graphics (Haswell):
10.1 fps
HD Graphics (Haswell):
5.7 fps
HD Graphics (Haswell):
22.1 fps
HD Graphics (Haswell):
13 fps
HD Graphics (Haswell):
11.1 fps
HD Graphics (Haswell):
12.8 27.8 [X] MSI CX61 2QC 2970M MS-16GD Intel Celeron 2970M 2.2GHz
HD Graphics (Haswell)
~ 20 fps
HD Graphics (Haswell):
10 18.2 [X] MSI CX61 2QC 2970M MS-16GD Intel Celeron 2970M 2.2GHz
HD Graphics (Haswell)
~ 14 fps
HD Graphics (Haswell):
11.8 [X] MSI CX61 2QC 2970M MS-16GD Intel Celeron 2970M 2.2GHz
HD Graphics (Haswell)
fps
HD Graphics (Haswell):
3.9 [X] MSI CX61 2QC 2970M MS-16GD Intel Celeron 2970M 2.2GHz
HD Graphics (Haswell)
fps
HD Graphics (Haswell):
21 fps
HD Graphics (Haswell):
12 fps
HD Graphics (Haswell):
27 fps
HD Graphics (Haswell):
18 fps
HD Graphics (Haswell):
14 fps
HD Graphics (Haswell):
57.7 fps
HD Graphics (Haswell):
37 fps
HD Graphics (Haswell):
22.4 fps
HD Graphics (Haswell):
16.9 fps
HD Graphics (Haswell):
14 fps
HD Graphics (Haswell):
7.8 fps
HD Graphics (Haswell):
15.9 fps
HD Graphics (Haswell):
8.9 fps
HD Graphics (Haswell):
14.2 fps
HD Graphics (Haswell):
11.5 fps
HD Graphics (Haswell):
36.9 fps
HD Graphics (Haswell):
24.2 fps
HD Graphics (Haswell):
7.2 fps
HD Graphics (Haswell):
38 38.5 ~ 38 fps
HD Graphics (Haswell):
18.6 19.6 ~ 19 fps
HD Graphics (Haswell):
13.2 fps
HD Graphics (Haswell):
11.2 fps
HD Graphics (Haswell):
23 32.8 [X] MSI CX61 2QC 2970M MS-16GD Intel Celeron 2970M 2.2GHz
HD Graphics (Haswell)
~ 28 fps
HD Graphics (Haswell):
10.3 14.2 [X] MSI CX61 2QC 2970M MS-16GD Intel Celeron 2970M 2.2GHz
HD Graphics (Haswell)
~ 12 fps
HD Graphics (Haswell):
11.9 [X] MSI CX61 2QC 2970M MS-16GD Intel Celeron 2970M 2.2GHz
HD Graphics (Haswell)
fps
HD Graphics (Haswell):
3.7 [X] MSI CX61 2QC 2970M MS-16GD Intel Celeron 2970M 2.2GHz
HD Graphics (Haswell)
fps
HD Graphics (Haswell):
96.5 fps
HD Graphics (Haswell):
28.3 fps
HD Graphics (Haswell):
15 fps
HD Graphics (Haswell):
59.6 fps
HD Graphics (Haswell):
11.2 fps
HD Graphics (Haswell):
12.2 fps
HD Graphics (Haswell):
7.6 fps
HD Graphics (Haswell):
38.7 fps
HD Graphics (Haswell):
17.7 fps
HD Graphics (Haswell):
13.1 fps
HD Graphics (Haswell):
18.7 fps
HD Graphics (Haswell):
11.4 fps
HD Graphics (Haswell):
12.3 fps
HD Graphics (Haswell):
9.9 fps
HD Graphics (Haswell):
25.6 fps
HD Graphics (Haswell):
17.6 fps
HD Graphics (Haswell):
22.3 fps
HD Graphics (Haswell):
16.8 fps
HD Graphics (Haswell):
46.2 fps
HD Graphics (Haswell):
34.7 fps
HD Graphics (Haswell):
22.5 fps
HD Graphics (Haswell):
31 fps
HD Graphics (Haswell):
18.8 fps
HD Graphics (Haswell):
11.7 fps
HD Graphics (Haswell):
36.9 fps
HD Graphics (Haswell):
23 fps
HD Graphics (Haswell):
19.5 fps
HD Graphics (Haswell):
12.5 fps
HD Graphics (Haswell):
36 fps
HD Graphics (Haswell):
16 fps
HD Graphics (Haswell):
9.8 fps
HD Graphics (Haswell):
21.7 22.2 ~ 22 fps
HD Graphics (Haswell):
11.2 11.3 ~ 11 fps
HD Graphics (Haswell):
6.8 fps
HD Graphics (Haswell):
36.8 fps
HD Graphics (Haswell):
16.7 fps
HD Graphics (Haswell):
51.9 fps
HD Graphics (Haswell):
27.4 fps
HD Graphics (Haswell):
14.8 fps
HD Graphics (Haswell):
49.2 fps
HD Graphics (Haswell):
28 fps
HD Graphics (Haswell):
21.2 fps
HD Graphics (Haswell):
42.6 fps
HD Graphics (Haswell):
17.8 fps
HD Graphics (Haswell):
113 fps
HD Graphics (Haswell):
45.1 fps
HD Graphics (Haswell):
93.7 fps
HD Graphics (Haswell):
39.2 fps
NVIDIA GeForce RTX 3050 6GB Laptop GPU low med. high ultra QHD 4K Avatar Frontiers of Pandora 39.5 36.3 31.5 23.4 15.1 Assassin's Creed Mirage 70 63 55 41 31 Cyberpunk 2077 2.1 Phantom Liberty 61 48 40 34 21.3 F1 23 132 125 92 23 12 Returnal 40 38 34 29 F1 22 142 134 102 33 19 Tiny Tina's Wonderlands 113.3 89.7 59.2 46.4 Cyberpunk 2077 1.6 80.8 64.2 46.4 38.5 F1 2021 218 127.4 104.8 61.9 40 Strange Brigade 233 105 86 76 57.1 Far Cry 5 132 83 76 71 52 X-Plane 11.11 124 103 85 Final Fantasy XV Benchmark 123 67 49 35 Dota 2 Reborn 142 127 114 105 The Witcher 3 222 139 86 49 37 GTA V 173 172 113 60 40 < 30 fps < 60 fps < 120 fps ≥ 120 fps 2 4 10 3 7 6 7 9 3 6 5 4 7
For more games that might be playable and a list of all games and graphics cards visit our Gaming List
v1.28
log 04. 06:11:14
#0 checking url part for id 6452 +0s ... 0s
#1 checking url part for id 11576 +0s ... 0s
#2 checking url part for id 4622 +0s ... 0s
#3 redirected to Ajax server, took 1720066273 +0s ... 0s
#4 did not recreate cache, as it is less than 5 days old! Created at Thu, 04 Jul 2024 05:15:44 +0200 +0s ... 0s
#5 composed specs +0.004s ... 0.004s
#6 did output specs +0s ... 0.004s
#7 start showIntegratedCPUs +0s ... 0.004s
#8 getting avg benchmarks for device 6452 +0.01s ... 0.015s
#9 got single benchmarks 6452 +0s ... 0.015s
#10 getting avg benchmarks for device 11576 +0.001s ... 0.016s
#11 got single benchmarks 11576 +0.001s ... 0.017s
#12 getting avg benchmarks for device 4622 +0.004s ... 0.021s
#13 got single benchmarks 4622 +0.013s ... 0.034s
#14 got avg benchmarks for devices +0s ... 0.034s
#15 min, max, avg, median took s +0.02s ... 0.054s
#16 before gaming benchmark output +0s ... 0.054s
#17 Got 313 rows for game benchmarks. +0.014s ... 0.068s
#18 composed SQL query for gamebenchmarks +0s ... 0.068s
#19 got data and put it in $dataArray +0.004s ... 0.072s
#20 benchmarks composed for output. +0.031s ... 0.103s
#21 calculated avg scores. +0s ... 0.103s
#22 return log +0.001s ... 0.104s
Please share our article, every link counts!
Redaktion, 2017-09- 8 (Update: 2023-07- 1)
 Deutsch
 English
 Español
 Français
 Italiano
 Nederlands
 Polski
 Português
 Русский
 Türkçe
 Svenska
 Chinese
 Magyar