Intel HD Graphics (Cherry Trail) vs NVIDIA GeForce GTX 1070 Ti (Desktop) vs Intel HD Graphics 405 (Braswell)
Intel HD Graphics (Cherry Trail) ► remove from comparison
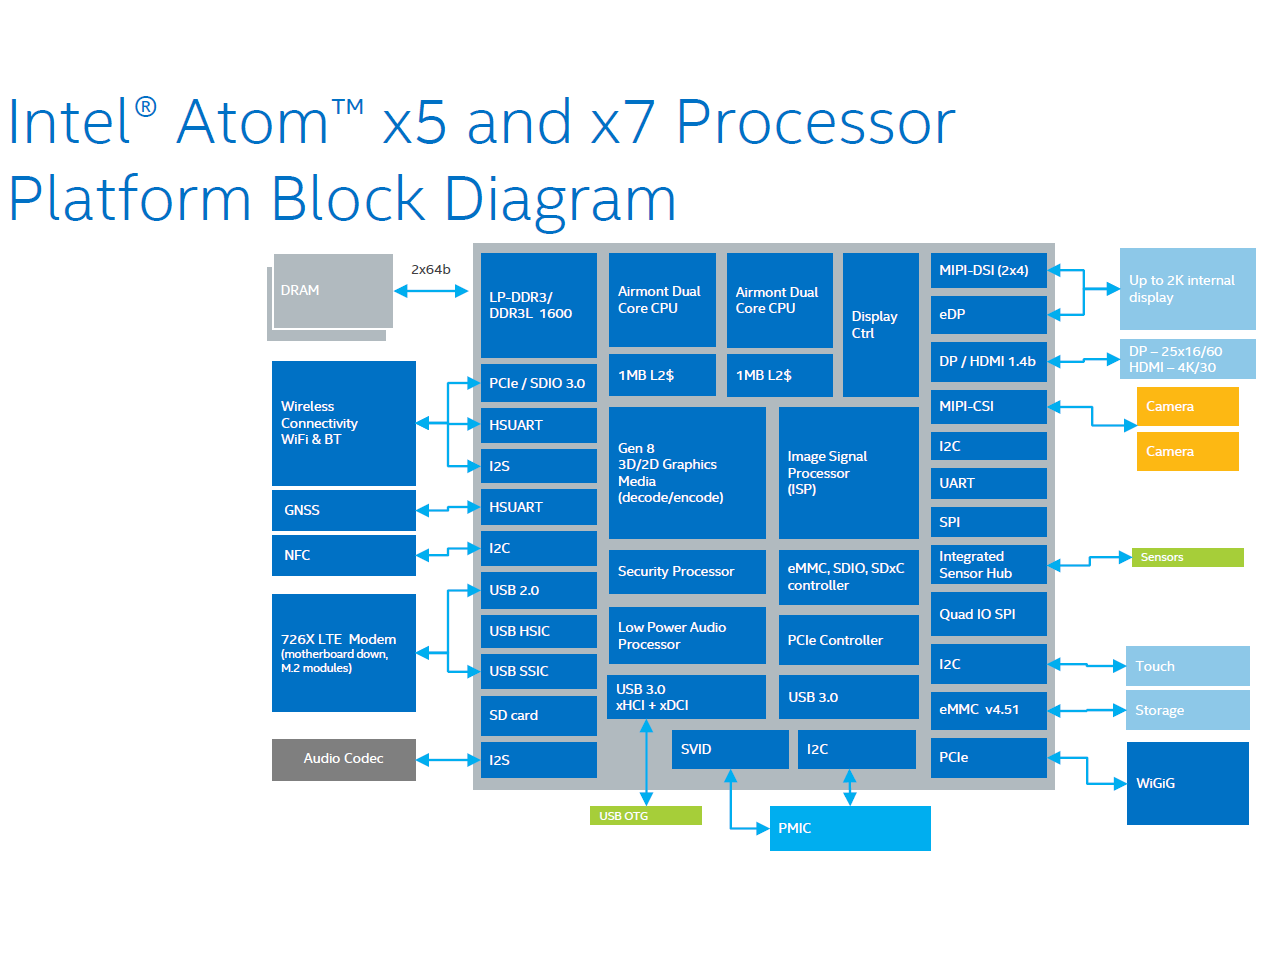
The Intel HD Graphics (Cherry Trail) is an integrated graphics card in the Cherry-Trail SoCs (e.g. Atom x7-Z8700). Based on a Broadwell GPU (Intel Gen8) and supports DirectX 11.2. Depending on the SoC offers 12 or 16 EUs.
Atom x7-Z8700: 16 EUs @ 200 - 600 MHz, dual-channel memory
In Windows, gaming is limited to less demanding or quite old games. Using Android, even high end 3D games should run fluently. For example Team Fortress 2 was running on the Surface 3 (x7-Z8700) only in lowest settings and 1280x720 fluently (11 - 69 fps range).
The integrated video decoder is able to display even 4K videos (H.264 tested) fluently.
The Intel HD Graphics GPU in our review sample of the MS Surface 3 (Atom x7-Z8700) only supported DisplayPort 1.1 as it seems, as 4K (3840x2160) with 30 Hz was the maximum Refresh Rate we could achieve (no 60 Hz selectable with the pre-installed drivers).
NVIDIA GeForce GTX 1070 Ti (Desktop) ► remove from comparison
The Nvidia GeForce GTX 1070 Ti is the second fastest Pascal based graphics card in November 2017. It is a high-end desktop graphics card based on a cut down GP104 chip as the GTX 1080 and manufactured in 16 nm FinFET at TSMC. Compared to the GTX 1080, it uses the more available GDDR5 graphics memory, and compared to the GTX 1070 it offers more shaders (2432 versus 1920). More details on the Pascal architecture including all features and comparisons to Maxwell, can be found here .
The performance of the GTX 1070 Ti was in our tests right between the GTX 1070 and GTX 1080. However, the powerefficiency was worse than the GTX 1070 and near the GTX 1080. Nvidia also specifies the 1070 Ti and 1080 at 180W.
Intel HD Graphics 405 (Braswell) ► remove from comparison
The Intel HD Graphics 405 (Braswell) is an integrated graphics card in the low end SoCs of the Braswell series (e.g. Pentium N3710 ). It is based on the same architecture as the integrated GPU of the Broadwell graphics cards (e.g. HD Graphics 5300 ), but offers less shader cores and slower clock speeds.
The GPU was simply called Intel HD Graphics (Broadwell) before 2016 and included also the slower 12 EUs version in the Celeron model. The Graphics 405 name currently only stands for 16-core-versions in Pentium models. The 12 EU version is now called Intel HD Graphics 400.
The clock speed and memory configuration can still vary from model to model.
Gaming performance ist still only suited for older or less demanding games. Often also the processor is limited gaming performance (e.g. in the dual-core N3000).
The SoC also integrates a video decoding engine that should be able to handle 4K H.265 videos.
Intel HD Graphics (Cherry Trail) NVIDIA GeForce GTX 1070 Ti (Desktop) Intel HD Graphics 405 (Braswell) HD Graphics Series Codename Cherry Trail Pascal GP104 Braswell Architecture Gen. 8 Pascal Gen. 8 Pipelines 16 - unified 2432 - unified 16 - unified Core Speed 200 - 600 (Boost) MHz 1607 - 1683 (Boost) MHz 320 - 700 (Boost) MHz Memory Bus Width 64/128 Bit 256 Bit 64/128 Bit Shared Memory yes no yes API DirectX 12 (FL 11_1), Shader 5.0, OpenGL 4.3 DirectX 12_1, OpenGL 4.5 DirectX 11.2, Shader 5.0 technology 14 nm 16 nm 14 nm Date of Announcement 02.03.2015 02.11.2017 01.04.2016 Memory Speed 8000 MHz Memory Type GDDR5 Max. Amount of Memory 8 GB Power Consumption 180 Watt Transistors 7.2 Billion Features Multi-Projection, VR Ready, G-SYNC, Vulkan, Multi Monitor Link to Manufacturer Page www.nvidia.at
Benchmarks Performance Rating - 3DMark 11 + Fire Strike + Time Spy - HD Graphics (Cherry Trail)
0.1 pt (0%)
Intel HD Graphics (Cherry Trail)
...
max:
Performance Rating - 3DMark 11 + Fire Strike + Time Spy - HD Graphics 405 (Braswell)
0.1 pt (0%)
Intel HD Graphics 405 (Braswell)
...
max:
3DMark - 3DMark Time Spy Score
6177 Points (18%)
3DMark - 3DMark Time Spy Graphics
6531 Points (17%)
3DMark - 3DMark Ice Storm Unlimited Graphics
min: 18563 avg: 20873 median: 19303 (2%) max: 27537 Points
442105 Points (50%)
min: 19812 avg: 23763 median: 23763 (3%) max: 27714 Points
3DMark - 3DMark Ice Storm Extreme Graphics
min: 12601 avg: 14069 median: 14068.5 (2%) max: 15536 Points
3DMark - 3DMark Cloud Gate Score
min: 769 avg: 1454 median: 1488 (2%) max: 1905 Points
29364 Points (31%)
min: 1743 avg: 2000 median: 1933 (2%) max: 2392 Points
3DMark - 3DMark Cloud Gate Graphics
min: 1537 avg: 1851 median: 1783.5 (0%) max: 2272 Points
88161 Points (23%)
min: 1767 avg: 2206 median: 2113 (1%) max: 2831 Points
3DMark - 3DMark Fire Strike Standard Score
min: 174 avg: 390.4 median: 248 (0%) max: 1059 Points
15061 Points (27%)
min: 216 avg: 237.5 median: 237.5 (0%) max: 259 Points
3DMark - 3DMark Fire Strike Standard Graphics
min: 193 avg: 233 median: 225 (0%) max: 281 Points
18405 Points (21%)
min: 231 avg: 254.5 median: 254.5 (0%) max: 278 Points
3DMark - 3DMark Ice Storm Graphics
min: 7544 avg: 16078 median: 17063.5 (2%) max: 23395 Points
min: 26056 avg: 28119 median: 28119 (3%) max: 30182 Points
3DMark - 3DMark Sling Shot (ES 3.0) Unlimited
min: 1445 avg: 1525 median: 1525 (7%) max: 1605 Points
3DMark - 3DMark Sling Shot (ES 3.0) Unlimited Graphics
min: 1598 avg: 1684 median: 1684 (4%) max: 1770 Points
3DMark - 3DMark Sling Shot Extreme (ES 3.1) Unlimited
min: 1072 avg: 1215 median: 1159 (6%) max: 1414 Points
3DMark - 3DMark Sling Shot Extreme (ES 3.1) Unlimited Graphics
min: 1058 avg: 1251 median: 1142 (3%) max: 1554 Points
3DMark 11 - 3DM11 Performance Score
min: 314 avg: 359.4 median: 343 (0%) max: 562 Points
20106 Points (28%)
min: 451 avg: 523 median: 537 (1%) max: 565 Points
3DMark 11 - 3DM11 Performance GPU
min: 278 avg: 319.9 median: 298 (0%) max: 494 Points
27503 Points (24%)
min: 408 avg: 469.1 median: 473 (0%) max: 496 Points
3DMark Vantage + Intel HD Graphics 405 (Braswell) 3DMark Vantage - 3DM Vant. Perf. total
2081 Points (1%)
3DM Vant. Perf. GPU no PhysX + Intel HD Graphics 405 (Braswell) 3DMark Vantage - 3DM Vant. Perf. GPU no PhysX
1730 Points (1%)
3DMark 06 3DMark 06 - Standard 1280x1024 + Intel HD Graphics (Cherry Trail)
min: 2403 avg: 2833 median: 2595 (3%) max: 3330 Points
3DMark 06 - Standard 1280x1024 + NVIDIA GeForce GTX 1070 Ti (Desktop)
36475 Points (48%)
3DMark 06 - Standard 1280x1024 + Intel HD Graphics 405 (Braswell)
min: 2274 avg: 2920 median: 2920 (4%) max: 3566 Points
3DMark 06 - Standard 1024x768 + Intel HD Graphics (Cherry Trail)
2877 Points (4%)
Unigine Valley 1.0 - Unigine Valley 1.0 DX
1.2 fps (0%)
Unigine Heaven 2.1 - Heaven 2.1 high
5.7 fps (1%)
7.4 fps (1%)
Cinebench R10 Cinebench R10 Shading (32bit) + Intel HD Graphics (Cherry Trail) Cinebench R10 - Cinebench R10 Shading (32bit)
min: 1192 avg: 2009 median: 1973 (1%) max: 2551 Points
Cinebench R10 Shading (32bit) + Intel HD Graphics 405 (Braswell)
min: 2412 avg: 2685 median: 2753 (2%) max: 2822 Points
Cinebench R11.5 Cinebench R11.5 OpenGL 64 Bit + Intel HD Graphics (Cherry Trail) Cinebench R11.5 - Cinebench R11.5 OpenGL 64 Bit
min: 4.01 avg: 8.8 median: 8.4 (3%) max: 11.71 fps
Cinebench R11.5 OpenGL 64 Bit + Intel HD Graphics 405 (Braswell)
min: 10.24 avg: 11.7 median: 11.7 (4%) max: 13.06 fps
Cinebench R15 + Intel HD Graphics (Cherry Trail) Cinebench R15 - Cinebench R15 OpenGL 64 Bit
min: 6.64 avg: 10.3 median: 9.7 (1%) max: 15.52 fps
Cinebench R15 OpenGL 64 Bit + Intel HD Graphics 405 (Braswell)
min: 10.3 avg: 13.8 median: 14.1 (1%) max: 15.74 fps
Cinebench R15 OpenGL Ref. Match 64 Bit + Intel HD Graphics (Cherry Trail) Cinebench R15 - Cinebench R15 OpenGL Ref. Match 64 Bit
min: 98 avg: 98 median: 98 (98%) max: 98.6 %
Cinebench R15 OpenGL Ref. Match 64 Bit + Intel HD Graphics 405 (Braswell)
min: 9 avg: 83.2 median: 98 (98%) max: 98 %
GFXBench - GFXBench Car Chase Offscreen
min: 6.3 avg: 7.3 median: 7 (1%) max: 9 fps
9.9 fps (1%)
GFXBench 3.1 - GFXBench Manhattan ES 3.1 Offscreen
min: 9.2 avg: 10.8 median: 11 (0%) max: 13 fps
20.3 fps (0%)
GFXBench 3.0 - GFXBench 3.0 Manhattan Offscreen
min: 8.4 avg: 13.8 median: 13.5 (1%) max: 18 fps
20.3 fps (1%)
GFXBench (DX / GLBenchmark) 2.7 + Intel HD Graphics (Cherry Trail) GFXBench (DX / GLBenchmark) 2.7 - GFXBench T-Rex HD Offscreen C24Z16
min: 22 avg: 30.5 median: 32 (0%) max: 38.5 fps
GFXBench T-Rex HD Offscreen C24Z16 + Intel HD Graphics 405 (Braswell) 41.3 fps (0%)
LuxMark v2.0 64Bit - LuxMark v2.0 Room GPU
min: 48 avg: 58.7 median: 59 (0%) max: 69 Samples/s
2542 Samples/s (11%)
min: 56 avg: 68 median: 68 (0%) max: 80 Samples/s
LuxMark v2.0 64Bit - LuxMark v2.0 Sala GPU
min: 69 avg: 87.7 median: 89 (0%) max: 105 Samples/s
5159 Samples/s (9%)
min: 81 avg: 102.5 median: 102.5 (0%) max: 124 Samples/s
ComputeMark v2.1 - ComputeMark v2.1 Result
277 Points (0%)
15488 Points (17%)
min: 388 avg: 390.5 median: 390.5 (0%) max: 393 Points
Power Consumption - Furmark Stress Test Power Consumption - external Monitor *
291 Watt (41%)
9.8 Watt (1%)
Power Consumption - The Witcher 3 Power Consumption - external Monitor *
290 Watt (41%)
Power Consumption - Witcher 3 ultra Power Efficiency - external Monitor
0.2 fps per Watt (21%)
Clock Speed - GPU Clock Witcher 3 ultra
1810 MHz (71%)
Clock Speed - GPU Clock Speed Furmark
1677 MHz (66%)
Average Benchmarks Intel HD Graphics (Cherry Trail) → 100% n=11 Average Benchmarks NVIDIA GeForce GTX 1070 Ti (Desktop) → 5059% n=11 Average Benchmarks Intel HD Graphics 405 (Braswell) → 125% n=11
- Range of benchmark values for this graphics card
- Average benchmark values for this graphics card
* Smaller numbers mean a higher performance
1 This benchmark is not used for the average calculation
Game Benchmarks The following benchmarks stem from our benchmarks of review laptops. The performance depends on the used graphics memory, clock rate, processor, system settings, drivers, and operating systems. So the results don't have to be representative for all laptops with this GPU. For detailed information on the benchmark results, click on the fps number.
HD Graphics 405 (Braswell):
17.8 fps
HD Graphics 405 (Braswell):
18 fps
HD Graphics 405 (Braswell):
9.9 fps
GeForce GTX 1070 Ti (Desktop):
200 [X] i7-7740X Asus X299 Prime Intel Core i7-7740X 4.3GHz
GeForce GTX 1070 Ti (Desktop)
min:
173 fps, max:
219 fps
fps
GeForce GTX 1070 Ti (Desktop):
78 [X] i7-7740X Asus X299 Prime Intel Core i7-7740X 4.3GHz
GeForce GTX 1070 Ti (Desktop)
min:
68 fps, max:
88 fps
fps
GeForce GTX 1070 Ti (Desktop):
58.5 [X] i7-7740X Asus X299 Prime Intel Core i7-7740X 4.3GHz
GeForce GTX 1070 Ti (Desktop)
min:
50 fps, max:
67 fps
fps
GeForce GTX 1070 Ti (Desktop):
37.1 [X] i7-7740X Asus X299 Prime Intel Core i7-7740X 4.3GHz
GeForce GTX 1070 Ti (Desktop)
min:
31 fps, max:
43 fps
fps
GeForce GTX 1070 Ti (Desktop):
17.9 [X] i7-7740X Asus X299 Prime Intel Core i7-7740X 4.3GHz
GeForce GTX 1070 Ti (Desktop)
min:
15 fps, max:
21 fps
fps
GeForce GTX 1070 Ti (Desktop):
244 [X] i7-7740X Asus X299 Prime Intel Core i7-7740X 4.3GHz
GeForce GTX 1070 Ti (Desktop)
min:
195 fps, max:
269 fps
fps
GeForce GTX 1070 Ti (Desktop):
183 [X] i7-7740X Asus X299 Prime Intel Core i7-7740X 4.3GHz
GeForce GTX 1070 Ti (Desktop)
min:
155 fps, max:
196 fps
fps
GeForce GTX 1070 Ti (Desktop):
164 [X] i7-7740X Asus X299 Prime Intel Core i7-7740X 4.3GHz
GeForce GTX 1070 Ti (Desktop)
min:
145 fps, max:
176 fps
fps
GeForce GTX 1070 Ti (Desktop):
120 [X] i7-7740X Asus X299 Prime Intel Core i7-7740X 4.3GHz
GeForce GTX 1070 Ti (Desktop)
min:
112 fps, max:
129 fps
fps
GeForce GTX 1070 Ti (Desktop):
94 [X] i7-7740X Asus X299 Prime Intel Core i7-7740X 4.3GHz
GeForce GTX 1070 Ti (Desktop)
min:
86 fps, max:
98 fps
fps
GeForce GTX 1070 Ti (Desktop):
57 [X] i7-7740X Asus X299 Prime Intel Core i7-7740X 4.3GHz
GeForce GTX 1070 Ti (Desktop)
min:
52 fps, max:
60 fps
fps
GeForce GTX 1070 Ti (Desktop):
271 [X] i7-7740X Asus X299 Prime Intel Core i7-7740X 4.3GHz
GeForce GTX 1070 Ti (Desktop)
min:
209 fps, max:
313 fps
fps
HD Graphics 405 (Braswell):
23.6 fps
GeForce GTX 1070 Ti (Desktop):
249 [X] i7-7740X Asus X299 Prime Intel Core i7-7740X 4.3GHz
GeForce GTX 1070 Ti (Desktop)
min:
201 fps, max:
284 fps
fps
HD Graphics 405 (Braswell):
18 fps
GeForce GTX 1070 Ti (Desktop):
241 [X] i7-7740X Asus X299 Prime Intel Core i7-7740X 4.3GHz
GeForce GTX 1070 Ti (Desktop)
min:
189 fps, max:
269 fps
fps
HD Graphics 405 (Braswell):
13.9 fps
GeForce GTX 1070 Ti (Desktop):
219 [X] i7-7740X Asus X299 Prime Intel Core i7-7740X 4.3GHz
GeForce GTX 1070 Ti (Desktop)
min:
159 fps, max:
243 fps
fps
GeForce GTX 1070 Ti (Desktop):
222 [X] i7-7740X Asus X299 Prime Intel Core i7-7740X 4.3GHz
GeForce GTX 1070 Ti (Desktop)
min:
176 fps, max:
250 fps
fps
GeForce GTX 1070 Ti (Desktop):
221 [X] i7-7740X Asus X299 Prime Intel Core i7-7740X 4.3GHz
GeForce GTX 1070 Ti (Desktop)
min:
161 fps, max:
247 fps
fps
GeForce GTX 1070 Ti (Desktop):
86.6 [X] i7-7740X Asus X299 Prime Intel Core i7-7740X 4.3GHz
GeForce GTX 1070 Ti (Desktop)
min:
71 fps, max:
102 fps
fps
GeForce GTX 1070 Ti (Desktop):
63.4 [X] i7-7740X Asus X299 Prime Intel Core i7-7740X 4.3GHz
GeForce GTX 1070 Ti (Desktop)
min:
56 fps, max:
76 fps
fps
GeForce GTX 1070 Ti (Desktop):
41.2 [X] i7-7740X Asus X299 Prime Intel Core i7-7740X 4.3GHz
GeForce GTX 1070 Ti (Desktop)
min:
36 fps, max:
47 fps
fps
GeForce GTX 1070 Ti (Desktop):
20.3 [X] i7-7740X Asus X299 Prime Intel Core i7-7740X 4.3GHz
GeForce GTX 1070 Ti (Desktop)
min:
17 fps, max:
22 fps
fps
GeForce GTX 1070 Ti (Desktop):
46 [X] i7-7740X Asus X299 Prime Intel Core i7-7740X 4.3GHz
GeForce GTX 1070 Ti (Desktop)
min:
39 fps, max:
54 fps
fps
GeForce GTX 1070 Ti (Desktop):
40.4 [X] i7-7740X Asus X299 Prime Intel Core i7-7740X 4.3GHz
GeForce GTX 1070 Ti (Desktop)
min:
34 fps, max:
44 fps
fps
GeForce GTX 1070 Ti (Desktop):
24.1 [X] i7-7740X Asus X299 Prime Intel Core i7-7740X 4.3GHz
GeForce GTX 1070 Ti (Desktop)
min:
22 fps, max:
26 fps
fps
GeForce GTX 1070 Ti (Desktop):
121 [X] i7-7740X Asus X299 Prime Intel Core i7-7740X 4.3GHz
GeForce GTX 1070 Ti (Desktop)
min:
93 fps, max:
174 fps
fps
GeForce GTX 1070 Ti (Desktop):
107 [X] i7-7740X Asus X299 Prime Intel Core i7-7740X 4.3GHz
GeForce GTX 1070 Ti (Desktop)
min:
83 fps, max:
140 fps
fps
GeForce GTX 1070 Ti (Desktop):
103 [X] i7-7740X Asus X299 Prime Intel Core i7-7740X 4.3GHz
GeForce GTX 1070 Ti (Desktop)
min:
84 fps, max:
132 fps
fps
GeForce GTX 1070 Ti (Desktop):
93 [X] i7-7740X Asus X299 Prime Intel Core i7-7740X 4.3GHz
GeForce GTX 1070 Ti (Desktop)
min:
72 fps, max:
127 fps
fps
GeForce GTX 1070 Ti (Desktop):
76 [X] i7-7740X Asus X299 Prime Intel Core i7-7740X 4.3GHz
GeForce GTX 1070 Ti (Desktop)
min:
60 fps, max:
95 fps
fps
GeForce GTX 1070 Ti (Desktop):
42 [X] i7-7740X Asus X299 Prime Intel Core i7-7740X 4.3GHz
GeForce GTX 1070 Ti (Desktop)
min:
34 fps, max:
51 fps
fps
GeForce GTX 1070 Ti (Desktop):
147 [X] i7-7740X Asus X299 Prime Intel Core i7-7740X 4.3GHz
GeForce GTX 1070 Ti (Desktop)
min:
77.86 fps, max:
237.53 fps
fps
GeForce GTX 1070 Ti (Desktop):
83 [X] i7-7740X Asus X299 Prime Intel Core i7-7740X 4.3GHz
GeForce GTX 1070 Ti (Desktop)
min:
40.8 fps, max:
146.74 fps
fps
GeForce GTX 1070 Ti (Desktop):
63 [X] i7-7740X Asus X299 Prime Intel Core i7-7740X 4.3GHz
GeForce GTX 1070 Ti (Desktop)
min:
32.59 fps, max:
112.4 fps
fps
GeForce GTX 1070 Ti (Desktop):
52.3 [X] i7-7740X Asus X299 Prime Intel Core i7-7740X 4.3GHz
GeForce GTX 1070 Ti (Desktop)
min:
28.83 fps, max:
88.2 fps
fps
GeForce GTX 1070 Ti (Desktop):
40.2 [X] i7-7740X Asus X299 Prime Intel Core i7-7740X 4.3GHz
GeForce GTX 1070 Ti (Desktop)
min:
24.15 fps, max:
62.69 fps
fps
GeForce GTX 1070 Ti (Desktop):
24.6 [X] i7-7740X Asus X299 Prime Intel Core i7-7740X 4.3GHz
GeForce GTX 1070 Ti (Desktop)
min:
16.12 fps, max:
36.5 fps
fps
GeForce GTX 1070 Ti (Desktop):
144 [X] i7-7740X Asus X299 Prime Intel Core i7-7740X 4.3GHz
GeForce GTX 1070 Ti (Desktop)
min:
143 fps, max:
145 fps
fps
GeForce GTX 1070 Ti (Desktop):
138 [X] i7-7740X Asus X299 Prime Intel Core i7-7740X 4.3GHz
GeForce GTX 1070 Ti (Desktop)
min:
128 fps, max:
145 fps
fps
GeForce GTX 1070 Ti (Desktop):
123 [X] i7-7740X Asus X299 Prime Intel Core i7-7740X 4.3GHz
GeForce GTX 1070 Ti (Desktop)
min:
110 fps, max:
145 fps
fps
GeForce GTX 1070 Ti (Desktop):
121 [X] i7-7740X Asus X299 Prime Intel Core i7-7740X 4.3GHz
GeForce GTX 1070 Ti (Desktop)
min:
109 fps, max:
145 fps
fps
GeForce GTX 1070 Ti (Desktop):
81 [X] i7-7740X Asus X299 Prime Intel Core i7-7740X 4.3GHz
GeForce GTX 1070 Ti (Desktop)
min:
63 fps, max:
100 fps
fps
GeForce GTX 1070 Ti (Desktop):
42.4 [X] i7-7740X Asus X299 Prime Intel Core i7-7740X 4.3GHz
GeForce GTX 1070 Ti (Desktop)
min:
37 fps, max:
52 fps
fps
GeForce GTX 1070 Ti (Desktop):
88 [X] i7-7740X Asus X299 Prime Intel Core i7-7740X 4.3GHz
GeForce GTX 1070 Ti (Desktop)
min:
82 fps, max:
94 fps
fps
GeForce GTX 1070 Ti (Desktop):
64 [X] i7-7740X Asus X299 Prime Intel Core i7-7740X 4.3GHz
GeForce GTX 1070 Ti (Desktop)
min:
58 fps, max:
68 fps
fps
GeForce GTX 1070 Ti (Desktop):
35.3 [X] i7-7740X Asus X299 Prime Intel Core i7-7740X 4.3GHz
GeForce GTX 1070 Ti (Desktop)
min:
32 fps, max:
38 fps
fps
GeForce GTX 1070 Ti (Desktop):
110 [X] i7-7740X Asus X299 Prime Intel Core i7-7740X 4.3GHz
GeForce GTX 1070 Ti (Desktop)
min:
84 fps, max:
125 fps
fps
GeForce GTX 1070 Ti (Desktop):
74 [X] i7-7740X Asus X299 Prime Intel Core i7-7740X 4.3GHz
GeForce GTX 1070 Ti (Desktop)
min:
62 fps, max:
84 fps
fps
GeForce GTX 1070 Ti (Desktop):
35.4 [X] i7-7740X Asus X299 Prime Intel Core i7-7740X 4.3GHz
GeForce GTX 1070 Ti (Desktop)
min:
27 fps, max:
41 fps
fps
GeForce GTX 1070 Ti (Desktop):
111 [X] i7-7740X Asus X299 Prime Intel Core i7-7740X 4.3GHz
GeForce GTX 1070 Ti (Desktop)
min:
90 fps, max:
162 fps
fps
GeForce GTX 1070 Ti (Desktop):
83 [X] i7-7740X Asus X299 Prime Intel Core i7-7740X 4.3GHz
GeForce GTX 1070 Ti (Desktop)
min:
67 fps, max:
124 fps
fps
GeForce GTX 1070 Ti (Desktop):
47.1 [X] i7-7740X Asus X299 Prime Intel Core i7-7740X 4.3GHz
GeForce GTX 1070 Ti (Desktop)
min:
37 fps, max:
72 fps
fps
GeForce GTX 1070 Ti (Desktop):
120 [X] i7-7740X Asus X299 Prime Intel Core i7-7740X 4.3GHz
GeForce GTX 1070 Ti (Desktop)
min:
94 fps, max:
156 fps
fps
GeForce GTX 1070 Ti (Desktop):
80 [X] i7-7740X Asus X299 Prime Intel Core i7-7740X 4.3GHz
GeForce GTX 1070 Ti (Desktop)
min:
61 fps, max:
105 fps
fps
GeForce GTX 1070 Ti (Desktop):
40.1 [X] i7-7740X Asus X299 Prime Intel Core i7-7740X 4.3GHz
GeForce GTX 1070 Ti (Desktop)
min:
28 fps, max:
53 fps
fps
GeForce GTX 1070 Ti (Desktop):
63 [X] i7-7740X Asus X299 Prime Intel Core i7-7740X 4.3GHz
GeForce GTX 1070 Ti (Desktop)
min:
35 fps, max:
124 fps
fps
GeForce GTX 1070 Ti (Desktop):
48 [X] i7-7740X Asus X299 Prime Intel Core i7-7740X 4.3GHz
GeForce GTX 1070 Ti (Desktop)
min:
24 fps, max:
81 fps
fps
GeForce GTX 1070 Ti (Desktop):
27 [X] i7-7740X Asus X299 Prime Intel Core i7-7740X 4.3GHz
GeForce GTX 1070 Ti (Desktop)
min:
13 fps, max:
63 fps
fps
GeForce GTX 1070 Ti (Desktop):
100 [X] i7-7740X Asus X299 Prime Intel Core i7-7740X 4.3GHz
GeForce GTX 1070 Ti (Desktop)
min:
87 fps, max:
129 fps
fps
GeForce GTX 1070 Ti (Desktop):
81 [X] i7-7740X Asus X299 Prime Intel Core i7-7740X 4.3GHz
GeForce GTX 1070 Ti (Desktop)
min:
73 fps, max:
103 fps
fps
GeForce GTX 1070 Ti (Desktop):
55 [X] i7-7740X Asus X299 Prime Intel Core i7-7740X 4.3GHz
GeForce GTX 1070 Ti (Desktop)
min:
49 fps, max:
68 fps
fps
GeForce GTX 1070 Ti (Desktop):
267 [X] i7-7740X Asus X299 Prime Intel Core i7-7740X 4.3GHz
GeForce GTX 1070 Ti (Desktop)
min:
248 fps, max:
287 fps
fps
GeForce GTX 1070 Ti (Desktop):
141 [X] i7-7740X Asus X299 Prime Intel Core i7-7740X 4.3GHz
GeForce GTX 1070 Ti (Desktop)
min:
114 fps, max:
165 fps
fps
GeForce GTX 1070 Ti (Desktop):
84 [X] i7-7740X Asus X299 Prime Intel Core i7-7740X 4.3GHz
GeForce GTX 1070 Ti (Desktop)
min:
67 fps, max:
142 fps
fps
GeForce GTX 1070 Ti (Desktop):
51 [X] i7-7740X Asus X299 Prime Intel Core i7-7740X 4.3GHz
GeForce GTX 1070 Ti (Desktop)
min:
46 fps, max:
87 fps
fps
GeForce GTX 1070 Ti (Desktop):
28 [X] i7-7740X Asus X299 Prime Intel Core i7-7740X 4.3GHz
GeForce GTX 1070 Ti (Desktop)
min:
24 fps, max:
43 fps
fps
GeForce GTX 1070 Ti (Desktop):
97 [X] i7-7740X Asus X299 Prime Intel Core i7-7740X 4.3GHz
GeForce GTX 1070 Ti (Desktop)
min:
85 fps, max:
102 fps
fps
GeForce GTX 1070 Ti (Desktop):
78 [X] i7-7740X Asus X299 Prime Intel Core i7-7740X 4.3GHz
GeForce GTX 1070 Ti (Desktop)
min:
70 fps, max:
82 fps
fps
GeForce GTX 1070 Ti (Desktop):
49 [X] i7-7740X Asus X299 Prime Intel Core i7-7740X 4.3GHz
GeForce GTX 1070 Ti (Desktop)
min:
44 fps, max:
51 fps
fps
GeForce GTX 1070 Ti (Desktop):
78 [X] i7-7740X Asus X299 Prime Intel Core i7-7740X 4.3GHz
GeForce GTX 1070 Ti (Desktop)
min:
64 fps, max:
99 fps
fps
GeForce GTX 1070 Ti (Desktop):
48.5 [X] i7-7740X Asus X299 Prime Intel Core i7-7740X 4.3GHz
GeForce GTX 1070 Ti (Desktop)
min:
41 fps, max:
59 fps
fps
GeForce GTX 1070 Ti (Desktop):
23.8 [X] i7-7740X Asus X299 Prime Intel Core i7-7740X 4.3GHz
GeForce GTX 1070 Ti (Desktop)
min:
21 fps, max:
28 fps
fps
HD Graphics 405 (Braswell):
0 (!) [X] Teclast Tbook 16 Power Intel Atom x7-Z8750 1.6GHz
HD Graphics 405 (Braswell)
fps
GeForce GTX 1070 Ti (Desktop):
135 [X] i7-7740X Asus X299 Prime Intel Core i7-7740X 4.3GHz
GeForce GTX 1070 Ti (Desktop)
min:
111 fps, max:
171 fps
fps
GeForce GTX 1070 Ti (Desktop):
114 [X] i7-7740X Asus X299 Prime Intel Core i7-7740X 4.3GHz
GeForce GTX 1070 Ti (Desktop)
min:
95 fps, max:
132 fps
fps
GeForce GTX 1070 Ti (Desktop):
108 [X] i7-7740X Asus X299 Prime Intel Core i7-7740X 4.3GHz
GeForce GTX 1070 Ti (Desktop)
min:
95 fps, max:
122 fps
fps
GeForce GTX 1070 Ti (Desktop):
102 [X] i7-7740X Asus X299 Prime Intel Core i7-7740X 4.3GHz
GeForce GTX 1070 Ti (Desktop)
min:
79 fps, max:
116 fps
fps
GeForce GTX 1070 Ti (Desktop):
75 [X] i7-7740X Asus X299 Prime Intel Core i7-7740X 4.3GHz
GeForce GTX 1070 Ti (Desktop)
min:
67 fps, max:
85 fps
fps
GeForce GTX 1070 Ti (Desktop):
39 [X] i7-7740X Asus X299 Prime Intel Core i7-7740X 4.3GHz
GeForce GTX 1070 Ti (Desktop)
min:
34 fps, max:
45 fps
fps
HD Graphics 405 (Braswell):
37 fps
HD Graphics 405 (Braswell):
24 fps
HD Graphics 405 (Braswell):
25 fps
HD Graphics 405 (Braswell):
30 fps
HD Graphics 405 (Braswell):
37 fps
GeForce GTX 1070 Ti (Desktop):
101 [X] Intel Core i7-4790K 4GHz
GeForce GTX 1070 Ti (Desktop)
fps
GeForce GTX 1070 Ti (Desktop):
89 [X] Intel Core i7-4790K 4GHz
GeForce GTX 1070 Ti (Desktop)
fps
GeForce GTX 1070 Ti (Desktop):
74.5 [X] Intel Core i7-4790K 4GHz
GeForce GTX 1070 Ti (Desktop)
fps
GeForce GTX 1070 Ti (Desktop):
66.7 [X] Intel Core i7-4790K 4GHz
GeForce GTX 1070 Ti (Desktop)
fps
GeForce GTX 1070 Ti (Desktop):
154 [X] Intel Core i7-4790K 4GHz
GeForce GTX 1070 Ti (Desktop)
min:
101 fps, max:
189 fps
fps
GeForce GTX 1070 Ti (Desktop):
100 [X] Intel Core i7-4790K 4GHz
GeForce GTX 1070 Ti (Desktop)
min:
77 fps, max:
115 fps
fps
GeForce GTX 1070 Ti (Desktop):
82 [X] Intel Core i7-4790K 4GHz
GeForce GTX 1070 Ti (Desktop)
min:
58 fps, max:
97 fps
fps
GeForce GTX 1070 Ti (Desktop):
59.1 [X] Intel Core i7-4790K 4GHz
GeForce GTX 1070 Ti (Desktop)
min:
44 fps, max:
74 fps
fps
GeForce GTX 1070 Ti (Desktop):
42.4 [X] Intel Core i7-4790K 4GHz
GeForce GTX 1070 Ti (Desktop)
min:
33 fps, max:
50 fps
fps
GeForce GTX 1070 Ti (Desktop):
22.7 [X] Intel Core i7-4790K 4GHz
GeForce GTX 1070 Ti (Desktop)
min:
18 fps, max:
27 fps
fps
GeForce GTX 1070 Ti (Desktop):
146 [X] Intel Core i7-4790K 4GHz
GeForce GTX 1070 Ti (Desktop)
min:
93 fps, max:
194 fps
fps
GeForce GTX 1070 Ti (Desktop):
87 [X] Intel Core i7-4790K 4GHz
GeForce GTX 1070 Ti (Desktop)
min:
69 fps, max:
110 fps
fps
GeForce GTX 1070 Ti (Desktop):
63 [X] Intel Core i7-4790K 4GHz
GeForce GTX 1070 Ti (Desktop)
max:
92 fps
fps
GeForce GTX 1070 Ti (Desktop):
27.7 [X] Intel Core i7-4790K 4GHz
GeForce GTX 1070 Ti (Desktop)
max:
42 fps
fps
GeForce GTX 1070 Ti (Desktop):
109 [X] Intel Core i7-4790K 4GHz
GeForce GTX 1070 Ti (Desktop)
min:
78 fps, max:
132 fps
fps
GeForce GTX 1070 Ti (Desktop):
72 [X] Intel Core i7-4790K 4GHz
GeForce GTX 1070 Ti (Desktop)
min:
61 fps, max:
89 fps
fps
GeForce GTX 1070 Ti (Desktop):
36 [X] Intel Core i7-4790K 4GHz
GeForce GTX 1070 Ti (Desktop)
min:
32 fps, max:
39 fps
fps
GeForce GTX 1070 Ti (Desktop):
117 [X] Intel Core i7-4790K 4GHz
GeForce GTX 1070 Ti (Desktop)
min:
106 fps, max:
130 fps
fps
GeForce GTX 1070 Ti (Desktop):
77 [X] Intel Core i7-4790K 4GHz
GeForce GTX 1070 Ti (Desktop)
min:
70 fps, max:
85 fps
fps
GeForce GTX 1070 Ti (Desktop):
38 [X] Intel Core i7-4790K 4GHz
GeForce GTX 1070 Ti (Desktop)
min:
34 fps, max:
44 fps
fps
GeForce GTX 1070 Ti (Desktop):
122 [X] Intel Core i7-4790K 4GHz
GeForce GTX 1070 Ti (Desktop)
min:
86 fps, max:
155 fps
fps
GeForce GTX 1070 Ti (Desktop):
85 [X] Intel Core i7-4790K 4GHz
GeForce GTX 1070 Ti (Desktop)
min:
57 fps, max:
102 fps
fps
GeForce GTX 1070 Ti (Desktop):
45 [X] Intel Core i7-4790K 4GHz
GeForce GTX 1070 Ti (Desktop)
min:
30 fps, max:
52 fps
fps
GeForce GTX 1070 Ti (Desktop):
103 [X] Intel Core i7-4790K 4GHz
GeForce GTX 1070 Ti (Desktop)
min:
60 fps, max:
143 fps
fps
GeForce GTX 1070 Ti (Desktop):
92 [X] Intel Core i7-4790K 4GHz
GeForce GTX 1070 Ti (Desktop)
min:
55 fps, max:
133 fps
fps
GeForce GTX 1070 Ti (Desktop):
88 [X] Intel Core i7-4790K 4GHz
GeForce GTX 1070 Ti (Desktop)
min:
53 fps, max:
126 fps
fps
GeForce GTX 1070 Ti (Desktop):
75 [X] Intel Core i7-4790K 4GHz
GeForce GTX 1070 Ti (Desktop)
min:
30 fps, max:
117 fps
fps
GeForce GTX 1070 Ti (Desktop):
58 [X] Intel Core i7-4790K 4GHz
GeForce GTX 1070 Ti (Desktop)
min:
33 fps, max:
104 fps
fps
GeForce GTX 1070 Ti (Desktop):
34 [X] Intel Core i7-4790K 4GHz
GeForce GTX 1070 Ti (Desktop)
min:
24 fps, max:
51 fps
fps
GeForce GTX 1070 Ti (Desktop):
165 [X] Intel Core i7-4790K 4GHz
GeForce GTX 1070 Ti (Desktop)
min:
76 fps, max:
225 fps
fps
GeForce GTX 1070 Ti (Desktop):
136 [X] Intel Core i7-4790K 4GHz
GeForce GTX 1070 Ti (Desktop)
min:
66 fps, max:
190 fps
fps
GeForce GTX 1070 Ti (Desktop):
109 [X] Intel Core i7-4790K 4GHz
GeForce GTX 1070 Ti (Desktop)
min:
49 fps, max:
169 fps
fps
GeForce GTX 1070 Ti (Desktop):
85 [X] Intel Core i7-4790K 4GHz
GeForce GTX 1070 Ti (Desktop)
min:
43 fps, max:
169 fps
fps
GeForce GTX 1070 Ti (Desktop):
34 [X] Intel Core i7-4790K 4GHz
GeForce GTX 1070 Ti (Desktop)
min:
21 fps, max:
50 fps
fps
GeForce GTX 1070 Ti (Desktop):
47.1 [X] Intel Core i7-4790K 4GHz
GeForce GTX 1070 Ti (Desktop)
min:
44 fps, max:
51 fps
fps
GeForce GTX 1070 Ti (Desktop):
17.3 [X] Intel Core i7-4790K 4GHz
GeForce GTX 1070 Ti (Desktop)
min:
16 fps, max:
18 fps
fps
GeForce GTX 1070 Ti (Desktop):
106 [X] Intel Core i7-4790K 4GHz
GeForce GTX 1070 Ti (Desktop)
min:
95 fps, max:
113 fps
fps
GeForce GTX 1070 Ti (Desktop):
52 [X] Intel Core i7-4790K 4GHz
GeForce GTX 1070 Ti (Desktop)
min:
47 fps, max:
55 fps
fps
100%
HD Graphics (Cherry Trail):
21.4 fps
92%
HD Graphics 405 (Braswell):
19.6 fps
GeForce GTX 1070 Ti (Desktop):
152 [X] Intel Core i7-4790K 4GHz
GeForce GTX 1070 Ti (Desktop)
min:
130 fps
fps
GeForce GTX 1070 Ti (Desktop):
57.9 [X] Intel Core i7-4790K 4GHz
GeForce GTX 1070 Ti (Desktop)
min:
51 fps, max:
69 fps
fps
100%
HD Graphics (Cherry Trail):
15.5 fps
121%
HD Graphics 405 (Braswell):
18.7 fps
GeForce GTX 1070 Ti (Desktop):
223 [X] Intel Core i7-4790K 4GHz
GeForce GTX 1070 Ti (Desktop)
min:
176 fps, max:
252 fps
fps
GeForce GTX 1070 Ti (Desktop):
92 [X] Intel Core i7-4790K 4GHz
GeForce GTX 1070 Ti (Desktop)
min:
76 fps, max:
133 fps
fps
GeForce GTX 1070 Ti (Desktop):
54.2 [X] Intel Core i7-4790K 4GHz
GeForce GTX 1070 Ti (Desktop)
min:
47 fps, max:
62 fps
fps
GeForce GTX 1070 Ti (Desktop):
35.8 [X] Intel Core i7-4790K 4GHz
GeForce GTX 1070 Ti (Desktop)
min:
27 fps, max:
40 fps
fps
GeForce GTX 1070 Ti (Desktop):
156 [X] Intel Core i7-4790K 4GHz
GeForce GTX 1070 Ti (Desktop)
min:
92 fps, max:
189 fps
fps
GeForce GTX 1070 Ti (Desktop):
122 [X] Intel Core i7-4790K 4GHz
GeForce GTX 1070 Ti (Desktop)
min:
75 fps, max:
163 fps
fps
GeForce GTX 1070 Ti (Desktop):
47.9 [X] Intel Core i7-4790K 4GHz
GeForce GTX 1070 Ti (Desktop)
min:
39 fps, max:
60 fps
fps
HD Graphics 405 (Braswell):
13.5 fps
HD Graphics 405 (Braswell):
11 fps
GeForce GTX 1070 Ti (Desktop):
67.8 [X] Intel Core i7-4790K 4GHz
GeForce GTX 1070 Ti (Desktop)
min:
51 fps, max:
97 fps
fps
HD Graphics 405 (Braswell):
14.4 fps
HD Graphics 405 (Braswell):
10.5 fps
100%
HD Graphics (Cherry Trail):
22.6 [X] Chuwi Hi12 Intel Atom x5-Z8300 1.4GHz
HD Graphics (Cherry Trail)
min:
21 fps, max:
27 fps
fps
106%
HD Graphics 405 (Braswell):
17.6 31.3 ~ 24 fps
HD Graphics 405 (Braswell):
21.3 fps
GeForce GTX 1070 Ti (Desktop):
80 [X] Intel Core i7-4790K 4GHz
GeForce GTX 1070 Ti (Desktop)
min:
79 fps, max:
81 fps
fps
HD Graphics 405 (Braswell):
12.2 fps
HD Graphics 405 (Braswell):
5.2 fps
GeForce GTX 1070 Ti (Desktop):
108 [X] Intel Core i7-4790K 4GHz
GeForce GTX 1070 Ti (Desktop)
min:
86 fps, max:
184 fps
fps
GeForce GTX 1070 Ti (Desktop):
91 [X] Intel Core i7-4790K 4GHz
GeForce GTX 1070 Ti (Desktop)
min:
70 fps, max:
133 fps
fps
GeForce GTX 1070 Ti (Desktop):
67.9 [X] DX11
Intel Core i7-4790K 4GHz
GeForce GTX 1070 Ti (Desktop)
min:
53 fps, max:
87 fps
fps
GeForce GTX 1070 Ti (Desktop):
31.9 [X] DX11
Intel Core i7-4790K 4GHz
GeForce GTX 1070 Ti (Desktop)
min:
27 fps, max:
38 fps
fps
HD Graphics 405 (Braswell):
10.5 fps
HD Graphics 405 (Braswell):
6.1 fps
GeForce GTX 1070 Ti (Desktop):
182 [X] Intel Core i7-4790K 4GHz
GeForce GTX 1070 Ti (Desktop)
min:
149 fps, max:
213 fps
fps
GeForce GTX 1070 Ti (Desktop):
88.7 [X] Intel Core i7-4790K 4GHz
GeForce GTX 1070 Ti (Desktop)
min:
77 fps, max:
103 fps
fps
GeForce GTX 1070 Ti (Desktop):
94.6 [X] Intel Core i7-4790K 4GHz
GeForce GTX 1070 Ti (Desktop)
min:
53 fps, max:
133 fps
fps
GeForce GTX 1070 Ti (Desktop):
45.6 [X] Intel Core i7-4790K 4GHz
GeForce GTX 1070 Ti (Desktop)
min:
21 fps, max:
59 fps
fps
GeForce GTX 1070 Ti (Desktop):
98 [X] Intel Core i7-4790K 4GHz
GeForce GTX 1070 Ti (Desktop)
min:
80 fps, max:
113 fps
fps
GeForce GTX 1070 Ti (Desktop):
41 [X] Intel Core i7-4790K 4GHz
GeForce GTX 1070 Ti (Desktop)
min:
39 fps, max:
45 fps
fps
HD Graphics 405 (Braswell):
7.1 fps
HD Graphics 405 (Braswell):
4.2 fps
GeForce GTX 1070 Ti (Desktop):
111 [X] DX11
Intel Core i7-4790K 4GHz
GeForce GTX 1070 Ti (Desktop)
min:
101 fps, max:
119 fps
fps
GeForce GTX 1070 Ti (Desktop):
46.5 [X] DX11
Intel Core i7-4790K 4GHz
GeForce GTX 1070 Ti (Desktop)
min:
41 fps, max:
52 fps
fps
100%
HD Graphics (Cherry Trail):
11.5 fps
133%
HD Graphics 405 (Braswell):
15.3 fps
100%
HD Graphics (Cherry Trail):
7 fps
127%
HD Graphics 405 (Braswell):
8.9 fps
GeForce GTX 1070 Ti (Desktop):
177 [X] Intel Core i7-4790K 4GHz
GeForce GTX 1070 Ti (Desktop)
min:
106 fps, max:
305 fps
fps
GeForce GTX 1070 Ti (Desktop):
77 [X] Intel Core i7-4790K 4GHz
GeForce GTX 1070 Ti (Desktop)
min:
54 fps, max:
113 fps
fps
100%
HD Graphics (Cherry Trail):
8.8 fps
100%
HD Graphics (Cherry Trail):
4.8 fps
100%
HD Graphics (Cherry Trail):
8.1 fps
133%
HD Graphics 405 (Braswell):
10.8 fps
100%
HD Graphics (Cherry Trail):
3.9 fps
177%
HD Graphics 405 (Braswell):
6.9 fps
100%
HD Graphics (Cherry Trail):
13.9 [X] Chuwi Hi12 Intel Atom x5-Z8300 1.4GHz
HD Graphics (Cherry Trail)
min:
7 fps, max:
19 fps
16.8 ~ 15 fps
120%
HD Graphics 405 (Braswell):
15 21.8 ~ 18 fps
HD Graphics 405 (Braswell):
16.2 fps
100%
HD Graphics (Cherry Trail):
15.1 fps
125%
HD Graphics 405 (Braswell):
18.8 fps
100%
HD Graphics (Cherry Trail):
9.8 fps
133%
HD Graphics 405 (Braswell):
13 fps
100%
HD Graphics (Cherry Trail):
20 [X] Chuwi Hi12 Intel Atom x5-Z8300 1.4GHz
HD Graphics (Cherry Trail)
min:
18 fps
fps
714%
GeForce GTX 1070 Ti (Desktop):
142.7 [X] Intel Core i7-4790K 4GHz
GeForce GTX 1070 Ti (Desktop)
min:
125.8 fps
fps
145%
HD Graphics 405 (Braswell):
22.1 35.2 ~ 29 fps
100%
HD Graphics (Cherry Trail):
15.2 [X] Chuwi Hi12 Intel Atom x5-Z8300 1.4GHz
HD Graphics (Cherry Trail)
min:
13 fps
fps
883%
GeForce GTX 1070 Ti (Desktop):
134.2 [X] Intel Core i7-4790K 4GHz
GeForce GTX 1070 Ti (Desktop)
min:
115.5 fps
fps
118%
HD Graphics 405 (Braswell):
13.7 22.8 ~ 18 fps
100%
HD Graphics (Cherry Trail):
7.2 [X] Chuwi Hi12 Intel Atom x5-Z8300 1.4GHz
HD Graphics (Cherry Trail)
min:
6 fps
fps
1758%
GeForce GTX 1070 Ti (Desktop):
126.6 [X] Intel Core i7-4790K 4GHz
GeForce GTX 1070 Ti (Desktop)
min:
111.1 fps
fps
GeForce GTX 1070 Ti (Desktop):
121.2 [X] Intel Core i7-4790K 4GHz
GeForce GTX 1070 Ti (Desktop)
min:
105.8 fps
fps
GeForce GTX 1070 Ti (Desktop):
105 [X] Intel Core i7-4790K 4GHz
GeForce GTX 1070 Ti (Desktop)
min:
95 fps
fps
GeForce GTX 1070 Ti (Desktop):
293 [X] Intel Core i7-4790K 4GHz
GeForce GTX 1070 Ti (Desktop)
min:
269 fps, max:
321 fps
fps
GeForce GTX 1070 Ti (Desktop):
71.8 [X] Intel Core i7-4790K 4GHz
GeForce GTX 1070 Ti (Desktop)
min:
61 fps, max:
80 fps
fps
GeForce GTX 1070 Ti (Desktop):
47.1 [X] Intel Core i7-4790K 4GHz
GeForce GTX 1070 Ti (Desktop)
min:
42 fps, max:
51 fps
fps
100%
HD Graphics (Cherry Trail):
20.1 fps
206%
HD Graphics 405 (Braswell):
41.5 fps
100%
HD Graphics (Cherry Trail):
12.5 fps
100%
HD Graphics 405 (Braswell):
12.5 fps
100%
HD Graphics (Cherry Trail):
10.8 (!) [X] Microsoft Surface 3 Intel Atom x7-Z8700 1.6GHz
HD Graphics (Cherry Trail)
fps
GeForce GTX 1070 Ti (Desktop):
67 [X] i7-7740X Asus X299 Prime Intel Core i7-7740X 4.3GHz
GeForce GTX 1070 Ti (Desktop)
min:
11.7 fps, P1:
27 fps, max:
202 fps
fps
100%
HD Graphics (Cherry Trail):
9.5 fps
127%
HD Graphics 405 (Braswell):
12.1 fps
100%
HD Graphics (Cherry Trail):
5.7 fps
133%
HD Graphics 405 (Braswell):
7.6 fps
100%
HD Graphics (Cherry Trail):
16.2 fps
100%
HD Graphics (Cherry Trail):
6.1 fps
100%
HD Graphics (Cherry Trail):
16 fps
175%
HD Graphics 405 (Braswell):
28 fps
100%
HD Graphics (Cherry Trail):
12 fps
142%
HD Graphics 405 (Braswell):
17 fps
HD Graphics 405 (Braswell):
18.9 fps
HD Graphics 405 (Braswell):
13.6 fps
100%
HD Graphics (Cherry Trail):
15.6 fps
109%
HD Graphics 405 (Braswell):
77.5 fps
123%
HD Graphics 405 (Braswell):
19.6 fps
100%
HD Graphics (Cherry Trail):
5.5 10 ~ 8 fps
HD Graphics 405 (Braswell):
14 fps
HD Graphics 405 (Braswell):
9.1 fps
100%
HD Graphics (Cherry Trail):
22 27.3 ~ 25 fps
202%
HD Graphics 405 (Braswell):
50.5 fps
100%
HD Graphics (Cherry Trail):
12.5 13.5 ~ 13 fps
115%
HD Graphics 405 (Braswell):
15 fps
HD Graphics 405 (Braswell):
6 fps
100%
HD Graphics (Cherry Trail):
13.3 fps
124%
HD Graphics 405 (Braswell):
16.5 fps
HD Graphics 405 (Braswell):
12.5 fps
HD Graphics 405 (Braswell):
8.3 fps
100%
HD Graphics (Cherry Trail):
58 fps
100%
HD Graphics (Cherry Trail):
47 fps
100%
HD Graphics (Cherry Trail):
29.7 fps
100%
HD Graphics (Cherry Trail):
16.5 fps
100%
HD Graphics (Cherry Trail):
24 fps
100%
HD Graphics (Cherry Trail):
13.5 fps
100%
HD Graphics (Cherry Trail):
16 18 18.9 [X] Medion Akoya E2215T Intel Atom x5-Z8350 1.4GHz
HD Graphics (Cherry Trail)
19.8 20.1 20.5 ~ 19 fps
100%
HD Graphics (Cherry Trail):
6.4 7.9 [X] Medion Akoya E2215T Intel Atom x5-Z8350 1.4GHz
HD Graphics (Cherry Trail)
9.3 9.8 10 10 ~ 9 fps
100%
HD Graphics (Cherry Trail):
5.6 5.7 [X] Medion Akoya E2215T Intel Atom x5-Z8350 1.4GHz
HD Graphics (Cherry Trail)
6.7 7.6 7.9 8.4 ~ 7 fps
143%
HD Graphics 405 (Braswell):
9.2 10 ~ 10 fps
100%
HD Graphics (Cherry Trail):
2.4 2.6 ~ 2 fps
6600%
GeForce GTX 1070 Ti (Desktop):
132 [X] Intel Core i7-4790K 4GHz
GeForce GTX 1070 Ti (Desktop)
min:
58 fps, max:
235 fps
fps
103%
HD Graphics 405 (Braswell):
27.8 fps
98%
HD Graphics 405 (Braswell):
12.8 fps
100%
HD Graphics (Cherry Trail):
7 8.3 9 ~ 8 fps
119%
HD Graphics 405 (Braswell):
9.5 fps
100%
HD Graphics (Cherry Trail):
3.7 3.8 ~ 4 fps
HD Graphics 405 (Braswell):
43.2 fps
HD Graphics 405 (Braswell):
19.6 fps
HD Graphics 405 (Braswell):
14.3 fps
100%
HD Graphics (Cherry Trail):
34 fps
100%
HD Graphics (Cherry Trail):
15.2 fps
100%
HD Graphics (Cherry Trail):
11.6 fps
HD Graphics (Cherry Trail):
0 (!) [X] Microsoft Surface 3 Intel Atom x7-Z8700 1.6GHz
HD Graphics (Cherry Trail)
fps
HD Graphics (Cherry Trail):
0 (!) [X] Microsoft Surface 3 Intel Atom x7-Z8700 1.6GHz
HD Graphics (Cherry Trail)
fps
164%
HD Graphics 405 (Braswell):
42.6 fps
160%
HD Graphics 405 (Braswell):
32 fps
100%
HD Graphics (Cherry Trail):
20.3 fps
100%
HD Graphics 405 (Braswell):
20.4 fps
100%
HD Graphics (Cherry Trail):
11.4 fps
100%
HD Graphics (Cherry Trail):
24.3 [X] Chuwi Hi12 Intel Atom x5-Z8300 1.4GHz
HD Graphics (Cherry Trail)
min:
20 fps, max:
29 fps
31.9 ~ 28 fps
114%
HD Graphics 405 (Braswell):
32 fps
100%
HD Graphics (Cherry Trail):
16 [X] Chuwi Hi12 Intel Atom x5-Z8300 1.4GHz
HD Graphics (Cherry Trail)
min:
13 fps, max:
19 fps
19 ~ 18 fps
106%
HD Graphics 405 (Braswell):
19.1 fps
HD Graphics 405 (Braswell):
14.4 fps
100%
HD Graphics (Cherry Trail):
8 fps
100%
HD Graphics (Cherry Trail):
15.5 18.9 ~ 17 fps
128%
HD Graphics 405 (Braswell):
21.8 fps
100%
HD Graphics (Cherry Trail):
7.2 8.5 ~ 8 fps
130%
HD Graphics 405 (Braswell):
10.4 fps
HD Graphics 405 (Braswell):
6.5 fps
100%
HD Graphics (Cherry Trail):
25.6 fps
138%
HD Graphics 405 (Braswell):
35.4 fps
100%
HD Graphics (Cherry Trail):
12 fps
123%
HD Graphics 405 (Braswell):
14.7 fps
100%
HD Graphics (Cherry Trail):
28.1 fps
100%
HD Graphics (Cherry Trail):
12.5 fps
100%
HD Graphics (Cherry Trail):
18.7 fps
100%
HD Graphics (Cherry Trail):
63.2 64 ~ 64 fps
100%
HD Graphics (Cherry Trail):
18 18.8 ~ 18 fps
100%
HD Graphics (Cherry Trail):
14 fps
100%
HD Graphics (Cherry Trail):
7 fps
100%
HD Graphics (Cherry Trail):
44 50.9 [X] Chuwi Hi12 Intel Atom x5-Z8300 1.4GHz
HD Graphics (Cherry Trail)
min:
40 fps, max:
60 fps
~ 47 fps
100%
HD Graphics (Cherry Trail):
18.3 [X] Chuwi Hi12 Intel Atom x5-Z8300 1.4GHz
HD Graphics (Cherry Trail)
min:
13 fps, max:
29 fps
fps
Average Gaming Intel HD Graphics (Cherry Trail) → 100% Average Gaming 30-70 fps → 100%
Average Gaming NVIDIA GeForce GTX 1070 Ti (Desktop) → 2489% Average Gaming Intel HD Graphics 405 (Braswell) → 130% Average Gaming 30-70 fps → 164%
For more games that might be playable and a list of all games and graphics cards visit our Gaming List
v1.28
log 30. 22:26:58
#0 checking url part for id 6197 +0s ... 0s
#1 checking url part for id 8258 +0s ... 0s
#2 checking url part for id 7348 +0s ... 0s
#3 redirected to Ajax server, took 1719779217 +0s ... 0s
#4 did not recreate cache, as it is less than 5 days old! Created at Fri, 28 Jun 2024 05:15:43 +0200 +0s ... 0s
#5 composed specs +0.031s ... 0.031s
#6 did output specs +0s ... 0.031s
#7 start showIntegratedCPUs +0s ... 0.031s
#8 getting avg benchmarks for device 6197 +0.032s ... 0.063s
#9 got single benchmarks 6197 +0.024s ... 0.087s
#10 getting avg benchmarks for device 8258 +0s ... 0.087s
#11 got single benchmarks 8258 +0.003s ... 0.09s
#12 getting avg benchmarks for device 7348 +0.003s ... 0.093s
#13 got single benchmarks 7348 +0.008s ... 0.101s
#14 got avg benchmarks for devices +0s ... 0.101s
#15 min, max, avg, median took s +0.031s ... 0.132s
#16 before gaming benchmark output +0s ... 0.132s
#17 Got 373 rows for game benchmarks. +0.016s ... 0.148s
#18 composed SQL query for gamebenchmarks +0s ... 0.148s
#19 got data and put it in $dataArray +0.004s ... 0.152s
#20 benchmarks composed for output. +0.028s ... 0.18s
#21 calculated avg scores. +0s ... 0.18s
#22 return log +0.001s ... 0.181s
Please share our article, every link counts!
Redaktion, 2017-09- 8 (Update: 2023-07- 1)
 Deutsch
 English
 Español
 Français
 Italiano
 Nederlands
 Polski
 Português
 Русский
 Türkçe
 Svenska
 Chinese
 Magyar