Intel HD Graphics (Cherry Trail) vs NVIDIA GeForce GTX 1070 Max-Q vs Intel HD Graphics 5000
Intel HD Graphics (Cherry Trail) ► remove from comparison
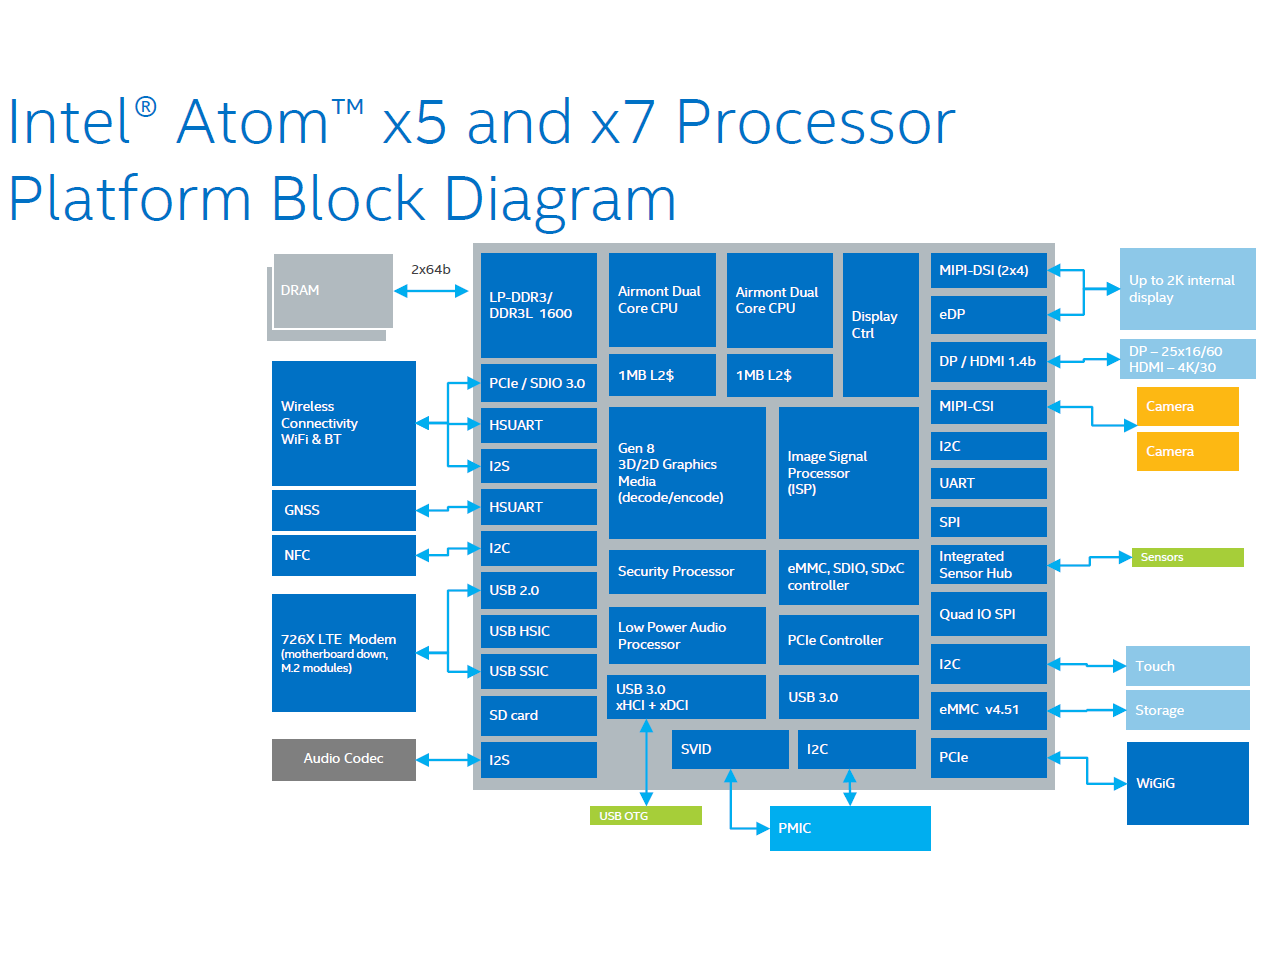
The Intel HD Graphics (Cherry Trail) is an integrated graphics card in the Cherry-Trail SoCs (e.g. Atom x7-Z8700). Based on a Broadwell GPU (Intel Gen8) and supports DirectX 11.2. Depending on the SoC offers 12 or 16 EUs.
Atom x7-Z8700: 16 EUs @ 200 - 600 MHz, dual-channel memory
In Windows, gaming is limited to less demanding or quite old games. Using Android, even high end 3D games should run fluently. For example Team Fortress 2 was running on the Surface 3 (x7-Z8700) only in lowest settings and 1280x720 fluently (11 - 69 fps range).
The integrated video decoder is able to display even 4K videos (H.264 tested) fluently.
The Intel HD Graphics GPU in our review sample of the MS Surface 3 (Atom x7-Z8700) only supported DisplayPort 1.1 as it seems, as 4K (3840x2160) with 30 Hz was the maximum Refresh Rate we could achieve (no 60 Hz selectable with the pre-installed drivers).
NVIDIA GeForce GTX 1070 Max-Q ► remove from comparison
The Nvidia GeForce GTX 1070 with the Max-Q design is a mobile high-end GPU from the Pascal series. It is designed for thin and light laptops and about 10-15% slower than a regular GTX 1070 for laptops based on the cooling capabilities. The base frequency (1101-1215 MHz) is also much lower than on the regular GTX 1070 (1433 MHz, at least -10%) and the Boost (1265-1379 MHz) is also much lower compared to 1645 MHz (at least -6%) for the regular GTX 1070. The memory clock, however, is identical.
The clock is not the only difference compared to the regular GTX 1070 though. The drivers for the Max-Q version were optimized for efficiency (and not performance; only for Max-Q models), there are optimized voltage converters for 1V operation, high-end cooling methods, and a 40 dB limit for the fan noise (with clock adjustments to ensure this at all times).
Features
The GP104 chip is manufactured in 16nm FinFET process at TSMC and offers a range of new features. DisplayPort 1.4 (ready), HDMI 2.0b, HDR, Simultaneous Multi-Projection (SMP), improved H.265 video en- and decoders (for PlayReady 3.0) are only some of the improvements. See our detailed Pascal architecture article for more details.
The power consumption of the Max-Q design is notably lower than the normal GTX 1070 for laptops and ranges between 80 and 90 Watt (TGP) according to Nvidia.
Intel HD Graphics 5000 ► remove from comparison
The Intel HD Graphics 5000 (GT3) is a processor graphics card included in some of the ULV Haswell processors of 2013 (e.g. Core i5-4250U ). It represents the highest configuration of the integrated graphics unit (40 execution units), but lacks the additional eDRAM cache of the Iris Pro Graphics 5200 . The relatively low base clock can be automatically overclocked using Turbo Boost technology. Depending on the processor model, the base and turbo clock rates may differ, resulting in varying graphics performance between CPU models.
In comparison to the HD 4000, the graphics core has been modified extensively. The GPU supports DirectX 11.1, OpenCL 1.2 and OpenGL 4.0. It also features an improved decoder for 4K videos and the fast Quick Sync encoder.
According to benchmarks in 3DMark 11, the HD Graphics 5000 is up to 50 percent faster than the previous HD 4000 . In games, however, the performance advantage is significantly lower. With simultaneous load on the CPU, the low TDP of the ULV models (15 W) limits the Turbo Boost of the GPU. Although the HD 5000 features 40 Execution Units, the graphics performance is still somewhat below the HD Graphics 4600 with only 20 EUs (HD 4000 : 16 EUs). Overall, the HD 5000 is thus just behind the AMD Radeon HD 7660G and at the level of a dedicated Radeon HD 7650M . Current games (as of 2013) will run fluently in low to medium-low settings.
Due to the 22nm 3D Tri-Gate production process, power consumption is relatively low. The HD Graphics 5000 is available on certain ULV dual-core Haswell models in the 15 Watt TDP range.
Intel HD Graphics (Cherry Trail) NVIDIA GeForce GTX 1070 Max-Q Intel HD Graphics 5000 HD Graphics Series Codename Cherry Trail N17E-G2 Max-Q Haswell GT3 Architecture Gen. 8 Pascal Gen. 7.5 Haswell Pipelines 16 - unified 2048 - unified 40 - unified Core Speed 200 - 600 (Boost) MHz 1101 - 1215 - 1265 - 1379 (Boost) MHz 200 - 1100 (Boost) MHz Memory Bus Width 64/128 Bit 256 Bit 64/128 Bit Shared Memory yes no yes API DirectX 12 (FL 11_1), Shader 5.0, OpenGL 4.3 DirectX 12_1, OpenGL 4.5 DirectX 11.1, Shader 5.0, OpenGL 4.0 technology 14 nm 16 nm 22 nm Date of Announcement 02.03.2015 30.05.2017 05.06.2013 Memory Speed 8000 MHz Memory Type GDDR5 Max. Amount of Memory 8 GB Transistors 7.2 Billion Features Multi-Projection, VR Ready, G-SYNC, Vulkan, Multi Monitor QuickSync Notebook Size large
Benchmarks Performance Rating - 3DMark 11 + Fire Strike + Time Spy - HD Graphics (Cherry Trail)
0.1 pt (0%)
Intel HD Graphics (Cherry Trail)
...
max:
Performance Rating - 3DMark 11 + Fire Strike + Time Spy - GeForce GTX 1070 Max-Q
6.7 pt (20%)
...
NVIDIA GeForce GTX 1070 Max-Q
...
max:
Performance Rating - 3DMark 11 + Fire Strike + Time Spy - HD Graphics 5000
0.3 pt (1%)
...
...
max:
3DMark - 3DMark Time Spy Score
min: 4396 avg: 4641 median: 4616 (13%) max: 4856 Points
3DMark - 3DMark Time Spy Graphics
min: 4548 avg: 4687 median: 4708 (12%) max: 4795 Points
3DMark - 3DMark Ice Storm Unlimited Graphics
min: 18563 avg: 20873 median: 19303 (2%) max: 27537 Points
min: 328292 avg: 351332 median: 334256 (38%) max: 398350 Points
65904 Points (7%)
3DMark - 3DMark Ice Storm Extreme Graphics
min: 91895 avg: 209959 median: 215087 (28%) max: 312206 Points
37346 Points (5%)
3DMark - 3DMark Cloud Gate Score
min: 769 avg: 1454 median: 1488 (2%) max: 1905 Points
min: 24117 avg: 29752 median: 28582.5 (31%) max: 35886 Points
min: 4331 avg: 4586 median: 4496.5 (5%) max: 5059 Points
3DMark - 3DMark Cloud Gate Graphics
min: 1537 avg: 1851 median: 1783.5 (0%) max: 2272 Points
min: 73739 avg: 97317 median: 99551.5 (26%) max: 107807 Points
min: 5381 avg: 5981 median: 5693.5 (1%) max: 6762 Points
3DMark - 3DMark Fire Strike Standard Score
min: 174 avg: 390.4 median: 248 (0%) max: 1059 Points
min: 11857 avg: 12627 median: 12598.5 (22%) max: 14119 Points
min: 583 avg: 669 median: 651 (1%) max: 808 Points
3DMark - 3DMark Fire Strike Standard Graphics
min: 193 avg: 233 median: 225 (0%) max: 281 Points
min: 14146 avg: 14910 median: 14678.5 (17%) max: 16165 Points
min: 620 avg: 725 median: 715.5 (1%) max: 875 Points
3DMark - 3DMark Ice Storm Graphics
min: 7544 avg: 16078 median: 17063.5 (2%) max: 23395 Points
min: 92053 avg: 245427 median: 241124 (29%) max: 357428 Points
min: 35584 avg: 41867 median: 40454 (5%) max: 52302 Points
3DMark - 3DMark Sling Shot (ES 3.0) Unlimited
min: 1445 avg: 1525 median: 1525 (7%) max: 1605 Points
3DMark - 3DMark Sling Shot (ES 3.0) Unlimited Graphics
min: 1598 avg: 1684 median: 1684 (4%) max: 1770 Points
3DMark - 3DMark Sling Shot Extreme (ES 3.1) Unlimited
min: 1072 avg: 1215 median: 1159 (6%) max: 1414 Points
3DMark - 3DMark Sling Shot Extreme (ES 3.1) Unlimited Graphics
min: 1058 avg: 1251 median: 1142 (3%) max: 1554 Points
3DMark 11 - 3DM11 Performance Score
min: 314 avg: 359.4 median: 343 (0%) max: 562 Points
min: 13513 avg: 15401 median: 15409 (21%) max: 17408 Points
min: 962 avg: 1088 median: 1125.5 (2%) max: 1163 Points
3DMark 11 - 3DM11 Performance GPU
min: 278 avg: 319.9 median: 298 (0%) max: 494 Points
min: 17680 avg: 19016 median: 18688 (16%) max: 20829 Points
min: 859 avg: 993 median: 1033.5 (1%) max: 1072 Points
3DMark Vantage + NVIDIA GeForce GTX 1070 Max-Q 3DMark Vantage - 3DM Vant. Perf. total
44090 Points (13%)
3DM Vant. Perf. total + Intel HD Graphics 5000
min: 3418 avg: 4231 median: 4276.5 (1%) max: 4734 Points
3DM Vant. Perf. GPU no PhysX + NVIDIA GeForce GTX 1070 Max-Q 3DMark Vantage - 3DM Vant. Perf. GPU no PhysX
47227 Points (27%)
3DM Vant. Perf. GPU no PhysX + Intel HD Graphics 5000
min: 2917 avg: 3639 median: 3665 (2%) max: 4108 Points
3DMark 03 - 3DMark 03 - Standard
min: 15752 avg: 18768 median: 18768 (10%) max: 21784 Points
3DMark 05 - 3DMark 05 - Standard
min: 9623 avg: 9763 median: 9763 (11%) max: 9903 Points
3DMark 06 3DMark 06 - Standard 1280x1024 + Intel HD Graphics (Cherry Trail)
min: 2403 avg: 2833 median: 2595 (3%) max: 3330 Points
3DMark 06 - Standard 1280x1024 + NVIDIA GeForce GTX 1070 Max-Q
min: 26805 avg: 30843 median: 30648.5 (40%) max: 35269 Points
3DMark 06 - Standard 1280x1024 + Intel HD Graphics 5000
min: 4751 avg: 5775 median: 5940 (8%) max: 6160 Points
3DMark 06 - Standard 1024x768 + Intel HD Graphics (Cherry Trail)
2877 Points (4%)
3DMark 06 - Standard 1280x800 + Intel HD Graphics 5000
6675 Points (9%)
Unigine Valley 1.0 - Unigine Valley 1.0 DX
1.2 fps (0%)
Unigine Heaven 3.0 - Unigine Heaven 3.0 DX 11
12.1 fps (4%)
Unigine Heaven 3.0 - Unigine Heaven 3.0 OpenGL
12.1 fps (5%)
Unigine Heaven 2.1 - Heaven 2.1 high
5.7 fps (1%)
min: 12.3 avg: 13 median: 13.1 (2%) max: 13.5 fps
SPECviewperf 11 + NVIDIA GeForce GTX 1070 Max-Q SPECviewperf 11 - specvp11 snx-01
11.8 fps (7%)
specvp11 snx-01 + Intel HD Graphics 5000
min: 1.26 avg: 1.5 median: 1.5 (1%) max: 1.64 fps
specvp11 tcvis-02 + NVIDIA GeForce GTX 1070 Max-Q SPECviewperf 11 - specvp11 tcvis-02
3.4 fps (2%)
specvp11 tcvis-02 + Intel HD Graphics 5000
min: 1.77 avg: 2.1 median: 2.1 (1%) max: 2.51 fps
specvp11 sw-02 + NVIDIA GeForce GTX 1070 Max-Q SPECviewperf 11 - specvp11 sw-02
19.9 fps (15%)
specvp11 sw-02 + Intel HD Graphics 5000
min: 7.95 avg: 9.9 median: 9.9 (8%) max: 11.8 fps
specvp11 proe-05 + NVIDIA GeForce GTX 1070 Max-Q SPECviewperf 11 - specvp11 proe-05
2.9 fps (3%)
specvp11 proe-05 + Intel HD Graphics 5000
min: 1.42 avg: 1.6 median: 1.6 (2%) max: 1.78 fps
specvp11 maya-03 + NVIDIA GeForce GTX 1070 Max-Q SPECviewperf 11 - specvp11 maya-03
18.6 fps (14%)
specvp11 maya-03 + Intel HD Graphics 5000
min: 12.95 avg: 14.2 median: 14.2 (11%) max: 15.43 fps
specvp11 lightwave-01 + NVIDIA GeForce GTX 1070 Max-Q SPECviewperf 11 - specvp11 lightwave-01
21 fps (23%)
specvp11 lightwave-01 + Intel HD Graphics 5000
min: 13.34 avg: 14.5 median: 14.5 (16%) max: 15.62 fps
specvp11 ensight-04 + NVIDIA GeForce GTX 1070 Max-Q SPECviewperf 11 - specvp11 ensight-04
160.3 fps (77%)
specvp11 ensight-04 + Intel HD Graphics 5000
min: 2.06 avg: 2.1 median: 2.1 (1%) max: 2.11 fps
specvp11 catia-03 + NVIDIA GeForce GTX 1070 Max-Q SPECviewperf 11 - specvp11 catia-03
20.3 fps (11%)
specvp11 catia-03 + Intel HD Graphics 5000
4.5 fps (2%)
SPECviewperf 12 + NVIDIA GeForce GTX 1070 Max-Q SPECviewperf 12 - specvp12 sw-03
min: 44.79 avg: 47.9 median: 47.8 (12%) max: 50.9 fps
specvp12 snx-02 + NVIDIA GeForce GTX 1070 Max-Q SPECviewperf 12 - specvp12 snx-02
min: 6.72 avg: 6.8 median: 6.8 (1%) max: 6.96 fps
specvp12 showcase-01 + NVIDIA GeForce GTX 1070 Max-Q SPECviewperf 12 - specvp12 showcase-01
min: 71.6 avg: 75.2 median: 75.2 (16%) max: 78.8 fps
specvp12 mediacal-01 + NVIDIA GeForce GTX 1070 Max-Q SPECviewperf 12 - specvp12 mediacal-01
min: 32.67 avg: 34.4 median: 34.4 (9%) max: 36.03 fps
specvp12 maya-04 + NVIDIA GeForce GTX 1070 Max-Q SPECviewperf 12 - specvp12 maya-04
min: 83.4 avg: 92.4 median: 92.4 (25%) max: 101.4 fps
specvp12 energy-01 + NVIDIA GeForce GTX 1070 Max-Q SPECviewperf 12 - specvp12 energy-01
6.9 fps (6%)
specvp12 creo-01 + NVIDIA GeForce GTX 1070 Max-Q SPECviewperf 12 - specvp12 creo-01
min: 45.05 avg: 45.2 median: 45.2 (18%) max: 45.43 fps
specvp12 catia-04 + NVIDIA GeForce GTX 1070 Max-Q SPECviewperf 12 - specvp12 catia-04
min: 62.7 avg: 63.3 median: 63.3 (10%) max: 63.9 fps
specvp12 3dsmax-05 + NVIDIA GeForce GTX 1070 Max-Q SPECviewperf 12 - specvp12 3dsmax-05
97.4 fps (17%)
Windows 7 Experience Index - Win7 Gaming graphics
min: 6.5 avg: 6.6 median: 6.6 (84%) max: 6.7 Points
Windows 7 Experience Index - Win7 Graphics
min: 5.8 avg: 5.9 median: 5.9 (74%) max: 5.9 Points
Cinebench R10 Cinebench R10 Shading (32bit) + Intel HD Graphics (Cherry Trail) Cinebench R10 - Cinebench R10 Shading (32bit)
min: 1192 avg: 2009 median: 1973 (1%) max: 2551 Points
Cinebench R10 Shading (32bit) + NVIDIA GeForce GTX 1070 Max-Q
min: 6820 avg: 9726 median: 10777 (8%) max: 11810 Points
Cinebench R10 Shading (32bit) + Intel HD Graphics 5000
min: 5143 avg: 6901 median: 6946.5 (5%) max: 7959 Points
Cinebench R11.5 Cinebench R11.5 OpenGL 64 Bit + Intel HD Graphics (Cherry Trail) Cinebench R11.5 - Cinebench R11.5 OpenGL 64 Bit
min: 4.01 avg: 8.8 median: 8.4 (3%) max: 11.71 fps
Cinebench R11.5 OpenGL 64 Bit + NVIDIA GeForce GTX 1070 Max-Q
min: 62.7 avg: 68.5 median: 67.2 (23%) max: 76.3 fps
Cinebench R11.5 OpenGL 64 Bit + Intel HD Graphics 5000
min: 15.01 avg: 19.6 median: 19.6 (7%) max: 24.76 fps
Cinebench R15 + Intel HD Graphics (Cherry Trail) Cinebench R15 - Cinebench R15 OpenGL 64 Bit
min: 6.64 avg: 10.3 median: 9.7 (1%) max: 15.52 fps
Cinebench R15 OpenGL 64 Bit + NVIDIA GeForce GTX 1070 Max-Q
min: 95.9 avg: 104.6 median: 102.1 (6%) max: 118.5 fps
Cinebench R15 OpenGL 64 Bit + Intel HD Graphics 5000
min: 24.15 avg: 27.4 median: 27.4 (2%) max: 30.64 fps
Cinebench R15 OpenGL Ref. Match 64 Bit + Intel HD Graphics (Cherry Trail) Cinebench R15 - Cinebench R15 OpenGL Ref. Match 64 Bit
min: 98 avg: 98 median: 98 (98%) max: 98.6 %
Cinebench R15 OpenGL Ref. Match 64 Bit + NVIDIA GeForce GTX 1070 Max-Q
99.6 % (100%)
Cinebench R15 OpenGL Ref. Match 64 Bit + Intel HD Graphics 5000
min: 63.3 avg: 81.1 median: 80.7 (81%) max: 99.6 %
GFXBench - GFXBench Car Chase Offscreen
min: 6.3 avg: 7.3 median: 7 (1%) max: 9 fps
GFXBench 3.1 - GFXBench Manhattan ES 3.1 Offscreen
min: 9.2 avg: 10.8 median: 11 (0%) max: 13 fps
GFXBench 3.0 - GFXBench 3.0 Manhattan Offscreen
min: 8.4 avg: 13.8 median: 13.5 (1%) max: 18 fps
459 fps (27%)
22.5 fps (1%)
GFXBench (DX / GLBenchmark) 2.7 + Intel HD Graphics (Cherry Trail) GFXBench (DX / GLBenchmark) 2.7 - GFXBench T-Rex HD Offscreen C24Z16
min: 22 avg: 30.5 median: 32 (0%) max: 38.5 fps
GFXBench T-Rex HD Offscreen C24Z16 + Intel HD Graphics 5000
min: 62 avg: 72.5 median: 72.5 (1%) max: 83 fps
LuxMark v2.0 64Bit - LuxMark v2.0 Room GPU
min: 48 avg: 58.7 median: 59 (0%) max: 69 Samples/s
min: 2460 avg: 2523 median: 2523 (11%) max: 2586 Samples/s
min: 139 avg: 187 median: 201 (1%) max: 221 Samples/s
LuxMark v2.0 64Bit - LuxMark v2.0 Sala GPU
min: 69 avg: 87.7 median: 89 (0%) max: 105 Samples/s
min: 4877 avg: 4938 median: 4937.5 (9%) max: 4998 Samples/s
min: 286 avg: 305.3 median: 306 (1%) max: 324 Samples/s
ComputeMark v2.1 - ComputeMark v2.1 Result
277 Points (0%)
min: 10798 avg: 10998 median: 10917 (12%) max: 11390 Points
min: 775 avg: 817 median: 816.5 (1%) max: 858 Points
Power Consumption - Witcher 3 Power Consumption *
min: 120 avg: 136.2 median: 134.2 (29%) max: 154 Watt
Power Consumption - Witcher 3 ultra Power Efficiency
min: 0.3221 avg: 0.4 median: 0.4 (34%) max: 0.4389 fps per Watt
Emissions Witcher 3 Fan Noise + NVIDIA GeForce GTX 1070 Max-Q Emissions - Witcher 3 Fan Noise
min: 41.7 avg: 46.1 median: 45 (72%) max: 55 dB(A)
Clock Speed - GPU Clock Witcher 3 ultra
min: 1228 avg: 1344 median: 1342 (53%) max: 1480 MHz
Average Benchmarks Intel HD Graphics (Cherry Trail) → 100% n=17 Average Benchmarks NVIDIA GeForce GTX 1070 Max-Q → 3169% n=17 Average Benchmarks Intel HD Graphics 5000 → 281% n=17
- Range of benchmark values for this graphics card
- Average benchmark values for this graphics card
* Smaller numbers mean a higher performance
1 This benchmark is not used for the average calculation
Game Benchmarks The following benchmarks stem from our benchmarks of review laptops. The performance depends on the used graphics memory, clock rate, processor, system settings, drivers, and operating systems. So the results don't have to be representative for all laptops with this GPU. For detailed information on the benchmark results, click on the fps number.
GeForce GTX 1070 Max-Q:
126.1 fps
GeForce GTX 1070 Max-Q:
86.1 fps
GeForce GTX 1070 Max-Q:
78.8 fps
GeForce GTX 1070 Max-Q:
75.7 fps
GeForce GTX 1070 Max-Q:
169.2 fps
GeForce GTX 1070 Max-Q:
83.9 fps
GeForce GTX 1070 Max-Q:
68.3 fps
GeForce GTX 1070 Max-Q:
59.7 fps
GeForce GTX 1070 Max-Q:
140.7 fps
GeForce GTX 1070 Max-Q:
80.6 fps
GeForce GTX 1070 Max-Q:
70 91.7 ~ 81 fps
GeForce GTX 1070 Max-Q:
64.7 85.2 ~ 75 fps
GeForce GTX 1070 Max-Q:
214.4 fps
GeForce GTX 1070 Max-Q:
167.6 fps
GeForce GTX 1070 Max-Q:
110.4 fps
GeForce GTX 1070 Max-Q:
89.6 fps
GeForce GTX 1070 Max-Q:
60 fps
GeForce GTX 1070 Max-Q:
60 fps
GeForce GTX 1070 Max-Q:
92 fps
GeForce GTX 1070 Max-Q:
80.5 fps
GeForce GTX 1070 Max-Q:
68.1 74.8 ~ 71 fps
GeForce GTX 1070 Max-Q:
66.3 68.8 ~ 68 fps
GeForce GTX 1070 Max-Q:
169.8 fps
GeForce GTX 1070 Max-Q:
105 fps
GeForce GTX 1070 Max-Q:
91.4 98.9 ~ 95 fps
GeForce GTX 1070 Max-Q:
84.7 93.3 ~ 89 fps
GeForce GTX 1070 Max-Q:
64 fps
GeForce GTX 1070 Max-Q:
62 fps
GeForce GTX 1070 Max-Q:
52 61 ~ 57 fps
GeForce GTX 1070 Max-Q:
39 44 ~ 42 fps
GeForce GTX 1070 Max-Q:
21 fps
GeForce GTX 1070 Max-Q:
127 fps
GeForce GTX 1070 Max-Q:
101 fps
GeForce GTX 1070 Max-Q:
95 99 ~ 97 fps
GeForce GTX 1070 Max-Q:
78 80 ~ 79 fps
GeForce GTX 1070 Max-Q:
43 fps
GeForce GTX 1070 Max-Q:
199 fps
GeForce GTX 1070 Max-Q:
194 fps
GeForce GTX 1070 Max-Q:
91 130 ~ 111 fps
GeForce GTX 1070 Max-Q:
65 78 ~ 72 fps
GeForce GTX 1070 Max-Q:
62 67 72 ~ 67 fps
GeForce GTX 1070 Max-Q:
58 58 61 ~ 59 fps
GeForce GTX 1070 Max-Q:
20 fps
GeForce GTX 1070 Max-Q:
163 fps
GeForce GTX 1070 Max-Q:
130 fps
GeForce GTX 1070 Max-Q:
70 76 76 ~ 74 fps
GeForce GTX 1070 Max-Q:
59 fps
GeForce GTX 1070 Max-Q:
156.5 fps
GeForce GTX 1070 Max-Q:
88.4 fps
GeForce GTX 1070 Max-Q:
74.8 80.4 ~ 78 fps
GeForce GTX 1070 Max-Q:
56.9 60.3 ~ 59 fps
GeForce GTX 1070 Max-Q:
60 60 ~ 60 fps
GeForce GTX 1070 Max-Q:
60 60 ~ 60 fps
GeForce GTX 1070 Max-Q:
103 fps
GeForce GTX 1070 Max-Q:
81 fps
GeForce GTX 1070 Max-Q:
76 77 79 83 ~ 79 fps
GeForce GTX 1070 Max-Q:
72 74 75 78 ~ 75 fps
GeForce GTX 1070 Max-Q:
27 fps
GeForce GTX 1070 Max-Q:
109 fps
GeForce GTX 1070 Max-Q:
96.5 fps
GeForce GTX 1070 Max-Q:
81.1 fps
GeForce GTX 1070 Max-Q:
112.4 fps
GeForce GTX 1070 Max-Q:
95.9 fps
GeForce GTX 1070 Max-Q:
163.3 fps
GeForce GTX 1070 Max-Q:
133.5 fps
GeForce GTX 1070 Max-Q:
86 94 101 ~ 94 fps
GeForce GTX 1070 Max-Q:
63 70 ~ 67 fps
GeForce GTX 1070 Max-Q:
53 64 ~ 59 fps
GeForce GTX 1070 Max-Q:
52 62 71 71 ~ 64 fps
GeForce GTX 1070 Max-Q:
44 53 61 61 ~ 55 fps
GeForce GTX 1070 Max-Q:
26 fps
GeForce GTX 1070 Max-Q:
152.6 fps
GeForce GTX 1070 Max-Q:
137.4 fps
GeForce GTX 1070 Max-Q:
130.8 fps
GeForce GTX 1070 Max-Q:
111 fps
GeForce GTX 1070 Max-Q:
88.5 fps
GeForce GTX 1070 Max-Q:
53.3 fps
GeForce GTX 1070 Max-Q:
91 132 ~ 112 fps
GeForce GTX 1070 Max-Q:
82 114 ~ 98 fps
GeForce GTX 1070 Max-Q:
74 90 91 ~ 85 fps
GeForce GTX 1070 Max-Q:
62 69 71 ~ 67 fps
GeForce GTX 1070 Max-Q:
158.3 fps
GeForce GTX 1070 Max-Q:
62.7 fps
GeForce GTX 1070 Max-Q:
45.7 fps
GeForce GTX 1070 Max-Q:
31.9 fps
GeForce GTX 1070 Max-Q:
112 125 ~ 119 fps
GeForce GTX 1070 Max-Q:
79 80 81 ~ 80 fps
GeForce GTX 1070 Max-Q:
36 fps
GeForce GTX 1070 Max-Q:
109 [X] MSI GS63VR 7RG Intel Core i7-7700HQ 2.8GHz
GeForce GTX 1070 Max-Q
min:
66 fps
fps
GeForce GTX 1070 Max-Q:
93.7 [X] MSI GS63VR 7RG Intel Core i7-7700HQ 2.8GHz
GeForce GTX 1070 Max-Q
min:
54 fps
fps
GeForce GTX 1070 Max-Q:
86.3 [X] MSI GS63VR 7RG Intel Core i7-7700HQ 2.8GHz
GeForce GTX 1070 Max-Q
min:
56 fps
116 120 ~ 107 fps
GeForce GTX 1070 Max-Q:
68.2 [X] MSI GS63VR 7RG Intel Core i7-7700HQ 2.8GHz
GeForce GTX 1070 Max-Q
min:
51 fps
78.7 84.6 ~ 77 fps
GeForce GTX 1070 Max-Q:
22.4 [X] MSI GS63VR 7RG Intel Core i7-7700HQ 2.8GHz
GeForce GTX 1070 Max-Q
min:
17 fps
fps
100%
HD Graphics (Cherry Trail):
21.4 fps
600%
GeForce GTX 1070 Max-Q:
128.4 fps
GeForce GTX 1070 Max-Q:
126.3 fps
GeForce GTX 1070 Max-Q:
122 fps
GeForce GTX 1070 Max-Q:
120.8 fps
GeForce GTX 1070 Max-Q:
115.4 121 [X] MSI GS63VR 7RG Intel Core i7-7700HQ 2.8GHz
GeForce GTX 1070 Max-Q
~ 118 fps
GeForce GTX 1070 Max-Q:
71.8 72.8 76.9 [X] MSI GS63VR 7RG Intel Core i7-7700HQ 2.8GHz
GeForce GTX 1070 Max-Q
82.7 ~ 76 fps
GeForce GTX 1070 Max-Q:
40.5 fps
100%
HD Graphics (Cherry Trail):
15.5 fps
GeForce GTX 1070 Max-Q:
196 196 208 [X] MSI GS63VR 7RG Intel Core i7-7700HQ 2.8GHz
GeForce GTX 1070 Max-Q
~ 200 fps
GeForce GTX 1070 Max-Q:
83.8 [X] MSI GS63VR 7RG Intel Core i7-7700HQ 2.8GHz
GeForce GTX 1070 Max-Q
fps
GeForce GTX 1070 Max-Q:
137 [X] MSI GS63VR 7RG Intel Core i7-7700HQ 2.8GHz
GeForce GTX 1070 Max-Q
fps
GeForce GTX 1070 Max-Q:
130 [X] MSI GS63VR 7RG Intel Core i7-7700HQ 2.8GHz
GeForce GTX 1070 Max-Q
132 138.7 140.8 ~ 135 fps
GeForce GTX 1070 Max-Q:
46.9 [X] MSI GS63VR 7RG Intel Core i7-7700HQ 2.8GHz
GeForce GTX 1070 Max-Q
48.1 ~ 48 fps
GeForce GTX 1070 Max-Q:
167.3 fps
GeForce GTX 1070 Max-Q:
106.4 fps
GeForce GTX 1070 Max-Q:
100.9 fps
GeForce GTX 1070 Max-Q:
89.9 fps
GeForce GTX 1070 Max-Q:
150.1 fps
GeForce GTX 1070 Max-Q:
110.8 fps
GeForce GTX 1070 Max-Q:
77.6 fps
GeForce GTX 1070 Max-Q:
68.5 fps
GeForce GTX 1070 Max-Q:
148.4 fps
GeForce GTX 1070 Max-Q:
86 fps
GeForce GTX 1070 Max-Q:
75.7 78.6 79.7 [X] MSI GS63VR 7RG Intel Core i7-7700HQ 2.8GHz
GeForce GTX 1070 Max-Q
~ 78 fps
GeForce GTX 1070 Max-Q:
42.8 43.7 45.4 [X] MSI GS63VR 7RG Intel Core i7-7700HQ 2.8GHz
GeForce GTX 1070 Max-Q
~ 44 fps
GeForce GTX 1070 Max-Q:
29 [X] MSI GS63VR 7RG Intel Core i7-7700HQ 2.8GHz
GeForce GTX 1070 Max-Q
fps
GeForce GTX 1070 Max-Q:
203.9 fps
GeForce GTX 1070 Max-Q:
128.6 fps
GeForce GTX 1070 Max-Q:
121 122.7 127 [X] MSI GS63VR 7RG Intel Core i7-7700HQ 2.8GHz
GeForce GTX 1070 Max-Q
~ 124 fps
GeForce GTX 1070 Max-Q:
93.4 [X] MSI GS63VR 7RG Intel Core i7-7700HQ 2.8GHz
GeForce GTX 1070 Max-Q
94.2 96 ~ 95 fps
GeForce GTX 1070 Max-Q:
39.1 [X] MSI GS63VR 7RG Intel Core i7-7700HQ 2.8GHz
GeForce GTX 1070 Max-Q
fps
GeForce GTX 1070 Max-Q:
135 138 [X] MSI GS63VR 7RG Intel Core i7-7700HQ 2.8GHz
GeForce GTX 1070 Max-Q
142 ~ 138 fps
GeForce GTX 1070 Max-Q:
116 [X] MSI GS63VR 7RG Intel Core i7-7700HQ 2.8GHz
GeForce GTX 1070 Max-Q
116 117 ~ 116 fps
GeForce GTX 1070 Max-Q:
38.6 [X] MSI GS63VR 7RG Intel Core i7-7700HQ 2.8GHz
GeForce GTX 1070 Max-Q
fps
GeForce GTX 1070 Max-Q:
68.8 [X] SCHENKER Key 15 Coffee Lake Intel Core i7-8750H 2.2GHz
GeForce GTX 1070 Max-Q
71.1 [X] MSI GS63VR 7RG Intel Core i7-7700HQ 2.8GHz
GeForce GTX 1070 Max-Q
~ 70 fps
GeForce GTX 1070 Max-Q:
51.5 [X] SCHENKER Key 15 Coffee Lake Intel Core i7-8750H 2.2GHz
GeForce GTX 1070 Max-Q
55.3 [X] MSI GS63VR 7RG Intel Core i7-7700HQ 2.8GHz
GeForce GTX 1070 Max-Q
~ 53 fps
GeForce GTX 1070 Max-Q:
28 [X] MSI GS63VR 7RG Intel Core i7-7700HQ 2.8GHz
GeForce GTX 1070 Max-Q
fps
GeForce GTX 1070 Max-Q:
79.5 [X] SCHENKER Key 15 Coffee Lake Intel Core i7-8750H 2.2GHz
GeForce GTX 1070 Max-Q
81.2 [X] MSI GS63VR 7RG Intel Core i7-7700HQ 2.8GHz
GeForce GTX 1070 Max-Q
~ 80 fps
GeForce GTX 1070 Max-Q:
68 [X] SCHENKER Key 15 Coffee Lake Intel Core i7-8750H 2.2GHz
GeForce GTX 1070 Max-Q
73.4 [X] MSI GS63VR 7RG Intel Core i7-7700HQ 2.8GHz
GeForce GTX 1070 Max-Q
~ 71 fps
GeForce GTX 1070 Max-Q:
115 [X] MSI GS63VR 7RG Intel Core i7-7700HQ 2.8GHz
GeForce GTX 1070 Max-Q
fps
GeForce GTX 1070 Max-Q:
106 [X] MSI GS63VR 7RG Intel Core i7-7700HQ 2.8GHz
GeForce GTX 1070 Max-Q
fps
GeForce GTX 1070 Max-Q:
52.4 [X] MSI GS63VR 7RG Intel Core i7-7700HQ 2.8GHz
GeForce GTX 1070 Max-Q
fps
GeForce GTX 1070 Max-Q:
118 [X] MSI GS63VR 7RG Intel Core i7-7700HQ 2.8GHz
GeForce GTX 1070 Max-Q
fps
GeForce GTX 1070 Max-Q:
104 [X] MSI GS63VR 7RG Intel Core i7-7700HQ 2.8GHz
GeForce GTX 1070 Max-Q
fps
GeForce GTX 1070 Max-Q:
37.4 [X] MSI GS63VR 7RG Intel Core i7-7700HQ 2.8GHz
GeForce GTX 1070 Max-Q
fps
100%
HD Graphics (Cherry Trail):
22.6 [X] Chuwi Hi12 Intel Atom x5-Z8300 1.4GHz
HD Graphics (Cherry Trail)
min:
21 fps, max:
27 fps
fps
GeForce GTX 1070 Max-Q:
123.2 fps
GeForce GTX 1070 Max-Q:
105.5 fps
GeForce GTX 1070 Max-Q:
91.5 106 [X] SCHENKER Key 15 Coffee Lake Intel Core i7-8750H 2.2GHz
GeForce GTX 1070 Max-Q
108 [X] MSI GS63VR 7RG Intel Core i7-7700HQ 2.8GHz
GeForce GTX 1070 Max-Q
~ 102 fps
GeForce GTX 1070 Max-Q:
90.7 96.4 [X] SCHENKER Key 15 Coffee Lake Intel Core i7-8750H 2.2GHz
GeForce GTX 1070 Max-Q
96.6 [X] MSI GS63VR 7RG Intel Core i7-7700HQ 2.8GHz
GeForce GTX 1070 Max-Q
~ 95 fps
GeForce GTX 1070 Max-Q:
38.9 [X] MSI GS63VR 7RG Intel Core i7-7700HQ 2.8GHz
GeForce GTX 1070 Max-Q
39.1 ~ 39 fps
GeForce GTX 1070 Max-Q:
51.6 51.8 [X] Smart7 Deimos GX15E G1 Intel Core i7-7700HQ 2.8GHz
GeForce GTX 1070 Max-Q
55.1 56 ~ 54 fps
GeForce GTX 1070 Max-Q:
20.6 fps
GeForce GTX 1070 Max-Q:
215 [X] MSI GS63VR 7RG Intel Core i7-7700HQ 2.8GHz
GeForce GTX 1070 Max-Q
fps
GeForce GTX 1070 Max-Q:
212 [X] MSI GS63VR 7RG Intel Core i7-7700HQ 2.8GHz
GeForce GTX 1070 Max-Q
fps
GeForce GTX 1070 Max-Q:
144 [X] MSI GS63VR 7RG Intel Core i7-7700HQ 2.8GHz
GeForce GTX 1070 Max-Q
fps
GeForce GTX 1070 Max-Q:
68.1 [X] SCHENKER Key 15 Coffee Lake Intel Core i7-8750H 2.2GHz
GeForce GTX 1070 Max-Q
73.9 [X] MSI GS63VR 7RG Intel Core i7-7700HQ 2.8GHz
GeForce GTX 1070 Max-Q
~ 71 fps
GeForce GTX 1070 Max-Q:
37.9 [X] SCHENKER Key 15 Coffee Lake Intel Core i7-8750H 2.2GHz
GeForce GTX 1070 Max-Q
40.4 [X] MSI GS63VR 7RG Intel Core i7-7700HQ 2.8GHz
GeForce GTX 1070 Max-Q
~ 39 fps
GeForce GTX 1070 Max-Q:
24.5 [X] MSI GS63VR 7RG Intel Core i7-7700HQ 2.8GHz
GeForce GTX 1070 Max-Q
fps
GeForce GTX 1070 Max-Q:
86.4 [X] SCHENKER Key 15 Coffee Lake Intel Core i7-8750H 2.2GHz
GeForce GTX 1070 Max-Q
87.3 [X] MSI GS63VR 7RG Intel Core i7-7700HQ 2.8GHz
GeForce GTX 1070 Max-Q
~ 87 fps
GeForce GTX 1070 Max-Q:
78.6 [X] SCHENKER Key 15 Coffee Lake Intel Core i7-8750H 2.2GHz
GeForce GTX 1070 Max-Q
80.2 [X] MSI GS63VR 7RG Intel Core i7-7700HQ 2.8GHz
GeForce GTX 1070 Max-Q
~ 79 fps
GeForce GTX 1070 Max-Q:
31.5 [X] MSI GS63VR 7RG Intel Core i7-7700HQ 2.8GHz
GeForce GTX 1070 Max-Q
fps
GeForce GTX 1070 Max-Q:
70.1 fps
GeForce GTX 1070 Max-Q:
115 [X] MSI GS63VR 7RG Intel Core i7-7700HQ 2.8GHz
GeForce GTX 1070 Max-Q
115 [X] SCHENKER Key 15 Coffee Lake Intel Core i7-8750H 2.2GHz
GeForce GTX 1070 Max-Q
~ 115 fps
GeForce GTX 1070 Max-Q:
106 [X] SCHENKER Key 15 Coffee Lake Intel Core i7-8750H 2.2GHz
GeForce GTX 1070 Max-Q
112 [X] MSI GS63VR 7RG Intel Core i7-7700HQ 2.8GHz
GeForce GTX 1070 Max-Q
~ 109 fps
GeForce GTX 1070 Max-Q:
44.4 [X] MSI GS63VR 7RG Intel Core i7-7700HQ 2.8GHz
GeForce GTX 1070 Max-Q
fps
GeForce GTX 1070 Max-Q:
83.9 [X] SCHENKER Key 15 Coffee Lake Intel Core i7-8750H 2.2GHz
GeForce GTX 1070 Max-Q
88.6 [X] MSI GS63VR 7RG Intel Core i7-7700HQ 2.8GHz
GeForce GTX 1070 Max-Q
~ 86 fps
GeForce GTX 1070 Max-Q:
65.3 [X] SCHENKER Key 15 Coffee Lake Intel Core i7-8750H 2.2GHz
GeForce GTX 1070 Max-Q
72 [X] MSI GS63VR 7RG Intel Core i7-7700HQ 2.8GHz
GeForce GTX 1070 Max-Q
~ 69 fps
GeForce GTX 1070 Max-Q:
33.6 [X] MSI GS63VR 7RG Intel Core i7-7700HQ 2.8GHz
GeForce GTX 1070 Max-Q
fps
GeForce GTX 1070 Max-Q:
92 [X] MSI GS63VR 7RG Intel Core i7-7700HQ 2.8GHz
GeForce GTX 1070 Max-Q
fps
GeForce GTX 1070 Max-Q:
76 [X] MSI GS63VR 7RG Intel Core i7-7700HQ 2.8GHz
GeForce GTX 1070 Max-Q
fps
GeForce GTX 1070 Max-Q:
34 [X] MSI GS63VR 7RG Intel Core i7-7700HQ 2.8GHz
GeForce GTX 1070 Max-Q
fps
GeForce GTX 1070 Max-Q:
85.7 97.7 97.8 100 [X] MSI GS63VR 7RG Intel Core i7-7700HQ 2.8GHz
GeForce GTX 1070 Max-Q
102.8 ~ 97 fps
GeForce GTX 1070 Max-Q:
32.1 33.6 36 [X] MSI GS63VR 7RG Intel Core i7-7700HQ 2.8GHz
GeForce GTX 1070 Max-Q
~ 34 fps
100%
HD Graphics (Cherry Trail):
11.5 fps
100%
HD Graphics (Cherry Trail):
7 fps
GeForce GTX 1070 Max-Q:
161 [X] SCHENKER Key 15 Coffee Lake Intel Core i7-8750H 2.2GHz
GeForce GTX 1070 Max-Q
168 [X] MSI GS63VR 7RG Intel Core i7-7700HQ 2.8GHz
GeForce GTX 1070 Max-Q
~ 165 fps
GeForce GTX 1070 Max-Q:
143 [X] SCHENKER Key 15 Coffee Lake Intel Core i7-8750H 2.2GHz
GeForce GTX 1070 Max-Q
144 [X] MSI GS63VR 7RG Intel Core i7-7700HQ 2.8GHz
GeForce GTX 1070 Max-Q
~ 144 fps
GeForce GTX 1070 Max-Q:
54.4 [X] MSI GS63VR 7RG Intel Core i7-7700HQ 2.8GHz
GeForce GTX 1070 Max-Q
fps
100%
HD Graphics (Cherry Trail):
8.8 fps
100%
HD Graphics (Cherry Trail):
4.8 fps
GeForce GTX 1070 Max-Q:
136 [X] MSI GS63VR 7RG Intel Core i7-7700HQ 2.8GHz
GeForce GTX 1070 Max-Q
fps
GeForce GTX 1070 Max-Q:
121 [X] MSI GS63VR 7RG Intel Core i7-7700HQ 2.8GHz
GeForce GTX 1070 Max-Q
fps
GeForce GTX 1070 Max-Q:
44.7 [X] MSI GS63VR 7RG Intel Core i7-7700HQ 2.8GHz
GeForce GTX 1070 Max-Q
fps
GeForce GTX 1070 Max-Q:
78.8 [X] MSI GS63VR 7RG Intel Core i7-7700HQ 2.8GHz
GeForce GTX 1070 Max-Q
fps
GeForce GTX 1070 Max-Q:
43.6 [X] MSI GS63VR 7RG Intel Core i7-7700HQ 2.8GHz
GeForce GTX 1070 Max-Q
fps
GeForce GTX 1070 Max-Q:
33.4 [X] MSI GS63VR 7RG Intel Core i7-7700HQ 2.8GHz
GeForce GTX 1070 Max-Q
fps
GeForce GTX 1070 Max-Q:
34.3 fps
100%
HD Graphics (Cherry Trail):
8.1 fps
100%
HD Graphics (Cherry Trail):
3.9 fps
100%
HD Graphics (Cherry Trail):
13.9 [X] Chuwi Hi12 Intel Atom x5-Z8300 1.4GHz
HD Graphics (Cherry Trail)
min:
7 fps, max:
19 fps
16.8 ~ 15 fps
1369%
GeForce GTX 1070 Max-Q:
205.4 fps
GeForce GTX 1070 Max-Q:
169.8 fps
GeForce GTX 1070 Max-Q:
146.3 fps
GeForce GTX 1070 Max-Q:
140.7 fps
100%
HD Graphics (Cherry Trail):
15.1 fps
100%
HD Graphics (Cherry Trail):
9.8 fps
GeForce GTX 1070 Max-Q:
60 fps
GeForce GTX 1070 Max-Q:
60 60 60 ~ 60 fps
GeForce GTX 1070 Max-Q:
59 fps
100%
HD Graphics (Cherry Trail):
20 [X] Chuwi Hi12 Intel Atom x5-Z8300 1.4GHz
HD Graphics (Cherry Trail)
min:
18 fps
fps
635%
GeForce GTX 1070 Max-Q:
126.9 fps
100%
HD Graphics (Cherry Trail):
15.2 [X] Chuwi Hi12 Intel Atom x5-Z8300 1.4GHz
HD Graphics (Cherry Trail)
min:
13 fps
fps
778%
GeForce GTX 1070 Max-Q:
118.2 fps
100%
HD Graphics (Cherry Trail):
7.2 [X] Chuwi Hi12 Intel Atom x5-Z8300 1.4GHz
HD Graphics (Cherry Trail)
min:
6 fps
fps
1551%
GeForce GTX 1070 Max-Q:
111.7 fps
GeForce GTX 1070 Max-Q:
109.7 fps
GeForce GTX 1070 Max-Q:
94 [X] Smart7 Deimos GX15E G1 Intel Core i7-7700HQ 2.8GHz
GeForce GTX 1070 Max-Q
106 111 112 [X] MSI GS63VR 7RG Intel Core i7-7700HQ 2.8GHz
GeForce GTX 1070 Max-Q
~ 106 fps
GeForce GTX 1070 Max-Q:
56 64 [X] Smart7 Deimos GX15E G1 Intel Core i7-7700HQ 2.8GHz
GeForce GTX 1070 Max-Q
73 [X] MSI GS63VR 7RG Intel Core i7-7700HQ 2.8GHz
GeForce GTX 1070 Max-Q
73 79 ~ 69 fps
GeForce GTX 1070 Max-Q:
37 40 [X] MSI GS63VR 7RG Intel Core i7-7700HQ 2.8GHz
GeForce GTX 1070 Max-Q
~ 39 fps
GeForce GTX 1070 Max-Q:
71.2 [X] Smart7 Deimos GX15E G1 Intel Core i7-7700HQ 2.8GHz
GeForce GTX 1070 Max-Q
89.9 [X] SCHENKER Key 15 Coffee Lake Intel Core i7-8750H 2.2GHz
GeForce GTX 1070 Max-Q
90.3 90.4 91.3 [X] SCHENKER Key 15 Coffee Lake Intel Core i7-8750H 2.2GHz
GeForce GTX 1070 Max-Q
91.6 92.8 93.2 94.5 95.5 96 97 97.1 [X] MSI GS63VR 7RG Intel Core i7-7700HQ 2.8GHz
GeForce GTX 1070 Max-Q
97.7 98.2 99.4 100 [X] Asus Zephyrus S GX531GS Turbo Mode Intel Core i7-8750H 2.2GHz
GeForce GTX 1070 Max-Q
101.6 ~ 94 fps
GeForce GTX 1070 Max-Q:
46 48.9 49.2 49.6 49.8 [X] SCHENKER Key 15 Coffee Lake Intel Core i7-8750H 2.2GHz
GeForce GTX 1070 Max-Q
50.2 50.2 [X] SCHENKER Key 15 Coffee Lake Intel Core i7-8750H 2.2GHz
GeForce GTX 1070 Max-Q
50.7 [X] Smart7 Deimos GX15E G1 Intel Core i7-7700HQ 2.8GHz
GeForce GTX 1070 Max-Q
51 51.3 51.5 52.4 52.4 52.7 53.5 53.7 [X] MSI GS63VR 7RG Intel Core i7-7700HQ 2.8GHz
GeForce GTX 1070 Max-Q
54.2 55.3 [X] Asus Zephyrus S GX531GS Turbo Mode Intel Core i7-8750H 2.2GHz
GeForce GTX 1070 Max-Q
55.3 ~ 51 fps
GeForce GTX 1070 Max-Q:
27.7 35.4 [X] MSI GS63VR 7RG Intel Core i7-7700HQ 2.8GHz
GeForce GTX 1070 Max-Q
~ 32 fps
100%
HD Graphics (Cherry Trail):
20.1 fps
100%
HD Graphics (Cherry Trail):
12.5 fps
100%
HD Graphics (Cherry Trail):
10.8 (!) [X] Microsoft Surface 3 Intel Atom x7-Z8700 1.6GHz
HD Graphics (Cherry Trail)
fps
1544%
GeForce GTX 1070 Max-Q:
166.7 fps
178%
HD Graphics 5000:
19.2 fps
GeForce GTX 1070 Max-Q:
159.8 fps
GeForce GTX 1070 Max-Q:
145.9 fps
GeForce GTX 1070 Max-Q:
64.6 fps
HD Graphics 5000:
20.8 fps
HD Graphics 5000:
15.1 fps
HD Graphics 5000:
12.7 fps
HD Graphics 5000:
15.8 fps
HD Graphics 5000:
10.6 fps
100%
HD Graphics (Cherry Trail):
9.5 fps
183%
HD Graphics 5000:
17.4 fps
100%
HD Graphics (Cherry Trail):
5.7 fps
211%
HD Graphics 5000:
12 fps
HD Graphics 5000:
14.3 fps
HD Graphics 5000:
10.6 fps
HD Graphics 5000:
25.4 fps
HD Graphics 5000:
16.2 fps
100%
HD Graphics (Cherry Trail):
16.2 fps
96%
HD Graphics 5000:
15.5 fps
100%
HD Graphics (Cherry Trail):
6.1 fps
200%
HD Graphics 5000:
12.2 fps
100%
HD Graphics (Cherry Trail):
16 fps
319%
HD Graphics 5000:
51 fps
100%
HD Graphics (Cherry Trail):
12 fps
292%
HD Graphics 5000:
35 fps
HD Graphics 5000:
14.2 fps
HD Graphics 5000:
10.6 fps
HD Graphics 5000:
14.7 fps
HD Graphics 5000:
28.9 fps
HD Graphics 5000:
20.9 fps
HD Graphics 5000:
11.4 fps
HD Graphics 5000:
20.1 fps
100%
HD Graphics (Cherry Trail):
15.6 fps
232%
HD Graphics 5000:
36.2 fps
HD Graphics 5000:
28.1 fps
HD Graphics 5000:
17.4 fps
237%
HD Graphics 5000:
168.3 fps
205%
HD Graphics 5000:
32.8 fps
100%
HD Graphics (Cherry Trail):
5.5 10 ~ 8 fps
178%
HD Graphics 5000:
14.2 fps
HD Graphics 5000:
28.7 fps
HD Graphics 5000:
17.6 fps
100%
HD Graphics (Cherry Trail):
22 27.3 ~ 25 fps
343%
HD Graphics 5000:
85.7 fps
100%
HD Graphics (Cherry Trail):
12.5 13.5 ~ 13 fps
232%
HD Graphics 5000:
30.2 fps
HD Graphics 5000:
14.9 fps
HD Graphics 5000:
12.5 fps
HD Graphics 5000:
17 18.1 ~ 18 fps
HD Graphics 5000:
27.2 fps
HD Graphics 5000:
22.1 fps
HD Graphics 5000:
10.7 fps
HD Graphics 5000:
33.2 fps
HD Graphics 5000:
20.2 fps
HD Graphics 5000:
13.2 fps
HD Graphics 5000:
8.4 9.7 ~ 9 fps
GeForce GTX 1070 Max-Q:
70.8 [X] Smart7 Deimos GX15E G1 Intel Core i7-7700HQ 2.8GHz
GeForce GTX 1070 Max-Q
fps
GeForce GTX 1070 Max-Q:
68.3 [X] Smart7 Deimos GX15E G1 Intel Core i7-7700HQ 2.8GHz
GeForce GTX 1070 Max-Q
93.3 95.1 98.8 ~ 89 fps
HD Graphics 5000:
20.5 fps
100%
HD Graphics (Cherry Trail):
13.3 fps
215%
HD Graphics 5000:
28.6 fps
HD Graphics 5000:
19.9 fps
HD Graphics 5000:
13.3 fps
HD Graphics 5000:
165.1 fps
HD Graphics 5000:
100.2 fps
HD Graphics 5000:
71.4 fps
HD Graphics 5000:
39.3 fps
HD Graphics 5000:
39.8 fps
HD Graphics 5000:
29.4 fps
GeForce GTX 1070 Max-Q:
170.4 [X] Smart7 Deimos GX15E G1 Intel Core i7-7700HQ 2.8GHz
GeForce GTX 1070 Max-Q
fps
HD Graphics 5000:
21.6 fps
GeForce GTX 1070 Max-Q:
72.8 [X] Smart7 Deimos GX15E G1 Intel Core i7-7700HQ 2.8GHz
GeForce GTX 1070 Max-Q
fps
100%
HD Graphics (Cherry Trail):
58 fps
100%
HD Graphics (Cherry Trail):
47 fps
100%
HD Graphics (Cherry Trail):
29.7 fps
219%
HD Graphics 5000:
59.6 69.8 ~ 65 fps
100%
HD Graphics (Cherry Trail):
16.5 fps
206%
HD Graphics 5000:
31.5 36.8 ~ 34 fps
HD Graphics 5000:
13.3 fps
HD Graphics 5000:
10.4 fps
100%
HD Graphics (Cherry Trail):
24 fps
244%
HD Graphics 5000:
58.6 fps
100%
HD Graphics (Cherry Trail):
13.5 fps
232%
HD Graphics 5000:
31.3 fps
HD Graphics 5000:
22.7 fps
HD Graphics 5000:
12.5 fps
100%
HD Graphics (Cherry Trail):
16 18 18.9 [X] Medion Akoya E2215T Intel Atom x5-Z8350 1.4GHz
HD Graphics (Cherry Trail)
19.8 20.1 20.5 ~ 19 fps
184%
HD Graphics 5000:
32 [X] Dell XPS 12 Haswell Intel Core i7-4650U 1.7GHz
HD Graphics 5000
34.3 34.3 38.3 ~ 35 fps
100%
HD Graphics (Cherry Trail):
6.4 7.9 [X] Medion Akoya E2215T Intel Atom x5-Z8350 1.4GHz
HD Graphics (Cherry Trail)
9.3 9.8 10 10 ~ 9 fps
222%
HD Graphics 5000:
17 [X] Dell XPS 12 Haswell Intel Core i7-4650U 1.7GHz
HD Graphics 5000
20.1 20.9 22.5 ~ 20 fps
100%
HD Graphics (Cherry Trail):
5.6 5.7 [X] Medion Akoya E2215T Intel Atom x5-Z8350 1.4GHz
HD Graphics (Cherry Trail)
6.7 7.6 7.9 8.4 ~ 7 fps
229%
HD Graphics 5000:
14 [X] Dell XPS 12 Haswell Intel Core i7-4650U 1.7GHz
HD Graphics 5000
14.2 16.6 18.2 ~ 16 fps
100%
HD Graphics (Cherry Trail):
2.4 2.6 ~ 2 fps
385%
HD Graphics 5000:
7.7 fps
1641%
GeForce GTX 1070 Max-Q:
407.5 478.7 ~ 443 fps
196%
HD Graphics 5000:
44 [X] Dell XPS 12 Haswell Intel Core i7-4650U 1.7GHz
HD Graphics 5000
52.5 53.9 54.3 55.3 56 ~ 53 fps
3138%
GeForce GTX 1070 Max-Q:
376.4 439.3 ~ 408 fps
200%
HD Graphics 5000:
23 [X] Dell XPS 12 Haswell Intel Core i7-4650U 1.7GHz
HD Graphics 5000
25 26 27.5 28.3 28.6 ~ 26 fps
100%
HD Graphics (Cherry Trail):
7 8.3 9 ~ 8 fps
4438%
GeForce GTX 1070 Max-Q:
339.3 371.5 ~ 355 fps
200%
HD Graphics 5000:
14 14.9 15 [X] Dell XPS 12 Haswell Intel Core i7-4650U 1.7GHz
HD Graphics 5000
15.8 17.4 17.5 ~ 16 fps
100%
HD Graphics (Cherry Trail):
3.7 3.8 ~ 4 fps
4550%
GeForce GTX 1070 Max-Q:
179.1 185.2 ~ 182 fps
200%
HD Graphics 5000:
7.9 8 [X] Dell XPS 12 Haswell Intel Core i7-4650U 1.7GHz
HD Graphics 5000
9.5 ~ 8 fps
HD Graphics 5000:
20.9 fps
100%
HD Graphics (Cherry Trail):
34 fps
HD Graphics 5000:
28.6 fps
HD Graphics 5000:
19.2 fps
HD Graphics 5000:
16.6 fps
HD Graphics 5000:
11.2 fps
HD Graphics 5000:
22.3 fps
HD Graphics 5000:
15.7 fps
HD Graphics 5000:
40.5 fps
HD Graphics 5000:
14.1 fps
100%
HD Graphics (Cherry Trail):
15.2 fps
100%
HD Graphics (Cherry Trail):
11.6 fps
HD Graphics (Cherry Trail):
0 (!) [X] Microsoft Surface 3 Intel Atom x7-Z8700 1.6GHz
HD Graphics (Cherry Trail)
fps
HD Graphics (Cherry Trail):
0 (!) [X] Microsoft Surface 3 Intel Atom x7-Z8700 1.6GHz
HD Graphics (Cherry Trail)
fps
GeForce GTX 1070 Max-Q:
62.2 70 ~ 66 fps
100%
HD Graphics (Cherry Trail):
20.3 fps
100%
HD Graphics (Cherry Trail):
11.4 fps
100%
HD Graphics (Cherry Trail):
24.3 [X] Chuwi Hi12 Intel Atom x5-Z8300 1.4GHz
HD Graphics (Cherry Trail)
min:
20 fps, max:
29 fps
31.9 ~ 28 fps
204%
HD Graphics 5000:
54 58 59 [X] Dell XPS 12 Haswell Intel Core i7-4650U 1.7GHz
HD Graphics 5000
~ 57 fps
100%
HD Graphics (Cherry Trail):
16 [X] Chuwi Hi12 Intel Atom x5-Z8300 1.4GHz
HD Graphics (Cherry Trail)
min:
13 fps, max:
19 fps
19 ~ 18 fps
222%
HD Graphics 5000:
38 [X] Dell XPS 12 Haswell Intel Core i7-4650U 1.7GHz
HD Graphics 5000
42 ~ 40 fps
HD Graphics 5000:
31 [X] Dell XPS 12 Haswell Intel Core i7-4650U 1.7GHz
HD Graphics 5000
32 ~ 32 fps
HD Graphics 5000:
13 19 21 [X] Dell XPS 12 Haswell Intel Core i7-4650U 1.7GHz
HD Graphics 5000
~ 18 fps
227%
HD Graphics 5000:
57.8 59.2 61 [X] Dell XPS 12 Haswell Intel Core i7-4650U 1.7GHz
HD Graphics 5000
~ 59 fps
246%
HD Graphics 5000:
30 [X] Dell XPS 12 Haswell Intel Core i7-4650U 1.7GHz
HD Graphics 5000
32.2 32.8 ~ 32 fps
100%
HD Graphics (Cherry Trail):
8 fps
225%
HD Graphics 5000:
16.2 18 [X] Dell XPS 12 Haswell Intel Core i7-4650U 1.7GHz
HD Graphics 5000
20.1 ~ 18 fps
HD Graphics 5000:
9 [X] Dell XPS 12 Haswell Intel Core i7-4650U 1.7GHz
HD Graphics 5000
fps
100%
HD Graphics (Cherry Trail):
15.5 18.9 ~ 17 fps
174%
HD Graphics 5000:
29.5 fps
100%
HD Graphics (Cherry Trail):
7.2 8.5 ~ 8 fps
230%
HD Graphics 5000:
18.4 fps
HD Graphics 5000:
11.6 fps
100%
HD Graphics (Cherry Trail):
25.6 fps
100%
HD Graphics (Cherry Trail):
12 fps
100%
HD Graphics (Cherry Trail):
28.1 fps
100%
HD Graphics (Cherry Trail):
12.5 fps
HD Graphics 5000:
88.8 fps
100%
HD Graphics (Cherry Trail):
18.7 fps
100%
HD Graphics (Cherry Trail):
63.2 64 ~ 64 fps
231%
HD Graphics 5000:
126 169 [X] Dell XPS 12 Haswell Intel Core i7-4650U 1.7GHz
HD Graphics 5000
~ 148 fps
100%
HD Graphics (Cherry Trail):
18 18.8 ~ 18 fps
228%
HD Graphics 5000:
38 43 [X] Dell XPS 12 Haswell Intel Core i7-4650U 1.7GHz
HD Graphics 5000
~ 41 fps
100%
HD Graphics (Cherry Trail):
14 fps
179%
HD Graphics 5000:
24 26 [X] Dell XPS 12 Haswell Intel Core i7-4650U 1.7GHz
HD Graphics 5000
~ 25 fps
100%
HD Graphics (Cherry Trail):
7 fps
186%
HD Graphics 5000:
10 16 [X] Dell XPS 12 Haswell Intel Core i7-4650U 1.7GHz
HD Graphics 5000
~ 13 fps
100%
HD Graphics (Cherry Trail):
44 50.9 [X] Chuwi Hi12 Intel Atom x5-Z8300 1.4GHz
HD Graphics (Cherry Trail)
min:
40 fps, max:
60 fps
~ 47 fps
345%
HD Graphics 5000:
162 fps
100%
HD Graphics (Cherry Trail):
18.3 [X] Chuwi Hi12 Intel Atom x5-Z8300 1.4GHz
HD Graphics (Cherry Trail)
min:
13 fps, max:
29 fps
fps
426%
HD Graphics 5000:
78 fps
Average Gaming Intel HD Graphics (Cherry Trail) → 100% Average Gaming 30-70 fps → 100%
Average Gaming NVIDIA GeForce GTX 1070 Max-Q → 2402% Average Gaming Intel HD Graphics 5000 → 230% Average Gaming 30-70 fps → 230%
For more games that might be playable and a list of all games and graphics cards visit our Gaming List
v1.28
log 04. 22:10:03
#0 checking url part for id 6197 +0s ... 0s
#1 checking url part for id 8008 +0s ... 0s
#2 checking url part for id 4574 +0s ... 0s
#3 redirected to Ajax server, took 1720123803 +0s ... 0s
#4 did not recreate cache, as it is less than 5 days old! Created at Thu, 04 Jul 2024 05:15:44 +0200 +0s ... 0s
#5 composed specs +0.005s ... 0.005s
#6 did output specs +0s ... 0.005s
#7 start showIntegratedCPUs +0s ... 0.005s
#8 getting avg benchmarks for device 6197 +0.011s ... 0.016s
#9 got single benchmarks 6197 +0.002s ... 0.019s
#10 getting avg benchmarks for device 8008 +0.004s ... 0.022s
#11 got single benchmarks 8008 +0.002s ... 0.024s
#12 getting avg benchmarks for device 4574 +0.004s ... 0.028s
#13 got single benchmarks 4574 +0.009s ... 0.037s
#14 got avg benchmarks for devices +0s ... 0.037s
#15 min, max, avg, median took s +0.042s ... 0.079s
#16 before gaming benchmark output +0s ... 0.079s
#17 Got 826 rows for game benchmarks. +0.042s ... 0.121s
#18 composed SQL query for gamebenchmarks +0s ... 0.121s
#19 got data and put it in $dataArray +0.008s ... 0.129s
#20 benchmarks composed for output. +0.042s ... 0.171s
#21 calculated avg scores. +0s ... 0.171s
#22 return log +0.001s ... 0.172s
Please share our article, every link counts!
Redaktion, 2017-09- 8 (Update: 2023-07- 1)
 Deutsch
 English
 Español
 Français
 Italiano
 Nederlands
 Polski
 Português
 Русский
 Türkçe
 Svenska
 Chinese
 Magyar