Intel HD Graphics (Cherry Trail) vs NVIDIA GeForce GTX 1060 Max-Q vs Intel HD Graphics (Bay Trail)
Intel HD Graphics (Cherry Trail) ► remove from comparison
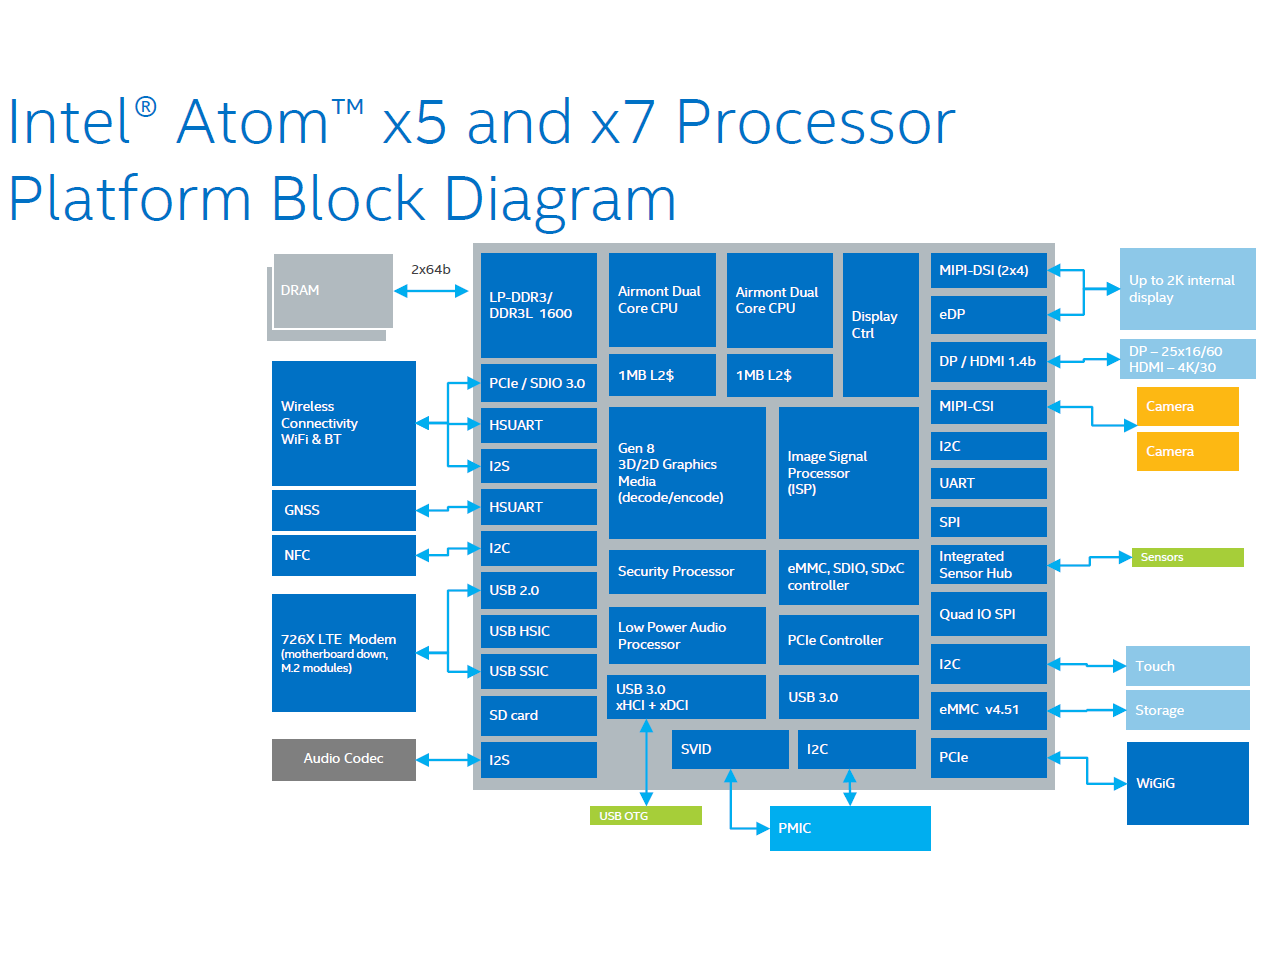
The Intel HD Graphics (Cherry Trail) is an integrated graphics card in the Cherry-Trail SoCs (e.g. Atom x7-Z8700). Based on a Broadwell GPU (Intel Gen8) and supports DirectX 11.2. Depending on the SoC offers 12 or 16 EUs.
Atom x7-Z8700: 16 EUs @ 200 - 600 MHz, dual-channel memory
In Windows, gaming is limited to less demanding or quite old games. Using Android, even high end 3D games should run fluently. For example Team Fortress 2 was running on the Surface 3 (x7-Z8700) only in lowest settings and 1280x720 fluently (11 - 69 fps range).
The integrated video decoder is able to display even 4K videos (H.264 tested) fluently.
The Intel HD Graphics GPU in our review sample of the MS Surface 3 (Atom x7-Z8700) only supported DisplayPort 1.1 as it seems, as 4K (3840x2160) with 30 Hz was the maximum Refresh Rate we could achieve (no 60 Hz selectable with the pre-installed drivers).
NVIDIA GeForce GTX 1060 Max-Q ► remove from comparison
The Nvidia GeForce GTX 1060 with the Max-Q design is a mobile high-end GPU from the Pascal series. It is designed for thin and light laptops and about 10-15% slower than a regular GTX 1060 for laptops based on the cooling capabilities. The base frequency (1063-1265 MHz) is also much lower than on the regular GTX 1060 (1506 MHz, at least -16%) and the Boost (1341-1480 MHz) is also much lower compared to 1708 MHz (at least -13%) for the regular GTX 1060. The memory clock, however, is identical.
The clock is not the only difference compared to the regular GTX 1060 though. The drivers for the Max-Q version were optimized for efficiency (and not performance; only for Max-Q models), there are optimized voltage converters for 1V operation, high-end cooling methods, and a 40 dB limit for the fan noise (with clock adjustments to ensure this at all times).
Features
The GP106 chip is produced in 16nm FinFET at TSMC and offers a range of new features, like DisplayPort 1.4 (ready), HDMI 2.0b, HDR, Simultaneous Multi-Projection (SMP) and improved H.265 video de- and encoding (PlayReady 3.0). A list of improvements and features can be found in our article on the Pascal architecture .
The power consumption of the Max-Q design is notably lower than the normal GTX 1060 for laptops and ranges between 60 and 70 Watt (TGP) according to Nvidia.
Intel HD Graphics (Bay Trail) ► remove from comparison
The Intel HD Graphics (Bay Trail) is a low-end integrated Bay Trail graphics card found in certain Atom models (Z3770 ), nettops (J2850 ) and notebook SoCs (N3510 ). It supports DirectX 11 and is based on the Ivy Bridge GPU. Clock rates and shader cores, however, are considerably lower.
Compared to Ivy Bridge, which offers either 6 or 16 Execution Units, the HD Graphics (Bay Trail) comes with only 4 EUs. The core clock is significantly lower as well. Depending on the specific model, the maximum Turbo Boost is 896 MHz or less and the memory controller can support DDR3(L), DDR3L-RS or LPDDR3 in single- or dual-channel operation.
The fastest notebook models equipped with this GPU nearly match the performance of the HD Graphics (Sandy Bridge) and the AMD Radeon HD 6310 . Therefore, older and less demanding Windows games like World of Warcraft or Half-Life 2 can be played fluently in very low settings. Performance is not sufficient for most modern titles.
Compared to competing ARM SoCs, Bay Trail outperforms the Adreno 320 (which can be found in different Qualcomm SoCs like the Snapdragon 600 ) and offers a performance similar to the Tegra 4 GPU. That is enough power to run even the most demanding Android games smoothly in very high resolutions as of 2013.
The integrated video decoder supports all popular codecs such as MPEG2, H.264, VC1, VP8 and MVC and is suitable for resolutions up to 4K up to 100 Mbit/s. The user can connect up to two displays via HDMI 1.4 (max. 1920 x 1080) or DisplayPort 1.2 (max. 2560 x 1600). Another new feature is the support for Wireless Display and Quick Sync, Intel's fast and power efficient H-264 hardware encoder. Some of these features are not available on all models.
Depending on the model, the power consumption of the entire SoC is somewhere between 2 and 10 W. The most efficient versions are therefore suitable for passively cooled tablets, whereas faster variants are used in larger subnotebooks with active cooling.
Intel HD Graphics (Cherry Trail) NVIDIA GeForce GTX 1060 Max-Q Intel HD Graphics (Bay Trail) HD Graphics Series Codename Cherry Trail N17P-G1 Max-Q Bay Trail Architecture Gen. 8 Pascal Gen. 7 Ivy Bridge Pipelines 16 - unified 1280 - unified 4 - unified Core Speed 200 - 600 (Boost) MHz 1063 - 1265 - 1341 - 1480 (Boost) MHz 311 - 896 (Boost) MHz Memory Bus Width 64/128 Bit 192 Bit 32/64/128 Bit Shared Memory yes no yes API DirectX 12 (FL 11_1), Shader 5.0, OpenGL 4.3 DirectX 12_1, OpenGL 4.5 DirectX 11, Shader 5.0, OpenGL 4.0, ES 3.0 technology 14 nm 16 nm 22 nm Date of Announcement 02.03.2015 30.05.2017 11.09.2013 Memory Speed 8000 MHz Memory Type GDDR5 Max. Amount of Memory 6.144 MB Power Consumption 60 - 70 Watt Transistors 4.4 Billion Features Multi-Projection, VR Ready, G-SYNC, Vulkan, Multi Monitor Notebook Size large
CPU in HD Graphics (Cherry Trail) GPU Base Speed GPU Boost / Turbo Intel Atom x7-Z8700 4 x 1600 MHz 200 MHz 600 MHz Intel Atom x5-Z8500 4 x 1440 MHz 200 MHz 600 MHz Intel Atom x5-Z8350 4 x 1440 MHz 200 MHz 500 MHz » show 2 more Intel Atom x5-Z8300 4 x 1440 MHz 200 MHz 500 MHz Intel Atom x5-E8000 4 x 1040 MHz, 5 W 320 MHz ? MHz min. - max. 200 - 320 MHz ? - 600 MHz
CPU in HD Graphics (Bay Trail) GPU Base Speed GPU Boost / Turbo Intel Pentium N3540 4 x 2160 MHz, 7.5 W 313 MHz 896 MHz Intel Pentium J2900 4 x 2410 MHz, 10 W 688 MHz 896 MHz Intel Pentium N3530 4 x 2160 MHz, 7.5 W 313 MHz 896 MHz » show 43 more Intel Pentium J2850 4 x 2400 MHz, 10 W 688 MHz 792 MHz Intel Pentium N3520 4 x 2167 MHz, 7.5 W 313 MHz 854 MHz Intel Celeron J1900 4 x 2000 MHz, 10 W 688 MHz 854 MHz Intel Atom Z3795 4 x 1590 MHz, <4 W 311 MHz 778 MHz Intel Atom Z3785 4 x 1490 MHz, <4 W 313 MHz 833 MHz Intel Atom Z3775 4 x 1460 MHz, <4 W 311 MHz 778 MHz Intel Atom Z3775D 4 x 1490 MHz, <4 W 311 MHz 792 MHz Intel Atom Z3770 4 x 1460 MHz, <4 W 311 MHz 667 MHz Intel Atom Z3770D 4 x 1500 MHz, 4 W 313 MHz 688 MHz Intel Celeron N2940 4 x 1830 MHz, 7.5 W 313 MHz 854 MHz Intel Celeron N2930 4 x 1830 MHz, 7.5 W 313 MHz 854 MHz Intel Celeron J1850 4 x 2000 MHz, 10 W 688 MHz 792 MHz Intel Pentium N3510 4 x 2000 MHz, 7.5 W 313 MHz 750 MHz Intel Celeron N2920 4 x 1860 MHz, 7.5 W 313 MHz 854 MHz Intel Atom E3845 4 x 1910 MHz, 10 W 542 MHz 792 MHz Intel Atom Z3736F 4 x 1330 MHz, 4 W 313 MHz 646 MHz Intel Atom Z3736G 4 x 1330 MHz, <4 W 313 MHz 646 MHz Intel Atom Z3745 4 x 1330 MHz, <4 W 311 MHz 778 MHz Intel Atom Z3745D 4 x 1330 MHz, <4 W 311 MHz 792 MHz Intel Atom Z3740 4 x 1330 MHz, <4 W 311 MHz 667 MHz Intel Atom Z3740D 4 x 1330 MHz, <4 W 313 MHz 688 MHz Intel Atom Z3735D 4 x 1330 MHz, <4 W 311 MHz 646 MHz Intel Atom Z3735E 4 x 1330 MHz, <4 W 311 MHz 646 MHz Intel Atom Z3735F 4 x 1330 MHz, <4 W 311 MHz 646 MHz Intel Atom Z3735G 4 x 1330 MHz, <4 W 311 MHz 646 MHz Intel Celeron J1800 2 x 2410 MHz, 10 W 688 MHz 792 MHz Intel Celeron N2840 2 x 2160 MHz, 7.5 W 313 MHz 792 MHz Intel Celeron J1750 2 x 2410 MHz, 10 W 688 MHz 750 MHz Intel Celeron N2910 4 x 1600 MHz, 7.5 W 313 MHz 756 MHz Intel Celeron N2830 2 x 2160 MHz, 7.5 W 313 MHz 750 MHz Intel Celeron N2820 2 x 2170 MHz, 7.5 W 313 MHz 756 MHz Intel Celeron N2815 2 x 1860 MHz, 7.5 W 313 MHz 756 MHz Intel Celeron N2810 2 x 2000 MHz, 7.5 W 313 MHz 756 MHz Intel Atom Z3680 2 x 1330 MHz, 4 W 311 MHz 667 MHz Intel Atom Z3680D 2 x 1330 MHz, 4 W 313 MHz 688 MHz Intel Celeron N2808 2 x 1580 MHz, 4.3 W 313 MHz 792 MHz Intel Celeron N2807 2 x 1580 MHz, 4.3 W 313 MHz 750 MHz Intel Celeron N2806 2 x 1580 MHz, 4.5 W 313 MHz 756 MHz Intel Atom E3827 2 x 1750 MHz, 8 W 542 MHz 792 MHz Intel Atom E3826 2 x 1460 MHz, 7 W 533 MHz 667 MHz Intel Celeron N2805 2 x 1460 MHz, 4.3 W 313 MHz 667 MHz Intel Atom E3825 2 x 1330 MHz, 6 W ? MHz 533 MHz Intel Atom E3815 1 x 1460 MHz, 5 W ? MHz 400 MHz min. - max. 200 - ? MHz 400 - 896 MHz
Benchmarks Performance Rating - 3DMark 11 + Fire Strike + Time Spy - HD Graphics (Cherry Trail)
0.1 pt (0%)
Intel HD Graphics (Cherry Trail)
...
max:
Performance Rating - 3DMark 11 + Fire Strike + Time Spy - GeForce GTX 1060 Max-Q
4.8 pt (14%)
...
NVIDIA GeForce GTX 1060 Max-Q
...
max:
Performance Rating - 3DMark 11 + Fire Strike + Time Spy - HD Graphics (Bay Trail)
0.1 pt (0%)
Intel HD Graphics (Bay Trail)
...
max:
3DMark - 3DMark Time Spy Score
min: 3271 avg: 3415 median: 3415 (10%) max: 3559 Points
3DMark - 3DMark Time Spy Graphics
min: 3138 avg: 3324 median: 3324 (9%) max: 3510 Points
3DMark - 3DMark Ice Storm Unlimited Graphics
min: 18563 avg: 20873 median: 19303 (2%) max: 27537 Points
min: 287286 avg: 346663 median: 367999 (42%) max: 384095 Points
min: 11835 avg: 14513 median: 14748.5 (2%) max: 17613 Points
3DMark - 3DMark Ice Storm Extreme Graphics
min: 71289 avg: 105162 median: 96536 (12%) max: 156285 Points
min: 4751 avg: 7342 median: 7498 (1%) max: 9234 Points
3DMark - 3DMark Cloud Gate Score
min: 769 avg: 1454 median: 1488 (2%) max: 1905 Points
min: 16358 avg: 24167 median: 24154.5 (26%) max: 32658 Points
min: 354 avg: 1182 median: 1188 (1%) max: 1703 Points
3DMark - 3DMark Cloud Gate Graphics
min: 1537 avg: 1851 median: 1783.5 (0%) max: 2272 Points
min: 42781 avg: 71376 median: 74101 (19%) max: 81720 Points
min: 362 avg: 1230 median: 1228.5 (0%) max: 1670 Points
3DMark - 3DMark Fire Strike Standard Score
min: 174 avg: 390.4 median: 248 (0%) max: 1059 Points
min: 8292 avg: 9159 median: 9148.5 (16%) max: 9936 Points
min: 83 avg: 185 median: 147 (0%) max: 495 Points
3DMark - 3DMark Fire Strike Standard Graphics
min: 193 avg: 233 median: 225 (0%) max: 281 Points
min: 9992 avg: 10659 median: 10430 (12%) max: 11366 Points
min: 90 avg: 149.1 median: 149 (0%) max: 200 Points
3DMark - 3DMark Ice Storm Graphics
min: 7544 avg: 16078 median: 17063.5 (2%) max: 23395 Points
min: 80051 avg: 144686 median: 118989 (14%) max: 265343 Points
min: 5056 avg: 15391 median: 16047 (2%) max: 21351 Points
3DMark - 3DMark Sling Shot (ES 3.0) Unlimited
min: 1445 avg: 1525 median: 1525 (7%) max: 1605 Points
3DMark - 3DMark Sling Shot (ES 3.0) Unlimited Graphics
min: 1598 avg: 1684 median: 1684 (4%) max: 1770 Points
3DMark - 3DMark Sling Shot Extreme (ES 3.1) Unlimited
min: 1072 avg: 1215 median: 1159 (6%) max: 1414 Points
3DMark - 3DMark Sling Shot Extreme (ES 3.1) Unlimited Graphics
min: 1058 avg: 1251 median: 1142 (3%) max: 1554 Points
3DMark 11 - 3DM11 Performance Score
min: 314 avg: 359.4 median: 343 (0%) max: 562 Points
min: 10176 avg: 11974 median: 11973 (17%) max: 13296 Points
min: 143 avg: 222.6 median: 216 (0%) max: 280 Points
3DMark 11 - 3DM11 Performance GPU
min: 278 avg: 319.9 median: 298 (0%) max: 494 Points
min: 12970 avg: 13581 median: 13333.5 (11%) max: 14487 Points
min: 122 avg: 192.1 median: 186.5 (0%) max: 237 Points
3DMark Vantage + Intel HD Graphics (Bay Trail) 3DMark Vantage - 3DM Vant. Perf. total
min: 507 avg: 666 median: 637 (0%) max: 846 Points
3DM Vant. Perf. GPU no PhysX + Intel HD Graphics (Bay Trail) 3DMark Vantage - 3DM Vant. Perf. GPU no PhysX
min: 395 avg: 512 median: 503 (0%) max: 667 Points
3DMark 2001SE - 3DMark 2001 - Standard
7727 Points (8%)
3DMark 03 - 3DMark 03 - Standard
min: 4226 avg: 4997 median: 5220 (3%) max: 5323 Points
3DMark 05 - 3DMark 05 - Standard
min: 2666 avg: 3195 median: 3331 (4%) max: 3445 Points
3DMark 06 3DMark 06 - Standard 1280x1024 + Intel HD Graphics (Cherry Trail)
min: 2403 avg: 2833 median: 2595 (3%) max: 3330 Points
3DMark 06 - Standard 1280x1024 + NVIDIA GeForce GTX 1060 Max-Q
34189 Points (45%)
3DMark 06 - Standard 1280x1024 + Intel HD Graphics (Bay Trail)
min: 814 avg: 1785 median: 1866 (2%) max: 2151 Points
3DMark 06 - Standard 1024x768 + Intel HD Graphics (Cherry Trail)
2877 Points (4%)
3DMark 06 - Score Unknown Settings + Intel HD Graphics (Bay Trail)
2108 Points (3%)
3DMark 06 - Standard 1280x800 + Intel HD Graphics (Bay Trail)
2087 Points (3%)
Unigine Valley 1.0 - Unigine Valley 1.0 DX
1.2 fps (0%)
Unigine Heaven 3.0 - Unigine Heaven 3.0 DX 11
3.6 fps (1%)
Unigine Heaven 2.1 - Heaven 2.1 high
5.7 fps (1%)
min: 2.4 avg: 2.8 median: 2.8 (1%) max: 3.4 fps
SPECviewperf 11 + NVIDIA GeForce GTX 1060 Max-Q SPECviewperf 11 - specvp11 snx-01
9.5 fps (6%)
specvp11 tcvis-02 + NVIDIA GeForce GTX 1060 Max-Q SPECviewperf 11 - specvp11 tcvis-02
2.8 fps (2%)
specvp11 sw-02 + NVIDIA GeForce GTX 1060 Max-Q SPECviewperf 11 - specvp11 sw-02
18.4 fps (14%)
specvp11 proe-05 + NVIDIA GeForce GTX 1060 Max-Q SPECviewperf 11 - specvp11 proe-05
2.8 fps (3%)
specvp11 maya-03 + NVIDIA GeForce GTX 1060 Max-Q SPECviewperf 11 - specvp11 maya-03
17.3 fps (13%)
specvp11 lightwave-01 + NVIDIA GeForce GTX 1060 Max-Q SPECviewperf 11 - specvp11 lightwave-01
20.1 fps (22%)
specvp11 ensight-04 + NVIDIA GeForce GTX 1060 Max-Q SPECviewperf 11 - specvp11 ensight-04
109.7 fps (52%)
specvp11 catia-03 + NVIDIA GeForce GTX 1060 Max-Q SPECviewperf 11 - specvp11 catia-03
19.7 fps (10%)
SPECviewperf 12 + NVIDIA GeForce GTX 1060 Max-Q SPECviewperf 12 - specvp12 sw-03
43.9 fps (11%)
specvp12 snx-02 + NVIDIA GeForce GTX 1060 Max-Q SPECviewperf 12 - specvp12 snx-02
5.4 fps (1%)
specvp12 showcase-01 + NVIDIA GeForce GTX 1060 Max-Q SPECviewperf 12 - specvp12 showcase-01
56.2 fps (12%)
specvp12 mediacal-01 + NVIDIA GeForce GTX 1060 Max-Q SPECviewperf 12 - specvp12 mediacal-01
27.5 fps (7%)
specvp12 maya-04 + NVIDIA GeForce GTX 1060 Max-Q SPECviewperf 12 - specvp12 maya-04
92 fps (25%)
specvp12 energy-01 + NVIDIA GeForce GTX 1060 Max-Q SPECviewperf 12 - specvp12 energy-01
5.2 fps (5%)
specvp12 creo-01 + NVIDIA GeForce GTX 1060 Max-Q SPECviewperf 12 - specvp12 creo-01
34.8 fps (14%)
specvp12 catia-04 + NVIDIA GeForce GTX 1060 Max-Q SPECviewperf 12 - specvp12 catia-04
45.4 fps (8%)
Cinebench R10 Cinebench R10 Shading (32bit) + Intel HD Graphics (Cherry Trail) Cinebench R10 - Cinebench R10 Shading (32bit)
min: 1192 avg: 2009 median: 1973 (1%) max: 2551 Points
Cinebench R10 Shading (32bit) + NVIDIA GeForce GTX 1060 Max-Q
min: 6822 avg: 8146 median: 6829.5 (5%) max: 11275 Points
Cinebench R10 Shading (32bit) + Intel HD Graphics (Bay Trail)
min: 898 avg: 2014 median: 1991.5 (1%) max: 2889 Points
Cinebench R11.5 Cinebench R11.5 OpenGL 64 Bit + Intel HD Graphics (Cherry Trail) Cinebench R11.5 - Cinebench R11.5 OpenGL 64 Bit
min: 4.01 avg: 8.8 median: 8.4 (3%) max: 11.71 fps
Cinebench R11.5 OpenGL 64 Bit + NVIDIA GeForce GTX 1060 Max-Q
min: 59.6 avg: 68.9 median: 71.7 (25%) max: 76.2 fps
Cinebench R11.5 OpenGL 64 Bit + Intel HD Graphics (Bay Trail)
min: 0.37 avg: 6.2 median: 6.4 (2%) max: 7.69 fps
Cinebench R15 + Intel HD Graphics (Cherry Trail) Cinebench R15 - Cinebench R15 OpenGL 64 Bit
min: 6.64 avg: 10.3 median: 9.7 (1%) max: 15.52 fps
Cinebench R15 OpenGL 64 Bit + NVIDIA GeForce GTX 1060 Max-Q
min: 88.5 avg: 107.1 median: 110.6 (6%) max: 120.1 fps
Cinebench R15 OpenGL 64 Bit + Intel HD Graphics (Bay Trail) min: 2.88 avg: 5 median: 5.5 (0%) max: 6.55 fps
Cinebench R15 OpenGL Ref. Match 64 Bit + Intel HD Graphics (Cherry Trail) Cinebench R15 - Cinebench R15 OpenGL Ref. Match 64 Bit
min: 98 avg: 98 median: 98 (98%) max: 98.6 %
Cinebench R15 OpenGL Ref. Match 64 Bit + NVIDIA GeForce GTX 1060 Max-Q
99.6 % (100%)
Cinebench R15 OpenGL Ref. Match 64 Bit + Intel HD Graphics (Bay Trail)
min: 63 avg: 96.1 median: 97.8 (98%) max: 97.8 %
GFXBench - GFXBench Car Chase Offscreen
min: 6.3 avg: 7.3 median: 7 (1%) max: 9 fps
GFXBench 3.1 - GFXBench Manhattan ES 3.1 Offscreen
min: 9.2 avg: 10.8 median: 11 (0%) max: 13 fps
5.2 fps (0%)
GFXBench 3.0 - GFXBench 3.0 Manhattan Offscreen
min: 8.4 avg: 13.8 median: 13.5 (1%) max: 18 fps
398 fps (23%)
min: 6 avg: 9.7 median: 8.8 (1%) max: 16 fps
GFXBench (DX / GLBenchmark) 2.7 + Intel HD Graphics (Cherry Trail) GFXBench (DX / GLBenchmark) 2.7 - GFXBench T-Rex HD Offscreen C24Z16
min: 22 avg: 30.5 median: 32 (0%) max: 38.5 fps
GFXBench T-Rex HD Offscreen C24Z16 + Intel HD Graphics (Bay Trail) min: 6 avg: 15.7 median: 16 (0%) max: 20.2 fps
Basemark ES 2.0 - Basemark ES 2.0
min: 45.08 avg: 49.1 median: 49.1 (81%) max: 53.1 fps
Basemark X 1.0 - Basemark X 1.0 Off-Screen
10.1 fps (48%)
Basemark X 1.1 - Basemark X 1.1 High Quality
min: 3008 avg: 6663 median: 8456 (19%) max: 8524 Points
Basemark X 1.1 - Basemark X 1.1 Medium Quality
min: 4802 avg: 12880 median: 14509 (32%) max: 17701 Points
NenaMark2 - NenaMark2 Score
min: 59 avg: 59.4 median: 59.4 (88%) max: 59.7 fps
LuxMark v2.0 64Bit - LuxMark v2.0 Room GPU
min: 48 avg: 58.7 median: 59 (0%) max: 69 Samples/s
1614 Samples/s (7%)
min: 25 avg: 28.5 median: 27 (0%) max: 35 Samples/s
LuxMark v2.0 64Bit - LuxMark v2.0 Sala GPU
min: 69 avg: 87.7 median: 89 (0%) max: 105 Samples/s
2924 Samples/s (5%)
min: 26 avg: 29 median: 29 (0%) max: 34 Samples/s
ComputeMark v2.1 - ComputeMark v2.1 Result
277 Points (0%)
min: 7555 avg: 7747 median: 7653 (8%) max: 8202 Points
min: 160 avg: 172.8 median: 174 (0%) max: 192 Points
PassMark PerformanceTest Mobile V1 - PerformanceTest Mobile V1 2D Graphics Tests
min: 3822 avg: 4036 median: 3866 (4%) max: 4588 Points
PassMark PerformanceTest Mobile V1 - PerformanceTest Mobile V1 3D Graphics Tests
min: 1058 avg: 1251 median: 1228 (2%) max: 1488 Points
Smartbench 2012 - Smartbench 2012 Gaming Index
min: 2679 avg: 3414 median: 3385 (74%) max: 4274 Points
Power Consumption - Witcher 3 Power Consumption *
min: 89 avg: 105 median: 101.9 (22%) max: 123.1 Watt
Power Consumption - Witcher 3 ultra Power Efficiency
min: 0.3006 avg: 0.3 median: 0.3 (31%) max: 0.3955 fps per Watt
Emissions Witcher 3 Fan Noise + NVIDIA GeForce GTX 1060 Max-Q Emissions - Witcher 3 Fan Noise
min: 37.6 avg: 44.1 median: 44.1 (71%) max: 51.3 dB(A)
Clock Speed - GPU Clock Witcher 3 ultra
1440 MHz (56%)
Average Benchmarks Intel HD Graphics (Cherry Trail) → 100% n=17 Average Benchmarks NVIDIA GeForce GTX 1060 Max-Q → 2363% n=17 Average Benchmarks Intel HD Graphics (Bay Trail) → 70% n=17
- Range of benchmark values for this graphics card
- Average benchmark values for this graphics card
* Smaller numbers mean a higher performance
1 This benchmark is not used for the average calculation
Game Benchmarks The following benchmarks stem from our benchmarks of review laptops. The performance depends on the used graphics memory, clock rate, processor, system settings, drivers, and operating systems. So the results don't have to be representative for all laptops with this GPU. For detailed information on the benchmark results, click on the fps number.
GeForce GTX 1060 Max-Q:
110 [X] Dell G5 15 5587 Intel Core i5-8300H 2.3GHz
GeForce GTX 1060 Max-Q
min:
89 fps, max:
137 fps
fps
GeForce GTX 1060 Max-Q:
70 [X] Dell G5 15 5587 Intel Core i5-8300H 2.3GHz
GeForce GTX 1060 Max-Q
min:
5 fps, max:
84 fps
fps
GeForce GTX 1060 Max-Q:
65 [X] Dell G5 15 5587 Intel Core i5-8300H 2.3GHz
GeForce GTX 1060 Max-Q
min:
58 fps, max:
79 fps
fps
GeForce GTX 1060 Max-Q:
48 [X] Dell G5 15 5587 Intel Core i5-8300H 2.3GHz
GeForce GTX 1060 Max-Q
min:
4 fps, max:
71 fps
fps
GeForce GTX 1060 Max-Q:
20 [X] Dell G5 15 5587 Intel Core i5-8300H 2.3GHz
GeForce GTX 1060 Max-Q
min:
17 fps, max:
24 fps
fps
GeForce GTX 1060 Max-Q:
60 110 [X] Dell G5 15 5587 Intel Core i5-8300H 2.3GHz
GeForce GTX 1060 Max-Q
min:
90 fps, max:
131 fps
~ 85 fps
GeForce GTX 1060 Max-Q:
58 66.8 [X] Dell G5 15 5587 Intel Core i5-8300H 2.3GHz
GeForce GTX 1060 Max-Q
min:
55 fps, max:
74 fps
~ 62 fps
GeForce GTX 1060 Max-Q:
52.7 [X] Dell G5 15 5587 Intel Core i5-8300H 2.3GHz
GeForce GTX 1060 Max-Q
min:
45 fps, max:
61 fps
56 ~ 54 fps
GeForce GTX 1060 Max-Q:
38 [X] Dell G5 15 5587 Intel Core i5-8300H 2.3GHz
GeForce GTX 1060 Max-Q
min:
30 fps, max:
45 fps
41 ~ 40 fps
GeForce GTX 1060 Max-Q:
12 [X] Dell G5 15 5587 Intel Core i5-8300H 2.3GHz
GeForce GTX 1060 Max-Q
min:
10 fps, max:
14 fps
fps
GeForce GTX 1060 Max-Q:
73 109 ~ 91 fps
GeForce GTX 1060 Max-Q:
47.2 59 ~ 53 fps
GeForce GTX 1060 Max-Q:
33.9 43 ~ 38 fps
GeForce GTX 1060 Max-Q:
14.6 fps
GeForce GTX 1060 Max-Q:
178 [X] Dell G5 15 5587 Intel Core i5-8300H 2.3GHz
GeForce GTX 1060 Max-Q
min:
133 fps, max:
220 fps
fps
GeForce GTX 1060 Max-Q:
132.6 [X] Dell G5 15 5587 Intel Core i5-8300H 2.3GHz
GeForce GTX 1060 Max-Q
min:
101 fps, max:
157 fps
fps
GeForce GTX 1060 Max-Q:
115.7 [X] Dell G5 15 5587 Intel Core i5-8300H 2.3GHz
GeForce GTX 1060 Max-Q
min:
101 fps, max:
127 fps
fps
GeForce GTX 1060 Max-Q:
72.8 [X] Dell G5 15 5587 Intel Core i5-8300H 2.3GHz
GeForce GTX 1060 Max-Q
min:
64 fps, max:
79 fps
fps
GeForce GTX 1060 Max-Q:
135.5 [X] Dell G5 15 5587 Intel Core i5-8300H 2.3GHz
GeForce GTX 1060 Max-Q
min:
97 fps, max:
192 fps
fps
GeForce GTX 1060 Max-Q:
93.4 [X] Dell G5 15 5587 Intel Core i5-8300H 2.3GHz
GeForce GTX 1060 Max-Q
min:
66 fps, max:
107 fps
fps
GeForce GTX 1060 Max-Q:
81.5 [X] Dell G5 15 5587 Intel Core i5-8300H 2.3GHz
GeForce GTX 1060 Max-Q
min:
66 fps, max:
95 fps
fps
GeForce GTX 1060 Max-Q:
62.2 [X] Dell G5 15 5587 Intel Core i5-8300H 2.3GHz
GeForce GTX 1060 Max-Q
min:
54 fps, max:
71 fps
fps
GeForce GTX 1060 Max-Q:
117.9 [X] Dell G5 15 5587 Intel Core i5-8300H 2.3GHz
GeForce GTX 1060 Max-Q
min:
76 fps, max:
169 fps
fps
GeForce GTX 1060 Max-Q:
89.1 [X] Dell G5 15 5587 Intel Core i5-8300H 2.3GHz
GeForce GTX 1060 Max-Q
min:
65 fps, max:
113 fps
fps
GeForce GTX 1060 Max-Q:
78.5 [X] Dell G5 15 5587 Intel Core i5-8300H 2.3GHz
GeForce GTX 1060 Max-Q
min:
53 fps, max:
96 fps
fps
GeForce GTX 1060 Max-Q:
66.6 [X] Dell G5 15 5587 Intel Core i5-8300H 2.3GHz
GeForce GTX 1060 Max-Q
min:
42 fps, max:
92 fps
fps
GeForce GTX 1060 Max-Q:
23.8 [X] Dell G5 15 5587 Intel Core i5-8300H 2.3GHz
GeForce GTX 1060 Max-Q
min:
16 fps, max:
27 fps
fps
GeForce GTX 1060 Max-Q:
174.9 [X] Dell G5 15 5587 Intel Core i5-8300H 2.3GHz
GeForce GTX 1060 Max-Q
min:
118 fps, max:
251 fps
fps
GeForce GTX 1060 Max-Q:
163.3 [X] Dell G5 15 5587 Intel Core i5-8300H 2.3GHz
GeForce GTX 1060 Max-Q
min:
110 fps, max:
227 fps
fps
GeForce GTX 1060 Max-Q:
91.9 [X] Dell G5 15 5587 Intel Core i5-8300H 2.3GHz
GeForce GTX 1060 Max-Q
min:
68 fps, max:
112 fps
fps
GeForce GTX 1060 Max-Q:
70.9 [X] Dell G5 15 5587 Intel Core i5-8300H 2.3GHz
GeForce GTX 1060 Max-Q
min:
53 fps, max:
88 fps
fps
GeForce GTX 1060 Max-Q:
31.3 [X] Dell G5 15 5587 Intel Core i5-8300H 2.3GHz
GeForce GTX 1060 Max-Q
min:
24 fps, max:
38 fps
fps
GeForce GTX 1060 Max-Q:
77 fps
GeForce GTX 1060 Max-Q:
67 fps
GeForce GTX 1060 Max-Q:
62 fps
GeForce GTX 1060 Max-Q:
52 fps
GeForce GTX 1060 Max-Q:
21 fps
GeForce GTX 1060 Max-Q:
94.7 fps
GeForce GTX 1060 Max-Q:
85.4 fps
GeForce GTX 1060 Max-Q:
71.4 fps
GeForce GTX 1060 Max-Q:
17.6 fps
GeForce GTX 1060 Max-Q:
108.1 fps
GeForce GTX 1060 Max-Q:
83.5 fps
GeForce GTX 1060 Max-Q:
69.6 fps
GeForce GTX 1060 Max-Q:
57.2 fps
GeForce GTX 1060 Max-Q:
17 fps
GeForce GTX 1060 Max-Q:
128 fps
GeForce GTX 1060 Max-Q:
81 82 84 ~ 82 fps
GeForce GTX 1060 Max-Q:
60 62 65 ~ 62 fps
GeForce GTX 1060 Max-Q:
46 46 48 ~ 47 fps
GeForce GTX 1060 Max-Q:
17 27 ~ 22 fps
GeForce GTX 1060 Max-Q:
290.6 [X] Dell G5 15 5587 Intel Core i5-8300H 2.3GHz
GeForce GTX 1060 Max-Q
min:
266 fps, max:
334 fps
fps
GeForce GTX 1060 Max-Q:
277.9 [X] Dell G5 15 5587 Intel Core i5-8300H 2.3GHz
GeForce GTX 1060 Max-Q
min:
249 fps, max:
315 fps
fps
GeForce GTX 1060 Max-Q:
252.3 [X] Dell G5 15 5587 Intel Core i5-8300H 2.3GHz
GeForce GTX 1060 Max-Q
min:
217 fps, max:
289 fps
fps
GeForce GTX 1060 Max-Q:
245.7 [X] Dell G5 15 5587 Intel Core i5-8300H 2.3GHz
GeForce GTX 1060 Max-Q
min:
199 fps, max:
279 fps
fps
GeForce GTX 1060 Max-Q:
130 [X] Dell G5 15 5587 Intel Core i5-8300H 2.3GHz
GeForce GTX 1060 Max-Q
min:
113 fps, max:
150 fps
fps
GeForce GTX 1060 Max-Q:
109 fps
GeForce GTX 1060 Max-Q:
48 fps
GeForce GTX 1060 Max-Q:
35.5 fps
GeForce GTX 1060 Max-Q:
25.6 fps
GeForce GTX 1060 Max-Q:
8.5 fps
GeForce GTX 1060 Max-Q:
94 fps
GeForce GTX 1060 Max-Q:
77 98 ~ 88 fps
GeForce GTX 1060 Max-Q:
56 60 ~ 58 fps
GeForce GTX 1060 Max-Q:
26 fps
GeForce GTX 1060 Max-Q:
141.9 [X] Dell G5 15 5587 Intel Core i5-8300H 2.3GHz
GeForce GTX 1060 Max-Q
min:
126 fps, max:
145 fps
fps
GeForce GTX 1060 Max-Q:
92.5 [X] Dell G5 15 5587 Intel Core i5-8300H 2.3GHz
GeForce GTX 1060 Max-Q
min:
85 fps, max:
101 fps
fps
GeForce GTX 1060 Max-Q:
85.6 [X] Dell G5 15 5587 Intel Core i5-8300H 2.3GHz
GeForce GTX 1060 Max-Q
min:
63 fps, max:
100 fps
fps
GeForce GTX 1060 Max-Q:
63.3 [X] Dell G5 15 5587 Intel Core i5-8300H 2.3GHz
GeForce GTX 1060 Max-Q
min:
53 fps, max:
69 fps
fps
GeForce GTX 1060 Max-Q:
12.9 [X] Dell G5 15 5587 Intel Core i5-8300H 2.3GHz
GeForce GTX 1060 Max-Q
min:
1 fps, max:
25 fps
fps
100%
HD Graphics (Cherry Trail):
21.4 fps
125%
HD Graphics (Bay Trail):
26.7 [X] Intel NUC Kit DN2820FYKH Intel Celeron N2820 2.2GHz
HD Graphics (Bay Trail)
min:
23 fps
fps
HD Graphics (Bay Trail):
23.4 [X] Intel NUC Kit DN2820FYKH Intel Celeron N2820 2.2GHz
HD Graphics (Bay Trail)
min:
21 fps
fps
HD Graphics (Bay Trail):
6 [X] Intel NUC Kit DN2820FYKH Intel Celeron N2820 2.2GHz
HD Graphics (Bay Trail)
fps
GeForce GTX 1060 Max-Q:
28.8 fps
100%
HD Graphics (Cherry Trail):
15.5 fps
1613%
GeForce GTX 1060 Max-Q:
250 fps
81%
HD Graphics (Bay Trail):
12.6 [X] Intel NUC Kit DN2820FYKH Intel Celeron N2820 2.2GHz
HD Graphics (Bay Trail)
min:
7 fps, max:
15 fps
fps
GeForce GTX 1060 Max-Q:
194 216 ~ 205 fps
GeForce GTX 1060 Max-Q:
134 155 ~ 145 fps
GeForce GTX 1060 Max-Q:
56.5 fps
GeForce GTX 1060 Max-Q:
116 126 ~ 121 fps
GeForce GTX 1060 Max-Q:
65 fps
GeForce GTX 1060 Max-Q:
58.7 fps
GeForce GTX 1060 Max-Q:
33.2 fps
GeForce GTX 1060 Max-Q:
19.4 fps
GeForce GTX 1060 Max-Q:
92.3 fps
GeForce GTX 1060 Max-Q:
87.8 fps
GeForce GTX 1060 Max-Q:
63.9 fps
GeForce GTX 1060 Max-Q:
25.7 fps
GeForce GTX 1060 Max-Q:
169 fps
GeForce GTX 1060 Max-Q:
93 fps
GeForce GTX 1060 Max-Q:
76.1 fps
GeForce GTX 1060 Max-Q:
25.1 fps
GeForce GTX 1060 Max-Q:
101 fps
GeForce GTX 1060 Max-Q:
56.8 fps
GeForce GTX 1060 Max-Q:
39.4 fps
GeForce GTX 1060 Max-Q:
18.9 fps
GeForce GTX 1060 Max-Q:
85.4 fps
GeForce GTX 1060 Max-Q:
64.7 fps
GeForce GTX 1060 Max-Q:
54.8 fps
GeForce GTX 1060 Max-Q:
23.7 fps
GeForce GTX 1060 Max-Q:
124 fps
GeForce GTX 1060 Max-Q:
91.6 fps
GeForce GTX 1060 Max-Q:
81.7 fps
GeForce GTX 1060 Max-Q:
34.6 fps
GeForce GTX 1060 Max-Q:
144 fps
GeForce GTX 1060 Max-Q:
79 fps
GeForce GTX 1060 Max-Q:
67.3 fps
GeForce GTX 1060 Max-Q:
24.8 fps
100%
HD Graphics (Cherry Trail):
22.6 [X] Chuwi Hi12 Intel Atom x5-Z8300 1.4GHz
HD Graphics (Cherry Trail)
min:
21 fps, max:
27 fps
fps
GeForce GTX 1060 Max-Q:
154 fps
GeForce GTX 1060 Max-Q:
76 fps
GeForce GTX 1060 Max-Q:
67.8 fps
GeForce GTX 1060 Max-Q:
25.3 fps
GeForce GTX 1060 Max-Q:
55.7 [X] Lenovo Legion Y520-15IKBM 80YY001APB Intel Core i5-7300HQ 2.5GHz
GeForce GTX 1060 Max-Q
fps
GeForce GTX 1060 Max-Q:
36.2 40.7 [X] Lenovo Legion Y520-15IKBM 80YY001APB Intel Core i5-7300HQ 2.5GHz
GeForce GTX 1060 Max-Q
~ 38 fps
GeForce GTX 1060 Max-Q:
330 fps
GeForce GTX 1060 Max-Q:
250 fps
GeForce GTX 1060 Max-Q:
248 fps
GeForce GTX 1060 Max-Q:
95.2 fps
GeForce GTX 1060 Max-Q:
110.3 fps
GeForce GTX 1060 Max-Q:
93 93.8 ~ 93 fps
GeForce GTX 1060 Max-Q:
50.2 52 ~ 51 fps
GeForce GTX 1060 Max-Q:
26.7 27.6 ~ 27 fps
GeForce GTX 1060 Max-Q:
15.8 16.3 ~ 16 fps
GeForce GTX 1060 Max-Q:
130 fps
GeForce GTX 1060 Max-Q:
66.4 fps
GeForce GTX 1060 Max-Q:
59.6 fps
GeForce GTX 1060 Max-Q:
20.5 fps
GeForce GTX 1060 Max-Q:
299.2 fps
GeForce GTX 1060 Max-Q:
266.2 fps
GeForce GTX 1060 Max-Q:
165 165.8 ~ 165 fps
GeForce GTX 1060 Max-Q:
50.3 fps
GeForce GTX 1060 Max-Q:
127 fps
GeForce GTX 1060 Max-Q:
91.1 fps
GeForce GTX 1060 Max-Q:
86.2 fps
GeForce GTX 1060 Max-Q:
28.4 fps
GeForce GTX 1060 Max-Q:
75.8 fps
GeForce GTX 1060 Max-Q:
59.8 62.2 ~ 61 fps
GeForce GTX 1060 Max-Q:
52.9 53.2 ~ 53 fps
GeForce GTX 1060 Max-Q:
20.8 21 ~ 21 fps
GeForce GTX 1060 Max-Q:
127 fps
GeForce GTX 1060 Max-Q:
61.9 fps
GeForce GTX 1060 Max-Q:
48.8 fps
GeForce GTX 1060 Max-Q:
22.1 fps
GeForce GTX 1060 Max-Q:
81 fps
GeForce GTX 1060 Max-Q:
71 fps
GeForce GTX 1060 Max-Q:
53 fps
GeForce GTX 1060 Max-Q:
22 fps
100%
HD Graphics (Cherry Trail):
11.5 fps
100%
HD Graphics (Cherry Trail):
7 fps
3200%
GeForce GTX 1060 Max-Q:
224 fps
GeForce GTX 1060 Max-Q:
126 fps
GeForce GTX 1060 Max-Q:
102 fps
GeForce GTX 1060 Max-Q:
37.3 fps
100%
HD Graphics (Cherry Trail):
8.8 fps
100%
HD Graphics (Cherry Trail):
4.8 fps
3917%
GeForce GTX 1060 Max-Q:
188 fps
GeForce GTX 1060 Max-Q:
93 fps
GeForce GTX 1060 Max-Q:
80.9 fps
GeForce GTX 1060 Max-Q:
29.3 fps
GeForce GTX 1060 Max-Q:
82.6 fps
GeForce GTX 1060 Max-Q:
65.8 fps
GeForce GTX 1060 Max-Q:
29.4 fps
GeForce GTX 1060 Max-Q:
22.2 fps
GeForce GTX 1060 Max-Q:
73.9 78.4 ~ 76 fps
GeForce GTX 1060 Max-Q:
61.3 64.6 ~ 63 fps
GeForce GTX 1060 Max-Q:
25.8 fps
HD Graphics (Bay Trail):
0 (!) [X] Intel NUC Kit DN2820FYKH Intel Celeron N2820 2.2GHz
HD Graphics (Bay Trail)
fps
100%
HD Graphics (Cherry Trail):
8.1 fps
100%
HD Graphics (Cherry Trail):
3.9 fps
100%
HD Graphics (Cherry Trail):
13.9 [X] Chuwi Hi12 Intel Atom x5-Z8300 1.4GHz
HD Graphics (Cherry Trail)
min:
7 fps, max:
19 fps
16.8 ~ 15 fps
81%
HD Graphics (Bay Trail):
12.1 [X] Intel NUC Kit DN2820FYKH Intel Celeron N2820 2.2GHz
HD Graphics (Bay Trail)
min:
5 fps, max:
18 fps
fps
100%
HD Graphics (Cherry Trail):
15.1 fps
72%
HD Graphics (Bay Trail):
10.8 [X] Intel NUC Kit DN2820FYKH Intel Celeron N2820 2.2GHz
HD Graphics (Bay Trail)
min:
10 fps, max:
12 fps
fps
100%
HD Graphics (Cherry Trail):
9.8 fps
GeForce GTX 1060 Max-Q:
60 fps
GeForce GTX 1060 Max-Q:
60 60 ~ 60 fps
GeForce GTX 1060 Max-Q:
42 fps
100%
HD Graphics (Cherry Trail):
20 [X] Chuwi Hi12 Intel Atom x5-Z8300 1.4GHz
HD Graphics (Cherry Trail)
min:
18 fps
fps
124%
HD Graphics (Bay Trail):
24.7 [X] Intel NUC Kit DN2820FYKH Intel Celeron N2820 2.2GHz
HD Graphics (Bay Trail)
min:
22.2 fps
fps
100%
HD Graphics (Cherry Trail):
15.2 [X] Chuwi Hi12 Intel Atom x5-Z8300 1.4GHz
HD Graphics (Cherry Trail)
min:
13 fps
fps
64%
HD Graphics (Bay Trail):
9.7 [X] Intel NUC Kit DN2820FYKH Intel Celeron N2820 2.2GHz
HD Graphics (Bay Trail)
min:
8.8 fps
fps
100%
HD Graphics (Cherry Trail):
7.2 [X] Chuwi Hi12 Intel Atom x5-Z8300 1.4GHz
HD Graphics (Cherry Trail)
min:
6 fps
fps
76%
HD Graphics (Bay Trail):
5.5 [X] Intel NUC Kit DN2820FYKH Intel Celeron N2820 2.2GHz
HD Graphics (Bay Trail)
min:
-1.4 fps
fps
HD Graphics (Bay Trail):
5.4 [X] Intel NUC Kit DN2820FYKH Intel Celeron N2820 2.2GHz
HD Graphics (Bay Trail)
min:
-3 fps
fps
GeForce GTX 1060 Max-Q:
129 129 ~ 129 fps
GeForce GTX 1060 Max-Q:
72 [X] Lenovo Legion Y520-15IKBM 80YY001APB Intel Core i5-7300HQ 2.5GHz
GeForce GTX 1060 Max-Q
74 81 81 ~ 77 fps
GeForce GTX 1060 Max-Q:
48 [X] Lenovo Legion Y520-15IKBM 80YY001APB Intel Core i5-7300HQ 2.5GHz
GeForce GTX 1060 Max-Q
49 53 54 ~ 51 fps
GeForce GTX 1060 Max-Q:
26 26 ~ 26 fps
100%
HD Graphics (Cherry Trail):
20.1 fps
114%
HD Graphics (Bay Trail):
22 [X] Intel NUC Kit DN2820FYKH Intel Celeron N2820 2.2GHz
HD Graphics (Bay Trail)
min:
16 fps, max:
33 fps
24.2 ~ 23 fps
100%
HD Graphics (Cherry Trail):
12.5 fps
48%
HD Graphics (Bay Trail):
0 (!) [X] Intel NUC Kit DN2820FYKH Intel Celeron N2820 2.2GHz
HD Graphics (Bay Trail)
12.5 ~ 6 fps
100%
HD Graphics (Cherry Trail):
10.8 (!) [X] Microsoft Surface 3 Intel Atom x7-Z8700 1.6GHz
HD Graphics (Cherry Trail)
fps
1452%
GeForce GTX 1060 Max-Q:
156.8 fps
GeForce GTX 1060 Max-Q:
151.6 fps
GeForce GTX 1060 Max-Q:
106.5 fps
GeForce GTX 1060 Max-Q:
61.8 fps
GeForce GTX 1060 Max-Q:
53.7 fps
HD Graphics (Bay Trail):
7.3 fps
HD Graphics (Bay Trail):
5.1 fps
HD Graphics (Bay Trail):
3.2 fps
HD Graphics (Bay Trail):
1.7 fps
HD Graphics (Bay Trail):
8.1 fps
HD Graphics (Bay Trail):
4.7 fps
100%
HD Graphics (Cherry Trail):
9.5 fps
74%
HD Graphics (Bay Trail):
7 fps
100%
HD Graphics (Cherry Trail):
5.7 fps
81%
HD Graphics (Bay Trail):
4.6 fps
HD Graphics (Bay Trail):
5.6 fps
HD Graphics (Bay Trail):
3.8 fps
HD Graphics (Bay Trail):
4.3 fps
HD Graphics (Bay Trail):
2.4 fps
100%
HD Graphics (Cherry Trail):
16.2 fps
68%
HD Graphics (Bay Trail):
9.6 11.5 ~ 11 fps
100%
HD Graphics (Cherry Trail):
6.1 fps
70%
HD Graphics (Bay Trail):
4.3 fps
100%
HD Graphics (Cherry Trail):
16 fps
81%
HD Graphics (Bay Trail):
12 14 ~ 13 fps
100%
HD Graphics (Cherry Trail):
12 fps
100%
HD Graphics (Bay Trail):
12 fps
HD Graphics (Bay Trail):
5.2 fps
HD Graphics (Bay Trail):
3.6 fps
HD Graphics (Bay Trail):
3.7 fps
HD Graphics (Bay Trail):
2.5 fps
HD Graphics (Bay Trail):
9.1 fps
HD Graphics (Bay Trail):
5.1 fps
GeForce GTX 1060 Max-Q:
170.2 fps
HD Graphics (Bay Trail):
8.5 fps
GeForce GTX 1060 Max-Q:
139.9 fps
HD Graphics (Bay Trail):
6.1 fps
GeForce GTX 1060 Max-Q:
96.7 fps
GeForce GTX 1060 Max-Q:
76.9 fps
100%
HD Graphics (Cherry Trail):
15.6 fps
79%
HD Graphics (Bay Trail):
12.4 fps
HD Graphics (Bay Trail):
8.5 fps
77%
HD Graphics (Bay Trail):
53.7 56 ~ 55 fps
44%
HD Graphics (Bay Trail):
6.6 7 ~ 7 fps
100%
HD Graphics (Cherry Trail):
5.5 10 ~ 8 fps
HD Graphics (Bay Trail):
8.4 fps
HD Graphics (Bay Trail):
5.9 fps
100%
HD Graphics (Cherry Trail):
22 27.3 ~ 25 fps
148%
HD Graphics (Bay Trail):
31.6 41.8 ~ 37 fps
100%
HD Graphics (Cherry Trail):
12.5 13.5 ~ 13 fps
100%
HD Graphics (Bay Trail):
12.5 12.5 ~ 13 fps
HD Graphics (Bay Trail):
8.3 fps
HD Graphics (Bay Trail):
4.6 fps
HD Graphics (Bay Trail):
11.1 fps
HD Graphics (Bay Trail):
9.6 fps
HD Graphics (Bay Trail):
25.2 fps
HD Graphics (Bay Trail):
9.2 fps
GeForce GTX 1060 Max-Q:
117.2 fps
HD Graphics (Bay Trail):
3.1 [X] Medion Akoya S6213T MD98716 Intel Pentium N3530 2.2GHz
HD Graphics (Bay Trail)
5.1 ~ 4 fps
GeForce GTX 1060 Max-Q:
112 fps
HD Graphics (Bay Trail):
3.3 fps
GeForce GTX 1060 Max-Q:
107.6 fps
GeForce GTX 1060 Max-Q:
60.2 [X] Lenovo Legion Y520-15IKBM 80YY001APB Intel Core i5-7300HQ 2.5GHz
GeForce GTX 1060 Max-Q
64.6 69 70.4 ~ 66 fps
HD Graphics (Bay Trail):
8.7 fps
HD Graphics (Bay Trail):
5.8 fps
HD Graphics (Bay Trail):
12.8 fps
HD Graphics (Bay Trail):
6 fps
100%
HD Graphics (Cherry Trail):
13.3 fps
55%
HD Graphics (Bay Trail):
7.3 fps
HD Graphics (Bay Trail):
14 fps
HD Graphics (Bay Trail):
8 fps
HD Graphics (Bay Trail):
12 fps
HD Graphics (Bay Trail):
12.6 18.7 19.9 29.8 33.6 60 [X] Medion Akoya P2211T MD98602 Intel Celeron N2910 1.6GHz
HD Graphics (Bay Trail)
~ 29 fps
HD Graphics (Bay Trail):
10.5 19.5 33 [X] Medion Akoya P2211T MD98602 Intel Celeron N2910 1.6GHz
HD Graphics (Bay Trail)
~ 21 fps
HD Graphics (Bay Trail):
7.8 12.8 22 [X] Medion Akoya P2211T MD98602 Intel Celeron N2910 1.6GHz
HD Graphics (Bay Trail)
~ 14 fps
HD Graphics (Bay Trail):
7.7 fps
GeForce GTX 1060 Max-Q:
53.7 [X] Lenovo Legion Y520-15IKBM 80YY001APB Intel Core i5-7300HQ 2.5GHz
GeForce GTX 1060 Max-Q
fps
HD Graphics (Bay Trail):
6.3 fps
HD Graphics (Bay Trail):
10.2 fps
HD Graphics (Bay Trail):
6.1 fps
HD Graphics (Bay Trail):
11 fps
HD Graphics (Bay Trail):
7.8 fps
100%
HD Graphics (Cherry Trail):
58 fps
100%
HD Graphics (Cherry Trail):
47 fps
100%
HD Graphics (Cherry Trail):
29.7 fps
84%
HD Graphics (Bay Trail):
18.2 [X] Medion Akoya P2211T MD98602 Intel Celeron N2910 1.6GHz
HD Graphics (Bay Trail)
20.8 28.4 31.9 [X] Asus Transformer Book T200TA PL Intel Atom Z3775 1.5GHz
HD Graphics (Bay Trail)
~ 25 fps
100%
HD Graphics (Cherry Trail):
16.5 fps
79%
HD Graphics (Bay Trail):
9.5 [X] Medion Akoya P2211T MD98602 Intel Celeron N2910 1.6GHz
HD Graphics (Bay Trail)
10.4 13.7 19.4 [X] Asus Transformer Book T200TA PL Intel Atom Z3775 1.5GHz
HD Graphics (Bay Trail)
~ 13 fps
GeForce GTX 1060 Max-Q:
68.9 fps
HD Graphics (Bay Trail):
4.4 [X] Medion Akoya E6239T Intel Pentium N3510 2GHz
HD Graphics (Bay Trail)
fps
GeForce GTX 1060 Max-Q:
65.7 fps
GeForce GTX 1060 Max-Q:
63.4 fps
GeForce GTX 1060 Max-Q:
40 fps
100%
HD Graphics (Cherry Trail):
24 fps
878%
GeForce GTX 1060 Max-Q:
210.8 fps
75%
HD Graphics (Bay Trail):
14.1 16.2 17.9 20.4 [X] Medion Akoya E6239T Intel Pentium N3510 2GHz
HD Graphics (Bay Trail)
23.2 ~ 18 fps
100%
HD Graphics (Cherry Trail):
13.5 fps
1132%
GeForce GTX 1060 Max-Q:
152.8 fps
96%
HD Graphics (Bay Trail):
12.5 12.6 [X] Medion Akoya E6239T Intel Pentium N3510 2GHz
HD Graphics (Bay Trail)
~ 13 fps
GeForce GTX 1060 Max-Q:
143.3 fps
GeForce GTX 1060 Max-Q:
116.7 fps
HD Graphics (Bay Trail):
5 fps
GeForce GTX 1060 Max-Q:
64.3 74 ~ 69 fps
100%
HD Graphics (Cherry Trail):
16 18 18.9 [X] Medion Akoya E2215T Intel Atom x5-Z8350 1.4GHz
HD Graphics (Cherry Trail)
19.8 20.1 20.5 ~ 19 fps
100%
HD Graphics (Cherry Trail):
6.4 7.9 [X] Medion Akoya E2215T Intel Atom x5-Z8350 1.4GHz
HD Graphics (Cherry Trail)
9.3 9.8 10 10 ~ 9 fps
100%
HD Graphics (Cherry Trail):
5.6 5.7 [X] Medion Akoya E2215T Intel Atom x5-Z8350 1.4GHz
HD Graphics (Cherry Trail)
6.7 7.6 7.9 8.4 ~ 7 fps
2843%
GeForce GTX 1060 Max-Q:
159.5 [X] Lenovo Legion Y520-15IKBM 80YY001APB Intel Core i5-7300HQ 2.5GHz
GeForce GTX 1060 Max-Q
180.1 211.6 213.3 213.4 215 ~ 199 fps
100%
HD Graphics (Cherry Trail):
2.4 2.6 ~ 2 fps
60%
HD Graphics (Bay Trail):
1.2 fps
HD Graphics (Bay Trail):
39 56.2 69 [X] Baytrail Reference Tablet Intel Atom Z3770 1.5GHz
HD Graphics (Bay Trail)
~ 55 fps
HD Graphics (Bay Trail):
12.3 12.8 14 [X] Baytrail Reference Tablet Intel Atom Z3770 1.5GHz
HD Graphics (Bay Trail)
min:
8 fps
~ 13 fps
1142%
GeForce GTX 1060 Max-Q:
308.4 fps
2136%
GeForce GTX 1060 Max-Q:
277.7 fps
100%
HD Graphics (Cherry Trail):
7 8.3 9 ~ 8 fps
2131%
GeForce GTX 1060 Max-Q:
170.5 fps
100%
HD Graphics (Cherry Trail):
3.7 3.8 ~ 4 fps
2890%
GeForce GTX 1060 Max-Q:
115.6 fps
8%
HD Graphics (Bay Trail):
0.3 fps
HD Graphics (Bay Trail):
15.1 23.6 ~ 19 fps
HD Graphics (Bay Trail):
5.2 9.7 ~ 7 fps
100%
HD Graphics (Cherry Trail):
34 fps
HD Graphics (Bay Trail):
10.3 fps
HD Graphics (Bay Trail):
6.2 fps
GeForce GTX 1060 Max-Q:
105.8 fps
HD Graphics (Bay Trail):
10.1 fps
GeForce GTX 1060 Max-Q:
101 fps
HD Graphics (Bay Trail):
6 fps
GeForce GTX 1060 Max-Q:
88.7 fps
GeForce GTX 1060 Max-Q:
70 fps
HD Graphics (Bay Trail):
12.4 fps
HD Graphics (Bay Trail):
7.3 fps
100%
HD Graphics (Cherry Trail):
15.2 fps
86%
HD Graphics (Bay Trail):
12.5 14.3 ~ 13 fps
100%
HD Graphics (Cherry Trail):
11.6 fps
95%
HD Graphics (Bay Trail):
9.8 11.2 ~ 11 fps
HD Graphics (Cherry Trail):
0 (!) [X] Microsoft Surface 3 Intel Atom x7-Z8700 1.6GHz
HD Graphics (Cherry Trail)
fps
HD Graphics (Cherry Trail):
0 (!) [X] Microsoft Surface 3 Intel Atom x7-Z8700 1.6GHz
HD Graphics (Cherry Trail)
fps
HD Graphics (Bay Trail):
42 fps
GeForce GTX 1060 Max-Q:
45.7 fps
138%
HD Graphics (Bay Trail):
26.1 [X] Intel NUC Kit DN2820FYKH Intel Celeron N2820 2.2GHz
HD Graphics (Bay Trail)
min:
16 fps, max:
38 fps
46.6 ~ 36 fps
110%
HD Graphics (Bay Trail):
20 [X] Intel NUC Kit DN2820FYKH Intel Celeron N2820 2.2GHz
HD Graphics (Bay Trail)
min:
13 fps, max:
29 fps
23.9 ~ 22 fps
100%
HD Graphics (Cherry Trail):
20.3 fps
100%
HD Graphics (Cherry Trail):
11.4 fps
GeForce GTX 1060 Max-Q:
218.4 fps
HD Graphics (Bay Trail):
12.9 13.2 ~ 13 fps
GeForce GTX 1060 Max-Q:
192.7 fps
HD Graphics (Bay Trail):
7.5 8.1 ~ 8 fps
GeForce GTX 1060 Max-Q:
164.7 fps
GeForce GTX 1060 Max-Q:
69.5 fps
HD Graphics (Bay Trail):
28 fps
100%
HD Graphics (Cherry Trail):
24.3 [X] Chuwi Hi12 Intel Atom x5-Z8300 1.4GHz
HD Graphics (Cherry Trail)
min:
20 fps, max:
29 fps
31.9 ~ 28 fps
54%
HD Graphics (Bay Trail):
9.2 10.7 14.8 15.6 16.5 [X] Medion Akoya P2214T MD 99430 Intel Celeron N2940 1.8GHz
HD Graphics (Bay Trail)
18.4 19.3 [X] Intel NUC Kit DN2820FYKH Intel Celeron N2820 2.2GHz
HD Graphics (Bay Trail)
min:
14 fps, max:
23 fps
~ 15 fps
100%
HD Graphics (Cherry Trail):
16 [X] Chuwi Hi12 Intel Atom x5-Z8300 1.4GHz
HD Graphics (Cherry Trail)
min:
13 fps, max:
19 fps
19 ~ 18 fps
56%
HD Graphics (Bay Trail):
6 9.5 [X] Medion Akoya P2214T MD 99430 Intel Celeron N2940 1.8GHz
HD Graphics (Bay Trail)
10.3 11.4 12 ~ 10 fps
HD Graphics (Bay Trail):
7.9 [X] Medion Akoya P2214T MD 99430 Intel Celeron N2940 1.8GHz
HD Graphics (Bay Trail)
9.6 ~ 9 fps
HD Graphics (Bay Trail):
5 [X] Medion Akoya P2214T MD 99430 Intel Celeron N2940 1.8GHz
HD Graphics (Bay Trail)
5.9 ~ 5 fps
HD Graphics (Bay Trail):
8.5 12.4 ~ 10 fps
HD Graphics (Bay Trail):
8.1 fps
HD Graphics (Bay Trail):
5.8 fps
HD Graphics (Bay Trail):
2.3 fps
100%
HD Graphics (Cherry Trail):
8 fps
HD Graphics (Bay Trail):
1.1 fps
100%
HD Graphics (Cherry Trail):
15.5 18.9 ~ 17 fps
65%
HD Graphics (Bay Trail):
11 11.8 ~ 11 fps
100%
HD Graphics (Cherry Trail):
7.2 8.5 ~ 8 fps
125%
HD Graphics (Bay Trail):
10 fps
HD Graphics (Bay Trail):
8 fps
HD Graphics (Bay Trail):
4.8 fps
100%
HD Graphics (Cherry Trail):
25.6 fps
77%
HD Graphics (Bay Trail):
19.7 fps
100%
HD Graphics (Cherry Trail):
12 fps
100%
HD Graphics (Cherry Trail):
28.1 fps
499%
GeForce GTX 1060 Max-Q:
140.1 fps
110%
HD Graphics (Bay Trail):
24.1 36.9 ~ 31 fps
100%
HD Graphics (Cherry Trail):
12.5 fps
1010%
GeForce GTX 1060 Max-Q:
126.3 fps
104%
HD Graphics (Bay Trail):
12.9 13.3 ~ 13 fps
GeForce GTX 1060 Max-Q:
112.2 fps
GeForce GTX 1060 Max-Q:
64.5 fps
100%
HD Graphics (Cherry Trail):
18.7 fps
50%
HD Graphics (Bay Trail):
9.3 fps
HD Graphics (Bay Trail):
5 10.5 [X] Asus Transformer Book T200TA PL Intel Atom Z3775 1.5GHz
HD Graphics (Bay Trail)
~ 8 fps
HD Graphics (Bay Trail):
5.6 [X] Asus Transformer Book T200TA PL Intel Atom Z3775 1.5GHz
HD Graphics (Bay Trail)
fps
HD Graphics (Bay Trail):
3.7 [X] Asus Transformer Book T200TA PL Intel Atom Z3775 1.5GHz
HD Graphics (Bay Trail)
fps
100%
HD Graphics (Cherry Trail):
63.2 64 ~ 64 fps
72%
HD Graphics (Bay Trail):
32 48 49 53.3 ~ 46 fps
100%
HD Graphics (Cherry Trail):
18 18.8 ~ 18 fps
44%
HD Graphics (Bay Trail):
6 9 9 ~ 8 fps
100%
HD Graphics (Cherry Trail):
14 fps
21%
HD Graphics (Bay Trail):
3 fps
100%
HD Graphics (Cherry Trail):
7 fps
HD Graphics (Bay Trail):
12 [X] Asus Transformer Book T200TA PL Intel Atom Z3775 1.5GHz
HD Graphics (Bay Trail)
fps
HD Graphics (Bay Trail):
9 [X] Asus Transformer Book T200TA PL Intel Atom Z3775 1.5GHz
HD Graphics (Bay Trail)
fps
HD Graphics (Bay Trail):
12.8 fps
HD Graphics (Bay Trail):
9 fps
77%
HD Graphics (Bay Trail):
42.9 69.8 69.8 71.6 72 72.7 75.1 75.5 76 [X] Medion Akoya E1232T-MD99410 Intel Celeron N2807 1.6GHz
HD Graphics (Bay Trail)
76.7 77.1 80.9 83.1 83.9 84.3 [X] Captiva PAD 10.1 Windows Intel Atom Z3735D 1.3GHz
HD Graphics (Bay Trail)
84.8 [X] ODYS Winpad V10 Intel Atom Z3735F 1.3GHz
HD Graphics (Bay Trail)
85.6 [X] cmx WinTek 101-1016 Intel Atom Z3735F 1.3GHz
HD Graphics (Bay Trail)
86.9 90.2 ~ 77 fps
79%
HD Graphics (Bay Trail):
10.3 14 [X] Medion Akoya E1232T-MD99410 Intel Celeron N2807 1.6GHz
HD Graphics (Bay Trail)
17.7 18 18.1 18.1 18.7 18.8 [X] Captiva PAD 10.1 Windows Intel Atom Z3735D 1.3GHz
HD Graphics (Bay Trail)
19.3 19.4 19.4 19.8 19.8 20.5 20.5 [X] cmx WinTek 101-1016 Intel Atom Z3735F 1.3GHz
HD Graphics (Bay Trail)
20.6 21 [X] ODYS Winpad V10 Intel Atom Z3735F 1.3GHz
HD Graphics (Bay Trail)
21.5 23.6 ~ 19 fps
50%
HD Graphics (Bay Trail):
6.4 [X] Captiva PAD 10.1 Windows Intel Atom Z3735D 1.3GHz
HD Graphics (Bay Trail)
7.7 ~ 7 fps
HD Graphics (Bay Trail):
18.9 19 ~ 19 fps
HD Graphics (Bay Trail):
7.6 8.7 ~ 8 fps
100%
HD Graphics (Cherry Trail):
44 50.9 [X] Chuwi Hi12 Intel Atom x5-Z8300 1.4GHz
HD Graphics (Cherry Trail)
min:
40 fps, max:
60 fps
~ 47 fps
94%
HD Graphics (Bay Trail):
33 33 35 38 [X] MSI S100 Intel Atom Z3740D 1.3GHz
HD Graphics (Bay Trail)
44 46.2 47 48 49 49 [X] Intel NUC Kit DN2820FYKH Intel Celeron N2820 2.2GHz
HD Graphics (Bay Trail)
min:
39 fps, max:
59 fps
50 [X] Baytrail Reference Tablet Intel Atom Z3770 1.5GHz
HD Graphics (Bay Trail)
min:
36 fps
52 ~ 44 fps
100%
HD Graphics (Cherry Trail):
18.3 [X] Chuwi Hi12 Intel Atom x5-Z8300 1.4GHz
HD Graphics (Cherry Trail)
min:
13 fps, max:
29 fps
fps
126%
HD Graphics (Bay Trail):
9.6 [X] Intel NUC Kit DN2820FYKH Intel Celeron N2820 2.2GHz
HD Graphics (Bay Trail)
min:
3 fps, max:
13 fps
11.5 [X] Baytrail Reference Tablet Intel Atom Z3770 1.5GHz
HD Graphics (Bay Trail)
min:
8 fps
20 22 23 25.3 26 26 28 [X] MSI S100 Intel Atom Z3740D 1.3GHz
HD Graphics (Bay Trail)
34 ~ 23 fps
HD Graphics (Bay Trail):
12 12 13.5 ~ 13 fps
HD Graphics (Bay Trail):
5.6 7 ~ 6 fps
HD Graphics (Bay Trail):
190 [X] Baytrail Reference Tablet Intel Atom Z3770 1.5GHz
HD Graphics (Bay Trail)
fps
Average Gaming Intel HD Graphics (Cherry Trail) → 100% Average Gaming 30-70 fps → 100%
Average Gaming NVIDIA GeForce GTX 1060 Max-Q → 2115% Average Gaming Intel HD Graphics (Bay Trail) → 77% Average Gaming 30-70 fps → 107%
 Deutsch
 English
 Español
 Français
 Italiano
 Nederlands
 Polski
 Português
 Русский
 Türkçe
 Svenska
 Chinese
 Magyar