Intel HD Graphics (Cherry Trail) vs NVIDIA GeForce GTX 1060 Max-Q vs Intel HD Graphics 6000
Intel HD Graphics (Cherry Trail) ► remove from comparison
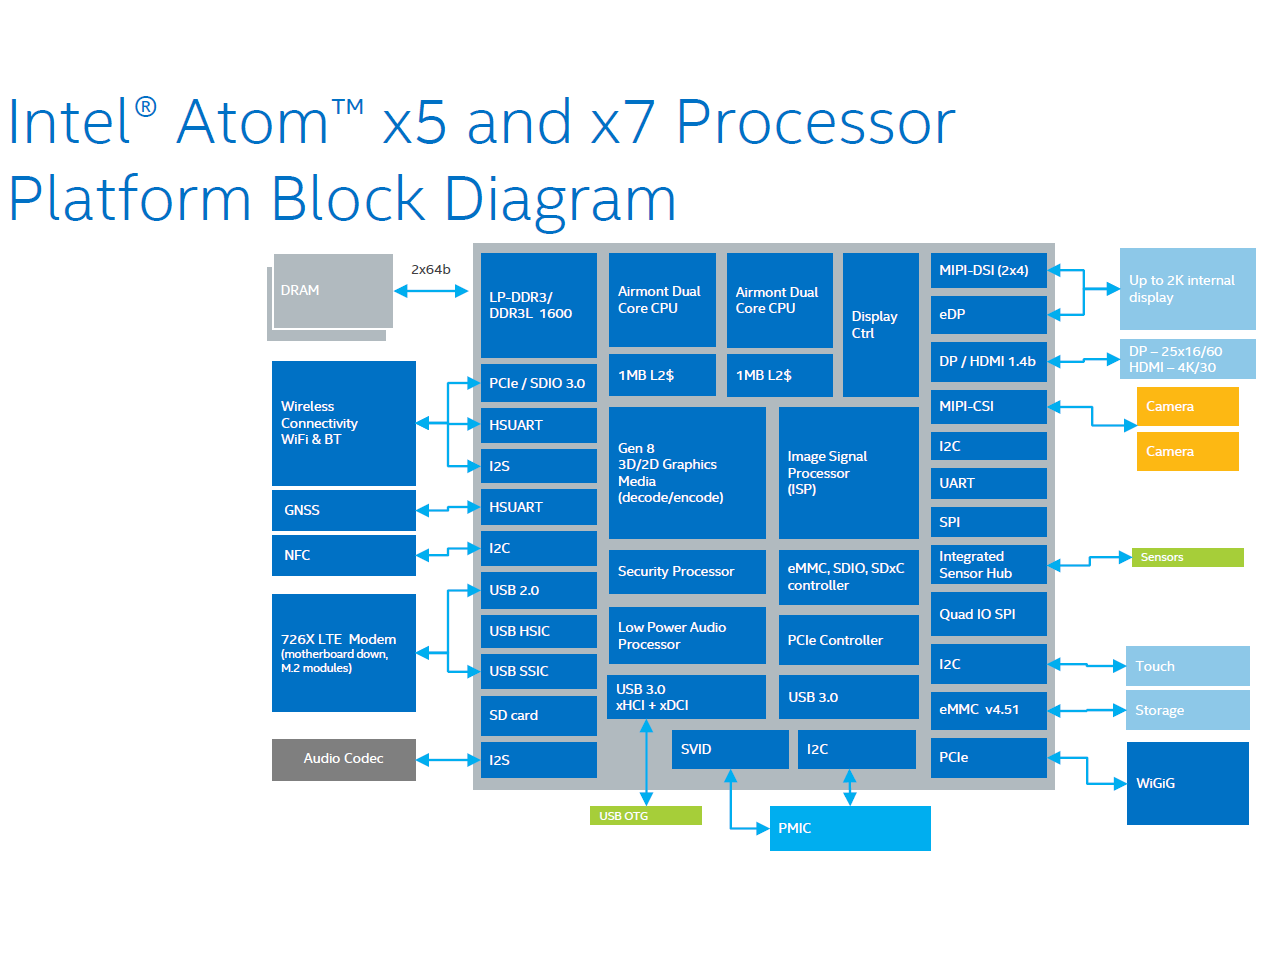
The Intel HD Graphics (Cherry Trail) is an integrated graphics card in the Cherry-Trail SoCs (e.g. Atom x7-Z8700). Based on a Broadwell GPU (Intel Gen8) and supports DirectX 11.2. Depending on the SoC offers 12 or 16 EUs.
Atom x7-Z8700: 16 EUs @ 200 - 600 MHz, dual-channel memory
In Windows, gaming is limited to less demanding or quite old games. Using Android, even high end 3D games should run fluently. For example Team Fortress 2 was running on the Surface 3 (x7-Z8700) only in lowest settings and 1280x720 fluently (11 - 69 fps range).
The integrated video decoder is able to display even 4K videos (H.264 tested) fluently.
The Intel HD Graphics GPU in our review sample of the MS Surface 3 (Atom x7-Z8700) only supported DisplayPort 1.1 as it seems, as 4K (3840x2160) with 30 Hz was the maximum Refresh Rate we could achieve (no 60 Hz selectable with the pre-installed drivers).
NVIDIA GeForce GTX 1060 Max-Q ► remove from comparison
The Nvidia GeForce GTX 1060 with the Max-Q design is a mobile high-end GPU from the Pascal series. It is designed for thin and light laptops and about 10-15% slower than a regular GTX 1060 for laptops based on the cooling capabilities. The base frequency (1063-1265 MHz) is also much lower than on the regular GTX 1060 (1506 MHz, at least -16%) and the Boost (1341-1480 MHz) is also much lower compared to 1708 MHz (at least -13%) for the regular GTX 1060. The memory clock, however, is identical.
The clock is not the only difference compared to the regular GTX 1060 though. The drivers for the Max-Q version were optimized for efficiency (and not performance; only for Max-Q models), there are optimized voltage converters for 1V operation, high-end cooling methods, and a 40 dB limit for the fan noise (with clock adjustments to ensure this at all times).
Features
The GP106 chip is produced in 16nm FinFET at TSMC and offers a range of new features, like DisplayPort 1.4 (ready), HDMI 2.0b, HDR, Simultaneous Multi-Projection (SMP) and improved H.265 video de- and encoding (PlayReady 3.0). A list of improvements and features can be found in our article on the Pascal architecture .
The power consumption of the Max-Q design is notably lower than the normal GTX 1060 for laptops and ranges between 60 and 70 Watt (TGP) according to Nvidia.
Intel HD Graphics 6000 ► remove from comparison
The Intel HD Graphics 6000 (GT3) is an integrated Broadwell graphics card revealed in Q1 2015. It can be found in several ULV SoCs (15 W TDP) such as the Core i5-5250U or i7-5650U . The so-called GT3 GPU offers 48 EUs (Execution Units) and therefore somewhat more shader power than the previous HD 5000 (40 EUs). Depending on the specific CPU, the maximum GPU frequency varies between 950 and 1000 MHz.
Architecture and Features
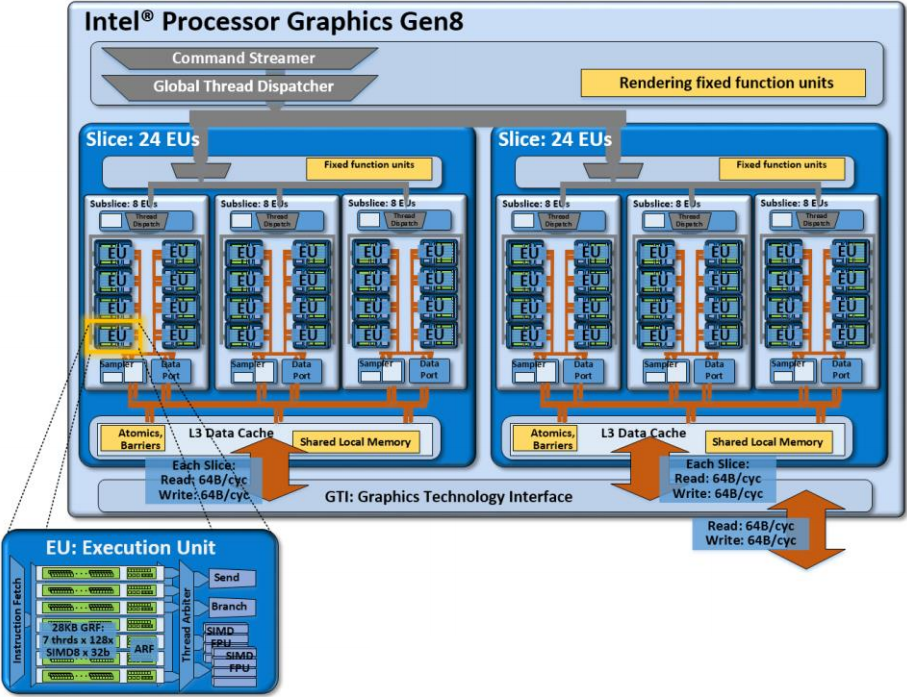
Broadwell features a GPU based on the Intel Gen8 architecture, which has been optimized in various aspects compared to the previous Gen7.5 (Haswell). Inter alia, the shader arrays called "subslice" have been reorganized and now offer 8 Execution Units (EUs) each. Three subslices form a "slice" for a total of 24 EUs. Combined with other improvements such as larger L1 caches and an optimized frontend, the integrated GPU has become faster and more efficient than its predecessor.
The HD Graphics 6000 represents the top-end version of the Broadwell GPU family and consists of two slices with 48 EUs. Beyond that, there is also a low-end (GT1, 12 EUs), a mid-range (GT2, 24 EUs) and a high-end variant (GT3e, 48 EUs + eDRAM).
All Broadwell GPUs support OpenCL 2.0 and DirectX 12 (FL 11_1) . The video engine can now decode H.265 using both fixed function hardware as well as available GPU shaders. Up to three displays can be connected via DP 1.2/eDP 1.3 (max. 3840 x 2160 @ 60 Hz) or HDMI 1.4a (max. 3840 x 2160 @ 24 Hz). HDMI 2.0, however, is not supported.
Performance
Depending on the specific CPU, the maximum GPU frequency varies between 950 and 1000 MHz. Due to the low TDP, however, the average clock in 3D applications will be significantly lower. Overall, the HD Graphics 6000 outperforms the previous HD 5000 by 20 - 25 percent and offers a performance slightly below a dedicated GeForce 820M .
Games as of 2014/2015 will usually run fluently only at (very) low settings.
Power Consumption
Utilizing a new 14 nm process, the Broadwell ULV chips are specified at just 15 W TDP and therefore suited for thin ultrabooks. The TDP is flexible and can be further reduced (9.5 W), which has a significant impact on performance.
Intel HD Graphics (Cherry Trail) NVIDIA GeForce GTX 1060 Max-Q Intel HD Graphics 6000 HD Graphics Series Codename Cherry Trail N17P-G1 Max-Q Broadwell GT3 Architecture Gen. 8 Pascal Gen. 8 Broadwell Pipelines 16 - unified 1280 - unified 48 - unified Core Speed 200 - 600 (Boost) MHz 1063 - 1265 - 1341 - 1480 (Boost) MHz 300 - 1000 (Boost) MHz Memory Bus Width 64/128 Bit 192 Bit 64/128 Bit Shared Memory yes no yes API DirectX 12 (FL 11_1), Shader 5.0, OpenGL 4.3 DirectX 12_1, OpenGL 4.5 DirectX 12 (FL 11_1), OpenGL 4.3 technology 14 nm 16 nm 14 nm Date of Announcement 02.03.2015 30.05.2017 05.01.2015 Memory Speed 8000 MHz Memory Type GDDR5 Max. Amount of Memory 6.144 MB Power Consumption 60 - 70 Watt Transistors 4.4 Billion 1.9 Billion Features Multi-Projection, VR Ready, G-SYNC, Vulkan, Multi Monitor QuickSync Notebook Size large
Benchmarks Performance Rating - 3DMark 11 + Fire Strike + Time Spy - HD Graphics (Cherry Trail)
0.1 pt (0%)
Intel HD Graphics (Cherry Trail)
...
max:
Performance Rating - 3DMark 11 + Fire Strike + Time Spy - GeForce GTX 1060 Max-Q
4.8 pt (14%)
...
NVIDIA GeForce GTX 1060 Max-Q
...
max:
Performance Rating - 3DMark 11 + Fire Strike + Time Spy - HD Graphics 6000
0.4 pt (1%)
...
...
max:
3DMark - 3DMark Time Spy Score
min: 3271 avg: 3415 median: 3415 (10%) max: 3559 Points
374 Points (1%)
3DMark - 3DMark Time Spy Graphics
min: 3138 avg: 3324 median: 3324 (9%) max: 3510 Points
334 Points (1%)
3DMark - 3DMark Ice Storm Unlimited Graphics
min: 18563 avg: 20873 median: 19303 (2%) max: 27537 Points
min: 287286 avg: 346663 median: 367999 (42%) max: 384095 Points
3DMark - 3DMark Ice Storm Extreme Graphics
min: 71289 avg: 105162 median: 96536 (12%) max: 156285 Points
3DMark - 3DMark Cloud Gate Score
min: 769 avg: 1454 median: 1488 (2%) max: 1905 Points
min: 16358 avg: 24167 median: 24154.5 (26%) max: 32658 Points
min: 5425 avg: 5737 median: 5872 (6%) max: 6061 Points
3DMark - 3DMark Cloud Gate Graphics
min: 1537 avg: 1851 median: 1783.5 (0%) max: 2272 Points
min: 42781 avg: 71376 median: 74101 (19%) max: 81720 Points
min: 7378 avg: 7700 median: 7660 (2%) max: 8102 Points
3DMark - 3DMark Fire Strike Standard Score
min: 174 avg: 390.4 median: 248 (0%) max: 1059 Points
min: 8292 avg: 9159 median: 9148.5 (16%) max: 9936 Points
min: 844 avg: 906 median: 903 (2%) max: 971 Points
3DMark - 3DMark Fire Strike Standard Graphics
min: 193 avg: 233 median: 225 (0%) max: 281 Points
min: 9992 avg: 10659 median: 10430 (12%) max: 11366 Points
min: 858 avg: 947 median: 951 (1%) max: 1033 Points
3DMark - 3DMark Ice Storm Graphics
min: 7544 avg: 16078 median: 17063.5 (2%) max: 23395 Points
min: 80051 avg: 144686 median: 118989 (14%) max: 265343 Points
min: 61674 avg: 62508 median: 61979 (7%) max: 63871 Points
3DMark - 3DMark Sling Shot (ES 3.0) Unlimited
min: 1445 avg: 1525 median: 1525 (7%) max: 1605 Points
3DMark - 3DMark Sling Shot (ES 3.0) Unlimited Graphics
min: 1598 avg: 1684 median: 1684 (4%) max: 1770 Points
3DMark - 3DMark Sling Shot Extreme (ES 3.1) Unlimited
min: 1072 avg: 1215 median: 1159 (6%) max: 1414 Points
3DMark - 3DMark Sling Shot Extreme (ES 3.1) Unlimited Graphics
min: 1058 avg: 1251 median: 1142 (3%) max: 1554 Points
3DMark 11 - 3DM11 Performance Score
min: 314 avg: 359.4 median: 343 (0%) max: 562 Points
min: 10176 avg: 11974 median: 11973 (17%) max: 13296 Points
min: 1328 avg: 1487 median: 1513.5 (2%) max: 1591 Points
3DMark 11 - 3DM11 Performance GPU
min: 278 avg: 319.9 median: 298 (0%) max: 494 Points
min: 12970 avg: 13581 median: 13333.5 (11%) max: 14487 Points
min: 1210 avg: 1372 median: 1395.5 (1%) max: 1487 Points
3DMark Vantage + Intel HD Graphics 6000 3DMark Vantage - 3DM Vant. Perf. total
min: 5797 avg: 6106 median: 6188 (2%) max: 6333 Points
3DM Vant. Perf. GPU no PhysX + Intel HD Graphics 6000 3DMark Vantage - 3DM Vant. Perf. GPU no PhysX
min: 5129 avg: 5410 median: 5432 (3%) max: 5670 Points
3DMark 06 3DMark 06 - Standard 1280x1024 + Intel HD Graphics (Cherry Trail)
min: 2403 avg: 2833 median: 2595 (3%) max: 3330 Points
3DMark 06 - Standard 1280x1024 + NVIDIA GeForce GTX 1060 Max-Q
34189 Points (45%)
3DMark 06 - Standard 1280x1024 + Intel HD Graphics 6000
min: 7844 avg: 8448 median: 8091 (11%) max: 9408 Points
3DMark 06 - Standard 1024x768 + Intel HD Graphics (Cherry Trail)
2877 Points (4%)
Unigine Valley 1.0 - Unigine Valley 1.0 DX
1.2 fps (0%)
3.7 fps (1%)
Unigine Heaven 2.1 - Heaven 2.1 high
5.7 fps (1%)
min: 18.6 avg: 19 median: 18.7 (4%) max: 19.8 fps
SPECviewperf 11 + NVIDIA GeForce GTX 1060 Max-Q SPECviewperf 11 - specvp11 snx-01
9.5 fps (6%)
specvp11 tcvis-02 + NVIDIA GeForce GTX 1060 Max-Q SPECviewperf 11 - specvp11 tcvis-02
2.8 fps (2%)
specvp11 sw-02 + NVIDIA GeForce GTX 1060 Max-Q SPECviewperf 11 - specvp11 sw-02
18.4 fps (14%)
specvp11 proe-05 + NVIDIA GeForce GTX 1060 Max-Q SPECviewperf 11 - specvp11 proe-05
2.8 fps (3%)
specvp11 maya-03 + NVIDIA GeForce GTX 1060 Max-Q SPECviewperf 11 - specvp11 maya-03
17.3 fps (13%)
specvp11 lightwave-01 + NVIDIA GeForce GTX 1060 Max-Q SPECviewperf 11 - specvp11 lightwave-01
20.1 fps (22%)
specvp11 ensight-04 + NVIDIA GeForce GTX 1060 Max-Q SPECviewperf 11 - specvp11 ensight-04
109.7 fps (52%)
specvp11 catia-03 + NVIDIA GeForce GTX 1060 Max-Q SPECviewperf 11 - specvp11 catia-03
19.7 fps (10%)
SPECviewperf 12 + NVIDIA GeForce GTX 1060 Max-Q SPECviewperf 12 - specvp12 sw-03
43.9 fps (11%)
specvp12 sw-03 + Intel HD Graphics 6000
16.6 fps (4%)
specvp12 snx-02 + NVIDIA GeForce GTX 1060 Max-Q SPECviewperf 12 - specvp12 snx-02
5.4 fps (1%)
specvp12 snx-02 + Intel HD Graphics 6000 2.5 fps (0%)
specvp12 showcase-01 + NVIDIA GeForce GTX 1060 Max-Q SPECviewperf 12 - specvp12 showcase-01
56.2 fps (12%)
specvp12 showcase-01 + Intel HD Graphics 6000
5.6 fps (1%)
specvp12 mediacal-01 + NVIDIA GeForce GTX 1060 Max-Q SPECviewperf 12 - specvp12 mediacal-01
27.5 fps (7%)
specvp12 mediacal-01 + Intel HD Graphics 6000 1.6 fps (0%)
specvp12 maya-04 + NVIDIA GeForce GTX 1060 Max-Q SPECviewperf 12 - specvp12 maya-04
92 fps (25%)
specvp12 maya-04 + Intel HD Graphics 6000
3.3 fps (1%)
specvp12 energy-01 + NVIDIA GeForce GTX 1060 Max-Q SPECviewperf 12 - specvp12 energy-01
5.2 fps (5%)
specvp12 energy-01 + Intel HD Graphics 6000 0.1 fps (0%)
specvp12 creo-01 + NVIDIA GeForce GTX 1060 Max-Q SPECviewperf 12 - specvp12 creo-01
34.8 fps (14%)
specvp12 creo-01 + Intel HD Graphics 6000
9.9 fps (4%)
specvp12 catia-04 + NVIDIA GeForce GTX 1060 Max-Q SPECviewperf 12 - specvp12 catia-04
45.4 fps (8%)
specvp12 catia-04 + Intel HD Graphics 6000
11.3 fps (2%)
Windows 7 Experience Index - Win7 Gaming graphics
6.9 Points (87%)
Windows 7 Experience Index - Win7 Graphics
5.9 Points (75%)
Cinebench R10 Cinebench R10 Shading (32bit) + Intel HD Graphics (Cherry Trail) Cinebench R10 - Cinebench R10 Shading (32bit)
min: 1192 avg: 2009 median: 1973 (1%) max: 2551 Points
Cinebench R10 Shading (32bit) + NVIDIA GeForce GTX 1060 Max-Q
min: 6822 avg: 8146 median: 6829.5 (5%) max: 11275 Points
Cinebench R10 Shading (32bit) + Intel HD Graphics 6000
min: 6148 avg: 6928 median: 6527 (5%) max: 8110 Points
Cinebench R11.5 Cinebench R11.5 OpenGL 64 Bit + Intel HD Graphics (Cherry Trail) Cinebench R11.5 - Cinebench R11.5 OpenGL 64 Bit
min: 4.01 avg: 8.8 median: 8.4 (3%) max: 11.71 fps
Cinebench R11.5 OpenGL 64 Bit + NVIDIA GeForce GTX 1060 Max-Q
min: 59.6 avg: 68.9 median: 71.7 (25%) max: 76.2 fps
Cinebench R11.5 OpenGL 64 Bit + Intel HD Graphics 6000
min: 21.27 avg: 23.7 median: 23.9 (8%) max: 25.67 fps
Cinebench R15 + Intel HD Graphics (Cherry Trail) Cinebench R15 - Cinebench R15 OpenGL 64 Bit
min: 6.64 avg: 10.3 median: 9.7 (1%) max: 15.52 fps
Cinebench R15 OpenGL 64 Bit + NVIDIA GeForce GTX 1060 Max-Q
min: 88.5 avg: 107.1 median: 110.6 (6%) max: 120.1 fps
Cinebench R15 OpenGL 64 Bit + Intel HD Graphics 6000
min: 25.89 avg: 30.1 median: 30.7 (2%) max: 34.45 fps
Cinebench R15 OpenGL Ref. Match 64 Bit + Intel HD Graphics (Cherry Trail) Cinebench R15 - Cinebench R15 OpenGL Ref. Match 64 Bit
min: 98 avg: 98 median: 98 (98%) max: 98.6 %
Cinebench R15 OpenGL Ref. Match 64 Bit + NVIDIA GeForce GTX 1060 Max-Q
99.6 % (100%)
Cinebench R15 OpenGL Ref. Match 64 Bit + Intel HD Graphics 6000
min: 98 avg: 98.5 median: 98 (98%) max: 99.3 %
GFXBench - GFXBench Car Chase Offscreen
min: 6.3 avg: 7.3 median: 7 (1%) max: 9 fps
GFXBench 3.1 - GFXBench Manhattan ES 3.1 Offscreen
min: 9.2 avg: 10.8 median: 11 (0%) max: 13 fps
GFXBench 3.0 - GFXBench 3.0 Manhattan Offscreen
min: 8.4 avg: 13.8 median: 13.5 (1%) max: 18 fps
398 fps (23%)
min: 34.22 avg: 39.5 median: 39.5 (2%) max: 44.7 fps
GFXBench (DX / GLBenchmark) 2.7 + Intel HD Graphics (Cherry Trail) GFXBench (DX / GLBenchmark) 2.7 - GFXBench T-Rex HD Offscreen C24Z16
min: 22 avg: 30.5 median: 32 (0%) max: 38.5 fps
LuxMark v2.0 64Bit - LuxMark v2.0 Room GPU
min: 48 avg: 58.7 median: 59 (0%) max: 69 Samples/s
1614 Samples/s (7%)
min: 127 avg: 136 median: 135 (1%) max: 146 Samples/s
LuxMark v2.0 64Bit - LuxMark v2.0 Sala GPU
min: 69 avg: 87.7 median: 89 (0%) max: 105 Samples/s
2924 Samples/s (5%)
min: 342 avg: 357 median: 350 (1%) max: 379 Samples/s
ComputeMark v2.1 - ComputeMark v2.1 Result
277 Points (0%)
min: 7555 avg: 7747 median: 7653 (8%) max: 8202 Points
min: 941 avg: 1032 median: 1021 (1%) max: 1134 Points
Power Consumption - Furmark Stress Test Power Consumption - external Monitor *
32.9 Watt (5%)
Power Consumption - The Witcher 3 Power Consumption - external Monitor *
32.1 Watt (4%)
Power Consumption - Witcher 3 Power Consumption *
min: 89 avg: 105 median: 101.9 (22%) max: 123.1 Watt
Power Consumption - Witcher 3 ultra Power Efficiency
min: 0.3006 avg: 0.3 median: 0.3 (31%) max: 0.3955 fps per Watt
Emissions Witcher 3 Fan Noise + NVIDIA GeForce GTX 1060 Max-Q Emissions - Witcher 3 Fan Noise
min: 37.6 avg: 44.1 median: 44.1 (71%) max: 51.3 dB(A)
Clock Speed - GPU Clock Witcher 3 ultra
1440 MHz (56%)
850 MHz (33%)
Clock Speed - GPU Clock Speed Furmark
649 MHz (26%)
Average Benchmarks Intel HD Graphics (Cherry Trail) → 100% n=16 Average Benchmarks NVIDIA GeForce GTX 1060 Max-Q → 2391% n=16 Average Benchmarks Intel HD Graphics 6000 → 344% n=16
- Range of benchmark values for this graphics card
- Average benchmark values for this graphics card
* Smaller numbers mean a higher performance
1 This benchmark is not used for the average calculation
Game Benchmarks The following benchmarks stem from our benchmarks of review laptops. The performance depends on the used graphics memory, clock rate, processor, system settings, drivers, and operating systems. So the results don't have to be representative for all laptops with this GPU. For detailed information on the benchmark results, click on the fps number.
HD Graphics 6000:
18.4 [X] Intel NUC5i5RYK Intel Core i5-5250U 1.6GHz
HD Graphics 6000
min:
15 fps, max:
22 fps
fps
GeForce GTX 1060 Max-Q:
110 [X] Dell G5 15 5587 Intel Core i5-8300H 2.3GHz
GeForce GTX 1060 Max-Q
min:
89 fps, max:
137 fps
fps
GeForce GTX 1060 Max-Q:
70 [X] Dell G5 15 5587 Intel Core i5-8300H 2.3GHz
GeForce GTX 1060 Max-Q
min:
5 fps, max:
84 fps
fps
GeForce GTX 1060 Max-Q:
65 [X] Dell G5 15 5587 Intel Core i5-8300H 2.3GHz
GeForce GTX 1060 Max-Q
min:
58 fps, max:
79 fps
fps
GeForce GTX 1060 Max-Q:
48 [X] Dell G5 15 5587 Intel Core i5-8300H 2.3GHz
GeForce GTX 1060 Max-Q
min:
4 fps, max:
71 fps
fps
GeForce GTX 1060 Max-Q:
20 [X] Dell G5 15 5587 Intel Core i5-8300H 2.3GHz
GeForce GTX 1060 Max-Q
min:
17 fps, max:
24 fps
fps
HD Graphics 6000:
18.2 [X] Intel NUC5i5RYK Intel Core i5-5250U 1.6GHz
HD Graphics 6000
fps
HD Graphics 6000:
12.9 [X] Intel NUC5i5RYK Intel Core i5-5250U 1.6GHz
HD Graphics 6000
fps
HD Graphics 6000:
11.6 [X] Intel NUC5i5RYK Intel Core i5-5250U 1.6GHz
HD Graphics 6000
fps
GeForce GTX 1060 Max-Q:
60 110 [X] Dell G5 15 5587 Intel Core i5-8300H 2.3GHz
GeForce GTX 1060 Max-Q
min:
90 fps, max:
131 fps
~ 85 fps
GeForce GTX 1060 Max-Q:
58 66.8 [X] Dell G5 15 5587 Intel Core i5-8300H 2.3GHz
GeForce GTX 1060 Max-Q
min:
55 fps, max:
74 fps
~ 62 fps
GeForce GTX 1060 Max-Q:
52.7 [X] Dell G5 15 5587 Intel Core i5-8300H 2.3GHz
GeForce GTX 1060 Max-Q
min:
45 fps, max:
61 fps
56 ~ 54 fps
GeForce GTX 1060 Max-Q:
38 [X] Dell G5 15 5587 Intel Core i5-8300H 2.3GHz
GeForce GTX 1060 Max-Q
min:
30 fps, max:
45 fps
41 ~ 40 fps
GeForce GTX 1060 Max-Q:
12 [X] Dell G5 15 5587 Intel Core i5-8300H 2.3GHz
GeForce GTX 1060 Max-Q
min:
10 fps, max:
14 fps
fps
GeForce GTX 1060 Max-Q:
73 109 ~ 91 fps
GeForce GTX 1060 Max-Q:
47.2 59 ~ 53 fps
GeForce GTX 1060 Max-Q:
33.9 43 ~ 38 fps
GeForce GTX 1060 Max-Q:
14.6 fps
GeForce GTX 1060 Max-Q:
178 [X] Dell G5 15 5587 Intel Core i5-8300H 2.3GHz
GeForce GTX 1060 Max-Q
min:
133 fps, max:
220 fps
fps
GeForce GTX 1060 Max-Q:
132.6 [X] Dell G5 15 5587 Intel Core i5-8300H 2.3GHz
GeForce GTX 1060 Max-Q
min:
101 fps, max:
157 fps
fps
GeForce GTX 1060 Max-Q:
115.7 [X] Dell G5 15 5587 Intel Core i5-8300H 2.3GHz
GeForce GTX 1060 Max-Q
min:
101 fps, max:
127 fps
fps
GeForce GTX 1060 Max-Q:
72.8 [X] Dell G5 15 5587 Intel Core i5-8300H 2.3GHz
GeForce GTX 1060 Max-Q
min:
64 fps, max:
79 fps
fps
GeForce GTX 1060 Max-Q:
135.5 [X] Dell G5 15 5587 Intel Core i5-8300H 2.3GHz
GeForce GTX 1060 Max-Q
min:
97 fps, max:
192 fps
fps
GeForce GTX 1060 Max-Q:
93.4 [X] Dell G5 15 5587 Intel Core i5-8300H 2.3GHz
GeForce GTX 1060 Max-Q
min:
66 fps, max:
107 fps
fps
GeForce GTX 1060 Max-Q:
81.5 [X] Dell G5 15 5587 Intel Core i5-8300H 2.3GHz
GeForce GTX 1060 Max-Q
min:
66 fps, max:
95 fps
fps
GeForce GTX 1060 Max-Q:
62.2 [X] Dell G5 15 5587 Intel Core i5-8300H 2.3GHz
GeForce GTX 1060 Max-Q
min:
54 fps, max:
71 fps
fps
GeForce GTX 1060 Max-Q:
117.9 [X] Dell G5 15 5587 Intel Core i5-8300H 2.3GHz
GeForce GTX 1060 Max-Q
min:
76 fps, max:
169 fps
fps
GeForce GTX 1060 Max-Q:
89.1 [X] Dell G5 15 5587 Intel Core i5-8300H 2.3GHz
GeForce GTX 1060 Max-Q
min:
65 fps, max:
113 fps
fps
GeForce GTX 1060 Max-Q:
78.5 [X] Dell G5 15 5587 Intel Core i5-8300H 2.3GHz
GeForce GTX 1060 Max-Q
min:
53 fps, max:
96 fps
fps
GeForce GTX 1060 Max-Q:
66.6 [X] Dell G5 15 5587 Intel Core i5-8300H 2.3GHz
GeForce GTX 1060 Max-Q
min:
42 fps, max:
92 fps
fps
GeForce GTX 1060 Max-Q:
23.8 [X] Dell G5 15 5587 Intel Core i5-8300H 2.3GHz
GeForce GTX 1060 Max-Q
min:
16 fps, max:
27 fps
fps
GeForce GTX 1060 Max-Q:
174.9 [X] Dell G5 15 5587 Intel Core i5-8300H 2.3GHz
GeForce GTX 1060 Max-Q
min:
118 fps, max:
251 fps
fps
GeForce GTX 1060 Max-Q:
163.3 [X] Dell G5 15 5587 Intel Core i5-8300H 2.3GHz
GeForce GTX 1060 Max-Q
min:
110 fps, max:
227 fps
fps
GeForce GTX 1060 Max-Q:
91.9 [X] Dell G5 15 5587 Intel Core i5-8300H 2.3GHz
GeForce GTX 1060 Max-Q
min:
68 fps, max:
112 fps
fps
GeForce GTX 1060 Max-Q:
70.9 [X] Dell G5 15 5587 Intel Core i5-8300H 2.3GHz
GeForce GTX 1060 Max-Q
min:
53 fps, max:
88 fps
fps
GeForce GTX 1060 Max-Q:
31.3 [X] Dell G5 15 5587 Intel Core i5-8300H 2.3GHz
GeForce GTX 1060 Max-Q
min:
24 fps, max:
38 fps
fps
GeForce GTX 1060 Max-Q:
77 fps
GeForce GTX 1060 Max-Q:
67 fps
GeForce GTX 1060 Max-Q:
62 fps
GeForce GTX 1060 Max-Q:
52 fps
GeForce GTX 1060 Max-Q:
21 fps
GeForce GTX 1060 Max-Q:
94.7 fps
GeForce GTX 1060 Max-Q:
85.4 fps
GeForce GTX 1060 Max-Q:
71.4 fps
GeForce GTX 1060 Max-Q:
17.6 fps
GeForce GTX 1060 Max-Q:
108.1 fps
GeForce GTX 1060 Max-Q:
83.5 fps
GeForce GTX 1060 Max-Q:
69.6 fps
GeForce GTX 1060 Max-Q:
57.2 fps
GeForce GTX 1060 Max-Q:
17 fps
GeForce GTX 1060 Max-Q:
128 fps
GeForce GTX 1060 Max-Q:
81 82 84 ~ 82 fps
GeForce GTX 1060 Max-Q:
60 62 65 ~ 62 fps
GeForce GTX 1060 Max-Q:
46 46 48 ~ 47 fps
GeForce GTX 1060 Max-Q:
17 27 ~ 22 fps
GeForce GTX 1060 Max-Q:
290.6 [X] Dell G5 15 5587 Intel Core i5-8300H 2.3GHz
GeForce GTX 1060 Max-Q
min:
266 fps, max:
334 fps
fps
GeForce GTX 1060 Max-Q:
277.9 [X] Dell G5 15 5587 Intel Core i5-8300H 2.3GHz
GeForce GTX 1060 Max-Q
min:
249 fps, max:
315 fps
fps
GeForce GTX 1060 Max-Q:
252.3 [X] Dell G5 15 5587 Intel Core i5-8300H 2.3GHz
GeForce GTX 1060 Max-Q
min:
217 fps, max:
289 fps
fps
GeForce GTX 1060 Max-Q:
245.7 [X] Dell G5 15 5587 Intel Core i5-8300H 2.3GHz
GeForce GTX 1060 Max-Q
min:
199 fps, max:
279 fps
fps
GeForce GTX 1060 Max-Q:
130 [X] Dell G5 15 5587 Intel Core i5-8300H 2.3GHz
GeForce GTX 1060 Max-Q
min:
113 fps, max:
150 fps
fps
GeForce GTX 1060 Max-Q:
109 fps
GeForce GTX 1060 Max-Q:
48 fps
GeForce GTX 1060 Max-Q:
35.5 fps
GeForce GTX 1060 Max-Q:
25.6 fps
GeForce GTX 1060 Max-Q:
8.5 fps
GeForce GTX 1060 Max-Q:
94 fps
GeForce GTX 1060 Max-Q:
77 98 ~ 88 fps
GeForce GTX 1060 Max-Q:
56 60 ~ 58 fps
GeForce GTX 1060 Max-Q:
26 fps
GeForce GTX 1060 Max-Q:
141.9 [X] Dell G5 15 5587 Intel Core i5-8300H 2.3GHz
GeForce GTX 1060 Max-Q
min:
126 fps, max:
145 fps
fps
GeForce GTX 1060 Max-Q:
92.5 [X] Dell G5 15 5587 Intel Core i5-8300H 2.3GHz
GeForce GTX 1060 Max-Q
min:
85 fps, max:
101 fps
fps
GeForce GTX 1060 Max-Q:
85.6 [X] Dell G5 15 5587 Intel Core i5-8300H 2.3GHz
GeForce GTX 1060 Max-Q
min:
63 fps, max:
100 fps
fps
GeForce GTX 1060 Max-Q:
63.3 [X] Dell G5 15 5587 Intel Core i5-8300H 2.3GHz
GeForce GTX 1060 Max-Q
min:
53 fps, max:
69 fps
fps
GeForce GTX 1060 Max-Q:
12.9 [X] Dell G5 15 5587 Intel Core i5-8300H 2.3GHz
GeForce GTX 1060 Max-Q
min:
1 fps, max:
25 fps
fps
100%
HD Graphics (Cherry Trail):
21.4 fps
300%
HD Graphics 6000:
64.2 [X] Intel NUC5i5RYK Intel Core i5-5250U 1.6GHz
HD Graphics 6000
min:
58 fps
fps
HD Graphics 6000:
37.4 (!) [X] Intel NUC5i5RYK Intel Core i5-5250U 1.6GHz
HD Graphics 6000
min:
34 fps
fps
HD Graphics 6000:
41.3 [X] Intel NUC5i5RYK Intel Core i5-5250U 1.6GHz
HD Graphics 6000
min:
37 fps, max:
45 fps
fps
GeForce GTX 1060 Max-Q:
28.8 fps
100%
HD Graphics (Cherry Trail):
15.5 fps
1613%
GeForce GTX 1060 Max-Q:
250 fps
183%
HD Graphics 6000:
28.4 [X] Intel NUC5i5RYK Intel Core i5-5250U 1.6GHz
HD Graphics 6000
min:
22 fps, max:
35 fps
fps
GeForce GTX 1060 Max-Q:
194 216 ~ 205 fps
GeForce GTX 1060 Max-Q:
134 155 ~ 145 fps
GeForce GTX 1060 Max-Q:
56.5 fps
GeForce GTX 1060 Max-Q:
116 126 ~ 121 fps
GeForce GTX 1060 Max-Q:
65 fps
GeForce GTX 1060 Max-Q:
58.7 fps
GeForce GTX 1060 Max-Q:
33.2 fps
GeForce GTX 1060 Max-Q:
19.4 fps
GeForce GTX 1060 Max-Q:
92.3 fps
GeForce GTX 1060 Max-Q:
87.8 fps
GeForce GTX 1060 Max-Q:
63.9 fps
GeForce GTX 1060 Max-Q:
25.7 fps
GeForce GTX 1060 Max-Q:
169 fps
GeForce GTX 1060 Max-Q:
93 fps
GeForce GTX 1060 Max-Q:
76.1 fps
GeForce GTX 1060 Max-Q:
25.1 fps
GeForce GTX 1060 Max-Q:
101 fps
GeForce GTX 1060 Max-Q:
56.8 fps
GeForce GTX 1060 Max-Q:
39.4 fps
GeForce GTX 1060 Max-Q:
18.9 fps
GeForce GTX 1060 Max-Q:
85.4 fps
GeForce GTX 1060 Max-Q:
64.7 fps
GeForce GTX 1060 Max-Q:
54.8 fps
GeForce GTX 1060 Max-Q:
23.7 fps
GeForce GTX 1060 Max-Q:
124 fps
GeForce GTX 1060 Max-Q:
91.6 fps
GeForce GTX 1060 Max-Q:
81.7 fps
GeForce GTX 1060 Max-Q:
34.6 fps
GeForce GTX 1060 Max-Q:
144 fps
GeForce GTX 1060 Max-Q:
79 fps
GeForce GTX 1060 Max-Q:
67.3 fps
GeForce GTX 1060 Max-Q:
24.8 fps
100%
HD Graphics (Cherry Trail):
22.6 [X] Chuwi Hi12 Intel Atom x5-Z8300 1.4GHz
HD Graphics (Cherry Trail)
min:
21 fps, max:
27 fps
fps
257%
HD Graphics 6000:
55.3 61 [X] Intel NUC5i5RYK Intel Core i5-5250U 1.6GHz
HD Graphics 6000
min:
53 fps, max:
80 fps
~ 58 fps
HD Graphics 6000:
32.7 fps
HD Graphics 6000:
18.9 fps
GeForce GTX 1060 Max-Q:
154 fps
GeForce GTX 1060 Max-Q:
76 fps
GeForce GTX 1060 Max-Q:
67.8 fps
GeForce GTX 1060 Max-Q:
25.3 fps
GeForce GTX 1060 Max-Q:
55.7 [X] Lenovo Legion Y520-15IKBM 80YY001APB Intel Core i5-7300HQ 2.5GHz
GeForce GTX 1060 Max-Q
fps
GeForce GTX 1060 Max-Q:
36.2 40.7 [X] Lenovo Legion Y520-15IKBM 80YY001APB Intel Core i5-7300HQ 2.5GHz
GeForce GTX 1060 Max-Q
~ 38 fps
GeForce GTX 1060 Max-Q:
330 fps
GeForce GTX 1060 Max-Q:
250 fps
GeForce GTX 1060 Max-Q:
248 fps
GeForce GTX 1060 Max-Q:
95.2 fps
GeForce GTX 1060 Max-Q:
110.3 fps
GeForce GTX 1060 Max-Q:
93 93.8 ~ 93 fps
GeForce GTX 1060 Max-Q:
50.2 52 ~ 51 fps
GeForce GTX 1060 Max-Q:
26.7 27.6 ~ 27 fps
GeForce GTX 1060 Max-Q:
15.8 16.3 ~ 16 fps
HD Graphics 6000:
20.8 [X] Intel NUC5i5RYK Intel Core i5-5250U 1.6GHz
HD Graphics 6000
min:
17 fps, max:
23 fps
fps
GeForce GTX 1060 Max-Q:
130 fps
GeForce GTX 1060 Max-Q:
66.4 fps
GeForce GTX 1060 Max-Q:
59.6 fps
GeForce GTX 1060 Max-Q:
20.5 fps
GeForce GTX 1060 Max-Q:
299.2 fps
HD Graphics 6000:
25 [X] Intel NUC5i5RYK Intel Core i5-5250U 1.6GHz
HD Graphics 6000
min:
20 fps, max:
31 fps
fps
GeForce GTX 1060 Max-Q:
266.2 fps
GeForce GTX 1060 Max-Q:
165 165.8 ~ 165 fps
GeForce GTX 1060 Max-Q:
50.3 fps
GeForce GTX 1060 Max-Q:
127 fps
GeForce GTX 1060 Max-Q:
91.1 fps
GeForce GTX 1060 Max-Q:
86.2 fps
GeForce GTX 1060 Max-Q:
28.4 fps
GeForce GTX 1060 Max-Q:
75.8 fps
GeForce GTX 1060 Max-Q:
59.8 62.2 ~ 61 fps
GeForce GTX 1060 Max-Q:
52.9 53.2 ~ 53 fps
GeForce GTX 1060 Max-Q:
20.8 21 ~ 21 fps
GeForce GTX 1060 Max-Q:
127 fps
GeForce GTX 1060 Max-Q:
61.9 fps
GeForce GTX 1060 Max-Q:
48.8 fps
GeForce GTX 1060 Max-Q:
22.1 fps
GeForce GTX 1060 Max-Q:
81 fps
GeForce GTX 1060 Max-Q:
71 fps
GeForce GTX 1060 Max-Q:
53 fps
GeForce GTX 1060 Max-Q:
22 fps
100%
HD Graphics (Cherry Trail):
11.5 fps
251%
HD Graphics 6000:
28.9 [X] Intel NUC5i5RYK Intel Core i5-5250U 1.6GHz
HD Graphics 6000
min:
9 fps, max:
80 fps
fps
100%
HD Graphics (Cherry Trail):
7 fps
3200%
GeForce GTX 1060 Max-Q:
224 fps
260%
HD Graphics 6000:
18.2 [X] Intel NUC5i5RYK Intel Core i5-5250U 1.6GHz
HD Graphics 6000
min:
8 fps, max:
71 fps
fps
GeForce GTX 1060 Max-Q:
126 fps
HD Graphics 6000:
10.9 [X] Intel NUC5i5RYK Intel Core i5-5250U 1.6GHz
HD Graphics 6000
min:
5 fps, max:
70 fps
fps
GeForce GTX 1060 Max-Q:
102 fps
HD Graphics 6000:
9.1 [X] Intel NUC5i5RYK Intel Core i5-5250U 1.6GHz
HD Graphics 6000
min:
4 fps, max:
80 fps
fps
GeForce GTX 1060 Max-Q:
37.3 fps
HD Graphics 6000:
18.6 [X] Intel NUC5i5RYK Intel Core i5-5250U 1.6GHz
HD Graphics 6000
min:
14 fps, max:
23 fps
fps
HD Graphics 6000:
14 [X] Intel NUC5i5RYK Intel Core i5-5250U 1.6GHz
HD Graphics 6000
min:
10 fps, max:
18 fps
fps
100%
HD Graphics (Cherry Trail):
8.8 fps
100%
HD Graphics (Cherry Trail):
4.8 fps
3917%
GeForce GTX 1060 Max-Q:
188 fps
GeForce GTX 1060 Max-Q:
93 fps
GeForce GTX 1060 Max-Q:
80.9 fps
GeForce GTX 1060 Max-Q:
29.3 fps
GeForce GTX 1060 Max-Q:
82.6 fps
GeForce GTX 1060 Max-Q:
65.8 fps
GeForce GTX 1060 Max-Q:
29.4 fps
GeForce GTX 1060 Max-Q:
22.2 fps
GeForce GTX 1060 Max-Q:
73.9 78.4 ~ 76 fps
GeForce GTX 1060 Max-Q:
61.3 64.6 ~ 63 fps
GeForce GTX 1060 Max-Q:
25.8 fps
HD Graphics 6000:
24.6 [X] Intel NUC5i5RYK Intel Core i5-5250U 1.6GHz
HD Graphics 6000
min:
20 fps, max:
31 fps
fps
HD Graphics 6000:
16.6 [X] Intel NUC5i5RYK Intel Core i5-5250U 1.6GHz
HD Graphics 6000
min:
14 fps, max:
19 fps
fps
100%
HD Graphics (Cherry Trail):
8.1 fps
100%
HD Graphics (Cherry Trail):
3.9 fps
HD Graphics 6000:
53 (!) [X] Intel NUC5i5RYK Intel Core i5-5250U 1.6GHz
HD Graphics 6000
min:
47 fps, max:
59 fps
fps
HD Graphics 6000:
39 (!) [X] Intel NUC5i5RYK Intel Core i5-5250U 1.6GHz
HD Graphics 6000
min:
33 fps, max:
42 fps
fps
HD Graphics 6000:
21.3 [X] Intel NUC5i5RYK Intel Core i5-5250U 1.6GHz
HD Graphics 6000
min:
18 fps, max:
24 fps
fps
100%
HD Graphics (Cherry Trail):
13.9 [X] Chuwi Hi12 Intel Atom x5-Z8300 1.4GHz
HD Graphics (Cherry Trail)
min:
7 fps, max:
19 fps
16.8 ~ 15 fps
349%
HD Graphics 6000:
52.3 [X] Intel NUC5i5RYK 0.5.0.0
Intel Core i5-5250U 1.6GHz
HD Graphics 6000
min:
34 fps, max:
63 fps
fps
HD Graphics 6000:
16 [X] Intel NUC5i5RYK Intel Core i5-5250U 1.6GHz
HD Graphics 6000
min:
10 fps, max:
22 fps
fps
100%
HD Graphics (Cherry Trail):
15.1 fps
232%
HD Graphics 6000:
35 [X] Intel NUC5i5RYK Intel Core i5-5250U 1.6GHz
HD Graphics 6000
min:
31 fps, max:
37 fps
fps
100%
HD Graphics (Cherry Trail):
9.8 fps
253%
HD Graphics 6000:
24.8 [X] Intel NUC5i5RYK Intel Core i5-5250U 1.6GHz
HD Graphics 6000
min:
22 fps, max:
28 fps
fps
GeForce GTX 1060 Max-Q:
60 fps
HD Graphics 6000:
9.5 [X] Intel NUC5i5RYK Intel Core i5-5250U 1.6GHz
HD Graphics 6000
min:
8 fps, max:
10 fps
fps
GeForce GTX 1060 Max-Q:
60 60 ~ 60 fps
GeForce GTX 1060 Max-Q:
42 fps
HD Graphics 6000:
19.3 [X] Intel NUC5i5RYK Intel Core i5-5250U 1.6GHz
HD Graphics 6000
min:
16 fps, max:
22 fps
fps
100%
HD Graphics (Cherry Trail):
20 [X] Chuwi Hi12 Intel Atom x5-Z8300 1.4GHz
HD Graphics (Cherry Trail)
min:
18 fps
fps
274%
HD Graphics 6000:
54.7 [X] Intel NUC5i5RYK Intel Core i5-5250U 1.6GHz
HD Graphics 6000
fps
100%
HD Graphics (Cherry Trail):
15.2 [X] Chuwi Hi12 Intel Atom x5-Z8300 1.4GHz
HD Graphics (Cherry Trail)
min:
13 fps
fps
223%
HD Graphics 6000:
33.9 [X] Intel NUC5i5RYK Intel Core i5-5250U 1.6GHz
HD Graphics 6000
min:
30.7 fps
fps
100%
HD Graphics (Cherry Trail):
7.2 [X] Chuwi Hi12 Intel Atom x5-Z8300 1.4GHz
HD Graphics (Cherry Trail)
min:
6 fps
fps
232%
HD Graphics 6000:
16.7 [X] Intel NUC5i5RYK Intel Core i5-5250U 1.6GHz
HD Graphics 6000
min:
15.4 fps
fps
HD Graphics 6000:
15.4 [X] Intel NUC5i5RYK Intel Core i5-5250U 1.6GHz
HD Graphics 6000
min:
14.4 fps
fps
HD Graphics 6000:
11 [X] Core i5-5250U (Intel NUC) Intel Core i5-5250U 1.6GHz
HD Graphics 6000
min:
8 fps, max:
15 fps
fps
GeForce GTX 1060 Max-Q:
129 129 ~ 129 fps
HD Graphics 6000:
10 [X] Core i5-5250U (Intel NUC) Intel Core i5-5250U 1.6GHz
HD Graphics 6000
min:
7 fps, max:
14 fps
fps
GeForce GTX 1060 Max-Q:
72 [X] Lenovo Legion Y520-15IKBM 80YY001APB Intel Core i5-7300HQ 2.5GHz
GeForce GTX 1060 Max-Q
74 81 81 ~ 77 fps
GeForce GTX 1060 Max-Q:
48 [X] Lenovo Legion Y520-15IKBM 80YY001APB Intel Core i5-7300HQ 2.5GHz
GeForce GTX 1060 Max-Q
49 53 54 ~ 51 fps
GeForce GTX 1060 Max-Q:
26 26 ~ 26 fps
HD Graphics 6000:
13.4 [X] Core i5-5250U (Intel NUC) 1.07
Intel Core i5-5250U 1.6GHz
HD Graphics 6000
min:
10 fps, max:
18 fps
13.8 [X] Core i5-5250U (Intel NUC) 1.03
Intel Core i5-5250U 1.6GHz
HD Graphics 6000
min:
10 fps, max:
17 fps
~ 14 fps
100%
HD Graphics (Cherry Trail):
20.1 fps
463%
HD Graphics 6000:
93 [X] Core i5-5250U (Intel NUC) Intel Core i5-5250U 1.6GHz
HD Graphics 6000
min:
79 fps, max:
120 fps
fps
100%
HD Graphics (Cherry Trail):
12.5 fps
182%
HD Graphics 6000:
22.8 [X] Core i5-5250U (Intel NUC) Intel Core i5-5250U 1.6GHz
HD Graphics 6000
min:
18 fps, max:
33 fps
fps
HD Graphics 6000:
12.9 [X] Core i5-5250U (Intel NUC) Intel Core i5-5250U 1.6GHz
HD Graphics 6000
min:
12.5 fps, max:
16.5 fps
fps
100%
HD Graphics (Cherry Trail):
10.8 (!) [X] Microsoft Surface 3 Intel Atom x7-Z8700 1.6GHz
HD Graphics (Cherry Trail)
fps
1452%
GeForce GTX 1060 Max-Q:
156.8 fps
GeForce GTX 1060 Max-Q:
151.6 fps
GeForce GTX 1060 Max-Q:
106.5 fps
GeForce GTX 1060 Max-Q:
61.8 fps
GeForce GTX 1060 Max-Q:
53.7 fps
HD Graphics 6000:
35.3 [X] Core i5-5250U (Intel NUC) Intel Core i5-5250U 1.6GHz
HD Graphics 6000
min:
30 fps, max:
45 fps
fps
HD Graphics 6000:
26.9 [X] Core i5-5250U (Intel NUC) Intel Core i5-5250U 1.6GHz
HD Graphics 6000
min:
23 fps, max:
33 fps
fps
HD Graphics 6000:
9.1 [X] Core i5-5250U (Intel NUC) Intel Core i5-5250U 1.6GHz
HD Graphics 6000
min:
7 fps, max:
12 fps
fps
HD Graphics 6000:
18.7 [X] Core i5-5250U (Intel NUC) Intel Core i5-5250U 1.6GHz
HD Graphics 6000
min:
16 fps, max:
21 fps
fps
HD Graphics 6000:
13.5 [X] Core i5-5250U (Intel NUC) Intel Core i5-5250U 1.6GHz
HD Graphics 6000
min:
11 fps, max:
16 fps
fps
100%
HD Graphics (Cherry Trail):
9.5 fps
220%
HD Graphics 6000:
20.9 [X] Core i5-5250U (Intel NUC) Intel Core i5-5250U 1.6GHz
HD Graphics 6000
min:
18.1 fps
fps
100%
HD Graphics (Cherry Trail):
5.7 fps
295%
HD Graphics 6000:
16.8 [X] Core i5-5250U (Intel NUC) Intel Core i5-5250U 1.6GHz
HD Graphics 6000
min:
13.4 fps
fps
HD Graphics 6000:
6.1 [X] Core i5-5250U (Intel NUC) Intel Core i5-5250U 1.6GHz
HD Graphics 6000
min:
5.1 fps
fps
HD Graphics 6000:
0 (!) [X] Core i5-5250U (Intel NUC) Intel Core i5-5250U 1.6GHz
HD Graphics 6000
fps
HD Graphics 6000:
33 [X] Core i5-5250U (Intel NUC) Intel Core i5-5250U 1.6GHz
HD Graphics 6000
min:
24 fps, max:
61 fps
fps
HD Graphics 6000:
17.6 [X] Core i5-5250U (Intel NUC) Intel Core i5-5250U 1.6GHz
HD Graphics 6000
min:
14 fps, max:
32 fps
fps
100%
HD Graphics (Cherry Trail):
16.2 fps
252%
HD Graphics 6000:
40.9 [X] Core i5-5250U (Intel NUC) Intel Core i5-5250U 1.6GHz
HD Graphics 6000
min:
16 fps, max:
68 fps
fps
100%
HD Graphics (Cherry Trail):
6.1 fps
341%
HD Graphics 6000:
20.8 [X] Core i5-5250U (Intel NUC) Intel Core i5-5250U 1.6GHz
HD Graphics 6000
min:
10 fps, max:
33 fps
fps
HD Graphics 6000:
13.3 [X] Core i5-5250U (Intel NUC) Intel Core i5-5250U 1.6GHz
HD Graphics 6000
min:
5 fps, max:
38 fps
fps
HD Graphics 6000:
10.7 [X] Core i5-5250U (Intel NUC) Intel Core i5-5250U 1.6GHz
HD Graphics 6000
min:
7 fps, max:
22 fps
fps
100%
HD Graphics (Cherry Trail):
16 fps
344%
HD Graphics 6000:
55 [X] Core i5-5250U (Intel NUC) Intel Core i5-5250U 1.6GHz
HD Graphics 6000
min:
40 fps
fps
100%
HD Graphics (Cherry Trail):
12 fps
308%
HD Graphics 6000:
37 [X] Core i5-5250U (Intel NUC) Intel Core i5-5250U 1.6GHz
HD Graphics 6000
min:
27 fps
fps
HD Graphics 6000:
21 [X] Core i5-5250U (Intel NUC) Intel Core i5-5250U 1.6GHz
HD Graphics 6000
min:
16 fps
fps
HD Graphics 6000:
13 [X] Core i5-5250U (Intel NUC) Intel Core i5-5250U 1.6GHz
HD Graphics 6000
min:
12 fps
fps
HD Graphics 6000:
26.4 fps
GeForce GTX 1060 Max-Q:
170.2 fps
GeForce GTX 1060 Max-Q:
139.9 fps
GeForce GTX 1060 Max-Q:
96.7 fps
GeForce GTX 1060 Max-Q:
76.9 fps
100%
HD Graphics (Cherry Trail):
15.6 fps
321%
HD Graphics 6000:
50 [X] Core i5-5250U (Intel NUC) Intel Core i5-5250U 1.6GHz
HD Graphics 6000
min:
42 fps, max:
61 fps
fps
HD Graphics 6000:
35.7 [X] Core i5-5250U (Intel NUC) Intel Core i5-5250U 1.6GHz
HD Graphics 6000
min:
30 fps, max:
40 fps
fps
HD Graphics 6000:
23.3 [X] Core i5-5250U (Intel NUC) Intel Core i5-5250U 1.6GHz
HD Graphics 6000
min:
20 fps, max:
27 fps
fps
203%
HD Graphics 6000:
144 [X] Core i5-5250U (Intel NUC) Intel Core i5-5250U 1.6GHz
HD Graphics 6000
min:
110 fps, max:
187 fps
fps
284%
HD Graphics 6000:
45.4 [X] Core i5-5250U (Intel NUC) Intel Core i5-5250U 1.6GHz
HD Graphics 6000
min:
34 fps, max:
64 fps
fps
100%
HD Graphics (Cherry Trail):
5.5 10 ~ 8 fps
273%
HD Graphics 6000:
21.8 [X] Core i5-5250U (Intel NUC) Intel Core i5-5250U 1.6GHz
HD Graphics 6000
min:
15 fps, max:
28 fps
fps
HD Graphics 6000:
14.1 [X] Core i5-5250U (Intel NUC) Intel Core i5-5250U 1.6GHz
HD Graphics 6000
min:
10 fps, max:
20 fps
fps
100%
HD Graphics (Cherry Trail):
22 27.3 ~ 25 fps
376%
HD Graphics 6000:
94 fps
100%
HD Graphics (Cherry Trail):
12.5 13.5 ~ 13 fps
246%
HD Graphics 6000:
32 fps
GeForce GTX 1060 Max-Q:
117.2 fps
GeForce GTX 1060 Max-Q:
112 fps
GeForce GTX 1060 Max-Q:
107.6 fps
GeForce GTX 1060 Max-Q:
60.2 [X] Lenovo Legion Y520-15IKBM 80YY001APB Intel Core i5-7300HQ 2.5GHz
GeForce GTX 1060 Max-Q
64.6 69 70.4 ~ 66 fps
HD Graphics 6000:
40 [X] Core i5-5250U (Intel NUC) Intel Core i5-5250U 1.6GHz
HD Graphics 6000
fps
HD Graphics 6000:
13 [X] Core i5-5250U (Intel NUC) Intel Core i5-5250U 1.6GHz
HD Graphics 6000
fps
HD Graphics 6000:
6.9 [X] Core i5-5250U (Intel NUC) Intel Core i5-5250U 1.6GHz
HD Graphics 6000
fps
100%
HD Graphics (Cherry Trail):
13.3 fps
241%
HD Graphics 6000:
32 [X] Core i5-5250U (Intel NUC) Intel Core i5-5250U 1.6GHz
HD Graphics 6000
min:
26 fps, max:
43 fps
fps
HD Graphics 6000:
22.2 [X] Core i5-5250U (Intel NUC) Intel Core i5-5250U 1.6GHz
HD Graphics 6000
min:
19 fps, max:
28 fps
fps
HD Graphics 6000:
15.6 [X] Core i5-5250U (Intel NUC) Intel Core i5-5250U 1.6GHz
HD Graphics 6000
min:
12 fps, max:
22 fps
fps
HD Graphics 6000:
5.6 [X] Core i5-5250U (Intel NUC) Intel Core i5-5250U 1.6GHz
HD Graphics 6000
min:
3 fps, max:
9 fps
fps
GeForce GTX 1060 Max-Q:
53.7 [X] Lenovo Legion Y520-15IKBM 80YY001APB Intel Core i5-7300HQ 2.5GHz
GeForce GTX 1060 Max-Q
fps
100%
HD Graphics (Cherry Trail):
58 fps
100%
HD Graphics (Cherry Trail):
47 fps
100%
HD Graphics (Cherry Trail):
29.7 fps
100%
HD Graphics (Cherry Trail):
16.5 fps
GeForce GTX 1060 Max-Q:
68.9 fps
GeForce GTX 1060 Max-Q:
65.7 fps
GeForce GTX 1060 Max-Q:
63.4 fps
GeForce GTX 1060 Max-Q:
40 fps
100%
HD Graphics (Cherry Trail):
24 fps
878%
GeForce GTX 1060 Max-Q:
210.8 fps
100%
HD Graphics (Cherry Trail):
13.5 fps
1132%
GeForce GTX 1060 Max-Q:
152.8 fps
GeForce GTX 1060 Max-Q:
143.3 fps
GeForce GTX 1060 Max-Q:
116.7 fps
HD Graphics 6000:
19 [X] Core i5-5250U (Intel NUC) Intel Core i5-5250U 1.6GHz
HD Graphics 6000
min:
10 fps, max:
36 fps
fps
HD Graphics 6000:
15.7 [X] Core i5-5250U (Intel NUC) Intel Core i5-5250U 1.6GHz
HD Graphics 6000
min:
8 fps, max:
32 fps
fps
HD Graphics 6000:
12 [X] Core i5-5250U (Intel NUC) Intel Core i5-5250U 1.6GHz
HD Graphics 6000
min:
7 fps, max:
23 fps
fps
GeForce GTX 1060 Max-Q:
64.3 74 ~ 69 fps
HD Graphics 6000:
6 [X] Core i5-5250U (Intel NUC) Intel Core i5-5250U 1.6GHz
HD Graphics 6000
min:
2 fps, max:
10 fps
fps
100%
HD Graphics (Cherry Trail):
16 18 18.9 [X] Medion Akoya E2215T Intel Atom x5-Z8350 1.4GHz
HD Graphics (Cherry Trail)
19.8 20.1 20.5 ~ 19 fps
226%
HD Graphics 6000:
42.9 43.9 ~ 43 fps
100%
HD Graphics (Cherry Trail):
6.4 7.9 [X] Medion Akoya E2215T Intel Atom x5-Z8350 1.4GHz
HD Graphics (Cherry Trail)
9.3 9.8 10 10 ~ 9 fps
300%
HD Graphics 6000:
26.4 26.6 ~ 27 fps
100%
HD Graphics (Cherry Trail):
5.6 5.7 [X] Medion Akoya E2215T Intel Atom x5-Z8350 1.4GHz
HD Graphics (Cherry Trail)
6.7 7.6 7.9 8.4 ~ 7 fps
2843%
GeForce GTX 1060 Max-Q:
159.5 [X] Lenovo Legion Y520-15IKBM 80YY001APB Intel Core i5-7300HQ 2.5GHz
GeForce GTX 1060 Max-Q
180.1 211.6 213.3 213.4 215 ~ 199 fps
315%
HD Graphics 6000:
22.1 fps
100%
HD Graphics (Cherry Trail):
2.4 2.6 ~ 2 fps
1142%
GeForce GTX 1060 Max-Q:
308.4 fps
230%
HD Graphics 6000:
60 64.7 ~ 62 fps
2136%
GeForce GTX 1060 Max-Q:
277.7 fps
262%
HD Graphics 6000:
33 34.5 ~ 34 fps
100%
HD Graphics (Cherry Trail):
7 8.3 9 ~ 8 fps
2131%
GeForce GTX 1060 Max-Q:
170.5 fps
275%
HD Graphics 6000:
22 22.9 ~ 22 fps
100%
HD Graphics (Cherry Trail):
3.7 3.8 ~ 4 fps
2890%
GeForce GTX 1060 Max-Q:
115.6 fps
HD Graphics 6000:
20.9 [X] Core i5-5250U (Intel NUC) Intel Core i5-5250U 1.6GHz
HD Graphics 6000
min:
16 fps, max:
29 fps
fps
HD Graphics 6000:
13.9 [X] Core i5-5250U (Intel NUC) Intel Core i5-5250U 1.6GHz
HD Graphics 6000
min:
11 fps, max:
19 fps
fps
100%
HD Graphics (Cherry Trail):
34 fps
GeForce GTX 1060 Max-Q:
105.8 fps
GeForce GTX 1060 Max-Q:
101 fps
GeForce GTX 1060 Max-Q:
88.7 fps
GeForce GTX 1060 Max-Q:
70 fps
100%
HD Graphics (Cherry Trail):
15.2 fps
100%
HD Graphics (Cherry Trail):
11.6 fps
HD Graphics (Cherry Trail):
0 (!) [X] Microsoft Surface 3 Intel Atom x7-Z8700 1.6GHz
HD Graphics (Cherry Trail)
fps
HD Graphics (Cherry Trail):
0 (!) [X] Microsoft Surface 3 Intel Atom x7-Z8700 1.6GHz
HD Graphics (Cherry Trail)
fps
GeForce GTX 1060 Max-Q:
45.7 fps
100%
HD Graphics (Cherry Trail):
20.3 fps
100%
HD Graphics (Cherry Trail):
11.4 fps
GeForce GTX 1060 Max-Q:
218.4 fps
GeForce GTX 1060 Max-Q:
192.7 fps
GeForce GTX 1060 Max-Q:
164.7 fps
GeForce GTX 1060 Max-Q:
69.5 fps
100%
HD Graphics (Cherry Trail):
24.3 [X] Chuwi Hi12 Intel Atom x5-Z8300 1.4GHz
HD Graphics (Cherry Trail)
min:
20 fps, max:
29 fps
31.9 ~ 28 fps
243%
HD Graphics 6000:
68 fps
100%
HD Graphics (Cherry Trail):
16 [X] Chuwi Hi12 Intel Atom x5-Z8300 1.4GHz
HD Graphics (Cherry Trail)
min:
13 fps, max:
19 fps
19 ~ 18 fps
217%
HD Graphics 6000:
39 fps
100%
HD Graphics (Cherry Trail):
8 fps
100%
HD Graphics (Cherry Trail):
15.5 18.9 ~ 17 fps
100%
HD Graphics (Cherry Trail):
7.2 8.5 ~ 8 fps
100%
HD Graphics (Cherry Trail):
25.6 fps
100%
HD Graphics (Cherry Trail):
12 fps
100%
HD Graphics (Cherry Trail):
28.1 fps
499%
GeForce GTX 1060 Max-Q:
140.1 fps
100%
HD Graphics (Cherry Trail):
12.5 fps
1010%
GeForce GTX 1060 Max-Q:
126.3 fps
GeForce GTX 1060 Max-Q:
112.2 fps
GeForce GTX 1060 Max-Q:
64.5 fps
100%
HD Graphics (Cherry Trail):
18.7 fps
100%
HD Graphics (Cherry Trail):
63.2 64 ~ 64 fps
184%
HD Graphics 6000:
118 fps
100%
HD Graphics (Cherry Trail):
18 18.8 ~ 18 fps
239%
HD Graphics 6000:
43 fps
100%
HD Graphics (Cherry Trail):
14 fps
150%
HD Graphics 6000:
21 fps
100%
HD Graphics (Cherry Trail):
7 fps
200%
HD Graphics 6000:
14 fps
100%
HD Graphics (Cherry Trail):
44 50.9 [X] Chuwi Hi12 Intel Atom x5-Z8300 1.4GHz
HD Graphics (Cherry Trail)
min:
40 fps, max:
60 fps
~ 47 fps
262%
HD Graphics 6000:
123 fps
100%
HD Graphics (Cherry Trail):
18.3 [X] Chuwi Hi12 Intel Atom x5-Z8300 1.4GHz
HD Graphics (Cherry Trail)
min:
13 fps, max:
29 fps
fps
257%
HD Graphics 6000:
47 fps
Average Gaming Intel HD Graphics (Cherry Trail) → 100% Average Gaming 30-70 fps → 100%
Average Gaming NVIDIA GeForce GTX 1060 Max-Q → 2115% Average Gaming Intel HD Graphics 6000 → 263% Average Gaming 30-70 fps → 265%
 Deutsch
 English
 Español
 Français
 Italiano
 Nederlands
 Polski
 Português
 Русский
 Türkçe
 Svenska
 Chinese
 Magyar