Intel HD Graphics (Cherry Trail) vs NVIDIA GeForce GTX 1050 Ti Max-Q vs Intel HD Graphics (Braswell)
Intel HD Graphics (Cherry Trail) ► remove from comparison
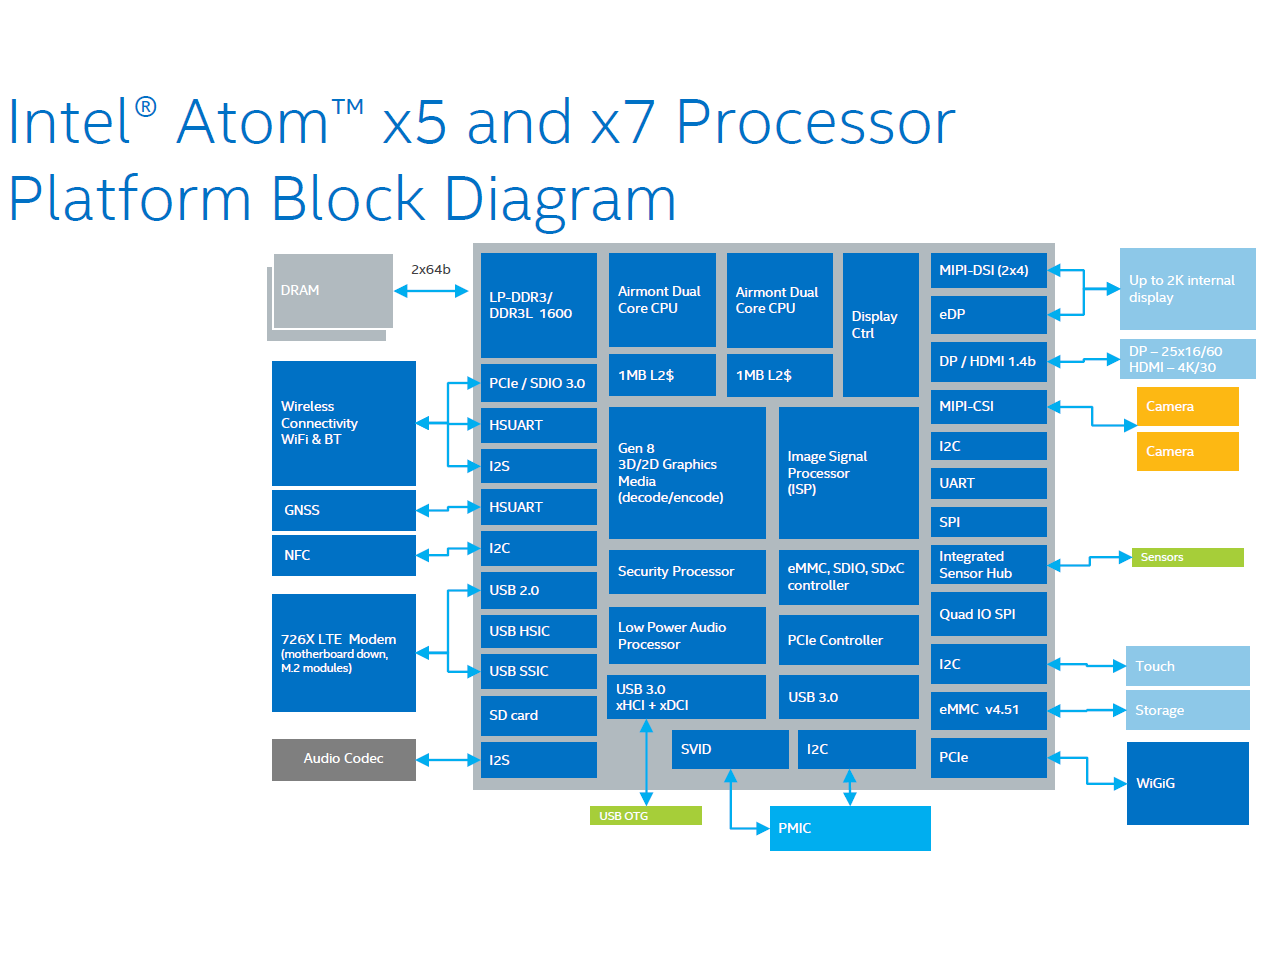
The Intel HD Graphics (Cherry Trail) is an integrated graphics card in the Cherry-Trail SoCs (e.g. Atom x7-Z8700). Based on a Broadwell GPU (Intel Gen8) and supports DirectX 11.2. Depending on the SoC offers 12 or 16 EUs.
Atom x7-Z8700: 16 EUs @ 200 - 600 MHz, dual-channel memory
In Windows, gaming is limited to less demanding or quite old games. Using Android, even high end 3D games should run fluently. For example Team Fortress 2 was running on the Surface 3 (x7-Z8700) only in lowest settings and 1280x720 fluently (11 - 69 fps range).
The integrated video decoder is able to display even 4K videos (H.264 tested) fluently.
The Intel HD Graphics GPU in our review sample of the MS Surface 3 (Atom x7-Z8700) only supported DisplayPort 1.1 as it seems, as 4K (3840x2160) with 30 Hz was the maximum Refresh Rate we could achieve (no 60 Hz selectable with the pre-installed drivers).
NVIDIA GeForce GTX 1050 Ti Max-Q ► remove from comparison
The Nvidia GTX 1050 Ti with Max-Q design is a power efficient mainstream GPU for laptops based on the Pascal architecture and was announced in January 2017. Contrary to the faster models, the GTX 1050 uses the GP107 chip, which is manufactured in a 14 nm process at Samsung.
The clock is not the only difference compared to the regular GTX 1050 Ti though. The drivers for the Max-Q version were optimized for efficiency (and not performance; only for Max-Q models), there are optimized voltage converters for 1V operation, high-end cooling methods, and a 40 dB limit for the fan noise (with clock adjustments to ensure this at all times).
Features
The GP107 chip is manufactured in a 14 nm FinFET process at Samsung and offers a number of new features, including support for DisplayPort 1.4 (ready), HDMI 2.0b, HDR, Simultaneous Multi-Projection (SMP) as well as improved H.265 video de- and encoding (PlayReady 3.0). A full list of improvements and the new Pascal desktop GPUs is available in our dedicated Pascal architecture article .
Performance
The performance of the GeForce GTX 1050 Ti can vary quite a lot depending on the cooling performance of the laptop. Nvidia states that the Max-Q variant should be about 10 to 15% slower than a regular GTX 1050 Ti for laptops. Therefore, the GPU is most suited for Full HD and high quality settings for games of 2016.
Power Consumption
The power consumption of the GeForce GTX 1050 Ti with Max-Q design is rated at 40 to 46 Watt and therefore a lot lower than a regular GTX 1050 Ti for laptops (53 Watt). This means that the Max-Q GTX 1050 Ti is also suited for thin and light laptops.
Intel HD Graphics (Braswell) ► remove from comparison
The Intel HD Graphics (Braswell) is an integrated graphics card in the low end SoCs of the Braswell series (e.g. Pentium N3700 ). It is based on the same architecture as the integrated GPU of the Broadwell graphics cards (e.g. HD Graphics 5300 ), but offers less shader cores and slower clock speeds.
The performance depends on the processor. The fastest models offer 16 EUs (shader cores) at 400 - 700 MHz. It should be about twice as fast as the old HD Graphics in Bay Trail SoCs . At the time of announcement in Q1 2015 the following models exist:
Pentium N3700: 16 EUs @ 400 - 700 MHz, Dual-Channel Memory Celeron N3150: 12 EUs @ 320 - 640 MHz, Dual-Channel Memory Celeron N3050: 12 EUs @ 320 - 600 MHz, Dual-Channel Memory Celeron N3000: 12 EUs @ 320 - 600 MHz, Dual-Channel Memory In the first CPUs the graphics card was only called Intel HD Graphics. Later (e.g. in the Celeron N3060) Intel renamed it to Intel HD Graphics 400 (Celeron with 12 EUs) and Intel HD Graphics 405 (Pentium with 16 EUs).
Gaming performance ist still only suited for older or less demanding games. Often also the processor is limited gaming performance (e.g. in the dual-core N3000).
The SoC also integrates a video decoding engine that should be able to handle 4K H.265 videos.
Intel HD Graphics (Cherry Trail) NVIDIA GeForce GTX 1050 Ti Max-Q Intel HD Graphics (Braswell) HD Graphics Series Codename Cherry Trail N17P-G1 Max-Q Braswell Architecture Gen. 8 Pascal Gen. 8 Pipelines 16 - unified 768 - unified 16 - unified Core Speed 200 - 600 (Boost) MHz 1151 – 1290 - 1290 – 1417 (Boost) MHz 320 - 700 (Boost) MHz Memory Bus Width 64/128 Bit 128 Bit 64/128 Bit Shared Memory yes no yes API DirectX 12 (FL 11_1), Shader 5.0, OpenGL 4.3 DirectX 12_1, OpenGL 4.5 DirectX 11.2, Shader 5.0 technology 14 nm 16 nm 14 nm Date of Announcement 02.03.2015 03.01.2018 01.04.2015 Memory Speed 7000 MHz Memory Type GDDR5 Max. Amount of Memory 4 GB Power Consumption 40 - 46 Watt Features Multi-Projection, VR Ready, G-SYNC, Vulkan, Multi Monitor Notebook Size medium sized Link to Manufacturer Page www.nvidia.com
Benchmarks Performance Rating - 3DMark 11 + Fire Strike + Time Spy - HD Graphics (Cherry Trail)
0.1 pt (0%)
Intel HD Graphics (Cherry Trail)
...
max:
Performance Rating - 3DMark 11 + Fire Strike + Time Spy - GeForce GTX 1050 Ti Max-Q
3.3 pt (10%)
...
NVIDIA GeForce GTX 1050 Ti Max-Q
...
max:
Performance Rating - 3DMark 11 + Fire Strike + Time Spy - HD Graphics (Braswell)
0.1 pt (0%)
Intel HD Graphics (Braswell)
...
max:
3DMark - 3DMark Time Spy Score
min: 2361 avg: 2453 median: 2485 (7%) max: 2513 Points
3DMark - 3DMark Time Spy Graphics
min: 2196 avg: 2245 median: 2261 (6%) max: 2278 Points
3DMark - 3DMark Ice Storm Unlimited Graphics
min: 18563 avg: 20873 median: 19303 (2%) max: 27537 Points
324705 Points (37%)
3DMark - 3DMark Ice Storm Extreme Graphics
39641 Points (5%)
3DMark - 3DMark Cloud Gate Score
min: 769 avg: 1454 median: 1488 (2%) max: 1905 Points
min: 20755 avg: 24100 median: 24021 (26%) max: 28253 Points
min: 1327 avg: 1595 median: 1529 (2%) max: 2134 Points
3DMark - 3DMark Cloud Gate Graphics
min: 1537 avg: 1851 median: 1783.5 (0%) max: 2272 Points
min: 41871 avg: 46017 median: 46952 (12%) max: 50801 Points
min: 1950 avg: 2187 median: 2193 (1%) max: 2457 Points
3DMark - 3DMark Fire Strike Standard Score
min: 174 avg: 390.4 median: 248 (0%) max: 1059 Points
min: 6175 avg: 6548 median: 6688 (12%) max: 6753 Points
min: 204 avg: 235.2 median: 238 (0%) max: 256 Points
3DMark - 3DMark Fire Strike Standard Graphics
min: 193 avg: 233 median: 225 (0%) max: 281 Points
min: 6957 avg: 7281 median: 7324 (8%) max: 7428 Points
min: 218 avg: 256.5 median: 261 (0%) max: 299 Points
3DMark - 3DMark Ice Storm Graphics
min: 7544 avg: 16078 median: 17063.5 (2%) max: 23395 Points
min: 41029 avg: 73224 median: 60442 (7%) max: 118202 Points
min: 20067 avg: 24121 median: 24638 (3%) max: 26079 Points
3DMark - 3DMark Sling Shot (ES 3.0) Unlimited
min: 1445 avg: 1525 median: 1525 (7%) max: 1605 Points
3DMark - 3DMark Sling Shot (ES 3.0) Unlimited Graphics
min: 1598 avg: 1684 median: 1684 (4%) max: 1770 Points
3DMark - 3DMark Sling Shot Extreme (ES 3.1) Unlimited
min: 1072 avg: 1215 median: 1159 (6%) max: 1414 Points
3DMark - 3DMark Sling Shot Extreme (ES 3.1) Unlimited Graphics
min: 1058 avg: 1251 median: 1142 (3%) max: 1554 Points
3DMark 11 - 3DM11 Performance Score
min: 314 avg: 359.4 median: 343 (0%) max: 562 Points
min: 8250 avg: 8936 median: 9106 (13%) max: 9414 Points
min: 310 avg: 434.8 median: 436 (1%) max: 518 Points
3DMark 11 - 3DM11 Performance GPU
min: 278 avg: 319.9 median: 298 (0%) max: 494 Points
min: 8317 avg: 8781 median: 8752 (8%) max: 9079 Points
min: 275 avg: 389.9 median: 395 (0%) max: 468 Points
3DMark Vantage + NVIDIA GeForce GTX 1050 Ti Max-Q 3DMark Vantage - 3DM Vant. Perf. total
min: 24827 avg: 29504 median: 29503.5 (9%) max: 34180 Points
3DM Vant. Perf. total + Intel HD Graphics (Braswell) 1479 Points (0%)
3DM Vant. Perf. GPU no PhysX + NVIDIA GeForce GTX 1050 Ti Max-Q 3DMark Vantage - 3DM Vant. Perf. GPU no PhysX
min: 25707 avg: 29448 median: 29448 (17%) max: 33189 Points
3DM Vant. Perf. GPU no PhysX + Intel HD Graphics (Braswell)
1328 Points (1%)
3DMark 06 3DMark 06 - Standard 1280x1024 + Intel HD Graphics (Cherry Trail)
min: 2403 avg: 2833 median: 2595 (3%) max: 3330 Points
3DMark 06 - Standard 1280x1024 + NVIDIA GeForce GTX 1050 Ti Max-Q
min: 26796 avg: 28797 median: 28797 (38%) max: 30798 Points
3DMark 06 - Standard 1280x1024 + Intel HD Graphics (Braswell)
1311 Points (2%)
3DMark 06 - Standard 1024x768 + Intel HD Graphics (Cherry Trail)
2877 Points (4%)
3DMark 06 - Standard 1024x768 + NVIDIA GeForce GTX 1050 Ti Max-Q
34786 Points (45%)
Unigine Valley 1.0 - Unigine Valley 1.0 DX
1.2 fps (0%)
40.1 fps (13%)
Unigine Heaven 2.1 - Heaven 2.1 high
5.7 fps (1%)
86 fps (16%)
min: 3.2 avg: 4.9 median: 4.9 (1%) max: 6.6 fps
Cinebench R10 Cinebench R10 Shading (32bit) + Intel HD Graphics (Cherry Trail) Cinebench R10 - Cinebench R10 Shading (32bit)
min: 1192 avg: 2009 median: 1973 (1%) max: 2551 Points
Cinebench R10 Shading (32bit) + NVIDIA GeForce GTX 1050 Ti Max-Q
min: 4597 avg: 5340 median: 4972 (4%) max: 6451 Points
Cinebench R10 Shading (32bit) + Intel HD Graphics (Braswell)
min: 1788 avg: 2276 median: 2284 (2%) max: 2747 Points
Cinebench R11.5 Cinebench R11.5 OpenGL 64 Bit + Intel HD Graphics (Cherry Trail) Cinebench R11.5 - Cinebench R11.5 OpenGL 64 Bit
min: 4.01 avg: 8.8 median: 8.4 (3%) max: 11.71 fps
Cinebench R11.5 OpenGL 64 Bit + NVIDIA GeForce GTX 1050 Ti Max-Q
min: 66.9 avg: 71.7 median: 71.7 (25%) max: 76.5 fps
Cinebench R11.5 OpenGL 64 Bit + Intel HD Graphics (Braswell)
min: 6.89 avg: 9.1 median: 9.5 (3%) max: 9.86 fps
Cinebench R15 + Intel HD Graphics (Cherry Trail) Cinebench R15 - Cinebench R15 OpenGL 64 Bit
min: 6.64 avg: 10.3 median: 9.7 (1%) max: 15.52 fps
Cinebench R15 OpenGL 64 Bit + NVIDIA GeForce GTX 1050 Ti Max-Q
min: 92.1 avg: 105.4 median: 102 (6%) max: 120.7 fps
Cinebench R15 OpenGL 64 Bit + Intel HD Graphics (Braswell)
min: 11.13 avg: 12.4 median: 12.3 (1%) max: 13.82 fps
Cinebench R15 OpenGL Ref. Match 64 Bit + Intel HD Graphics (Cherry Trail) Cinebench R15 - Cinebench R15 OpenGL Ref. Match 64 Bit
min: 98 avg: 98 median: 98 (98%) max: 98.6 %
Cinebench R15 OpenGL Ref. Match 64 Bit + NVIDIA GeForce GTX 1050 Ti Max-Q
99.6 % (100%)
Cinebench R15 OpenGL Ref. Match 64 Bit + Intel HD Graphics (Braswell)
98 % (98%)
GFXBench - GFXBench 5.0 Aztec Ruins High Tier Offscreen
49.5 fps (9%)
GFXBench - GFXBench 5.0 Aztec Ruins Normal Tier Offscreen
119.1 fps (9%)
GFXBench - GFXBench Car Chase Offscreen
min: 6.3 avg: 7.3 median: 7 (1%) max: 9 fps
min: 108.8 avg: 124.2 median: 124.2 (14%) max: 139.5 fps
GFXBench 3.1 - GFXBench Manhattan ES 3.1 Offscreen
min: 9.2 avg: 10.8 median: 11 (0%) max: 13 fps
min: 168 avg: 184.9 median: 184.9 (4%) max: 201.7 fps
12.5 fps (0%)
GFXBench 3.0 - GFXBench 3.0 Manhattan Offscreen
min: 8.4 avg: 13.8 median: 13.5 (1%) max: 18 fps
min: 229.8 avg: 253.2 median: 253.2 (15%) max: 276.5 fps
16.1 fps (1%)
GFXBench (DX / GLBenchmark) 2.7 + Intel HD Graphics (Cherry Trail) GFXBench (DX / GLBenchmark) 2.7 - GFXBench T-Rex HD Offscreen C24Z16
min: 22 avg: 30.5 median: 32 (0%) max: 38.5 fps
GFXBench T-Rex HD Offscreen C24Z16 + NVIDIA GeForce GTX 1050 Ti Max-Q
min: 501 avg: 531 median: 531 (4%) max: 561 fps
GFXBench T-Rex HD Offscreen C24Z16 + Intel HD Graphics (Braswell) 33 fps (0%)
LuxMark v2.0 64Bit - LuxMark v2.0 Room GPU
min: 48 avg: 58.7 median: 59 (0%) max: 69 Samples/s
min: 1167 avg: 1201 median: 1200.5 (5%) max: 1234 Samples/s
min: 54 avg: 54.5 median: 54.5 (0%) max: 55 Samples/s
LuxMark v2.0 64Bit - LuxMark v2.0 Sala GPU
min: 69 avg: 87.7 median: 89 (0%) max: 105 Samples/s
min: 2100 avg: 2222 median: 2221.5 (4%) max: 2343 Samples/s
min: 76 avg: 80.5 median: 80.5 (0%) max: 85 Samples/s
ComputeMark v2.1 - ComputeMark v2.1 Result
277 Points (0%)
min: 4515 avg: 4879 median: 4879 (5%) max: 5243 Points
306 Points (0%)
Power Consumption - Furmark Stress Test Power Consumption - external Monitor *
73.1 Watt (10%)
Power Consumption - The Witcher 3 Power Consumption - external Monitor *
75.8 Watt (11%)
Power Consumption - Witcher 3 Power Consumption *
min: 82 avg: 90 median: 85 (19%) max: 103 Watt
Power Consumption - Witcher 3 ultra Power Efficiency
min: 0.2379 avg: 0.3 median: 0.3 (26%) max: 0.3073 fps per Watt
Power Consumption - Witcher 3 ultra Power Efficiency - external Monitor
0.3 fps per Watt (27%)
Emissions Witcher 3 Fan Noise + NVIDIA GeForce GTX 1050 Ti Max-Q Emissions - Witcher 3 Fan Noise
min: 36.4 avg: 40.2 median: 38.4 (61%) max: 47.6 dB(A)
Clock Speed - GPU Clock Witcher 3 ultra
1392 MHz (55%)
Average Benchmarks Intel HD Graphics (Cherry Trail) → 100% n=19 Average Benchmarks NVIDIA GeForce GTX 1050 Ti Max-Q → 1712% n=19 Average Benchmarks Intel HD Graphics (Braswell) → 109% n=19
- Range of benchmark values for this graphics card
- Average benchmark values for this graphics card
* Smaller numbers mean a higher performance
1 This benchmark is not used for the average calculation
Game Benchmarks The following benchmarks stem from our benchmarks of review laptops. The performance depends on the used graphics memory, clock rate, processor, system settings, drivers, and operating systems. So the results don't have to be representative for all laptops with this GPU. For detailed information on the benchmark results, click on the fps number.
GeForce GTX 1050 Ti Max-Q:
133.2 fps
GeForce GTX 1050 Ti Max-Q:
56.7 fps
GeForce GTX 1050 Ti Max-Q:
44.3 fps
GeForce GTX 1050 Ti Max-Q:
27.2 fps
GeForce GTX 1050 Ti Max-Q:
11.3 fps
GeForce GTX 1050 Ti Max-Q:
67.1 fps
GeForce GTX 1050 Ti Max-Q:
40.5 fps
GeForce GTX 1050 Ti Max-Q:
34 fps
GeForce GTX 1050 Ti Max-Q:
30.4 fps
GeForce GTX 1050 Ti Max-Q:
9 fps
GeForce GTX 1050 Ti Max-Q:
83 89 [X] MSI GF75 8RD-001 Intel Core i7-8750H 2.2GHz
GeForce GTX 1050 Ti Max-Q
min:
61 fps, max:
89 fps
~ 86 fps
GeForce GTX 1050 Ti Max-Q:
47 50 [X] MSI GF75 8RD-001 Intel Core i7-8750H 2.2GHz
GeForce GTX 1050 Ti Max-Q
min:
40 fps, max:
60 fps
~ 49 fps
GeForce GTX 1050 Ti Max-Q:
43 46 [X] MSI GF75 8RD-001 Intel Core i7-8750H 2.2GHz
GeForce GTX 1050 Ti Max-Q
min:
38 fps, max:
56 fps
~ 45 fps
GeForce GTX 1050 Ti Max-Q:
40 43 [X] MSI GF75 8RD-001 Intel Core i7-8750H 2.2GHz
GeForce GTX 1050 Ti Max-Q
min:
33 fps, max:
53 fps
~ 42 fps
GeForce GTX 1050 Ti Max-Q:
29 [X] MSI GF75 8RD-001 Intel Core i7-8750H 2.2GHz
GeForce GTX 1050 Ti Max-Q
min:
24 fps, max:
37 fps
fps
GeForce GTX 1050 Ti Max-Q:
14 15 [X] MSI GF75 8RD-001 Intel Core i7-8750H 2.2GHz
GeForce GTX 1050 Ti Max-Q
min:
11 fps, max:
19 fps
~ 15 fps
GeForce GTX 1050 Ti Max-Q:
55.5 60.4 [X] MSI GF75 8RD-001 Intel Core i7-8750H 2.2GHz
GeForce GTX 1050 Ti Max-Q
min:
31.8 fps, max:
115.6 fps
~ 58 fps
GeForce GTX 1050 Ti Max-Q:
31.4 [X] MSI GF75 8RD-001 Intel Core i7-8750H 2.2GHz
GeForce GTX 1050 Ti Max-Q
min:
15.8 fps, max:
53.7 fps
49.8 ~ 41 fps
GeForce GTX 1050 Ti Max-Q:
23.5 [X] MSI GF75 8RD-001 Intel Core i7-8750H 2.2GHz
GeForce GTX 1050 Ti Max-Q
min:
12.1 fps, max:
39.8 fps
36.5 ~ 30 fps
GeForce GTX 1050 Ti Max-Q:
19.3 [X] MSI GF75 8RD-001 Intel Core i7-8750H 2.2GHz
GeForce GTX 1050 Ti Max-Q
min:
10.4 fps, max:
19.3 fps
28.3 ~ 24 fps
GeForce GTX 1050 Ti Max-Q:
4.7 fps
GeForce GTX 1050 Ti Max-Q:
73.2 fps
GeForce GTX 1050 Ti Max-Q:
47.9 fps
GeForce GTX 1050 Ti Max-Q:
36.1 fps
GeForce GTX 1050 Ti Max-Q:
35.3 fps
GeForce GTX 1050 Ti Max-Q:
12.9 fps
GeForce GTX 1050 Ti Max-Q:
134.5 fps
GeForce GTX 1050 Ti Max-Q:
87.4 fps
GeForce GTX 1050 Ti Max-Q:
73.7 fps
GeForce GTX 1050 Ti Max-Q:
65 fps
GeForce GTX 1050 Ti Max-Q:
13.2 fps
GeForce GTX 1050 Ti Max-Q:
100.1 fps
GeForce GTX 1050 Ti Max-Q:
57.3 fps
GeForce GTX 1050 Ti Max-Q:
47.9 fps
GeForce GTX 1050 Ti Max-Q:
44.8 fps
GeForce GTX 1050 Ti Max-Q:
17.3 fps
GeForce GTX 1050 Ti Max-Q:
193.6 fps
GeForce GTX 1050 Ti Max-Q:
128.7 fps
GeForce GTX 1050 Ti Max-Q:
80.5 fps
GeForce GTX 1050 Ti Max-Q:
61 fps
GeForce GTX 1050 Ti Max-Q:
22 fps
GeForce GTX 1050 Ti Max-Q:
64.8 fps
GeForce GTX 1050 Ti Max-Q:
41 fps
GeForce GTX 1050 Ti Max-Q:
37.5 fps
GeForce GTX 1050 Ti Max-Q:
35.9 fps
GeForce GTX 1050 Ti Max-Q:
11.3 fps
GeForce GTX 1050 Ti Max-Q:
118.7 fps
GeForce GTX 1050 Ti Max-Q:
46.3 fps
GeForce GTX 1050 Ti Max-Q:
45 fps
GeForce GTX 1050 Ti Max-Q:
37.5 fps
GeForce GTX 1050 Ti Max-Q:
10.1 fps
GeForce GTX 1050 Ti Max-Q:
67 fps
GeForce GTX 1050 Ti Max-Q:
43 fps
GeForce GTX 1050 Ti Max-Q:
34 fps
GeForce GTX 1050 Ti Max-Q:
18 fps
GeForce GTX 1050 Ti Max-Q:
7 fps
GeForce GTX 1050 Ti Max-Q:
122 fps
GeForce GTX 1050 Ti Max-Q:
67 fps
GeForce GTX 1050 Ti Max-Q:
61 fps
GeForce GTX 1050 Ti Max-Q:
47 fps
GeForce GTX 1050 Ti Max-Q:
20 fps
GeForce GTX 1050 Ti Max-Q:
97 fps
GeForce GTX 1050 Ti Max-Q:
39 fps
GeForce GTX 1050 Ti Max-Q:
35 fps
GeForce GTX 1050 Ti Max-Q:
29 fps
GeForce GTX 1050 Ti Max-Q:
11 fps
GeForce GTX 1050 Ti Max-Q:
134 fps
GeForce GTX 1050 Ti Max-Q:
80 fps
GeForce GTX 1050 Ti Max-Q:
62 fps
GeForce GTX 1050 Ti Max-Q:
38 fps
GeForce GTX 1050 Ti Max-Q:
17 fps
GeForce GTX 1050 Ti Max-Q:
100.3 fps
GeForce GTX 1050 Ti Max-Q:
39.2 fps
GeForce GTX 1050 Ti Max-Q:
34.9 fps
GeForce GTX 1050 Ti Max-Q:
26.8 fps
GeForce GTX 1050 Ti Max-Q:
8.3 fps
GeForce GTX 1050 Ti Max-Q:
60 fps
GeForce GTX 1050 Ti Max-Q:
49.1 fps
GeForce GTX 1050 Ti Max-Q:
45.3 fps
GeForce GTX 1050 Ti Max-Q:
42 fps
GeForce GTX 1050 Ti Max-Q:
14 fps
GeForce GTX 1050 Ti Max-Q:
76 91 91 ~ 86 fps
GeForce GTX 1050 Ti Max-Q:
45 48 48 ~ 47 fps
GeForce GTX 1050 Ti Max-Q:
41 44 44 ~ 43 fps
GeForce GTX 1050 Ti Max-Q:
38 38 41 ~ 39 fps
GeForce GTX 1050 Ti Max-Q:
13 13 14 ~ 13 fps
GeForce GTX 1050 Ti Max-Q:
92.7 fps
GeForce GTX 1050 Ti Max-Q:
80.3 fps
GeForce GTX 1050 Ti Max-Q:
69.4 fps
GeForce GTX 1050 Ti Max-Q:
39.5 fps
GeForce GTX 1050 Ti Max-Q:
61.5 75.1 ~ 68 fps
GeForce GTX 1050 Ti Max-Q:
36.6 37.7 ~ 37 fps
GeForce GTX 1050 Ti Max-Q:
23.3 25 ~ 24 fps
GeForce GTX 1050 Ti Max-Q:
9.2 fps
GeForce GTX 1050 Ti Max-Q:
92.3 fps
GeForce GTX 1050 Ti Max-Q:
42 fps
GeForce GTX 1050 Ti Max-Q:
34.3 fps
GeForce GTX 1050 Ti Max-Q:
30.4 fps
GeForce GTX 1050 Ti Max-Q:
58 fps
GeForce GTX 1050 Ti Max-Q:
41 fps
GeForce GTX 1050 Ti Max-Q:
33 fps
GeForce GTX 1050 Ti Max-Q:
27 fps
GeForce GTX 1050 Ti Max-Q:
13 fps
GeForce GTX 1050 Ti Max-Q:
119.5 fps
GeForce GTX 1050 Ti Max-Q:
69.4 fps
GeForce GTX 1050 Ti Max-Q:
64.3 fps
GeForce GTX 1050 Ti Max-Q:
57.9 fps
GeForce GTX 1050 Ti Max-Q:
18.9 fps
GeForce GTX 1050 Ti Max-Q:
105 fps
GeForce GTX 1050 Ti Max-Q:
55 fps
GeForce GTX 1050 Ti Max-Q:
41 fps
GeForce GTX 1050 Ti Max-Q:
31 fps
GeForce GTX 1050 Ti Max-Q:
13 fps
100%
HD Graphics (Cherry Trail):
21.4 fps
607%
GeForce GTX 1050 Ti Max-Q:
129.8 fps
GeForce GTX 1050 Ti Max-Q:
123.6 fps
GeForce GTX 1050 Ti Max-Q:
115.7 fps
GeForce GTX 1050 Ti Max-Q:
112.6 fps
GeForce GTX 1050 Ti Max-Q:
65.2 fps
100%
HD Graphics (Cherry Trail):
15.5 fps
1607%
GeForce GTX 1050 Ti Max-Q:
249.1 fps
GeForce GTX 1050 Ti Max-Q:
169.1 fps
GeForce GTX 1050 Ti Max-Q:
112.5 fps
GeForce GTX 1050 Ti Max-Q:
42.3 fps
GeForce GTX 1050 Ti Max-Q:
142.4 fps
GeForce GTX 1050 Ti Max-Q:
85.6 fps
GeForce GTX 1050 Ti Max-Q:
68.3 fps
GeForce GTX 1050 Ti Max-Q:
58.9 fps
GeForce GTX 1050 Ti Max-Q:
21.7 fps
GeForce GTX 1050 Ti Max-Q:
68.6 96.7 ~ 83 fps
GeForce GTX 1050 Ti Max-Q:
13.9 14.5 ~ 14 fps
GeForce GTX 1050 Ti Max-Q:
63.8 68.2 ~ 66 fps
GeForce GTX 1050 Ti Max-Q:
64.9 65.5 ~ 65 fps
GeForce GTX 1050 Ti Max-Q:
49.5 50.4 ~ 50 fps
GeForce GTX 1050 Ti Max-Q:
19.2 19.2 ~ 19 fps
100%
HD Graphics (Cherry Trail):
22.6 [X] Chuwi Hi12 Intel Atom x5-Z8300 1.4GHz
HD Graphics (Cherry Trail)
min:
21 fps, max:
27 fps
fps
GeForce GTX 1050 Ti Max-Q:
137.3 fps
GeForce GTX 1050 Ti Max-Q:
104.6 fps
GeForce GTX 1050 Ti Max-Q:
89.5 154.8 ~ 122 fps
GeForce GTX 1050 Ti Max-Q:
85.2 120 ~ 103 fps
GeForce GTX 1050 Ti Max-Q:
51.7 58.1 ~ 55 fps
GeForce GTX 1050 Ti Max-Q:
49.8 53.1 ~ 51 fps
GeForce GTX 1050 Ti Max-Q:
20.7 21.1 ~ 21 fps
GeForce GTX 1050 Ti Max-Q:
112.5 fps
GeForce GTX 1050 Ti Max-Q:
85.8 fps
GeForce GTX 1050 Ti Max-Q:
51 fps
GeForce GTX 1050 Ti Max-Q:
43 fps
GeForce GTX 1050 Ti Max-Q:
285.4 fps
GeForce GTX 1050 Ti Max-Q:
233.9 fps
GeForce GTX 1050 Ti Max-Q:
117.7 fps
GeForce GTX 1050 Ti Max-Q:
70.5 fps
GeForce GTX 1050 Ti Max-Q:
37 fps
GeForce GTX 1050 Ti Max-Q:
63 fps
GeForce GTX 1050 Ti Max-Q:
41.3 fps
GeForce GTX 1050 Ti Max-Q:
35.8 fps
GeForce GTX 1050 Ti Max-Q:
15.7 fps
GeForce GTX 1050 Ti Max-Q:
83.4 89.5 ~ 86 fps
GeForce GTX 1050 Ti Max-Q:
41.9 42.5 ~ 42 fps
GeForce GTX 1050 Ti Max-Q:
32.2 34.8 ~ 34 fps
GeForce GTX 1050 Ti Max-Q:
14.6 15.7 ~ 15 fps
GeForce GTX 1050 Ti Max-Q:
16.8 17.1 ~ 17 fps
100%
HD Graphics (Cherry Trail):
11.5 fps
2174%
GeForce GTX 1050 Ti Max-Q:
236.6 263.6 ~ 250 fps
100%
HD Graphics (Cherry Trail):
7 fps
2257%
GeForce GTX 1050 Ti Max-Q:
154.6 162.2 ~ 158 fps
GeForce GTX 1050 Ti Max-Q:
90.2 92.7 ~ 91 fps
GeForce GTX 1050 Ti Max-Q:
62.5 67.5 ~ 65 fps
GeForce GTX 1050 Ti Max-Q:
27.7 29.3 ~ 29 fps
100%
HD Graphics (Cherry Trail):
8.8 fps
100%
HD Graphics (Cherry Trail):
4.8 fps
100%
HD Graphics (Cherry Trail):
8.1 fps
100%
HD Graphics (Cherry Trail):
3.9 fps
100%
HD Graphics (Cherry Trail):
13.9 [X] Chuwi Hi12 Intel Atom x5-Z8300 1.4GHz
HD Graphics (Cherry Trail)
min:
7 fps, max:
19 fps
16.8 ~ 15 fps
1124%
GeForce GTX 1050 Ti Max-Q:
168.6 fps
112%
HD Graphics (Braswell):
16.8 fps
GeForce GTX 1050 Ti Max-Q:
143.9 fps
HD Graphics (Braswell):
11.9 fps
GeForce GTX 1050 Ti Max-Q:
112.7 fps
GeForce GTX 1050 Ti Max-Q:
101 fps
GeForce GTX 1050 Ti Max-Q:
34.4 fps
100%
HD Graphics (Cherry Trail):
15.1 fps
91%
HD Graphics (Braswell):
13.7 fps
100%
HD Graphics (Cherry Trail):
9.8 fps
97%
HD Graphics (Braswell):
9.5 fps
100%
HD Graphics (Cherry Trail):
20 [X] Chuwi Hi12 Intel Atom x5-Z8300 1.4GHz
HD Graphics (Cherry Trail)
min:
18 fps
fps
560%
GeForce GTX 1050 Ti Max-Q:
111.9 fps
100%
HD Graphics (Cherry Trail):
15.2 [X] Chuwi Hi12 Intel Atom x5-Z8300 1.4GHz
HD Graphics (Cherry Trail)
min:
13 fps
fps
686%
GeForce GTX 1050 Ti Max-Q:
104.2 fps
100%
HD Graphics (Cherry Trail):
7.2 [X] Chuwi Hi12 Intel Atom x5-Z8300 1.4GHz
HD Graphics (Cherry Trail)
min:
6 fps
fps
1363%
GeForce GTX 1050 Ti Max-Q:
98.1 fps
GeForce GTX 1050 Ti Max-Q:
93.5 fps
GeForce GTX 1050 Ti Max-Q:
46 fps
100%
HD Graphics (Cherry Trail):
20.1 fps
135%
HD Graphics (Braswell):
27.2 fps
100%
HD Graphics (Cherry Trail):
12.5 fps
57%
HD Graphics (Braswell):
7.1 fps
100%
HD Graphics (Cherry Trail):
10.8 (!) [X] Microsoft Surface 3 Intel Atom x7-Z8700 1.6GHz
HD Graphics (Cherry Trail)
fps
1393%
GeForce GTX 1050 Ti Max-Q:
150.4 fps
GeForce GTX 1050 Ti Max-Q:
143.3 fps
GeForce GTX 1050 Ti Max-Q:
78.9 fps
GeForce GTX 1050 Ti Max-Q:
34.5 fps
GeForce GTX 1050 Ti Max-Q:
35.5 fps
HD Graphics (Braswell):
13.2 fps
HD Graphics (Braswell):
8.7 fps
HD Graphics (Braswell):
5.4 fps
HD Graphics (Braswell):
3.9 fps
100%
HD Graphics (Cherry Trail):
9.5 fps
86%
HD Graphics (Braswell):
8.2 fps
100%
HD Graphics (Cherry Trail):
5.7 fps
107%
HD Graphics (Braswell):
6.1 fps
HD Graphics (Braswell):
6.1 fps
HD Graphics (Braswell):
4.3 fps
100%
HD Graphics (Cherry Trail):
16.2 fps
37%
HD Graphics (Braswell):
6 fps
100%
HD Graphics (Cherry Trail):
6.1 fps
52%
HD Graphics (Braswell):
3.2 fps
100%
HD Graphics (Cherry Trail):
16 fps
81%
HD Graphics (Braswell):
13 13 ~ 13 fps
100%
HD Graphics (Cherry Trail):
12 fps
100%
HD Graphics (Braswell):
12 12.5 ~ 12 fps
HD Graphics (Braswell):
13.7 fps
HD Graphics (Braswell):
8.8 fps
100%
HD Graphics (Cherry Trail):
15.6 fps
90%
HD Graphics (Braswell):
64 fps
117%
HD Graphics (Braswell):
18.7 fps
100%
HD Graphics (Cherry Trail):
5.5 10 ~ 8 fps
HD Graphics (Braswell):
7.9 fps
HD Graphics (Braswell):
5.6 fps
100%
HD Graphics (Cherry Trail):
22 27.3 ~ 25 fps
92%
HD Graphics (Braswell):
23 fps
100%
HD Graphics (Cherry Trail):
12.5 13.5 ~ 13 fps
96%
HD Graphics (Braswell):
12.5 fps
100%
HD Graphics (Cherry Trail):
13.3 fps
HD Graphics (Braswell):
3.8 fps
HD Graphics (Braswell):
2.1 fps
100%
HD Graphics (Cherry Trail):
58 fps
100%
HD Graphics (Cherry Trail):
47 fps
100%
HD Graphics (Cherry Trail):
29.7 fps
100%
HD Graphics (Cherry Trail):
16.5 fps
100%
HD Graphics (Cherry Trail):
24 fps
80%
HD Graphics (Braswell):
19.2 fps
100%
HD Graphics (Cherry Trail):
13.5 fps
93%
HD Graphics (Braswell):
12.6 fps
HD Graphics (Braswell):
12.5 fps
100%
HD Graphics (Cherry Trail):
16 18 18.9 [X] Medion Akoya E2215T Intel Atom x5-Z8350 1.4GHz
HD Graphics (Cherry Trail)
19.8 20.1 20.5 ~ 19 fps
95%
HD Graphics (Braswell):
16.2 17.4 17.5 17.7 [X] Medion Akoya S4219 Intel Pentium N3700 1.6GHz
HD Graphics (Braswell)
22.1 ~ 18 fps
100%
HD Graphics (Cherry Trail):
6.4 7.9 [X] Medion Akoya E2215T Intel Atom x5-Z8350 1.4GHz
HD Graphics (Cherry Trail)
9.3 9.8 10 10 ~ 9 fps
111%
HD Graphics (Braswell):
8.3 9.1 9.8 10 [X] Medion Akoya S4219 Intel Pentium N3700 1.6GHz
HD Graphics (Braswell)
11.4 ~ 10 fps
100%
HD Graphics (Cherry Trail):
5.6 5.7 [X] Medion Akoya E2215T Intel Atom x5-Z8350 1.4GHz
HD Graphics (Cherry Trail)
6.7 7.6 7.9 8.4 ~ 7 fps
114%
HD Graphics (Braswell):
6.9 7 7.4 8.4 [X] Medion Akoya S4219 Intel Pentium N3700 1.6GHz
HD Graphics (Braswell)
9.6 ~ 8 fps
100%
HD Graphics (Cherry Trail):
2.4 2.6 ~ 2 fps
100%
HD Graphics (Cherry Trail):
7 8.3 9 ~ 8 fps
100%
HD Graphics (Cherry Trail):
3.7 3.8 ~ 4 fps
HD Graphics (Braswell):
9.3 fps
HD Graphics (Braswell):
5.7 fps
HD Graphics (Braswell):
2.1 fps
HD Graphics (Braswell):
28.6 fps
HD Graphics (Braswell):
13 fps
HD Graphics (Braswell):
9.9 fps
100%
HD Graphics (Cherry Trail):
34 fps
100%
HD Graphics (Cherry Trail):
15.2 fps
99%
HD Graphics (Braswell):
15 fps
100%
HD Graphics (Cherry Trail):
11.6 fps
103%
HD Graphics (Braswell):
12 fps
HD Graphics (Braswell):
11.3 fps
HD Graphics (Cherry Trail):
0 (!) [X] Microsoft Surface 3 Intel Atom x7-Z8700 1.6GHz
HD Graphics (Cherry Trail)
fps
HD Graphics (Cherry Trail):
0 (!) [X] Microsoft Surface 3 Intel Atom x7-Z8700 1.6GHz
HD Graphics (Cherry Trail)
fps
47%
HD Graphics (Braswell):
12.2 fps
58%
HD Graphics (Braswell):
11.5 fps
100%
HD Graphics (Cherry Trail):
20.3 fps
51%
HD Graphics (Braswell):
10.4 fps
100%
HD Graphics (Cherry Trail):
11.4 fps
100%
HD Graphics (Cherry Trail):
24.3 [X] Chuwi Hi12 Intel Atom x5-Z8300 1.4GHz
HD Graphics (Cherry Trail)
min:
20 fps, max:
29 fps
31.9 ~ 28 fps
815%
GeForce GTX 1050 Ti Max-Q:
228.2 fps
91%
HD Graphics (Braswell):
25.5 fps
100%
HD Graphics (Cherry Trail):
16 [X] Chuwi Hi12 Intel Atom x5-Z8300 1.4GHz
HD Graphics (Cherry Trail)
min:
13 fps, max:
19 fps
19 ~ 18 fps
1126%
GeForce GTX 1050 Ti Max-Q:
202.6 fps
93%
HD Graphics (Braswell):
16.7 fps
GeForce GTX 1050 Ti Max-Q:
202.1 fps
HD Graphics (Braswell):
13.2 fps
GeForce GTX 1050 Ti Max-Q:
170.1 fps
112%
HD Graphics (Braswell):
28 30 ~ 29 fps
100%
HD Graphics (Braswell):
12.7 13.1 ~ 13 fps
100%
HD Graphics (Cherry Trail):
8 fps
101%
HD Graphics (Braswell):
8.1 fps
100%
HD Graphics (Cherry Trail):
15.5 18.9 ~ 17 fps
97%
HD Graphics (Braswell):
16.5 fps
100%
HD Graphics (Cherry Trail):
7.2 8.5 ~ 8 fps
103%
HD Graphics (Braswell):
8.2 fps
HD Graphics (Braswell):
5 fps
100%
HD Graphics (Cherry Trail):
25.6 fps
109%
HD Graphics (Braswell):
28 fps
100%
HD Graphics (Cherry Trail):
12 fps
116%
HD Graphics (Braswell):
13.9 fps
100%
HD Graphics (Cherry Trail):
28.1 fps
100%
HD Graphics (Cherry Trail):
12.5 fps
100%
HD Graphics (Cherry Trail):
18.7 fps
100%
HD Graphics (Cherry Trail):
63.2 64 ~ 64 fps
677%
GeForce GTX 1050 Ti Max-Q:
433.4 fps
100%
HD Graphics (Cherry Trail):
18 18.8 ~ 18 fps
1113%
GeForce GTX 1050 Ti Max-Q:
200.4 fps
100%
HD Graphics (Cherry Trail):
14 fps
1334%
GeForce GTX 1050 Ti Max-Q:
186.7 fps
100%
HD Graphics (Cherry Trail):
7 fps
1810%
GeForce GTX 1050 Ti Max-Q:
126.7 fps
HD Graphics (Braswell):
6.7 fps
HD Graphics (Braswell):
4.2 fps
HD Graphics (Braswell):
2.1 fps
100%
HD Graphics (Cherry Trail):
44 50.9 [X] Chuwi Hi12 Intel Atom x5-Z8300 1.4GHz
HD Graphics (Cherry Trail)
min:
40 fps, max:
60 fps
~ 47 fps
100%
HD Graphics (Cherry Trail):
18.3 [X] Chuwi Hi12 Intel Atom x5-Z8300 1.4GHz
HD Graphics (Cherry Trail)
min:
13 fps, max:
29 fps
fps
Average Gaming Intel HD Graphics (Cherry Trail) → 100% Average Gaming 30-70 fps → 100%
Average Gaming NVIDIA GeForce GTX 1050 Ti Max-Q → 1508% Average Gaming Intel HD Graphics (Braswell) → 92% Average Gaming 30-70 fps → 90%
 Deutsch
 English
 Español
 Français
 Italiano
 Nederlands
 Polski
 Português
 Русский
 Türkçe
 Svenska
 Chinese
 Magyar