Intel HD Graphics 620 vs Intel HD Graphics (Haswell) vs Intel HD Graphics (Bay Trail)
Intel HD Graphics 620 ► remove from comparison
The Intel HD Graphics 620 (GT2) is an integrated graphics unit, which can be found in various ULV (Ultra Low Voltage) processors of the Kaby Lake generation. This "GT2" version of the Kaby Lake GPU is clocked at up to 1050 MHz (depending on the CPU model). Due to its lack of dedicated graphics memory or eDRAM cache, the HD 620 has to access the main memory (2x 64bit DDR3/DDR4).
Performance
The exact performance of the HD Graphics 620 depends on various factors like L3 cache size, memory configuration (DDR3/DDR4) and maximum clock rate of the specific model but is very similar to the old HD Graphics 520 GPU. That means only some less demanding recent games like Farming Simulator 17 run fluently in low detail settings (see below for gaming benchmarks). Compared to dedicated graphics cards, the HD620 should be positioned between a GeForce 910M and 920M from Nvidia. For games, the drivers however are not that fast updated and tested as with GeForce graphics cards.
Features
The revised video engine now supports H.265/HEVC Main10 profile in hardware with 10 bit colors. Furthermore, Googles VP9 codec can also be hardware decoded. The first models do not support HDCP 2.2 and therefore Netflix 4K. This was added with the new models in 2017 and beginning of May 2017 also the older CPU models like the i3-7100U are now shipped with a new S-Spec Code that supports HDCP 2.2. HDMI 2.0 however is still only supported with an external converter chip (LSPCon).
Power Consumption
The HD Graphics 620 can be found in mobile processors specified at 15 W TDP and is therefore suited for compact laptops and ultrabooks.
Intel HD Graphics (Haswell) ► remove from comparison
The Intel HD Graphics (Haswell) is an integrated graphics card in the Haswell codenamed processors (Celeron and Pentium). It is the successor the the Intel HD Graphics in the Ivy Bridge CPUs and performs slightly better. Depending on the processor model, the base and turbo clock rates may differ, resulting in varying graphics performance between CPU models.
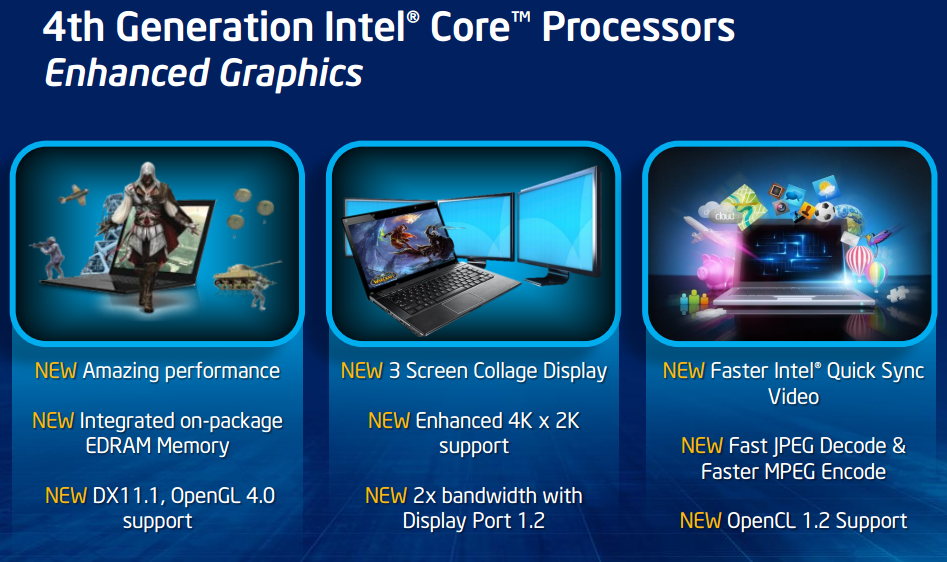
In comparison to the HD 4000, the graphics core has been modified extensively. The GPU supports DirectX 11.1, OpenCL 1.2 and OpenGL 4.0. It also features an improved decoder for 4K videos and the fast Quick Sync encoder (deactivated in many entry level models).
The Performance of the HD Graphics (Haswell) is similar to the old HD Graphics 3000 or the AMD Radeon HD 8250 . Only a few modern games like Dota 2 can be played fluently in very low details and resolutions.
Due to the 22nm 3D Tri-Gate production process, the power consumption should be relatively low (the development was focused on performance per Watt). The GPU can be found in ULV models and regular (37 W) dual core CPUs.
Intel HD Graphics (Bay Trail) ► remove from comparison
The Intel HD Graphics (Bay Trail) is a low-end integrated Bay Trail graphics card found in certain Atom models (Z3770 ), nettops (J2850 ) and notebook SoCs (N3510 ). It supports DirectX 11 and is based on the Ivy Bridge GPU. Clock rates and shader cores, however, are considerably lower.
Compared to Ivy Bridge, which offers either 6 or 16 Execution Units, the HD Graphics (Bay Trail) comes with only 4 EUs. The core clock is significantly lower as well. Depending on the specific model, the maximum Turbo Boost is 896 MHz or less and the memory controller can support DDR3(L), DDR3L-RS or LPDDR3 in single- or dual-channel operation.
The fastest notebook models equipped with this GPU nearly match the performance of the HD Graphics (Sandy Bridge) and the AMD Radeon HD 6310 . Therefore, older and less demanding Windows games like World of Warcraft or Half-Life 2 can be played fluently in very low settings. Performance is not sufficient for most modern titles.
Compared to competing ARM SoCs, Bay Trail outperforms the Adreno 320 (which can be found in different Qualcomm SoCs like the Snapdragon 600 ) and offers a performance similar to the Tegra 4 GPU. That is enough power to run even the most demanding Android games smoothly in very high resolutions as of 2013.
The integrated video decoder supports all popular codecs such as MPEG2, H.264, VC1, VP8 and MVC and is suitable for resolutions up to 4K up to 100 Mbit/s. The user can connect up to two displays via HDMI 1.4 (max. 1920 x 1080) or DisplayPort 1.2 (max. 2560 x 1600). Another new feature is the support for Wireless Display and Quick Sync, Intel's fast and power efficient H-264 hardware encoder. Some of these features are not available on all models.
Depending on the model, the power consumption of the entire SoC is somewhere between 2 and 10 W. The most efficient versions are therefore suitable for passively cooled tablets, whereas faster variants are used in larger subnotebooks with active cooling.
Intel HD Graphics 620 Intel HD Graphics (Haswell) Intel HD Graphics (Bay Trail) HD Graphics Series Codename Kaby-Lake GT2 Haswell GT1 Bay Trail Architecture Gen. 9.5 Kaby Lake Gen. 7.5 Haswell Gen. 7 Ivy Bridge Pipelines 24 - unified 10 - unified 4 - unified Core Speed 300 - 1050 (Boost) MHz 200 - 1000 (Boost) MHz 311 - 896 (Boost) MHz Memory Bus Width 64/128 Bit 64/128 Bit 32/64/128 Bit Memory Type DDR3/DDR4 Shared Memory yes yes yes API DirectX 12_1, OpenGL 4.4 DirectX 11.1, Shader 5.0 DirectX 11, Shader 5.0, OpenGL 4.0, ES 3.0 technology 14 nm 22 nm 22 nm Features QuickSync Date of Announcement 30.08.2016 01.10.2012 11.09.2013
CPU in HD Graphics 620 GPU Base Speed GPU Boost / Turbo Intel Core i7-7600U 2 x 2800 MHz, 15 W 300 MHz 1150 MHz Intel Core i7-7500U 2 x 2700 MHz, 15 W 300 MHz 1050 MHz Intel Core i5-7300U 2 x 2600 MHz, 15 W 300 MHz 1100 MHz » show 4 more Intel Core i5-7200U 2 x 2500 MHz, 15 W 300 MHz 1000 MHz Intel Core i3-7130U 2 x 2700 MHz, 15 W 300 MHz 1000 MHz Intel Core i3-7100U 2 x 2400 MHz, 15 W 300 MHz 1000 MHz Intel Core i3-7020U 2 x 2300 MHz, 15 W 300 MHz 1000 MHz min. - max. 300 MHz 1000 - 1150 MHz
CPU in HD Graphics (Haswell) GPU Base Speed GPU Boost / Turbo Intel Pentium 3560M 2 x 2400 MHz, 37 W 400 MHz 1100 MHz Intel Pentium 3550M 2 x 2300 MHz, 37 W 400 MHz 1100 MHz Intel Celeron 2970M 2 x 2200 MHz, 37 W 400 MHz 1100 MHz » show 10 more Intel Celeron 2950M 2 x 2000 MHz, 37 W 400 MHz 1100 MHz Intel Pentium 3558U 2 x 1700 MHz, 15 W 200 MHz 1000 MHz Intel Pentium 3556U 2 x 1700 MHz, 15 W 200 MHz 1000 MHz Intel Celeron 2981U 2 x 1600 MHz, 15 W 200 MHz 1000 MHz Intel Celeron 2980U 2 x 1600 MHz, 15 W 200 MHz 1000 MHz Intel Celeron 2957U 2 x 1400 MHz, 15 W 200 MHz 1000 MHz Intel Celeron 2955U 2 x 1400 MHz, 15 W 200 MHz 1000 MHz Intel Pentium 3561Y 2 x 1200 MHz, 11.5 W 200 MHz 850 MHz Intel Pentium 3560Y 2 x 1200 MHz, 11.5 W 200 MHz 850 MHz Intel Celeron 2961Y 2 x 1100 MHz, 11.5 W 200 MHz 850 MHz min. - max. 200 - 400 MHz 850 - 1150 MHz
CPU in HD Graphics (Bay Trail) GPU Base Speed GPU Boost / Turbo Intel Pentium N3540 4 x 2160 MHz, 7.5 W 313 MHz 896 MHz Intel Pentium J2900 4 x 2410 MHz, 10 W 688 MHz 896 MHz Intel Pentium N3530 4 x 2160 MHz, 7.5 W 313 MHz 896 MHz » show 43 more Intel Pentium J2850 4 x 2400 MHz, 10 W 688 MHz 792 MHz Intel Pentium N3520 4 x 2167 MHz, 7.5 W 313 MHz 854 MHz Intel Celeron J1900 4 x 2000 MHz, 10 W 688 MHz 854 MHz Intel Atom Z3795 4 x 1590 MHz, <4 W 311 MHz 778 MHz Intel Atom Z3785 4 x 1490 MHz, <4 W 313 MHz 833 MHz Intel Atom Z3775 4 x 1460 MHz, <4 W 311 MHz 778 MHz Intel Atom Z3775D 4 x 1490 MHz, <4 W 311 MHz 792 MHz Intel Atom Z3770 4 x 1460 MHz, <4 W 311 MHz 667 MHz Intel Atom Z3770D 4 x 1500 MHz, 4 W 313 MHz 688 MHz Intel Celeron N2940 4 x 1830 MHz, 7.5 W 313 MHz 854 MHz Intel Celeron N2930 4 x 1830 MHz, 7.5 W 313 MHz 854 MHz Intel Celeron J1850 4 x 2000 MHz, 10 W 688 MHz 792 MHz Intel Pentium N3510 4 x 2000 MHz, 7.5 W 313 MHz 750 MHz Intel Celeron N2920 4 x 1860 MHz, 7.5 W 313 MHz 854 MHz Intel Atom E3845 4 x 1910 MHz, 10 W 542 MHz 792 MHz Intel Atom Z3736F 4 x 1330 MHz, 4 W 313 MHz 646 MHz Intel Atom Z3736G 4 x 1330 MHz, <4 W 313 MHz 646 MHz Intel Atom Z3745 4 x 1330 MHz, <4 W 311 MHz 778 MHz Intel Atom Z3745D 4 x 1330 MHz, <4 W 311 MHz 792 MHz Intel Atom Z3740 4 x 1330 MHz, <4 W 311 MHz 667 MHz Intel Atom Z3740D 4 x 1330 MHz, <4 W 313 MHz 688 MHz Intel Atom Z3735D 4 x 1330 MHz, <4 W 311 MHz 646 MHz Intel Atom Z3735E 4 x 1330 MHz, <4 W 311 MHz 646 MHz Intel Atom Z3735F 4 x 1330 MHz, <4 W 311 MHz 646 MHz Intel Atom Z3735G 4 x 1330 MHz, <4 W 311 MHz 646 MHz Intel Celeron J1800 2 x 2410 MHz, 10 W 688 MHz 792 MHz Intel Celeron N2840 2 x 2160 MHz, 7.5 W 313 MHz 792 MHz Intel Celeron J1750 2 x 2410 MHz, 10 W 688 MHz 750 MHz Intel Celeron N2910 4 x 1600 MHz, 7.5 W 313 MHz 756 MHz Intel Celeron N2830 2 x 2160 MHz, 7.5 W 313 MHz 750 MHz Intel Celeron N2820 2 x 2170 MHz, 7.5 W 313 MHz 756 MHz Intel Celeron N2815 2 x 1860 MHz, 7.5 W 313 MHz 756 MHz Intel Celeron N2810 2 x 2000 MHz, 7.5 W 313 MHz 756 MHz Intel Atom Z3680 2 x 1330 MHz, 4 W 311 MHz 667 MHz Intel Atom Z3680D 2 x 1330 MHz, 4 W 313 MHz 688 MHz Intel Celeron N2808 2 x 1580 MHz, 4.3 W 313 MHz 792 MHz Intel Celeron N2807 2 x 1580 MHz, 4.3 W 313 MHz 750 MHz Intel Celeron N2806 2 x 1580 MHz, 4.5 W 313 MHz 756 MHz Intel Atom E3827 2 x 1750 MHz, 8 W 542 MHz 792 MHz Intel Atom E3826 2 x 1460 MHz, 7 W 533 MHz 667 MHz Intel Celeron N2805 2 x 1460 MHz, 4.3 W 313 MHz 667 MHz Intel Atom E3825 2 x 1330 MHz, 6 W ? MHz 533 MHz Intel Atom E3815 1 x 1460 MHz, 5 W ? MHz 400 MHz min. - max. 200 - ? MHz 400 - 1150 MHz
Benchmarks Performance Rating - 3DMark 11 + Fire Strike + Time Spy - HD Graphics 620
0.4 pt (1%)
...
...
max:
Performance Rating - 3DMark 11 + Fire Strike + Time Spy - HD Graphics (Haswell)
0.2 pt (0%)
...
Intel HD Graphics (Haswell)
...
max:
Performance Rating - 3DMark 11 + Fire Strike + Time Spy - HD Graphics (Bay Trail)
0.1 pt (0%)
Intel HD Graphics (Bay Trail)
...
max:
3DMark - 3DMark Time Spy Score
min: 329 avg: 364.2 median: 365 (1%) max: 398 Points
3DMark - 3DMark Time Spy Graphics
min: 290 avg: 320 median: 321 (1%) max: 349 Points
3DMark - 3DMark Ice Storm Unlimited Graphics
min: 57706 avg: 77795 median: 79066.5 (9%) max: 98195 Points
43493 Points (5%)
min: 11835 avg: 14513 median: 14748.5 (2%) max: 17613 Points
3DMark - 3DMark Ice Storm Extreme Graphics
min: 12780 avg: 41308 median: 38918 (5%) max: 55020 Points
min: 4751 avg: 7342 median: 7498 (1%) max: 9234 Points
3DMark - 3DMark Cloud Gate Score
min: 3369 avg: 6049 median: 5993 (6%) max: 7245 Points
min: 2141 avg: 2403 median: 2335.5 (2%) max: 3011 Points
min: 354 avg: 1182 median: 1188 (1%) max: 1703 Points
3DMark - 3DMark Cloud Gate Graphics
min: 5790 avg: 7755 median: 7725 (2%) max: 9610 Points
min: 3111 avg: 3415 median: 3278 (1%) max: 4199 Points
min: 362 avg: 1230 median: 1228.5 (0%) max: 1670 Points
3DMark - 3DMark Fire Strike Standard Score
min: 316 avg: 845 median: 858 (2%) max: 1078 Points
min: 300 avg: 323.8 median: 314 (1%) max: 383 Points
min: 83 avg: 185 median: 147 (0%) max: 495 Points
3DMark - 3DMark Fire Strike Standard Graphics
min: 328 avg: 916 median: 934 (1%) max: 1176 Points
min: 340 avg: 370.8 median: 362.5 (0%) max: 433 Points
min: 90 avg: 149.1 median: 149 (0%) max: 200 Points
3DMark - 3DMark Ice Storm Graphics
min: 11084 avg: 66525 median: 62248.5 (7%) max: 92261 Points
min: 29291 avg: 34138 median: 34675 (4%) max: 40515 Points
min: 5056 avg: 15391 median: 16047 (2%) max: 21351 Points
3DMark 11 - 3DM11 Performance Score
min: 1146 avg: 1639 median: 1645.5 (2%) max: 1970 Points
min: 435 avg: 543 median: 544 (1%) max: 688 Points
min: 143 avg: 222.6 median: 216 (0%) max: 280 Points
3DMark 11 - 3DM11 Performance GPU
min: 1067 avg: 1499 median: 1508.5 (1%) max: 1777 Points
min: 384 avg: 479.6 median: 484 (0%) max: 602 Points
min: 122 avg: 192.1 median: 186.5 (0%) max: 237 Points
3DMark Vantage + Intel HD Graphics 620 3DMark Vantage - 3DM Vant. Perf. total
min: 5195 avg: 5911 median: 5803 (2%) max: 6924 Points
3DM Vant. Perf. total + Intel HD Graphics (Haswell)
min: 2146 avg: 2163 median: 2163 (1%) max: 2180 Points
3DM Vant. Perf. total + Intel HD Graphics (Bay Trail) min: 507 avg: 666 median: 637 (0%) max: 846 Points
3DM Vant. Perf. GPU no PhysX + Intel HD Graphics 620 3DMark Vantage - 3DM Vant. Perf. GPU no PhysX
min: 4384 avg: 5059 median: 5019 (3%) max: 5945 Points
3DM Vant. Perf. GPU no PhysX + Intel HD Graphics (Haswell)
min: 1848 avg: 1859 median: 1859 (1%) max: 1870 Points
3DM Vant. Perf. GPU no PhysX + Intel HD Graphics (Bay Trail) min: 395 avg: 512 median: 503 (0%) max: 667 Points
3DMark 2001SE - 3DMark 2001 - Standard
67477 Points (70%)
7727 Points (8%)
3DMark 03 - 3DMark 03 - Standard
min: 16812 avg: 19095 median: 17494 (9%) max: 23293 Points
min: 4226 avg: 4997 median: 5220 (3%) max: 5323 Points
3DMark 05 - 3DMark 05 - Standard
min: 10111 avg: 12578 median: 12160 (13%) max: 16394 Points
min: 2666 avg: 3195 median: 3331 (4%) max: 3445 Points
3DMark 06 3DMark 06 - Standard 1280x1024 + Intel HD Graphics 620
min: 6656 avg: 8841 median: 8449 (11%) max: 11506 Points
3DMark 06 - Standard 1280x1024 + Intel HD Graphics (Haswell)
min: 2917 avg: 3274 median: 3357.5 (4%) max: 3463 Points
3DMark 06 - Standard 1280x1024 + Intel HD Graphics (Bay Trail)
min: 814 avg: 1785 median: 1866 (2%) max: 2151 Points
3DMark 06 - Score Unknown Settings + Intel HD Graphics (Bay Trail)
2108 Points (3%)
3DMark 06 - Standard 1280x800 + Intel HD Graphics (Bay Trail)
2087 Points (3%)
Unigine Valley 1.0 - Unigine Valley 1.0 DX
4.2 fps (1%)
Unigine Heaven 3.0 - Unigine Heaven 3.0 DX 11
3.6 fps (1%)
Unigine Heaven 2.1 - Heaven 2.1 high
min: 2.4 avg: 2.8 median: 2.8 (1%) max: 3.4 fps
SPECviewperf 11 + Intel HD Graphics 620 SPECviewperf 11 - specvp11 snx-01
min: 2.15 avg: 2.6 median: 2.6 (2%) max: 2.88 fps
specvp11 tcvis-02 + Intel HD Graphics 620 SPECviewperf 11 - specvp11 tcvis-02
min: 3.04 avg: 3.7 median: 3.7 (2%) max: 4.24 fps
specvp11 sw-02 + Intel HD Graphics 620 SPECviewperf 11 - specvp11 sw-02
min: 15.83 avg: 18.8 median: 18.8 (14%) max: 21.08 fps
specvp11 proe-05 + Intel HD Graphics 620 SPECviewperf 11 - specvp11 proe-05
min: 2.19 avg: 2.7 median: 2.8 (3%) max: 3.05 fps
specvp11 maya-03 + Intel HD Graphics 620 SPECviewperf 11 - specvp11 maya-03
min: 14.77 avg: 19.6 median: 20.9 (16%) max: 24.52 fps
specvp11 lightwave-01 + Intel HD Graphics 620 SPECviewperf 11 - specvp11 lightwave-01
min: 18.73 avg: 22.2 median: 22.6 (24%) max: 24.92 fps
specvp11 ensight-04 + Intel HD Graphics 620 SPECviewperf 11 - specvp11 ensight-04
min: 2.57 avg: 3.1 median: 3.1 (1%) max: 3.44 fps
SPECviewperf 12 + Intel HD Graphics 620 SPECviewperf 12 - specvp12 sw-03
min: 21.24 avg: 25.2 median: 26.5 (7%) max: 27.76 fps
specvp12 snx-02 + Intel HD Graphics 620 SPECviewperf 12 - specvp12 snx-02
min: 2.88 avg: 3.3 median: 3.4 (0%) max: 3.54 fps
specvp12 showcase-01 + Intel HD Graphics 620 SPECviewperf 12 - specvp12 showcase-01
min: 4.34 avg: 5.9 median: 5.9 (1%) max: 7.44 fps
specvp12 mediacal-01 + Intel HD Graphics 620 SPECviewperf 12 - specvp12 mediacal-01
min: 3.71 avg: 4 median: 3.9 (1%) max: 4.37 fps
specvp12 maya-04 + Intel HD Graphics 620 SPECviewperf 12 - specvp12 maya-04
min: 9.87 avg: 11.6 median: 11.9 (3%) max: 12.98 fps
specvp12 energy-01 + Intel HD Graphics 620 SPECviewperf 12 - specvp12 energy-01
min: 0.21 avg: 0.2 median: 0.2 (0%) max: 0.25 fps
specvp12 creo-01 + Intel HD Graphics 620 SPECviewperf 12 - specvp12 creo-01
min: 10.51 avg: 11.2 median: 11.5 (5%) max: 11.65 fps
specvp12 catia-04 + Intel HD Graphics 620 SPECviewperf 12 - specvp12 catia-04
min: 10.97 avg: 12.3 median: 12.9 (2%) max: 12.89 fps
Windows 7 Experience Index - Win7 Gaming graphics
6.3 Points (80%)
Windows 7 Experience Index - Win7 Graphics
4.7 Points (59%)
Cinebench R10 Cinebench R10 Shading (32bit) + Intel HD Graphics 620 Cinebench R10 - Cinebench R10 Shading (32bit)
min: 5609 avg: 8194 median: 8162.5 (6%) max: 10255 Points
Cinebench R10 Shading (32bit) + Intel HD Graphics (Haswell)
min: 3867 avg: 4235 median: 4215.5 (3%) max: 4642 Points
Cinebench R10 Shading (32bit) + Intel HD Graphics (Bay Trail)
min: 898 avg: 2014 median: 1991.5 (1%) max: 2889 Points
Cinebench R11.5 Cinebench R11.5 OpenGL 64 Bit + Intel HD Graphics 620 Cinebench R11.5 - Cinebench R11.5 OpenGL 64 Bit
min: 23.21 avg: 34.2 median: 34.6 (12%) max: 46.96 fps
Cinebench R11.5 OpenGL 64 Bit + Intel HD Graphics (Haswell)
min: 9.38 avg: 11.4 median: 11.6 (4%) max: 12.78 fps
Cinebench R11.5 OpenGL 64 Bit + Intel HD Graphics (Bay Trail)
min: 0.37 avg: 6.2 median: 6.4 (2%) max: 7.69 fps
Cinebench R15 + Intel HD Graphics 620 Cinebench R15 - Cinebench R15 OpenGL 64 Bit
min: 16.62 avg: 41.8 median: 40.5 (2%) max: 97.8 fps
Cinebench R15 OpenGL 64 Bit + Intel HD Graphics (Haswell)
min: 10.28 avg: 13.2 median: 13.9 (1%) max: 14.59 fps
Cinebench R15 OpenGL 64 Bit + Intel HD Graphics (Bay Trail) min: 2.88 avg: 5 median: 5.5 (0%) max: 6.55 fps
Cinebench R15 OpenGL Ref. Match 64 Bit + Intel HD Graphics 620 Cinebench R15 - Cinebench R15 OpenGL Ref. Match 64 Bit
min: 38.11 avg: 97.2 median: 97.7 (98%) max: 97.8 %
Cinebench R15 OpenGL Ref. Match 64 Bit + Intel HD Graphics (Haswell)
98 % (98%)
Cinebench R15 OpenGL Ref. Match 64 Bit + Intel HD Graphics (Bay Trail)
min: 63 avg: 96.1 median: 97.8 (98%) max: 97.8 %
GFXBench - GFXBench Car Chase Offscreen
11.6 fps (1%)
GFXBench 3.1 - GFXBench Manhattan ES 3.1 Offscreen
20.1 fps (0%)
5.2 fps (0%)
GFXBench 3.0 - GFXBench 3.0 Manhattan Offscreen
28.7 fps (2%)
min: 6 avg: 9.7 median: 8.8 (1%) max: 16 fps
GFXBench (DX / GLBenchmark) 2.7 + Intel HD Graphics (Haswell) GFXBench (DX / GLBenchmark) 2.7 - GFXBench T-Rex HD Offscreen C24Z16
53.5 fps (0%)
GFXBench T-Rex HD Offscreen C24Z16 + Intel HD Graphics (Bay Trail) min: 6 avg: 15.7 median: 16 (0%) max: 20.2 fps
Basemark ES 2.0 - Basemark ES 2.0
min: 45.08 avg: 49.1 median: 49.1 (81%) max: 53.1 fps
Basemark X 1.0 - Basemark X 1.0 Off-Screen
10.1 fps (48%)
Basemark X 1.1 - Basemark X 1.1 High Quality
min: 3008 avg: 6663 median: 8456 (19%) max: 8524 Points
Basemark X 1.1 - Basemark X 1.1 Medium Quality
min: 4802 avg: 12880 median: 14509 (32%) max: 17701 Points
NenaMark2 - NenaMark2 Score
min: 59 avg: 59.4 median: 59.4 (88%) max: 59.7 fps
LuxMark v2.0 64Bit - LuxMark v2.0 Room GPU
min: 161 avg: 217.1 median: 215 (1%) max: 309 Samples/s
min: 77 avg: 93 median: 93 (0%) max: 109 Samples/s
min: 25 avg: 28.5 median: 27 (0%) max: 35 Samples/s
LuxMark v2.0 64Bit - LuxMark v2.0 Sala GPU
min: 410 avg: 557 median: 564 (1%) max: 647 Samples/s
min: 115 avg: 140 median: 140 (0%) max: 165 Samples/s
min: 26 avg: 29 median: 29 (0%) max: 34 Samples/s
ComputeMark v2.1 - ComputeMark v2.1 Result
min: 801 avg: 875 median: 875 (1%) max: 970 Points
min: 355 avg: 370 median: 370 (0%) max: 385 Points
min: 160 avg: 172.8 median: 174 (0%) max: 192 Points
PassMark PerformanceTest Mobile V1 - PerformanceTest Mobile V1 2D Graphics Tests
min: 3822 avg: 4036 median: 3866 (4%) max: 4588 Points
PassMark PerformanceTest Mobile V1 - PerformanceTest Mobile V1 3D Graphics Tests
min: 1058 avg: 1251 median: 1228 (2%) max: 1488 Points
Smartbench 2012 - Smartbench 2012 Gaming Index
min: 2679 avg: 3414 median: 3385 (74%) max: 4274 Points
Power Consumption - Furmark Stress Test Power Consumption - external Monitor *
29.1 Watt (4%)
43.7 Watt (6%)
Power Consumption - The Witcher 3 Power Consumption - external Monitor *
25.5 Watt (4%)
30.5 Watt (4%)
Emissions Witcher 3 Fan Noise + Intel HD Graphics 620 Emissions - Witcher 3 Fan Noise
42 dB(A) (67%)
Clock Speed - GPU Clock Witcher 3 ultra
914 MHz (36%)
Clock Speed - GPU Clock Speed Furmark
1028 MHz (41%)
Average Benchmarks Intel HD Graphics 620 → 100% n=18 Average Benchmarks Intel HD Graphics (Haswell) → 43% n=18 Average Benchmarks Intel HD Graphics (Bay Trail) → 21% n=18
- Range of benchmark values for this graphics card
- Average benchmark values for this graphics card
* Smaller numbers mean a higher performance
1 This benchmark is not used for the average calculation
Game Benchmarks The following benchmarks stem from our benchmarks of review laptops. The performance depends on the used graphics memory, clock rate, processor, system settings, drivers, and operating systems. So the results don't have to be representative for all laptops with this GPU. For detailed information on the benchmark results, click on the fps number.
HD Graphics (Haswell):
0 (!) [X] MSI CX61 2QC 2970M MS-16GD Intel Celeron 2970M 2.2GHz
HD Graphics (Haswell)
fps
HD Graphics (Haswell):
4.9 (!) [X] MSI CX61 2QC 2970M MS-16GD Intel Celeron 2970M 2.2GHz
HD Graphics (Haswell)
min:
1 fps, max:
7 fps
fps
100%
HD Graphics 620:
20 [X] Fujitsu Lifebook A357-A3570MPH06DE Intel Core i5-7200U 2.5GHz
HD Graphics 620
fps
100%
HD Graphics 620:
11 [X] Fujitsu Lifebook A357-A3570MPH06DE Intel Core i5-7200U 2.5GHz
HD Graphics 620
fps
100%
HD Graphics 620:
50.3 [X] Fujitsu Lifebook A357-A3570MPH06DE Intel Core i5-7200U 2.5GHz
HD Graphics 620
fps
100%
HD Graphics 620:
25.1 [X] Fujitsu Lifebook A357-A3570MPH06DE Intel Core i5-7200U 2.5GHz
HD Graphics 620
fps
100%
HD Graphics 620:
13 [X] Fujitsu Lifebook A357-A3570MPH06DE Intel Core i5-7200U 2.5GHz
HD Graphics 620
fps
100%
HD Graphics 620:
5 [X] Fujitsu Lifebook A357-A3570MPH06DE Intel Core i5-7200U 2.5GHz
HD Graphics 620
fps
100%
HD Graphics 620:
30 [X] Fujitsu Lifebook A357-A3570MPH06DE Intel Core i5-7200U 2.5GHz
HD Graphics 620
fps
100%
HD Graphics 620:
14 [X] Fujitsu Lifebook A357-A3570MPH06DE Intel Core i5-7200U 2.5GHz
HD Graphics 620
fps
100%
HD Graphics 620:
16.7 [X] Fujitsu Lifebook A357-A3570MPH06DE Intel Core i5-7200U 2.5GHz
HD Graphics 620
fps
100%
HD Graphics 620:
6.3 [X] Fujitsu Lifebook A357-A3570MPH06DE Intel Core i5-7200U 2.5GHz
HD Graphics 620
fps
100%
HD Graphics 620:
19.6 [X] Fujitsu Lifebook A357-A3570MPH06DE Intel Core i5-7200U 2.5GHz
HD Graphics 620
fps
100%
HD Graphics 620:
8.3 [X] Fujitsu Lifebook A357-A3570MPH06DE Intel Core i5-7200U 2.5GHz
HD Graphics 620
fps
100%
HD Graphics 620:
11 [X] Fujitsu Lifebook A357-A3570MPH06DE Intel Core i5-7200U 2.5GHz
HD Graphics 620
fps
100%
HD Graphics 620:
6 [X] Fujitsu Lifebook A357-A3570MPH06DE Intel Core i5-7200U 2.5GHz
HD Graphics 620
fps
100%
HD Graphics 620:
23.9 fps
60%
HD Graphics (Haswell):
14.3 [X] MSI CX61 2QC 2970M MS-16GD Intel Celeron 2970M 2.2GHz
HD Graphics (Haswell)
fps
100%
HD Graphics 620:
15.2 fps
53%
HD Graphics (Haswell):
8 [X] MSI CX61 2QC 2970M MS-16GD Intel Celeron 2970M 2.2GHz
HD Graphics (Haswell)
fps
100%
HD Graphics 620:
11.5 fps
100%
HD Graphics 620:
5.7 fps
100%
HD Graphics 620:
8.9 fps
100%
HD Graphics 620:
39.1 41 [X] Fujitsu Lifebook A357-A3570MPH06DE Intel Core i5-7200U 2.5GHz
HD Graphics 620
~ 40 fps
100%
HD Graphics 620:
10.1 13.7 [X] Fujitsu Lifebook A357-A3570MPH06DE Intel Core i5-7200U 2.5GHz
HD Graphics 620
~ 12 fps
100%
HD Graphics 620:
23.4 fps
100%
HD Graphics 620:
6.7 fps
100%
HD Graphics 620:
14.7 fps
100%
HD Graphics 620:
8.7 fps
100%
HD Graphics 620:
27.4 [X] Fujitsu Lifebook A357-A3570MPH06DE Intel Core i5-7200U 2.5GHz
HD Graphics 620
fps
100%
HD Graphics 620:
17.6 [X] Fujitsu Lifebook A357-A3570MPH06DE Intel Core i5-7200U 2.5GHz
HD Graphics 620
fps
100%
HD Graphics 620:
8 fps
100%
HD Graphics 620:
12.6 fps
100%
HD Graphics 620:
11 fps
100%
HD Graphics 620:
5.3 fps
100%
HD Graphics 620:
9.9 fps
100%
HD Graphics 620:
5.4 fps
100%
HD Graphics 620:
16 fps
100%
HD Graphics 620:
8 fps
100%
HD Graphics 620:
29 36.5 ~ 33 fps
100%
HD Graphics 620:
28.3 fps
100%
HD Graphics 620:
25.8 fps
100%
HD Graphics 620:
14.6 [X] Fujitsu Lifebook A357-A3570MPH06DE Intel Core i5-7200U 2.5GHz
HD Graphics 620
fps
40%
HD Graphics (Haswell):
5.9 [X] MSI CX61 2QC 2970M MS-16GD Intel Celeron 2970M 2.2GHz
HD Graphics (Haswell)
min:
5 fps, max:
7 fps
fps
100%
HD Graphics 620:
4.9 [X] Fujitsu Lifebook A357-A3570MPH06DE Intel Core i5-7200U 2.5GHz
HD Graphics 620
fps
100%
HD Graphics 620:
31 fps
42%
HD Graphics (Haswell):
13 [X] MSI CX61 2QC 2970M MS-16GD Intel Celeron 2970M 2.2GHz
HD Graphics (Haswell)
min:
7 fps, max:
13 fps
fps
100%
HD Graphics 620:
13 fps
100%
HD Graphics 620:
13 fps
100%
HD Graphics 620:
26.3 [X] Fujitsu Lifebook A357-A3570MPH06DE Intel Core i5-7200U 2.5GHz
HD Graphics 620
fps
100%
HD Graphics 620:
8.5 [X] Fujitsu Lifebook A357-A3570MPH06DE Intel Core i5-7200U 2.5GHz
HD Graphics 620
fps
100%
HD Graphics 620:
76.7 fps
81%
HD Graphics (Haswell):
62 [X] MSI CX61 2QC 2970M MS-16GD Intel Celeron 2970M 2.2GHz
HD Graphics (Haswell)
min:
54 fps
fps
35%
HD Graphics (Bay Trail):
26.7 [X] Intel NUC Kit DN2820FYKH Intel Celeron N2820 2.2GHz
HD Graphics (Bay Trail)
min:
23 fps
fps
100%
HD Graphics 620:
71 fps
40%
HD Graphics (Haswell):
28.6 [X] MSI CX61 2QC 2970M MS-16GD Intel Celeron 2970M 2.2GHz
HD Graphics (Haswell)
min:
19 fps
fps
33%
HD Graphics (Bay Trail):
23.4 [X] Intel NUC Kit DN2820FYKH Intel Celeron N2820 2.2GHz
HD Graphics (Bay Trail)
min:
21 fps
fps
100%
HD Graphics 620:
40 fps
100%
HD Graphics 620:
18 fps
100%
HD Graphics 620:
44.8 fps
37%
HD Graphics (Haswell):
16.4 [X] MSI CX61 2QC 2970M MS-16GD Intel Celeron 2970M 2.2GHz
HD Graphics (Haswell)
min:
14 fps, max:
19 fps
fps
13%
HD Graphics (Bay Trail):
6 [X] Intel NUC Kit DN2820FYKH Intel Celeron N2820 2.2GHz
HD Graphics (Bay Trail)
fps
100%
HD Graphics 620:
12.4 fps
100%
HD Graphics 620:
9.9 fps
79%
HD Graphics (Haswell):
45.1 [X] MSI CX61 2QC 2970M MS-16GD Intel Celeron 2970M 2.2GHz
HD Graphics (Haswell)
min:
37 fps, max:
54 fps
fps
22%
HD Graphics (Bay Trail):
12.6 [X] Intel NUC Kit DN2820FYKH Intel Celeron N2820 2.2GHz
HD Graphics (Bay Trail)
min:
7 fps, max:
15 fps
fps
61%
HD Graphics (Haswell):
15.9 [X] MSI CX61 2QC 2970M MS-16GD Intel Celeron 2970M 2.2GHz
HD Graphics (Haswell)
min:
13 fps, max:
19 fps
fps
100%
HD Graphics 620:
27.8 fps
100%
HD Graphics 620:
11.6 fps
100%
HD Graphics 620:
9.2 fps
100%
HD Graphics 620:
24.4 fps
100%
HD Graphics 620:
15.6 fps
0%
HD Graphics (Haswell):
0 (!) [X] MSI CX61 2QC 2970M MS-16GD Intel Celeron 2970M 2.2GHz
HD Graphics (Haswell)
fps
100%
HD Graphics 620:
6.4 fps
100%
HD Graphics 620:
6.1 fps
100%
HD Graphics 620:
8.9 fps
100%
HD Graphics 620:
29.9 fps
60%
HD Graphics (Haswell):
17.8 [X] MSI CX61 2QC 2970M MS-16GD Intel Celeron 2970M 2.2GHz
HD Graphics (Haswell)
min:
15 fps, max:
21 fps
fps
100%
HD Graphics 620:
13.1 fps
100%
HD Graphics 620:
13.8 fps
100%
HD Graphics 620:
11.7 fps
100%
HD Graphics 620:
21.7 [X] Acer Aspire E5-774-54HJ Intel Core i5-7200U 2.5GHz
HD Graphics 620
fps
100%
HD Graphics 620:
19.7 [X] Acer Aspire E5-774-54HJ Intel Core i5-7200U 2.5GHz
HD Graphics 620
fps
100%
HD Graphics 620:
36.6 37.9 [X] Acer Aspire E5-774-54HJ Intel Core i5-7200U 2.5GHz
HD Graphics 620
~ 37 fps
100%
HD Graphics 620:
24.9 27.2 [X] Acer Aspire E5-774-54HJ Intel Core i5-7200U 2.5GHz
HD Graphics 620
~ 26 fps
100%
HD Graphics 620:
9.9 [X] Acer Aspire E5-774-54HJ Intel Core i5-7200U 2.5GHz
HD Graphics 620
fps
65%
HD Graphics (Haswell):
38.6 [X] MSI CX61 2QC 2970M MS-16GD Intel Celeron 2970M 2.2GHz
HD Graphics (Haswell)
min:
35 fps, max:
52 fps
fps
48%
HD Graphics (Haswell):
21.6 [X] MSI CX61 2QC 2970M MS-16GD Intel Celeron 2970M 2.2GHz
HD Graphics (Haswell)
min:
19 fps, max:
28 fps
fps
33%
HD Graphics (Haswell):
6.3 [X] MSI CX61 2QC 2970M MS-16GD Intel Celeron 2970M 2.2GHz
HD Graphics (Haswell)
min:
5 fps, max:
8 fps
fps
100%
HD Graphics 620:
9 14.3 ~ 12 fps
100%
HD Graphics 620:
11.7 30.2 [X] Acer Aspire E5-774-54HJ Intel Core i5-7200U 2.5GHz
HD Graphics 620
30.3 ~ 24 fps
59%
HD Graphics (Haswell):
14.1 [X] MSI CX61 2QC 2970M MS-16GD Intel Celeron 2970M 2.2GHz
HD Graphics (Haswell)
min:
12 fps, max:
15 fps
fps
100%
HD Graphics 620:
17.2 [X] Acer Aspire E5-774-54HJ Intel Core i5-7200U 2.5GHz
HD Graphics 620
fps
100%
HD Graphics 620:
8.2 [X] Acer Aspire E5-774-54HJ Intel Core i5-7200U 2.5GHz
HD Graphics 620
fps
100%
HD Graphics 620:
7.4 [X] Acer Aspire E5-774-54HJ Intel Core i5-7200U 2.5GHz
HD Graphics 620
fps
100%
HD Graphics 620:
5 [X] Acer Aspire E5-774-54HJ Intel Core i5-7200U 2.5GHz
HD Graphics 620
fps
100%
HD Graphics 620:
56 (!) [X] Dell XPS 13 9360 QHD+ i7 Intel Core i7-7500U 2.7GHz
HD Graphics 620
63.2 [X] Acer Aspire E5-774-54HJ Intel Core i5-7200U 2.5GHz
HD Graphics 620
~ 60 fps
100%
HD Graphics 620:
50 [X] Acer Aspire E5-774-54HJ Intel Core i5-7200U 2.5GHz
HD Graphics 620
fps
100%
HD Graphics 620:
26.4 [X] Acer Aspire E5-774-54HJ Intel Core i5-7200U 2.5GHz
HD Graphics 620
fps
100%
HD Graphics 620:
11.8 [X] Medion Akoya S3409-MD60234 Intel Core i7-7500U 2.7GHz
HD Graphics 620
14.5 [X] Acer Aspire E5-774-54HJ Intel Core i5-7200U 2.5GHz
HD Graphics 620
~ 13 fps
100%
HD Graphics 620:
8.3 [X] Medion Akoya S3409-MD60234 Intel Core i7-7500U 2.7GHz
HD Graphics 620
10.1 [X] Acer Aspire E5-774-54HJ Intel Core i5-7200U 2.5GHz
HD Graphics 620
~ 9 fps
100%
HD Graphics 620:
28.8 fps
43%
HD Graphics (Haswell):
12.4 [X] MSI CX61 2QC 2970M MS-16GD Intel Celeron 2970M 2.2GHz
HD Graphics (Haswell)
min:
11 fps, max:
14 fps
fps
100%
HD Graphics 620:
17 fps
42%
HD Graphics (Haswell):
7.1 [X] MSI CX61 2QC 2970M MS-16GD Intel Celeron 2970M 2.2GHz
HD Graphics (Haswell)
min:
6 fps, max:
8 fps
fps
100%
HD Graphics 620:
7.1 fps
57%
HD Graphics (Haswell):
26.1 [X] MSI CX61 2QC 2970M MS-16GD Intel Celeron 2970M 2.2GHz
HD Graphics (Haswell)
min:
19 fps, max:
33 fps
fps
49%
HD Graphics (Haswell):
16.3 [X] MSI CX61 2QC 2970M MS-16GD Intel Celeron 2970M 2.2GHz
HD Graphics (Haswell)
min:
12 fps, max:
21 fps
fps
100%
HD Graphics 620:
21.8 [X] Medion Akoya S3409-MD60234 Intel Core i7-7500U 2.7GHz
HD Graphics 620
22.6 ~ 22 fps
0%
HD Graphics (Haswell):
0 (!) [X] MSI CX61 2QC 2970M MS-16GD Intel Celeron 2970M 2.2GHz
HD Graphics (Haswell)
fps
100%
HD Graphics 620:
16.6 [X] Medion Akoya S3409-MD60234 Intel Core i7-7500U 2.7GHz
HD Graphics 620
fps
100%
HD Graphics 620:
9.7 [X] Medion Akoya S3409-MD60234 Intel Core i7-7500U 2.7GHz
HD Graphics 620
fps
100%
HD Graphics 620:
8.9 11.3 [X] Acer Aspire E5-774-54HJ Intel Core i5-7200U 2.5GHz
HD Graphics 620
~ 10 fps
100%
HD Graphics 620:
6.1 [X] Acer Aspire E5-774-54HJ Intel Core i5-7200U 2.5GHz
HD Graphics 620
7 ~ 7 fps
100%
HD Graphics 620:
6 fps
100%
HD Graphics 620:
14.5 fps
41%
HD Graphics (Haswell):
6 [X] MSI CX61 2QC 2970M MS-16GD Intel Celeron 2970M 2.2GHz
HD Graphics (Haswell)
min:
3 fps, max:
9 fps
fps
100%
HD Graphics 620:
19.7 fps
100%
HD Graphics 620:
11.7 fps
100%
HD Graphics 620:
20.2 [X] Medion Akoya S3409-MD60234 Intel Core i7-7500U 2.7GHz
HD Graphics 620
fps
42%
HD Graphics (Haswell):
8.5 [X] MSI CX61 2QC 2970M MS-16GD Intel Celeron 2970M 2.2GHz
HD Graphics (Haswell)
min:
6 fps, max:
11 fps
fps
100%
HD Graphics 620:
10.7 [X] Medion Akoya S3409-MD60234 Intel Core i7-7500U 2.7GHz
HD Graphics 620
fps
100%
HD Graphics 620:
16 20 ~ 18 fps
50%
HD Graphics (Haswell):
9 [X] MSI CX61 2QC 2970M MS-16GD Intel Celeron 2970M 2.2GHz
HD Graphics (Haswell)
min:
8 fps, max:
11 fps
fps
100%
HD Graphics 620:
8 10 ~ 9 fps
100%
HD Graphics 620:
8 fps
100%
HD Graphics 620:
19.8 fps
100%
HD Graphics 620:
7.6 fps
100%
HD Graphics 620:
5.2 fps
52%
HD Graphics (Haswell):
9.4 [X] MSI CX61 2QC 2970M MS-16GD Intel Celeron 2970M 2.2GHz
HD Graphics (Haswell)
min:
8 fps, max:
11 fps
fps
48%
HD Graphics (Haswell):
5.3 [X] MSI CX61 2QC 2970M MS-16GD Intel Celeron 2970M 2.2GHz
HD Graphics (Haswell)
fps
42%
HD Graphics (Haswell):
2.5 [X] MSI CX61 2QC 2970M MS-16GD Intel Celeron 2970M 2.2GHz
HD Graphics (Haswell)
fps
45%
HD Graphics (Haswell):
1.8 [X] MSI CX61 2QC 2970M MS-16GD Intel Celeron 2970M 2.2GHz
HD Graphics (Haswell)
fps
35%
HD Graphics (Haswell):
13.7 [X] MSI CX61 2QC 2970M MS-16GD Intel Celeron 2970M 2.2GHz
HD Graphics (Haswell)
min:
5 fps, max:
75 fps
fps
37%
HD Graphics (Haswell):
8.9 [X] MSI CX61 2QC 2970M MS-16GD Intel Celeron 2970M 2.2GHz
HD Graphics (Haswell)
min:
4 fps, max:
65 fps
fps
100%
HD Graphics 620:
11.5 fps
100%
HD Graphics 620:
29 fps
40%
HD Graphics (Haswell):
11.7 [X] MSI CX61 2QC 2970M MS-16GD Intel Celeron 2970M 2.2GHz
HD Graphics (Haswell)
min:
10 fps, max:
14 fps
fps
100%
HD Graphics 620:
22.2 fps
100%
HD Graphics 620:
10.8 fps
100%
HD Graphics 620:
40.3 fps
0%
HD Graphics (Haswell):
0 (!) [X] MSI CX61 2QC 2970M MS-16GD Intel Celeron 2970M 2.2GHz
HD Graphics (Haswell)
fps
100%
HD Graphics 620:
22.7 fps
100%
HD Graphics 620:
10.2 fps
100%
HD Graphics 620:
5.4 fps
100%
HD Graphics 620:
19.2 [X] Acer Aspire E5-774-54HJ Intel Core i5-7200U 2.5GHz
HD Graphics 620
fps
100%
HD Graphics 620:
12.3 [X] Acer Aspire E5-774-54HJ Intel Core i5-7200U 2.5GHz
HD Graphics 620
fps
100%
HD Graphics 620:
32 [X] Acer Aspire E5-774-54HJ Intel Core i5-7200U 2.5GHz
HD Graphics 620
fps
0%
HD Graphics (Bay Trail):
0 (!) [X] Intel NUC Kit DN2820FYKH Intel Celeron N2820 2.2GHz
HD Graphics (Bay Trail)
fps
100%
HD Graphics 620:
17.9 [X] Acer Aspire E5-774-54HJ Intel Core i5-7200U 2.5GHz
HD Graphics 620
fps
100%
HD Graphics 620:
9.1 [X] Acer Aspire E5-774-54HJ Intel Core i5-7200U 2.5GHz
HD Graphics 620
fps
100%
HD Graphics 620:
23.5 [X] Medion Akoya S3409-MD60234 Intel Core i7-7500U 2.7GHz
HD Graphics 620
fps
100%
HD Graphics 620:
16.2 [X] Medion Akoya S3409-MD60234 Intel Core i7-7500U 2.7GHz
HD Graphics 620
fps
100%
HD Graphics 620:
6.8 [X] Medion Akoya S3409-MD60234 Intel Core i7-7500U 2.7GHz
HD Graphics 620
fps
100%
HD Graphics 620:
78.4 fps
100%
HD Graphics 620:
50.9 fps
100%
HD Graphics 620:
29.3 fps
58%
HD Graphics (Haswell):
41.4 [X] MSI CX61 2QC 2970M MS-16GD Intel Celeron 2970M 2.2GHz
HD Graphics (Haswell)
min:
21 fps, max:
51 fps
fps
17%
HD Graphics (Bay Trail):
12.1 [X] Intel NUC Kit DN2820FYKH Intel Celeron N2820 2.2GHz
HD Graphics (Bay Trail)
min:
5 fps, max:
18 fps
fps
51%
HD Graphics (Haswell):
24.1 [X] MSI CX61 2QC 2970M MS-16GD Intel Celeron 2970M 2.2GHz
HD Graphics (Haswell)
min:
11 fps, max:
35 fps
fps
50%
HD Graphics (Haswell):
11.4 [X] MSI CX61 2QC 2970M MS-16GD Intel Celeron 2970M 2.2GHz
HD Graphics (Haswell)
min:
5 fps, max:
18 fps
fps
100%
HD Graphics 620:
19.1 fps
100%
HD Graphics 620:
43.6 [X] Medion Akoya S3409-MD60234 Intel Core i7-7500U 2.7GHz
HD Graphics 620
fps
25%
HD Graphics (Bay Trail):
10.8 [X] Intel NUC Kit DN2820FYKH Intel Celeron N2820 2.2GHz
HD Graphics (Bay Trail)
min:
10 fps, max:
12 fps
fps
100%
HD Graphics 620:
29.7 [X] Medion Akoya S3409-MD60234 Intel Core i7-7500U 2.7GHz
HD Graphics 620
fps
100%
HD Graphics 620:
10.9 [X] Medion Akoya S3409-MD60234 Intel Core i7-7500U 2.7GHz
HD Graphics 620
fps
100%
HD Graphics 620:
23.7 [X] Acer Aspire E5-774-54HJ Intel Core i5-7200U 2.5GHz
HD Graphics 620
fps
100%
HD Graphics 620:
10.2 [X] Acer Aspire E5-774-54HJ Intel Core i5-7200U 2.5GHz
HD Graphics 620
fps
100%
HD Graphics 620:
59.6 82 ~ 71 fps
35%
HD Graphics (Bay Trail):
24.7 [X] Intel NUC Kit DN2820FYKH Intel Celeron N2820 2.2GHz
HD Graphics (Bay Trail)
min:
22.2 fps
fps
100%
HD Graphics 620:
50.7 56 ~ 53 fps
18%
HD Graphics (Bay Trail):
9.7 [X] Intel NUC Kit DN2820FYKH Intel Celeron N2820 2.2GHz
HD Graphics (Bay Trail)
min:
8.8 fps
fps
100%
HD Graphics 620:
20 27 ~ 24 fps
23%
HD Graphics (Bay Trail):
5.5 [X] Intel NUC Kit DN2820FYKH Intel Celeron N2820 2.2GHz
HD Graphics (Bay Trail)
min:
-1.4 fps
fps
100%
HD Graphics 620:
24.2 fps
22%
HD Graphics (Bay Trail):
5.4 [X] Intel NUC Kit DN2820FYKH Intel Celeron N2820 2.2GHz
HD Graphics (Bay Trail)
min:
-3 fps
fps
64%
HD Graphics (Haswell):
8.9 [X] MSI CX61 2QC 2970M MS-16GD Intel Celeron 2970M 2.2GHz
HD Graphics (Haswell)
min:
5 fps, max:
12 fps
fps
55%
HD Graphics (Haswell):
5.2 [X] MSI CX61 2QC 2970M MS-16GD Intel Celeron 2970M 2.2GHz
HD Graphics (Haswell)
min:
3 fps, max:
8 fps
5.8 ~ 6 fps
62%
HD Graphics (Haswell):
3.1 fps
100%
HD Graphics 620:
119 139.9 ~ 129 fps
41%
HD Graphics (Haswell):
52.4 fps
18%
HD Graphics (Bay Trail):
22 [X] Intel NUC Kit DN2820FYKH Intel Celeron N2820 2.2GHz
HD Graphics (Bay Trail)
min:
16 fps, max:
33 fps
24.2 ~ 23 fps
37%
HD Graphics (Haswell):
12.8 fps
17%
HD Graphics (Bay Trail):
0 (!) [X] Intel NUC Kit DN2820FYKH Intel Celeron N2820 2.2GHz
HD Graphics (Bay Trail)
12.5 ~ 6 fps
100%
HD Graphics 620:
15 15.5 ~ 15 fps
100%
HD Graphics 620:
12.5 fps
100%
HD Graphics 620:
27.8 [X] Medion Akoya S3409-MD60234 Intel Core i7-7500U 2.7GHz
HD Graphics 620
fps
100%
HD Graphics 620:
22.8 [X] Medion Akoya S3409-MD60234 Intel Core i7-7500U 2.7GHz
HD Graphics 620
fps
100%
HD Graphics 620:
6.3 [X] Medion Akoya S3409-MD60234 Intel Core i7-7500U 2.7GHz
HD Graphics 620
fps
100%
HD Graphics 620:
43.4 [X] Medion Akoya S3409-MD60234 Intel Core i7-7500U 2.7GHz
HD Graphics 620
fps
37%
HD Graphics (Haswell):
15.9 fps
17%
HD Graphics (Bay Trail):
7.3 fps
100%
HD Graphics 620:
31.1 [X] Medion Akoya S3409-MD60234 Intel Core i7-7500U 2.7GHz
HD Graphics 620
fps
36%
HD Graphics (Haswell):
11.2 fps
16%
HD Graphics (Bay Trail):
5.1 fps
100%
HD Graphics 620:
11.6 [X] Medion Akoya S3409-MD60234 Intel Core i7-7500U 2.7GHz
HD Graphics 620
fps
HD Graphics (Haswell):
7.7 fps
HD Graphics (Bay Trail):
3.2 fps
HD Graphics (Haswell):
5.7 fps
HD Graphics (Bay Trail):
1.7 fps
HD Graphics (Haswell):
9.7 fps
HD Graphics (Bay Trail):
8.1 fps
HD Graphics (Haswell):
8.4 fps
HD Graphics (Bay Trail):
4.7 fps
100%
HD Graphics 620:
26.5 [X] Medion Akoya S3409-MD60234 Intel Core i7-7500U 2.7GHz
HD Graphics 620
fps
41%
HD Graphics (Haswell):
10.9 fps
26%
HD Graphics (Bay Trail):
7 fps
100%
HD Graphics 620:
18.3 [X] Medion Akoya S3409-MD60234 Intel Core i7-7500U 2.7GHz
HD Graphics 620
fps
38%
HD Graphics (Haswell):
7 fps
25%
HD Graphics (Bay Trail):
4.6 fps
100%
HD Graphics 620:
6.5 [X] Medion Akoya S3409-MD60234 Intel Core i7-7500U 2.7GHz
HD Graphics 620
fps
HD Graphics (Bay Trail):
5.6 fps
HD Graphics (Bay Trail):
3.8 fps
HD Graphics (Bay Trail):
4.3 fps
HD Graphics (Bay Trail):
2.4 fps
HD Graphics (Bay Trail):
9.6 11.5 ~ 11 fps
HD Graphics (Bay Trail):
4.3 fps
100%
HD Graphics 620:
60 [X] Medion Akoya S3409-MD60234 Intel Core i7-7500U 2.7GHz
HD Graphics 620
fps
52%
HD Graphics (Haswell):
31 fps
22%
HD Graphics (Bay Trail):
12 14 ~ 13 fps
100%
HD Graphics 620:
39 [X] Medion Akoya S3409-MD60234 Intel Core i7-7500U 2.7GHz
HD Graphics 620
fps
51%
HD Graphics (Haswell):
20 fps
31%
HD Graphics (Bay Trail):
12 fps
100%
HD Graphics 620:
31 [X] Medion Akoya S3409-MD60234 Intel Core i7-7500U 2.7GHz
HD Graphics 620
fps
100%
HD Graphics 620:
16 [X] Medion Akoya S3409-MD60234 Intel Core i7-7500U 2.7GHz
HD Graphics 620
fps
HD Graphics (Bay Trail):
5.2 fps
HD Graphics (Bay Trail):
3.6 fps
HD Graphics (Haswell):
9 fps
HD Graphics (Bay Trail):
3.7 fps
HD Graphics (Haswell):
5.8 fps
HD Graphics (Bay Trail):
2.5 fps
HD Graphics (Haswell):
21.6 fps
HD Graphics (Bay Trail):
9.1 fps
HD Graphics (Haswell):
12.9 fps
HD Graphics (Bay Trail):
5.1 fps
HD Graphics (Haswell):
13.5 fps
HD Graphics (Bay Trail):
8.5 fps
HD Graphics (Haswell):
8.3 fps
HD Graphics (Bay Trail):
6.1 fps
HD Graphics (Haswell):
16.4 fps
HD Graphics (Bay Trail):
12.4 fps
HD Graphics (Haswell):
11.3 fps
HD Graphics (Bay Trail):
8.5 fps
100%
HD Graphics 620:
182 186.8 ~ 184 fps
67%
HD Graphics (Haswell):
123.6 fps
30%
HD Graphics (Bay Trail):
53.7 56 ~ 55 fps
100%
HD Graphics 620:
56.4 63 ~ 60 fps
44%
HD Graphics (Haswell):
26.2 fps
12%
HD Graphics (Bay Trail):
6.6 7 ~ 7 fps
HD Graphics (Haswell):
13.3 fps
HD Graphics (Bay Trail):
8.4 fps
HD Graphics (Haswell):
9.7 fps
HD Graphics (Bay Trail):
5.9 fps
HD Graphics (Haswell):
58.2 fps
HD Graphics (Bay Trail):
31.6 41.8 ~ 37 fps
100%
HD Graphics 620:
37.8 [X] Fujitsu LifeBook A557 PL Intel Core i5-7200U 2.5GHz
HD Graphics 620
43.8 [X] Dell XPS 13 9360-4764 Intel Core i7-7500U 2.7GHz
HD Graphics 620
43.9 [X] HP ProBook 440 G4 Z2Y47ES Intel Core i3-7100U 2.4GHz
HD Graphics 620
50.9 [X] HP ProBook 650 G3 Z2N47EA Intel Core i5-7200U 2.5GHz
HD Graphics 620
~ 44 fps
45%
HD Graphics (Haswell):
19.6 fps
30%
HD Graphics (Bay Trail):
12.5 12.5 ~ 13 fps
100%
HD Graphics 620:
19.2 [X] Fujitsu LifeBook A557 PL Intel Core i5-7200U 2.5GHz
HD Graphics 620
22.7 [X] HP ProBook 440 G4 Z2Y47ES Intel Core i3-7100U 2.4GHz
HD Graphics 620
23.7 [X] Dell XPS 13 9360-4764 Intel Core i7-7500U 2.7GHz
HD Graphics 620
25.9 [X] HP ProBook 650 G3 Z2N47EA Intel Core i5-7200U 2.5GHz
HD Graphics 620
~ 23 fps
HD Graphics (Haswell):
2.2 fps
HD Graphics (Bay Trail):
8.3 fps
HD Graphics (Bay Trail):
4.6 fps
HD Graphics (Haswell):
19.9 fps
HD Graphics (Bay Trail):
11.1 fps
HD Graphics (Haswell):
14 fps
HD Graphics (Bay Trail):
9.6 fps
HD Graphics (Haswell):
35.2 fps
HD Graphics (Bay Trail):
25.2 fps
HD Graphics (Haswell):
13.6 fps
HD Graphics (Bay Trail):
9.2 fps
HD Graphics (Haswell):
9 fps
HD Graphics (Haswell):
23.1 fps
HD Graphics (Haswell):
13.7 fps
100%
HD Graphics 620:
10.6 14 16.6 17 [X] Lenovo ThinkPad Yoga 370 PL Intel Core i7-7600U 2.8GHz
HD Graphics 620
19 20.8 [X] Lenovo ThinkPad 13 20J1005TPB Intel Core i7-7500U 2.7GHz
HD Graphics 620
21.3 21.7 23 24.1 [X] Lenovo ThinkPad X1 Carbon 5 20HQ001XPB Intel Core i5-7300U 2.6GHz
HD Graphics 620
25.8 [X] Lenovo ThinkPad T470s PL Intel Core i5-7200U 2.5GHz
HD Graphics 620
28 [X] Lenovo ThinkPad T570 PL Intel Core i7-7500U 2.7GHz
HD Graphics 620
~ 20 fps
51%
HD Graphics (Haswell):
10.1 fps
20%
HD Graphics (Bay Trail):
3.1 [X] Medion Akoya S6213T MD98716 Intel Pentium N3530 2.2GHz
HD Graphics (Bay Trail)
5.1 ~ 4 fps
100%
HD Graphics 620:
6.1 8.4 9.9 11.6 [X] Lenovo ThinkPad Yoga 370 PL Intel Core i7-7600U 2.8GHz
HD Graphics 620
12.1 [X] Lenovo ThinkPad 13 20J1005TPB Intel Core i7-7500U 2.7GHz
HD Graphics 620
12.3 13.8 14.1 15.6 [X] Lenovo ThinkPad T470s PL Intel Core i5-7200U 2.5GHz
HD Graphics 620
16.1 [X] Lenovo ThinkPad T570 PL Intel Core i7-7500U 2.7GHz
HD Graphics 620
16.3 [X] Lenovo ThinkPad X1 Carbon 5 20HQ001XPB Intel Core i5-7300U 2.6GHz
HD Graphics 620
~ 12 fps
48%
HD Graphics (Haswell):
5.7 fps
28%
HD Graphics (Bay Trail):
3.3 fps
100%
HD Graphics 620:
8.3 8.5 [X] Lenovo ThinkPad Yoga 370 PL Intel Core i7-7600U 2.8GHz
HD Graphics 620
10.2 10.6 [X] Lenovo ThinkPad 13 20J1005TPB Intel Core i7-7500U 2.7GHz
HD Graphics 620
11.4 11.7 12.4 [X] Lenovo ThinkPad T470s PL Intel Core i5-7200U 2.5GHz
HD Graphics 620
13 [X] Lenovo ThinkPad T570 PL Intel Core i7-7500U 2.7GHz
HD Graphics 620
13.4 [X] Lenovo ThinkPad X1 Carbon 5 20HQ001XPB Intel Core i5-7300U 2.6GHz
HD Graphics 620
~ 11 fps
100%
HD Graphics 620:
3.8 4.6 [X] Lenovo ThinkPad Yoga 370 PL Intel Core i7-7600U 2.8GHz
HD Graphics 620
4.9 5 [X] Lenovo ThinkPad 13 20J1005TPB Intel Core i7-7500U 2.7GHz
HD Graphics 620
5.7 6.4 [X] Lenovo ThinkPad T570 PL Intel Core i7-7500U 2.7GHz
HD Graphics 620
6.6 [X] Lenovo ThinkPad X1 Carbon 5 20HQ001XPB Intel Core i5-7300U 2.6GHz
HD Graphics 620
~ 5 fps
HD Graphics (Bay Trail):
8.7 fps
HD Graphics (Bay Trail):
5.8 fps
HD Graphics (Haswell):
22.1 fps
HD Graphics (Bay Trail):
12.8 fps
HD Graphics (Haswell):
13 fps
HD Graphics (Bay Trail):
6 fps
HD Graphics (Haswell):
11.1 fps
54%
HD Graphics (Haswell):
12.8 27.8 [X] MSI CX61 2QC 2970M MS-16GD Intel Celeron 2970M 2.2GHz
HD Graphics (Haswell)
~ 20 fps
20%
HD Graphics (Bay Trail):
7.3 fps
52%
HD Graphics (Haswell):
10 18.2 [X] MSI CX61 2QC 2970M MS-16GD Intel Celeron 2970M 2.2GHz
HD Graphics (Haswell)
~ 14 fps
66%
HD Graphics (Haswell):
11.8 [X] MSI CX61 2QC 2970M MS-16GD Intel Celeron 2970M 2.2GHz
HD Graphics (Haswell)
fps
65%
HD Graphics (Haswell):
3.9 [X] MSI CX61 2QC 2970M MS-16GD Intel Celeron 2970M 2.2GHz
HD Graphics (Haswell)
fps
HD Graphics (Haswell):
21 fps
HD Graphics (Bay Trail):
14 fps
HD Graphics (Haswell):
12 fps
HD Graphics (Bay Trail):
8 fps
HD Graphics (Haswell):
27 fps
HD Graphics (Bay Trail):
12 fps
HD Graphics (Haswell):
18 fps
HD Graphics (Haswell):
14 fps
HD Graphics (Bay Trail):
12.6 18.7 19.9 29.8 33.6 60 [X] Medion Akoya P2211T MD98602 Intel Celeron N2910 1.6GHz
HD Graphics (Bay Trail)
~ 29 fps
HD Graphics (Haswell):
57.7 fps
HD Graphics (Bay Trail):
10.5 19.5 33 [X] Medion Akoya P2211T MD98602 Intel Celeron N2910 1.6GHz
HD Graphics (Bay Trail)
~ 21 fps
HD Graphics (Haswell):
37 fps
HD Graphics (Bay Trail):
7.8 12.8 22 [X] Medion Akoya P2211T MD98602 Intel Celeron N2910 1.6GHz
HD Graphics (Bay Trail)
~ 14 fps
100%
HD Graphics 620:
41.9 [X] Lenovo ThinkPad Yoga 370 PL Intel Core i7-7600U 2.8GHz
HD Graphics 620
43.7 [X] Lenovo ThinkPad L470 PL Intel Core i5-7200U 2.5GHz
HD Graphics 620
43.9 [X] HP ProBook 450 G4 Z2Y44ES Intel Core i5-7200U 2.5GHz
HD Graphics 620
44.3 [X] HP EliteBook 850 G4 Z8W50EA Intel Core i5-7200U 2.5GHz
HD Graphics 620
44.8 [X] Lenovo ThinkPad E470 20H1004SPB Intel Core i5-7200U 2.5GHz
HD Graphics 620
45.1 [X] Lenovo ThinkPad X270 20HN0012PB Intel Core i7-7500U 2.7GHz
HD Graphics 620
45.4 [X] Lenovo ThinkPad 13 20J1005TPB Intel Core i7-7500U 2.7GHz
HD Graphics 620
55 [X] Dell Inspiron 13 5378-0K46 Intel Core i5-7200U 2.5GHz
HD Graphics 620
57.4 [X] Lenovo ThinkPad T470s PL Intel Core i5-7200U 2.5GHz
HD Graphics 620
60 [X] Lenovo ThinkPad X1 Carbon 5 20HQ001XPB Intel Core i5-7300U 2.6GHz
HD Graphics 620
60.2 [X] Dell Latitude 5280 N014L528012QG45 Intel Core i5-7200U 2.5GHz
HD Graphics 620
60.3 [X] Lenovo ThinkPad L570 20J80020PB Intel Core i5-7200U 2.5GHz
HD Graphics 620
60.5 [X] Dell Inspiron 15 5578-4G33 Intel Core i5-7200U 2.5GHz
HD Graphics 620
64.1 [X] HP EliteBook 840 G4 Z8N44EA Intel Core i5-7200U 2.5GHz
HD Graphics 620
64.6 [X] HP ProBook 640 G3 Z8K61EA Intel Core i5-7200U 2.5GHz
HD Graphics 620
65.5 [X] Lenovo ThinkPad T570 PL Intel Core i7-7500U 2.7GHz
HD Graphics 620
~ 54 fps
41%
HD Graphics (Haswell):
22.4 fps
14%
HD Graphics (Bay Trail):
7.7 fps
100%
HD Graphics 620:
30.6 [X] Lenovo ThinkPad X270 20HN0012PB Intel Core i7-7500U 2.7GHz
HD Graphics 620
31.8 [X] HP ProBook 450 G4 Z2Y44ES Intel Core i5-7200U 2.5GHz
HD Graphics 620
32 [X] HP EliteBook 850 G4 Z8W50EA Intel Core i5-7200U 2.5GHz
HD Graphics 620
32.4 [X] Lenovo ThinkPad E470 20H1004SPB Intel Core i5-7200U 2.5GHz
HD Graphics 620
32.8 [X] Lenovo ThinkPad 13 20J1005TPB Intel Core i7-7500U 2.7GHz
HD Graphics 620
35.3 [X] Lenovo ThinkPad Yoga 370 PL Intel Core i7-7600U 2.8GHz
HD Graphics 620
35.9 [X] Dell Inspiron 13 5378-0K46 Intel Core i5-7200U 2.5GHz
HD Graphics 620
39.3 [X] Lenovo ThinkPad L470 PL Intel Core i5-7200U 2.5GHz
HD Graphics 620
40.5 [X] Lenovo ThinkPad T470s PL Intel Core i5-7200U 2.5GHz
HD Graphics 620
42.8 [X] Lenovo ThinkPad X1 Carbon 5 20HQ001XPB Intel Core i5-7300U 2.6GHz
HD Graphics 620
43.5 [X] Lenovo ThinkPad L570 20J80020PB Intel Core i5-7200U 2.5GHz
HD Graphics 620
43.9 [X] Dell Latitude 5280 N014L528012QG45 Intel Core i5-7200U 2.5GHz
HD Graphics 620
45.3 [X] Dell Inspiron 15 5578-4G33 Intel Core i5-7200U 2.5GHz
HD Graphics 620
45.7 [X] HP EliteBook 840 G4 Z8N44EA Intel Core i5-7200U 2.5GHz
HD Graphics 620
46.4 [X] HP ProBook 640 G3 Z8K61EA Intel Core i5-7200U 2.5GHz
HD Graphics 620
46.8 [X] Lenovo ThinkPad T570 PL Intel Core i7-7500U 2.7GHz
HD Graphics 620
~ 39 fps
43%
HD Graphics (Haswell):
16.9 fps
100%
HD Graphics 620:
25.3 [X] Lenovo ThinkPad L470 PL Intel Core i5-7200U 2.5GHz
HD Graphics 620
26.4 [X] HP ProBook 450 G4 Z2Y44ES Intel Core i5-7200U 2.5GHz
HD Graphics 620
26.6 [X] Lenovo ThinkPad E470 20H1004SPB Intel Core i5-7200U 2.5GHz
HD Graphics 620
26.6 [X] HP EliteBook 850 G4 Z8W50EA Intel Core i5-7200U 2.5GHz
HD Graphics 620
27.3 [X] Lenovo ThinkPad X270 20HN0012PB Intel Core i7-7500U 2.7GHz
HD Graphics 620
27.3 [X] Lenovo ThinkPad 13 20J1005TPB Intel Core i7-7500U 2.7GHz
HD Graphics 620
27.9 [X] Lenovo ThinkPad Yoga 370 PL Intel Core i7-7600U 2.8GHz
HD Graphics 620
28.8 [X] Dell Inspiron 13 5378-0K46 Intel Core i5-7200U 2.5GHz
HD Graphics 620
32.3 [X] Dell Inspiron 15 5578-4G33 Intel Core i5-7200U 2.5GHz
HD Graphics 620
32.8 [X] Lenovo ThinkPad T470s PL Intel Core i5-7200U 2.5GHz
HD Graphics 620
33.5 [X] Lenovo ThinkPad L570 20J80020PB Intel Core i5-7200U 2.5GHz
HD Graphics 620
34 [X] Lenovo ThinkPad X1 Carbon 5 20HQ001XPB Intel Core i5-7300U 2.6GHz
HD Graphics 620
34.3 [X] Dell Latitude 5280 N014L528012QG45 Intel Core i5-7200U 2.5GHz
HD Graphics 620
35.8 [X] HP EliteBook 840 G4 Z8N44EA Intel Core i5-7200U 2.5GHz
HD Graphics 620
36.2 [X] HP ProBook 640 G3 Z8K61EA Intel Core i5-7200U 2.5GHz
HD Graphics 620
37 [X] Lenovo ThinkPad T570 PL Intel Core i7-7500U 2.7GHz
HD Graphics 620
~ 31 fps
100%
HD Graphics 620:
4.3 [X] Lenovo ThinkPad L470 PL Intel Core i5-7200U 2.5GHz
HD Graphics 620
4.4 [X] Lenovo ThinkPad E470 20H1004SPB Intel Core i5-7200U 2.5GHz
HD Graphics 620
4.4 [X] HP ProBook 450 G4 Z2Y44ES Intel Core i5-7200U 2.5GHz
HD Graphics 620
4.4 [X] HP EliteBook 850 G4 Z8W50EA Intel Core i5-7200U 2.5GHz
HD Graphics 620
4.6 [X] Lenovo ThinkPad 13 20J1005TPB Intel Core i7-7500U 2.7GHz
HD Graphics 620
4.7 [X] Lenovo ThinkPad Yoga 370 PL Intel Core i7-7600U 2.8GHz
HD Graphics 620
4.8 [X] Lenovo ThinkPad X270 20HN0012PB Intel Core i7-7500U 2.7GHz
HD Graphics 620
4.8 [X] Dell Inspiron 13 5378-0K46 Intel Core i5-7200U 2.5GHz
HD Graphics 620
4.8 [X] Lenovo ThinkPad T470s PL Intel Core i5-7200U 2.5GHz
HD Graphics 620
4.9 [X] Dell Inspiron 15 5578-4G33 Intel Core i5-7200U 2.5GHz
HD Graphics 620
5 [X] HP ProBook 640 G3 Z8K61EA Intel Core i5-7200U 2.5GHz
HD Graphics 620
5 [X] HP EliteBook 840 G4 Z8N44EA Intel Core i5-7200U 2.5GHz
HD Graphics 620
5.1 [X] Lenovo ThinkPad L570 20J80020PB Intel Core i5-7200U 2.5GHz
HD Graphics 620
5.2 [X] Lenovo ThinkPad X1 Carbon 5 20HQ001XPB Intel Core i5-7300U 2.6GHz
HD Graphics 620
5.3 [X] Lenovo ThinkPad T570 PL Intel Core i7-7500U 2.7GHz
HD Graphics 620
~ 5 fps
HD Graphics (Haswell):
14 fps
HD Graphics (Bay Trail):
6.3 fps
HD Graphics (Haswell):
7.8 fps
HD Graphics (Haswell):
15.9 fps
HD Graphics (Bay Trail):
10.2 fps
HD Graphics (Haswell):
8.9 fps
HD Graphics (Bay Trail):
6.1 fps
HD Graphics (Haswell):
14.2 fps
HD Graphics (Bay Trail):
11 fps
HD Graphics (Haswell):
11.5 fps
HD Graphics (Bay Trail):
7.8 fps
100%
HD Graphics 620:
56.2 [X] Dell Latitude 13 3580 Intel Core i5-7200U 2.5GHz
HD Graphics 620
fps
66%
HD Graphics (Haswell):
36.9 fps
44%
HD Graphics (Bay Trail):
18.2 [X] Medion Akoya P2211T MD98602 Intel Celeron N2910 1.6GHz
HD Graphics (Bay Trail)
20.8 28.4 31.9 [X] Asus Transformer Book T200TA PL Intel Atom Z3775 1.5GHz
HD Graphics (Bay Trail)
~ 25 fps
100%
HD Graphics 620:
31.5 [X] Dell Latitude 13 3580 Intel Core i5-7200U 2.5GHz
HD Graphics 620
fps
77%
HD Graphics (Haswell):
24.2 fps
41%
HD Graphics (Bay Trail):
9.5 [X] Medion Akoya P2211T MD98602 Intel Celeron N2910 1.6GHz
HD Graphics (Bay Trail)
10.4 13.7 19.4 [X] Asus Transformer Book T200TA PL Intel Atom Z3775 1.5GHz
HD Graphics (Bay Trail)
~ 13 fps
34%
HD Graphics (Haswell):
7.2 fps
21%
HD Graphics (Bay Trail):
4.4 [X] Medion Akoya E6239T Intel Pentium N3510 2GHz
HD Graphics (Bay Trail)
fps
100%
HD Graphics 620:
16 18.7 ~ 17 fps
100%
HD Graphics 620:
79.7 fps
48%
HD Graphics (Haswell):
38 38.5 ~ 38 fps
23%
HD Graphics (Bay Trail):
14.1 16.2 17.9 20.4 [X] Medion Akoya E6239T Intel Pentium N3510 2GHz
HD Graphics (Bay Trail)
23.2 ~ 18 fps
100%
HD Graphics 620:
46.4 fps
41%
HD Graphics (Haswell):
18.6 19.6 ~ 19 fps
28%
HD Graphics (Bay Trail):
12.5 12.6 [X] Medion Akoya E6239T Intel Pentium N3510 2GHz
HD Graphics (Bay Trail)
~ 13 fps
100%
HD Graphics 620:
33.7 fps
39%
HD Graphics (Haswell):
13.2 fps
100%
HD Graphics 620:
12.5 fps
35%
HD Graphics (Haswell):
11.2 fps
16%
HD Graphics (Bay Trail):
5 fps
100%
HD Graphics 620:
15 17.5 ~ 16 fps
100%
HD Graphics 620:
7.2 8.2 ~ 8 fps
60%
HD Graphics (Haswell):
23 32.8 [X] MSI CX61 2QC 2970M MS-16GD Intel Celeron 2970M 2.2GHz
HD Graphics (Haswell)
~ 28 fps
44%
HD Graphics (Haswell):
10.3 14.2 [X] MSI CX61 2QC 2970M MS-16GD Intel Celeron 2970M 2.2GHz
HD Graphics (Haswell)
~ 12 fps
52%
HD Graphics (Haswell):
11.9 [X] MSI CX61 2QC 2970M MS-16GD Intel Celeron 2970M 2.2GHz
HD Graphics (Haswell)
fps
100%
HD Graphics 620:
3.3 [X] Tuxedo InfinityBook Pro 13 N130BU Intel Core i7-7500U 2.7GHz
HD Graphics 620
5.4 5.5 5.8 6 6 6 [X] Lenovo ThinkPad L470 PL Intel Core i5-7200U 2.5GHz
HD Graphics 620
6.1 [X] Fujitsu LifeBook U727 Intel Core i5-7200U 2.5GHz
HD Graphics 620
6.2 [X] HP EliteBook 850 G4 Z8W50EA Intel Core i5-7200U 2.5GHz
HD Graphics 620
6.3 6.3 [X] HP ProBook 450 G4 Z2Y44ES Intel Core i5-7200U 2.5GHz
HD Graphics 620
6.3 6.4 6.4 6.4 6.5 6.5 6.5 6.5 [X] Lenovo ThinkPad E470 20H1004SPB Intel Core i5-7200U 2.5GHz
HD Graphics 620
6.5 6.5 6.5 6.6 6.7 6.8 [X] Lenovo ThinkPad X270 20HN0012PB Intel Core i7-7500U 2.7GHz
HD Graphics 620
6.9 6.9 6.9 6.9 6.9 [X] Lenovo ThinkPad 13 20J1005TPB Intel Core i7-7500U 2.7GHz
HD Graphics 620
7 7 7 7 7.1 7.1 7.1 7.1 7.3 [X] Medion Akoya S3409-MD60234 Intel Core i7-7500U 2.7GHz
HD Graphics 620
7.4 7.4 [X] Lenovo ThinkPad Yoga 370 PL Intel Core i7-7600U 2.8GHz
HD Graphics 620
7.5 7.6 [X] Acer Aspire E5-774-54HJ Dual-Channel
Intel Core i5-7200U 2.5GHz
HD Graphics 620
7.6 7.6 7.6 7.6 7.6 [X] Lenovo ThinkPad T470s PL Intel Core i5-7200U 2.5GHz
HD Graphics 620
7.7 7.8 7.8 7.8 7.8 7.8 8 [X] Dell Inspiron 13 5378-0K46 Intel Core i5-7200U 2.5GHz
HD Graphics 620
8 8 8.1 8.2 8.2 8.2 8.2 8.2 8.3 8.3 8.3 8.4 8.4 8.4 8.5 8.5 [X] Dell Inspiron 15 5578-4G33 Intel Core i5-7200U 2.5GHz
HD Graphics 620
8.5 8.6 8.6 8.8 [X] HP ProBook 640 G3 Z8K61EA Intel Core i5-7200U 2.5GHz
HD Graphics 620
8.8 8.8 [X] Lenovo ThinkPad L570 20J80020PB Intel Core i5-7200U 2.5GHz
HD Graphics 620
8.8 [X] Lenovo ThinkPad T570 PL Intel Core i7-7500U 2.7GHz
HD Graphics 620
8.9 8.9 9 9 9.1 [X] HP EliteBook 840 G4 Z8N44EA Intel Core i5-7200U 2.5GHz
HD Graphics 620
9.2 9.2 9.2 [X] Fujitsu Lifebook A357-A3570MPH06DE Dual-Channel
Intel Core i5-7200U 2.5GHz
HD Graphics 620
9.5 11 17 ~ 8 fps
46%
HD Graphics (Haswell):
3.7 [X] MSI CX61 2QC 2970M MS-16GD Intel Celeron 2970M 2.2GHz
HD Graphics (Haswell)
fps
15%
HD Graphics (Bay Trail):
1.2 fps
HD Graphics (Haswell):
96.5 fps
HD Graphics (Bay Trail):
39 56.2 69 [X] Baytrail Reference Tablet Intel Atom Z3770 1.5GHz
HD Graphics (Bay Trail)
~ 55 fps
HD Graphics (Haswell):
28.3 fps
HD Graphics (Bay Trail):
12.3 12.8 14 [X] Baytrail Reference Tablet Intel Atom Z3770 1.5GHz
HD Graphics (Bay Trail)
min:
8 fps
~ 13 fps
HD Graphics (Haswell):
15 fps
HD Graphics (Haswell):
59.6 fps
HD Graphics (Haswell):
11.2 fps
3%
HD Graphics (Bay Trail):
0.3 fps
100%
HD Graphics 620:
38.2 fps
32%
HD Graphics (Haswell):
12.2 fps
100%
HD Graphics 620:
23.1 fps
33%
HD Graphics (Haswell):
7.6 fps
100%
HD Graphics 620:
14.7 fps
100%
HD Graphics 620:
5.4 fps
HD Graphics (Haswell):
38.7 fps
HD Graphics (Bay Trail):
15.1 23.6 ~ 19 fps
HD Graphics (Haswell):
17.7 fps
HD Graphics (Bay Trail):
5.2 9.7 ~ 7 fps
HD Graphics (Haswell):
13.1 fps
HD Graphics (Haswell):
18.7 fps
HD Graphics (Bay Trail):
10.3 fps
HD Graphics (Haswell):
11.4 fps
HD Graphics (Bay Trail):
6.2 fps
HD Graphics (Haswell):
12.3 fps
HD Graphics (Bay Trail):
10.1 fps
HD Graphics (Haswell):
9.9 fps
HD Graphics (Bay Trail):
6 fps
HD Graphics (Haswell):
25.6 fps
HD Graphics (Bay Trail):
12.4 fps
HD Graphics (Haswell):
17.6 fps
HD Graphics (Bay Trail):
7.3 fps
HD Graphics (Haswell):
22.3 fps
HD Graphics (Bay Trail):
12.5 14.3 ~ 13 fps
HD Graphics (Haswell):
16.8 fps
HD Graphics (Bay Trail):
9.8 11.2 ~ 11 fps
HD Graphics (Bay Trail):
42 fps
100%
HD Graphics 620:
166.3 fps
28%
HD Graphics (Haswell):
46.2 fps
22%
HD Graphics (Bay Trail):
26.1 [X] Intel NUC Kit DN2820FYKH Intel Celeron N2820 2.2GHz
HD Graphics (Bay Trail)
min:
16 fps, max:
38 fps
46.6 ~ 36 fps
100%
HD Graphics 620:
112.8 fps
31%
HD Graphics (Haswell):
34.7 fps
20%
HD Graphics (Bay Trail):
20 [X] Intel NUC Kit DN2820FYKH Intel Celeron N2820 2.2GHz
HD Graphics (Bay Trail)
min:
13 fps, max:
29 fps
23.9 ~ 22 fps
100%
HD Graphics 620:
70.5 fps
32%
HD Graphics (Haswell):
22.5 fps
100%
HD Graphics 620:
42.7 fps
HD Graphics (Bay Trail):
12.9 13.2 ~ 13 fps
HD Graphics (Bay Trail):
7.5 8.1 ~ 8 fps
HD Graphics (Haswell):
31 fps
HD Graphics (Bay Trail):
28 fps
HD Graphics (Haswell):
18.8 fps
HD Graphics (Haswell):
11.7 fps
100%
HD Graphics 620:
105.9 fps
35%
HD Graphics (Haswell):
36.9 fps
14%
HD Graphics (Bay Trail):
9.2 10.7 14.8 15.6 16.5 [X] Medion Akoya P2214T MD 99430 Intel Celeron N2940 1.8GHz
HD Graphics (Bay Trail)
18.4 19.3 [X] Intel NUC Kit DN2820FYKH Intel Celeron N2820 2.2GHz
HD Graphics (Bay Trail)
min:
14 fps, max:
23 fps
~ 15 fps
100%
HD Graphics 620:
72.2 fps
32%
HD Graphics (Haswell):
23 fps
14%
HD Graphics (Bay Trail):
6 9.5 [X] Medion Akoya P2214T MD 99430 Intel Celeron N2940 1.8GHz
HD Graphics (Bay Trail)
10.3 11.4 12 ~ 10 fps
100%
HD Graphics 620:
30 64.1 ~ 47 fps
41%
HD Graphics (Haswell):
19.5 fps
19%
HD Graphics (Bay Trail):
7.9 [X] Medion Akoya P2214T MD 99430 Intel Celeron N2940 1.8GHz
HD Graphics (Bay Trail)
9.6 ~ 9 fps
15%
HD Graphics (Bay Trail):
5 [X] Medion Akoya P2214T MD 99430 Intel Celeron N2940 1.8GHz
HD Graphics (Bay Trail)
5.9 ~ 5 fps
HD Graphics (Haswell):
12.5 fps
HD Graphics (Bay Trail):
8.5 12.4 ~ 10 fps
HD Graphics (Bay Trail):
8.1 fps
HD Graphics (Bay Trail):
5.8 fps
HD Graphics (Bay Trail):
2.3 fps
40%
HD Graphics (Haswell):
36 fps
32%
HD Graphics (Haswell):
16 fps
33%
HD Graphics (Haswell):
9.8 fps
8%
HD Graphics (Bay Trail):
1.1 fps
HD Graphics (Haswell):
21.7 22.2 ~ 22 fps
HD Graphics (Bay Trail):
11 11.8 ~ 11 fps
HD Graphics (Haswell):
11.2 11.3 ~ 11 fps
HD Graphics (Bay Trail):
10 fps
HD Graphics (Haswell):
6.8 fps
HD Graphics (Bay Trail):
8 fps
HD Graphics (Bay Trail):
4.8 fps
HD Graphics (Haswell):
36.8 fps
HD Graphics (Bay Trail):
19.7 fps
HD Graphics (Haswell):
16.7 fps
HD Graphics (Haswell):
51.9 fps
HD Graphics (Bay Trail):
24.1 36.9 ~ 31 fps
HD Graphics (Haswell):
27.4 fps
HD Graphics (Bay Trail):
12.9 13.3 ~ 13 fps
HD Graphics (Haswell):
14.8 fps
HD Graphics (Haswell):
49.2 fps
HD Graphics (Bay Trail):
9.3 fps
100%
HD Graphics 620:
35.6 [X] Lenovo ThinkPad E470 20H1004SPB Intel Core i5-7200U 2.5GHz
HD Graphics 620
35.7 [X] HP ProBook 450 G4 Z2Y44ES Intel Core i5-7200U 2.5GHz
HD Graphics 620
36 [X] HP EliteBook 850 G4 Z8W50EA Intel Core i5-7200U 2.5GHz
HD Graphics 620
40 [X] Dell Inspiron 13 5378-0K46 Intel Core i5-7200U 2.5GHz
HD Graphics 620
40.9 [X] Lenovo ThinkPad L470 PL Intel Core i5-7200U 2.5GHz
HD Graphics 620
42.2 [X] Lenovo ThinkPad X270 20HN0012PB Intel Core i7-7500U 2.7GHz
HD Graphics 620
44.8 [X] Lenovo ThinkPad L570 20J80020PB Intel Core i5-7200U 2.5GHz
HD Graphics 620
45 [X] Lenovo ThinkPad X1 Carbon 5 20HQ001XPB Intel Core i5-7300U 2.6GHz
HD Graphics 620
45.5 [X] Dell Inspiron 15 5578-4G33 Intel Core i5-7200U 2.5GHz
HD Graphics 620
47.7 [X] Dell Latitude 5280 N014L528012QG45 Intel Core i5-7200U 2.5GHz
HD Graphics 620
50.5 [X] HP ProBook 640 G3 Z8K61EA Intel Core i5-7200U 2.5GHz
HD Graphics 620
56.5 [X] HP EliteBook 840 G4 Z8N44EA Intel Core i5-7200U 2.5GHz
HD Graphics 620
~ 43 fps
19%
HD Graphics (Bay Trail):
5 10.5 [X] Asus Transformer Book T200TA PL Intel Atom Z3775 1.5GHz
HD Graphics (Bay Trail)
~ 8 fps
100%
HD Graphics 620:
29.4 [X] Lenovo ThinkPad L470 PL Intel Core i5-7200U 2.5GHz
HD Graphics 620
29.8 [X] HP EliteBook 850 G4 Z8W50EA Intel Core i5-7200U 2.5GHz
HD Graphics 620
30.2 [X] Lenovo ThinkPad E470 20H1004SPB Intel Core i5-7200U 2.5GHz
HD Graphics 620
30.6 [X] Lenovo ThinkPad X270 20HN0012PB Intel Core i7-7500U 2.7GHz
HD Graphics 620
31.1 [X] Dell Inspiron 13 5378-0K46 Intel Core i5-7200U 2.5GHz
HD Graphics 620
32.4 [X] HP ProBook 450 G4 Z2Y44ES Intel Core i5-7200U 2.5GHz
HD Graphics 620
35.4 [X] Lenovo ThinkPad X1 Carbon 5 20HQ001XPB Intel Core i5-7300U 2.6GHz
HD Graphics 620
35.9 [X] Dell Latitude 5280 N014L528012QG45 Intel Core i5-7200U 2.5GHz
HD Graphics 620
36.3 [X] Lenovo ThinkPad L570 20J80020PB Intel Core i5-7200U 2.5GHz
HD Graphics 620
37 [X] Dell Inspiron 15 5578-4G33 Intel Core i5-7200U 2.5GHz
HD Graphics 620
39 [X] HP ProBook 640 G3 Z8K61EA Intel Core i5-7200U 2.5GHz
HD Graphics 620
41.8 [X] HP EliteBook 840 G4 Z8N44EA Intel Core i5-7200U 2.5GHz
HD Graphics 620
~ 34 fps
16%
HD Graphics (Bay Trail):
5.6 [X] Asus Transformer Book T200TA PL Intel Atom Z3775 1.5GHz
HD Graphics (Bay Trail)
fps
100%
HD Graphics 620:
22.2 [X] HP ProBook 450 G4 Z2Y44ES Intel Core i5-7200U 2.5GHz
HD Graphics 620
24 [X] Lenovo ThinkPad L470 PL Intel Core i5-7200U 2.5GHz
HD Graphics 620
25.6 [X] Lenovo ThinkPad E470 20H1004SPB Intel Core i5-7200U 2.5GHz
HD Graphics 620
25.6 [X] HP EliteBook 850 G4 Z8W50EA Intel Core i5-7200U 2.5GHz
HD Graphics 620
26.6 [X] Lenovo ThinkPad X270 20HN0012PB Intel Core i7-7500U 2.7GHz
HD Graphics 620
27.5 [X] Dell Inspiron 13 5378-0K46 Intel Core i5-7200U 2.5GHz
HD Graphics 620
30.8 [X] Lenovo ThinkPad L570 20J80020PB Intel Core i5-7200U 2.5GHz
HD Graphics 620
31.1 [X] Dell Latitude 5280 N014L528012QG45 Intel Core i5-7200U 2.5GHz
HD Graphics 620
31.4 [X] Lenovo ThinkPad X1 Carbon 5 20HQ001XPB Intel Core i5-7300U 2.6GHz
HD Graphics 620
31.7 [X] Dell Inspiron 15 5578-4G33 Intel Core i5-7200U 2.5GHz
HD Graphics 620
33.5 [X] HP EliteBook 840 G4 Z8N44EA Intel Core i5-7200U 2.5GHz
HD Graphics 620
34.5 [X] HP ProBook 640 G3 Z8K61EA Intel Core i5-7200U 2.5GHz
HD Graphics 620
~ 29 fps
13%
HD Graphics (Bay Trail):
3.7 [X] Asus Transformer Book T200TA PL Intel Atom Z3775 1.5GHz
HD Graphics (Bay Trail)
fps
100%
HD Graphics 620:
14 [X] Lenovo ThinkPad L470 PL Intel Core i5-7200U 2.5GHz
HD Graphics 620
14.5 [X] HP ProBook 450 G4 Z2Y44ES Intel Core i5-7200U 2.5GHz
HD Graphics 620
15 [X] HP EliteBook 850 G4 Z8W50EA Intel Core i5-7200U 2.5GHz
HD Graphics 620
15.1 [X] Lenovo ThinkPad E470 20H1004SPB Intel Core i5-7200U 2.5GHz
HD Graphics 620
15.7 [X] Lenovo ThinkPad X270 20HN0012PB Intel Core i7-7500U 2.7GHz
HD Graphics 620
17.1 [X] Dell Inspiron 13 5378-0K46 Intel Core i5-7200U 2.5GHz
HD Graphics 620
19.3 [X] Lenovo ThinkPad L570 20J80020PB Intel Core i5-7200U 2.5GHz
HD Graphics 620
19.9 [X] Lenovo ThinkPad X1 Carbon 5 20HQ001XPB Intel Core i5-7300U 2.6GHz
HD Graphics 620
20.2 [X] Dell Inspiron 15 5578-4G33 Intel Core i5-7200U 2.5GHz
HD Graphics 620
20.5 [X] HP EliteBook 840 G4 Z8N44EA Intel Core i5-7200U 2.5GHz
HD Graphics 620
20.7 [X] HP ProBook 640 G3 Z8K61EA Intel Core i5-7200U 2.5GHz
HD Graphics 620
~ 17 fps
100%
HD Graphics 620:
181.4 fps
25%
HD Graphics (Bay Trail):
32 48 49 53.3 ~ 46 fps
100%
HD Graphics 620:
54.6 fps
15%
HD Graphics (Bay Trail):
6 9 9 ~ 8 fps
100%
HD Graphics 620:
30.6 fps
10%
HD Graphics (Bay Trail):
3 fps
100%
HD Graphics 620:
17.7 fps
HD Graphics (Bay Trail):
12 [X] Asus Transformer Book T200TA PL Intel Atom Z3775 1.5GHz
HD Graphics (Bay Trail)
fps
HD Graphics (Bay Trail):
9 [X] Asus Transformer Book T200TA PL Intel Atom Z3775 1.5GHz
HD Graphics (Bay Trail)
fps
HD Graphics (Haswell):
28 fps
HD Graphics (Bay Trail):
12.8 fps
HD Graphics (Haswell):
21.2 fps
HD Graphics (Bay Trail):
9 fps
HD Graphics (Haswell):
42.6 fps
HD Graphics (Haswell):
17.8 fps
HD Graphics (Haswell):
113 fps
HD Graphics (Haswell):
45.1 fps
HD Graphics (Bay Trail):
10.3 14 [X] Medion Akoya E1232T-MD99410 Intel Celeron N2807 1.6GHz
HD Graphics (Bay Trail)
17.7 18 18.1 18.1 18.7 18.8 [X] Captiva PAD 10.1 Windows Intel Atom Z3735D 1.3GHz
HD Graphics (Bay Trail)
19.3 19.4 19.4 19.8 19.8 20.5 20.5 [X] cmx WinTek 101-1016 Intel Atom Z3735F 1.3GHz
HD Graphics (Bay Trail)
20.6 21 [X] ODYS Winpad V10 Intel Atom Z3735F 1.3GHz
HD Graphics (Bay Trail)
21.5 23.6 ~ 19 fps
HD Graphics (Bay Trail):
6.4 [X] Captiva PAD 10.1 Windows Intel Atom Z3735D 1.3GHz
HD Graphics (Bay Trail)
7.7 ~ 7 fps
HD Graphics (Bay Trail):
18.9 19 ~ 19 fps
HD Graphics (Bay Trail):
7.6 8.7 ~ 8 fps
HD Graphics (Haswell):
93.7 fps
HD Graphics (Bay Trail):
33 33 35 38 [X] MSI S100 Intel Atom Z3740D 1.3GHz
HD Graphics (Bay Trail)
44 46.2 47 48 49 49 [X] Intel NUC Kit DN2820FYKH Intel Celeron N2820 2.2GHz
HD Graphics (Bay Trail)
min:
39 fps, max:
59 fps
50 [X] Baytrail Reference Tablet Intel Atom Z3770 1.5GHz
HD Graphics (Bay Trail)
min:
36 fps
52 ~ 44 fps
100%
HD Graphics 620:
48 fps
82%
HD Graphics (Haswell):
39.2 fps
48%
HD Graphics (Bay Trail):
9.6 [X] Intel NUC Kit DN2820FYKH Intel Celeron N2820 2.2GHz
HD Graphics (Bay Trail)
min:
3 fps, max:
13 fps
11.5 [X] Baytrail Reference Tablet Intel Atom Z3770 1.5GHz
HD Graphics (Bay Trail)
min:
8 fps
20 22 23 25.3 26 26 28 [X] MSI S100 Intel Atom Z3740D 1.3GHz
HD Graphics (Bay Trail)
34 ~ 23 fps
HD Graphics (Bay Trail):
12 12 13.5 ~ 13 fps
100%
HD Graphics 620:
10.1 fps
59%
HD Graphics (Bay Trail):
5.6 7 ~ 6 fps
HD Graphics (Bay Trail):
190 [X] Baytrail Reference Tablet Intel Atom Z3770 1.5GHz
HD Graphics (Bay Trail)
fps
Average Gaming Intel HD Graphics 620 → 100% Average Gaming 30-70 fps → 100%
Average Gaming Intel HD Graphics (Haswell) → 46% Average Gaming 30-70 fps → 54%
Average Gaming Intel HD Graphics (Bay Trail) → 22% Average Gaming 30-70 fps → 26%
For more games that might be playable and a list of all games and graphics cards visit our Gaming List
v1.28
log 02. 13:45:36
#0 checking url part for id 7435 +0s ... 0s
#1 checking url part for id 4622 +0s ... 0s
#2 checking url part for id 4922 +0s ... 0s
#3 redirected to Ajax server, took 1719920735 +0s ... 0s
#4 did not recreate cache, as it is less than 5 days old! Created at Mon, 01 Jul 2024 05:16:07 +0200 +0s ... 0s
#5 composed specs +0.008s ... 0.008s
#6 did output specs +0s ... 0.008s
#7 start showIntegratedCPUs +0s ... 0.008s
#8 getting avg benchmarks for device 7435 +0.037s ... 0.045s
#9 got single benchmarks 7435 +0.137s ... 0.182s
#10 getting avg benchmarks for device 4622 +0.004s ... 0.186s
#11 got single benchmarks 4622 +0.012s ... 0.198s
#12 getting avg benchmarks for device 4922 +0.003s ... 0.201s
#13 got single benchmarks 4922 +0.089s ... 0.29s
#14 got avg benchmarks for devices +0s ... 0.29s
#15 min, max, avg, median took s +0.075s ... 0.366s
#16 before gaming benchmark output +0s ... 0.366s
#17 Got 1884 rows for game benchmarks. +0.114s ... 0.479s
#18 composed SQL query for gamebenchmarks +0s ... 0.479s
#19 got data and put it in $dataArray +0.008s ... 0.488s
#20 benchmarks composed for output. +0.045s ... 0.533s
#21 calculated avg scores. +0s ... 0.533s
#22 return log +0.002s ... 0.535s
Please share our article, every link counts!
Redaktion, 2017-09- 8 (Update: 2023-07- 1)
 Deutsch
 English
 Español
 Français
 Italiano
 Nederlands
 Polski
 Português
 Русский
 Türkçe
 Svenska
 Chinese
 Magyar