Intel HD Graphics 515 vs NVIDIA GeForce RTX 2080 Super Mobile
Intel HD Graphics 515 ► remove from comparison
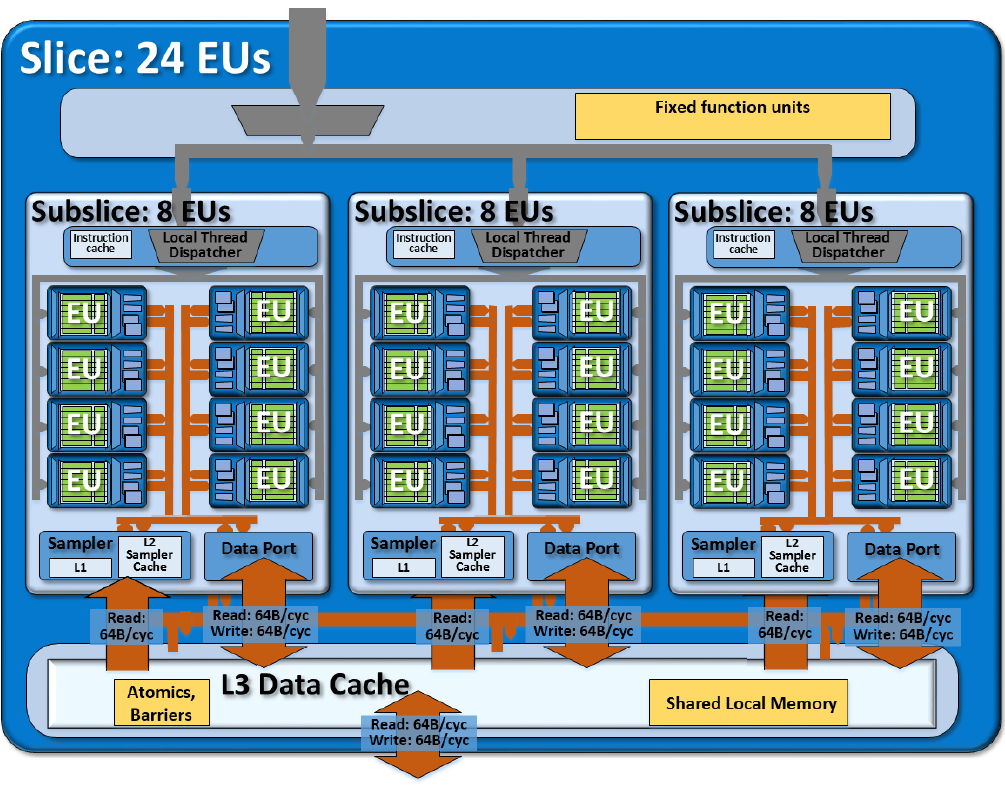
The Intel HD Graphics 515 (GT2) is a low-end integrated graphics unit, which can be found in the Core m-series of the Skylake generation. This "GT2" version of the Skylake GPU offers 24 Execution Units (EUs) clocked at up to 1000 MHz (depending on the CPU model). Due to its lack of dedicated graphics memory or eDRAM cache, the HD 515 has to access the main memory (2x 64bit DDR3L-1600 / LPDDR3-1866).
Performance
According to Intel, the HD Graphics 515 is up to 41 percent faster than the previous HD Graphics 5300 (Broadwell). Nevertheless, the GPU will handle only simple games like Counter-Strike or Dota with decent frame rates. Depending on the specific CPU model, memory configuration and TDP (4.5 W, configurable), performance may vary substantially.
Features
The revised video engine now decodes H.265/HEVC completely in hardware and thereby much more efficiently than before. Displays can be connected via DP 1.2 / eDP 1.3 (max. 3840 x 2160 @ 60 Hz), whereas HDMI is limited to the older version 1.4a (max. 3840 x 2160 @ 30 Hz). However, HDMI 2.0 can be added using a DisplayPort converter. Up to three displays can be controlled simultaneously.
Power Consumption
The HD Graphics 515 can be found in Core m processors with 4.5 W TDP (3.5/3.8 W cTDP down, 7 W cTDP up) and is therefore suited for very thin, mostly passively cooled 2-in-1 notebooks and tablets.
NVIDIA GeForce RTX 2080 Super Mobile ► remove from comparison
The NVIDIA GeForce RTX 2080 Super Mobile is the fastest mobile graphics card for laptops in early 2020. It is based on the desktop RTX 2080 Super , but most likely with reduced core speeds. According to early information it will be only slightly faster than a RTX 2080 with the same TGP setting (max. 200 Watt).
According to our information there will be various versions of the 2080 Super, six versions ranging from 150 - 200 Watt TGP and different clock speeds and three Max-Q variants from 80 - 90 Watt.
Model TGP Base Boost RTX 2080 Super 200W 1560 1740 RTX 2080 Super 190W 1530 1710 RTX 2080 Super 180W 1485 1680 RTX 2080 Super 170W 1455 1635 RTX 2080 Super 160W 1410 1605 RTX 2080 Super 150W 1365 1560 RTX 2080 Super Max-Q 90W 975 1230 RTX 2080 Super Max-Q 85W 885 1155 RTX 2080 Super Max-Q 80W 735 1080
NVIDIA manufacturers the TU104 chip on a 12 nm FinFET process and includes features like Deep Learning Super Sampling (DLSS) and Real-Time Ray Tracing (RTRT), which should combine to create more realistic lighting effects than older GPUs based on the company's Pascal architecture (if the games supports it). The RTX 2080 Super is also DisplayPort 1.4 ready, while there is also support for HDMI 2.0b, HDR, Simultaneous Multi-Projection (SMP) and H.265 video en/decoding (PlayReady 3.0).
The mobile RTX 2080 Super Mobile should perform only slightly better than the old mobile RTX 2080 . Therefore, it should be able to run all demanding games in 4k with maximum details. Raytracing features however may reduce framerates a lot.
The power consumption of the card can be set with 150 or 200 Watt TGP according to early information. Therefore, the normal Max-P variant is only suited for thick and heavy gaming laptops. A Max-Q variant for thin and light laptops is also planned (most likely at 80 - 90 Watt as the RTX 2080 Max-Q with similar performance).
Intel HD Graphics 515 NVIDIA GeForce RTX 2080 Super Mobile GeForce RTX 2000 Series Codename Skylake GT2 N18E-G3 TU104 Architecture Gen. 9 Skylake Turing Pipelines 24 - unified 3072 - unified Core Speed 300 - 1000 (Boost) MHz 1365 - 1560 (Boost) MHz Memory Bus Width 64/128 Bit 256 Bit Memory Type DDR3L/LPDDR3 GDDR6 Shared Memory yes no API DirectX 12_1, OpenGL 4.4 DirectX 12_1, OpenGL 4.6 technology 14 nm 12 nm Features QuickSync NVLink, DLSS, Raytraycing, VR Ready, G-SYNC, Vulkan, Multi Monitor, 650 Watt system power recommended Date of Announcement 01.09.2015 02.04.2020 Memory Speed 14000 MHz Max. Amount of Memory 8 GB Power Consumption 150 Watt Transistors 13.6 Billion Notebook Size large
Benchmarks Performance Rating - 3DMark 11 + Fire Strike + Time Spy - HD Graphics 515
0.3 pt (1%)
...
...
max:
3DMark - 3DMark Time Spy Score
min: 9629 avg: 10443 median: 10465.5 (30%) max: 11211 Points
3DMark - 3DMark Time Spy Graphics
min: 9638 avg: 10301 median: 10313 (27%) max: 10938 Points
3DMark - 3DMark Ice Storm Unlimited Graphics
min: 43449 avg: 58940 median: 56787 (6%) max: 78808 Points
3DMark - 3DMark Ice Storm Extreme Graphics
min: 18749 avg: 24669 median: 23314 (3%) max: 33413 Points
3DMark - 3DMark Cloud Gate Score
min: 2705 avg: 3940 median: 3850.5 (4%) max: 5257 Points
min: 49644 avg: 53643 median: 54828 (59%) max: 56456 Points
3DMark - 3DMark Cloud Gate Graphics
min: 3982 avg: 5440 median: 5467 (1%) max: 7035 Points
min: 120212 avg: 140608 median: 141486 (37%) max: 160125 Points
3DMark - 3DMark Fire Strike Standard Score
min: 453 avg: 617 median: 623.5 (1%) max: 780 Points
min: 20902 avg: 21566 median: 21377.5 (38%) max: 22606 Points
3DMark - 3DMark Fire Strike Standard Graphics
min: 494 avg: 679 median: 691.5 (1%) max: 892 Points
min: 24211 avg: 24932 median: 24960 (28%) max: 25597 Points
3DMark - 3DMark Ice Storm Graphics
min: 31627 avg: 44439 median: 45108 (5%) max: 54558 Points
3DMark 11 - 3DM11 Performance Score
min: 785 avg: 1105 median: 1115 (2%) max: 1360 Points
min: 27065 avg: 28873 median: 28467 (39%) max: 31493 Points
3DMark 11 - 3DM11 Performance GPU
min: 714 avg: 1013 median: 1014 (1%) max: 1254 Points
min: 34021 avg: 35153 median: 34875.5 (30%) max: 36838 Points
3DMark Vantage + Intel HD Graphics 515 3DMark Vantage - 3DM Vant. Perf. total
4672 Points (1%)
3DM Vant. Perf. total + NVIDIA GeForce RTX 2080 Super Mobile
69838 Points (20%)
3DM Vant. Perf. GPU no PhysX + Intel HD Graphics 515 3DMark Vantage - 3DM Vant. Perf. GPU no PhysX
4218 Points (2%)
3DM Vant. Perf. GPU no PhysX + NVIDIA GeForce RTX 2080 Super Mobile
77180 Points (44%)
3DMark 2001SE - 3DMark 2001 - Standard
20345 Points (21%)
3DMark 03 - 3DMark 03 - Standard
18019 Points (9%)
3DMark 05 - 3DMark 05 - Standard
9173 Points (10%)
3DMark 06 3DMark 06 - Standard 1280x1024 + Intel HD Graphics 515
min: 4968 avg: 6621 median: 6446 (8%) max: 7912 Points
3DMark 06 - Standard 1280x1024 + NVIDIA GeForce RTX 2080 Super Mobile
41873 Points (55%)
Unigine Heaven 2.1 - Heaven 2.1 high
min: 15.7 avg: 16.9 median: 16.9 (3%) max: 18 fps
SPECviewperf 12 + Intel HD Graphics 515 SPECviewperf 12 - specvp12 sw-03
17.6 fps (4%)
specvp12 snx-02 + Intel HD Graphics 515 SPECviewperf 12 - specvp12 snx-02
2.1 fps (0%)
specvp12 showcase-01 + Intel HD Graphics 515 SPECviewperf 12 - specvp12 showcase-01
5 fps (1%)
specvp12 mediacal-01 + Intel HD Graphics 515 SPECviewperf 12 - specvp12 mediacal-01
1.8 fps (0%)
specvp12 maya-04 + Intel HD Graphics 515 SPECviewperf 12 - specvp12 maya-04
9 fps (2%)
specvp12 energy-01 + Intel HD Graphics 515 SPECviewperf 12 - specvp12 energy-01
0.1 fps (0%)
specvp12 creo-01 + Intel HD Graphics 515 SPECviewperf 12 - specvp12 creo-01
7.9 fps (3%)
specvp12 catia-04 + Intel HD Graphics 515 SPECviewperf 12 - specvp12 catia-04
9.8 fps (2%)
SPECviewperf 13 specvp13 sw-04 + NVIDIA GeForce RTX 2080 Super Mobile SPECviewperf 13 - specvp13 sw-04
87.9 fps (24%)
specvp13 showcase-02 + NVIDIA GeForce RTX 2080 Super Mobile SPECviewperf 13 - specvp13 showcase-02
110.4 fps (24%)
specvp13 medical-02 + NVIDIA GeForce RTX 2080 Super Mobile SPECviewperf 13 - specvp13 medical-02
60.6 fps (13%)
specvp13 maya-05 + NVIDIA GeForce RTX 2080 Super Mobile SPECviewperf 13 - specvp13 maya-05
201.7 fps (23%)
specvp13 energy-02 + NVIDIA GeForce RTX 2080 Super Mobile SPECviewperf 13 - specvp13 energy-02
22.3 fps (7%)
specvp13 creo-02 + NVIDIA GeForce RTX 2080 Super Mobile SPECviewperf 13 - specvp13 creo-02
173.4 fps (25%)
specvp13 catia-05 + NVIDIA GeForce RTX 2080 Super Mobile SPECviewperf 13 - specvp13 catia-05
144.9 fps (16%)
specvp13 3dsmax-06 + NVIDIA GeForce RTX 2080 Super Mobile SPECviewperf 13 - specvp13 3dsmax-06
184.8 fps (32%)
Cinebench R10 Cinebench R10 Shading (32bit) + Intel HD Graphics 515 Cinebench R10 - Cinebench R10 Shading (32bit)
min: 4740 avg: 6063 median: 6088 (4%) max: 7263 Points
Cinebench R11.5 Cinebench R11.5 OpenGL 64 Bit + Intel HD Graphics 515 Cinebench R11.5 - Cinebench R11.5 OpenGL 64 Bit
min: 16.86 avg: 23.6 median: 23.1 (8%) max: 31.86 fps
Cinebench R15 + Intel HD Graphics 515 Cinebench R15 - Cinebench R15 OpenGL 64 Bit
min: 18.93 avg: 28.6 median: 29.4 (2%) max: 35.98 fps
Cinebench R15 OpenGL 64 Bit + NVIDIA GeForce RTX 2080 Super Mobile
min: 154 avg: 178 median: 166 (10%) max: 226 fps
Cinebench R15 OpenGL Ref. Match 64 Bit + Intel HD Graphics 515 Cinebench R15 - Cinebench R15 OpenGL Ref. Match 64 Bit
min: 97.7 avg: 98 median: 97.8 (98%) max: 99.3 %
Cinebench R15 OpenGL Ref. Match 64 Bit + NVIDIA GeForce RTX 2080 Super Mobile
99.6 % (100%)
GFXBench - GFXBench Car Chase Offscreen
20.9 fps (2%)
412.6 fps (46%)
GFXBench 3.1 - GFXBench Manhattan ES 3.1 Offscreen
min: 25.5 avg: 27.7 median: 27.7 (1%) max: 29.9 fps
GFXBench 3.0 - GFXBench 3.0 Manhattan Offscreen
min: 31.9 avg: 36.5 median: 36.7 (2%) max: 43.6 fps
GFXBench (DX / GLBenchmark) 2.7 + Intel HD Graphics 515 GFXBench (DX / GLBenchmark) 2.7 - GFXBench T-Rex HD Offscreen C24Z16
min: 70 avg: 75.4 median: 73.2 (1%) max: 87 fps
LuxMark v2.0 64Bit - LuxMark v2.0 Room GPU
min: 173 avg: 183 median: 183 (1%) max: 193 Samples/s
3764 Samples/s (17%)
LuxMark v2.0 64Bit - LuxMark v2.0 Sala GPU
min: 395 avg: 413.5 median: 416 (1%) max: 427 Samples/s
8244 Samples/s (14%)
ComputeMark v2.1 - ComputeMark v2.1 Result
min: 476 avg: 660 median: 704 (1%) max: 741 Points
17233 Points (19%)
Power Consumption - Witcher 3 Power Consumption *
min: 227 avg: 274.9 median: 277.3 (61%) max: 318 Watt
Power Consumption - Witcher 3 ultra Power Efficiency
min: 0.3428 avg: 0.4 median: 0.4 (35%) max: 0.4115 fps per Watt
Emissions Witcher 3 Fan Noise + NVIDIA GeForce RTX 2080 Super Mobile Emissions - Witcher 3 Fan Noise
min: 50 avg: 54.4 median: 53.4 (85%) max: 60.7 dB(A)
Clock Speed - GPU Clock Witcher 3 ultra
min: 1635 avg: 1725 median: 1725 (68%) max: 1815 MHz
Average Benchmarks Intel HD Graphics 515 → 100% n=15 Average Benchmarks NVIDIA GeForce RTX 2080 Super Mobile → 2010% n=15
- Range of benchmark values for this graphics card
- Average benchmark values for this graphics card
* Smaller numbers mean a higher performance
1 This benchmark is not used for the average calculation
Game Benchmarks The following benchmarks stem from our benchmarks of review laptops. The performance depends on the used graphics memory, clock rate, processor, system settings, drivers, and operating systems. So the results don't have to be representative for all laptops with this GPU. For detailed information on the benchmark results, click on the fps number.
GeForce RTX 2080 Super Mobile:
278 fps
GeForce RTX 2080 Super Mobile:
278 fps
GeForce RTX 2080 Super Mobile:
274 fps
GeForce RTX 2080 Super Mobile:
238 fps
GeForce RTX 2080 Super Mobile:
263 fps
GeForce RTX 2080 Super Mobile:
243 fps
GeForce RTX 2080 Super Mobile:
175 fps
GeForce RTX 2080 Super Mobile:
105 fps
GeForce RTX 2080 Super Mobile:
122 fps
GeForce RTX 2080 Super Mobile:
83.4 fps
GeForce RTX 2080 Super Mobile:
45.2 fps
GeForce RTX 2080 Super Mobile:
113 fps
GeForce RTX 2080 Super Mobile:
95 fps
GeForce RTX 2080 Super Mobile:
84.2 fps
GeForce RTX 2080 Super Mobile:
54.4 fps
GeForce RTX 2080 Super Mobile:
64.6 fps
GeForce RTX 2080 Super Mobile:
47.1 fps
GeForce RTX 2080 Super Mobile:
37.8 fps
GeForce RTX 2080 Super Mobile:
23.8 fps
GeForce RTX 2080 Super Mobile:
127 fps
GeForce RTX 2080 Super Mobile:
104 fps
GeForce RTX 2080 Super Mobile:
80 fps
GeForce RTX 2080 Super Mobile:
45 fps
GeForce RTX 2080 Super Mobile:
149 fps
GeForce RTX 2080 Super Mobile:
147 fps
GeForce RTX 2080 Super Mobile:
108 fps
GeForce RTX 2080 Super Mobile:
60 fps
GeForce RTX 2080 Super Mobile:
235 fps
GeForce RTX 2080 Super Mobile:
175 234 ~ 205 fps
GeForce RTX 2080 Super Mobile:
146 161 ~ 154 fps
GeForce RTX 2080 Super Mobile:
119 122 ~ 121 fps
GeForce RTX 2080 Super Mobile:
72 72.5 ~ 72 fps
GeForce RTX 2080 Super Mobile:
226 fps
GeForce RTX 2080 Super Mobile:
144 154 ~ 149 fps
GeForce RTX 2080 Super Mobile:
106 125 ~ 116 fps
GeForce RTX 2080 Super Mobile:
70.3 82.1 ~ 76 fps
GeForce RTX 2080 Super Mobile:
38.4 43.2 ~ 41 fps
GeForce RTX 2080 Super Mobile:
216 fps
GeForce RTX 2080 Super Mobile:
193 222 ~ 208 fps
GeForce RTX 2080 Super Mobile:
191 219 ~ 205 fps
GeForce RTX 2080 Super Mobile:
147 176 ~ 162 fps
GeForce RTX 2080 Super Mobile:
80.8 96.5 ~ 89 fps
GeForce RTX 2080 Super Mobile:
151 fps
GeForce RTX 2080 Super Mobile:
120 133 ~ 127 fps
GeForce RTX 2080 Super Mobile:
83.1 92.4 ~ 88 fps
GeForce RTX 2080 Super Mobile:
38.4 85.6 ~ 62 fps
GeForce RTX 2080 Super Mobile:
121 fps
GeForce RTX 2080 Super Mobile:
121 fps
GeForce RTX 2080 Super Mobile:
121 fps
GeForce RTX 2080 Super Mobile:
102 fps
GeForce RTX 2080 Super Mobile:
49.5 fps
GeForce RTX 2080 Super Mobile:
117 fps
GeForce RTX 2080 Super Mobile:
79.8 fps
GeForce RTX 2080 Super Mobile:
52.9 fps
GeForce RTX 2080 Super Mobile:
42.5 fps
GeForce RTX 2080 Super Mobile:
27.6 fps
GeForce RTX 2080 Super Mobile:
121 fps
GeForce RTX 2080 Super Mobile:
117 fps
GeForce RTX 2080 Super Mobile:
107 fps
GeForce RTX 2080 Super Mobile:
86.4 fps
GeForce RTX 2080 Super Mobile:
49 fps
GeForce RTX 2080 Super Mobile:
104 fps
GeForce RTX 2080 Super Mobile:
91 fps
GeForce RTX 2080 Super Mobile:
79.4 fps
GeForce RTX 2080 Super Mobile:
75.3 fps
GeForce RTX 2080 Super Mobile:
51.3 fps
GeForce RTX 2080 Super Mobile:
145 fps
GeForce RTX 2080 Super Mobile:
136 fps
GeForce RTX 2080 Super Mobile:
115 fps
GeForce RTX 2080 Super Mobile:
83.6 fps
GeForce RTX 2080 Super Mobile:
48.3 fps
GeForce RTX 2080 Super Mobile:
164 fps
GeForce RTX 2080 Super Mobile:
120 fps
GeForce RTX 2080 Super Mobile:
88.7 fps
GeForce RTX 2080 Super Mobile:
72.5 fps
GeForce RTX 2080 Super Mobile:
48.8 fps
GeForce RTX 2080 Super Mobile:
109 fps
GeForce RTX 2080 Super Mobile:
99 fps
GeForce RTX 2080 Super Mobile:
74 fps
GeForce RTX 2080 Super Mobile:
57 fps
GeForce RTX 2080 Super Mobile:
34 fps
GeForce RTX 2080 Super Mobile:
281 fps
GeForce RTX 2080 Super Mobile:
267 fps
GeForce RTX 2080 Super Mobile:
262 fps
GeForce RTX 2080 Super Mobile:
258 fps
GeForce RTX 2080 Super Mobile:
227 fps
GeForce RTX 2080 Super Mobile:
131 fps
GeForce RTX 2080 Super Mobile:
98 107 ~ 103 fps
GeForce RTX 2080 Super Mobile:
88 89.8 ~ 89 fps
GeForce RTX 2080 Super Mobile:
64.6 65.4 ~ 65 fps
GeForce RTX 2080 Super Mobile:
35.2 37.1 ~ 36 fps
GeForce RTX 2080 Super Mobile:
113 fps
GeForce RTX 2080 Super Mobile:
87.6 fps
GeForce RTX 2080 Super Mobile:
58.9 fps
GeForce RTX 2080 Super Mobile:
29.8 fps
GeForce RTX 2080 Super Mobile:
224 fps
GeForce RTX 2080 Super Mobile:
174 fps
GeForce RTX 2080 Super Mobile:
167 fps
GeForce RTX 2080 Super Mobile:
130 fps
GeForce RTX 2080 Super Mobile:
80 fps
GeForce RTX 2080 Super Mobile:
148 fps
GeForce RTX 2080 Super Mobile:
127 fps
GeForce RTX 2080 Super Mobile:
127 fps
GeForce RTX 2080 Super Mobile:
81.9 fps
GeForce RTX 2080 Super Mobile:
40.3 fps
GeForce RTX 2080 Super Mobile:
122 fps
GeForce RTX 2080 Super Mobile:
91.7 fps
GeForce RTX 2080 Super Mobile:
50.6 fps
GeForce RTX 2080 Super Mobile:
45.3 fps
GeForce RTX 2080 Super Mobile:
27.1 fps
GeForce RTX 2080 Super Mobile:
147 fps
GeForce RTX 2080 Super Mobile:
131 fps
GeForce RTX 2080 Super Mobile:
102 fps
GeForce RTX 2080 Super Mobile:
69 fps
GeForce RTX 2080 Super Mobile:
36 fps
GeForce RTX 2080 Super Mobile:
178 fps
GeForce RTX 2080 Super Mobile:
158 fps
GeForce RTX 2080 Super Mobile:
91.6 fps
GeForce RTX 2080 Super Mobile:
74.1 fps
GeForce RTX 2080 Super Mobile:
116 fps
GeForce RTX 2080 Super Mobile:
113 fps
GeForce RTX 2080 Super Mobile:
100 fps
GeForce RTX 2080 Super Mobile:
90 fps
GeForce RTX 2080 Super Mobile:
55 fps
GeForce RTX 2080 Super Mobile:
116 fps
GeForce RTX 2080 Super Mobile:
90.2 fps
GeForce RTX 2080 Super Mobile:
71 fps
GeForce RTX 2080 Super Mobile:
55.4 fps
GeForce RTX 2080 Super Mobile:
34.9 fps
GeForce RTX 2080 Super Mobile:
144 fps
GeForce RTX 2080 Super Mobile:
144 fps
GeForce RTX 2080 Super Mobile:
144 fps
GeForce RTX 2080 Super Mobile:
131 fps
GeForce RTX 2080 Super Mobile:
75.4 fps
GeForce RTX 2080 Super Mobile:
157 fps
GeForce RTX 2080 Super Mobile:
120 fps
GeForce RTX 2080 Super Mobile:
113 fps
GeForce RTX 2080 Super Mobile:
81.2 fps
GeForce RTX 2080 Super Mobile:
46 fps
GeForce RTX 2080 Super Mobile:
168 fps
GeForce RTX 2080 Super Mobile:
143 fps
GeForce RTX 2080 Super Mobile:
132 fps
GeForce RTX 2080 Super Mobile:
97.2 fps
GeForce RTX 2080 Super Mobile:
50.5 fps
GeForce RTX 2080 Super Mobile:
169 fps
GeForce RTX 2080 Super Mobile:
153 168 ~ 161 fps
GeForce RTX 2080 Super Mobile:
142 152 ~ 147 fps
GeForce RTX 2080 Super Mobile:
115 126 ~ 121 fps
GeForce RTX 2080 Super Mobile:
68.7 76.2 ~ 72 fps
GeForce RTX 2080 Super Mobile:
104 fps
GeForce RTX 2080 Super Mobile:
87.8 fps
GeForce RTX 2080 Super Mobile:
80 fps
GeForce RTX 2080 Super Mobile:
77.7 fps
GeForce RTX 2080 Super Mobile:
48.4 fps
GeForce RTX 2080 Super Mobile:
98 fps
GeForce RTX 2080 Super Mobile:
85 fps
GeForce RTX 2080 Super Mobile:
62 fps
GeForce RTX 2080 Super Mobile:
57 fps
GeForce RTX 2080 Super Mobile:
38 fps
100%
HD Graphics 515:
21 (!) [X] Cube i9 Intel Core m3-6Y30 0.9GHz
HD Graphics 515
max:
30 fps
fps
GeForce RTX 2080 Super Mobile:
136 fps
GeForce RTX 2080 Super Mobile:
127 142 ~ 135 fps
GeForce RTX 2080 Super Mobile:
121 126 ~ 124 fps
GeForce RTX 2080 Super Mobile:
84 87.5 ~ 86 fps
GeForce RTX 2080 Super Mobile:
45 47.1 ~ 46 fps
GeForce RTX 2080 Super Mobile:
515 [X] MSI GT76 Titan DT 10SGS 1.47.22.14 D3D12
Intel Core i9-10900K 3.7GHz
GeForce RTX 2080 Super Mobile
min:
117 fps, P1:
398 fps, max:
752 fps
fps
GeForce RTX 2080 Super Mobile:
265 [X] MSI GT76 Titan DT 10SGS 1.47.22.14 D3D12
Intel Core i9-10900K 3.7GHz
GeForce RTX 2080 Super Mobile
min:
129 fps, P1:
234 fps, max:
347 fps
fps
GeForce RTX 2080 Super Mobile:
217 [X] MSI GT76 Titan DT 10SGS 1.47.22.14 D3D12
Intel Core i9-10900K 3.7GHz
GeForce RTX 2080 Super Mobile
min:
162 fps, P1:
166 fps, max:
301 fps
fps
GeForce RTX 2080 Super Mobile:
183 [X] MSI GT76 Titan DT 10SGS 1.47.22.14 D3D12
Intel Core i9-10900K 3.7GHz
GeForce RTX 2080 Super Mobile
min:
139 fps, P1:
143 fps, max:
244 fps
fps
GeForce RTX 2080 Super Mobile:
137 [X] MSI GT76 Titan DT 10SGS 1.47.22.14 D3D12
Intel Core i9-10900K 3.7GHz
GeForce RTX 2080 Super Mobile
min:
72 fps, P1:
114 fps, max:
276 fps
fps
GeForce RTX 2080 Super Mobile:
78.4 [X] MSI GT76 Titan DT 10SGS 1.47.22.14 D3D12
Intel Core i9-10900K 3.7GHz
GeForce RTX 2080 Super Mobile
min:
67.6 fps, P1:
69.9 fps, max:
120 fps
fps
GeForce RTX 2080 Super Mobile:
131 fps
GeForce RTX 2080 Super Mobile:
119 fps
GeForce RTX 2080 Super Mobile:
102 fps
GeForce RTX 2080 Super Mobile:
69.1 fps
GeForce RTX 2080 Super Mobile:
36 fps
100%
HD Graphics 515:
14.4 [X] Cube i9 Intel Core m3-6Y30 0.9GHz
HD Graphics 515
fps
931%
GeForce RTX 2080 Super Mobile:
123 128 138 145 ~ 134 fps
GeForce RTX 2080 Super Mobile:
84.2 88.2 ~ 86 fps
GeForce RTX 2080 Super Mobile:
144 fps
GeForce RTX 2080 Super Mobile:
107 fps
GeForce RTX 2080 Super Mobile:
75.3 fps
GeForce RTX 2080 Super Mobile:
56.1 fps
GeForce RTX 2080 Super Mobile:
33.1 fps
GeForce RTX 2080 Super Mobile:
193 196 ~ 195 fps
GeForce RTX 2080 Super Mobile:
124 134 140 ~ 133 fps
GeForce RTX 2080 Super Mobile:
95.7 103 107 ~ 102 fps
GeForce RTX 2080 Super Mobile:
80.2 fps
GeForce RTX 2080 Super Mobile:
42 47 ~ 45 fps
GeForce RTX 2080 Super Mobile:
178 fps
GeForce RTX 2080 Super Mobile:
171 fps
GeForce RTX 2080 Super Mobile:
136 fps
GeForce RTX 2080 Super Mobile:
104 fps
GeForce RTX 2080 Super Mobile:
52 fps
100%
HD Graphics 515:
42 48 [X] Cube i9 Intel Core m3-6Y30 0.9GHz
HD Graphics 515
min:
42 fps
~ 45 fps
100%
HD Graphics 515:
30 36 [X] Cube i9 Intel Core m3-6Y30 0.9GHz
HD Graphics 515
min:
32 fps
~ 33 fps
100%
HD Graphics 515:
14 24 [X] Cube i9 Intel Core m3-6Y30 0.9GHz
HD Graphics 515
min:
20 fps
~ 19 fps
100%
HD Graphics 515:
26.6 [X] Cube i9 Intel Core m3-6Y30 0.9GHz
HD Graphics 515
min:
23 fps, max:
29 fps
fps
100%
HD Graphics 515:
28 30.1 [X] Cube i9 Intel Core m3-6Y30 0.9GHz
HD Graphics 515
min:
15 fps, max:
44 fps
~ 29 fps
100%
HD Graphics 515:
10.7 [X] Cube i9 Intel Core m3-6Y30 0.9GHz
HD Graphics 515
max:
16 fps
11 ~ 11 fps
100%
HD Graphics 515:
9.4 [X] Medion Akoya P3401T 2in1 Intel Core m5-6Y54 1.1GHz
HD Graphics 515
fps
100%
HD Graphics 515:
4.3 [X] Medion Akoya P3401T 2in1 Intel Core m5-6Y54 1.1GHz
HD Graphics 515
fps
100%
HD Graphics 515:
17.2 [X] Medion Akoya P3401T 2in1 Intel Core m5-6Y54 1.1GHz
HD Graphics 515
fps
100%
HD Graphics 515:
6.6 [X] Medion Akoya P3401T 2in1 Intel Core m5-6Y54 1.1GHz
HD Graphics 515
fps
100%
HD Graphics 515:
22.3 [X] Medion Akoya P3401T 2in1 Intel Core m5-6Y54 1.1GHz
HD Graphics 515
fps
100%
HD Graphics 515:
10.3 [X] Medion Akoya P3401T 2in1 Intel Core m5-6Y54 1.1GHz
HD Graphics 515
fps
100%
HD Graphics 515:
48 [X] Cube i9 Intel Core m3-6Y30 0.9GHz
HD Graphics 515
min:
42 fps, max:
60 fps
fps
100%
HD Graphics 515:
24.1 [X] Cube i9 Intel Core m3-6Y30 0.9GHz
HD Graphics 515
min:
19 fps, max:
30 fps
fps
100%
HD Graphics 515:
10.1 [X] Cube i9 Intel Core m3-6Y30 0.9GHz
HD Graphics 515
min:
8 fps, max:
14 fps
fps
100%
HD Graphics 515:
21.5 [X] Medion Akoya P3401T 2in1 Intel Core m5-6Y54 1.1GHz
HD Graphics 515
fps
100%
HD Graphics 515:
10.3 [X] Medion Akoya P3401T 2in1 Intel Core m5-6Y54 1.1GHz
HD Graphics 515
fps
100%
HD Graphics 515:
10.7 [X] Medion Akoya P3401T 2in1 Intel Core m5-6Y54 1.1GHz
HD Graphics 515
fps
100%
HD Graphics 515:
7.8 [X] Medion Akoya P3401T 2in1 Intel Core m5-6Y54 1.1GHz
HD Graphics 515
fps
100%
HD Graphics 515:
11.4 [X] Cube i9 Intel Core m3-6Y30 0.9GHz
HD Graphics 515
min:
5 fps, max:
15 fps
fps
100%
HD Graphics 515:
13.8 21.7 [X] Cube i9 Intel Core m3-6Y30 0.9GHz
HD Graphics 515
min:
14 fps, max:
30 fps
~ 18 fps
100%
HD Graphics 515:
8.4 fps
100%
HD Graphics 515:
6.1 8.4 ~ 7 fps
100%
HD Graphics 515:
5.9 fps
100%
HD Graphics 515:
10.1 fps
100%
HD Graphics 515:
9.2 fps
100%
HD Graphics 515:
12 fps
100%
HD Graphics 515:
8.4 fps
100%
HD Graphics 515:
11 fps
100%
HD Graphics 515:
5 fps
100%
HD Graphics 515:
11.2 fps
100%
HD Graphics 515:
4.9 fps
100%
HD Graphics 515:
25.7 fps
100%
HD Graphics 515:
15.2 fps
100%
HD Graphics 515:
13.1 fps
100%
HD Graphics 515:
8.7 fps
100%
HD Graphics 515:
18.7 fps
100%
HD Graphics 515:
10.4 fps
100%
HD Graphics 515:
12.4 fps
100%
HD Graphics 515:
8.1 fps
100%
HD Graphics 515:
15.5 fps
100%
HD Graphics 515:
9.3 fps
100%
HD Graphics 515:
42 (!) fps
100%
HD Graphics 515:
32 [X] Cube i9 Intel Core m3-6Y30 0.9GHz
HD Graphics 515
min:
13 fps, max:
48 fps
32.1 42.8 ~ 36 fps
100%
HD Graphics 515:
23.6 [X] Cube i9 Intel Core m3-6Y30 0.9GHz
HD Graphics 515
min:
10 fps, max:
42 fps
26.3 30.2 ~ 27 fps
100%
HD Graphics 515:
7.4 11.7 ~ 10 fps
100%
HD Graphics 515:
25.7 fps
100%
HD Graphics 515:
15.3 fps
100%
HD Graphics 515:
48 [X] Cube i9 Intel Core m3-6Y30 0.9GHz
HD Graphics 515
min:
42.2 fps
fps
358%
GeForce RTX 2080 Super Mobile:
150 168 179 190 ~ 172 fps
100%
HD Graphics 515:
25.4 [X] Cube i9 Intel Core m3-6Y30 0.9GHz
HD Graphics 515
min:
21.5 fps
30 [X] Cube i9 Intel Core m3-6Y30 0.9GHz
HD Graphics 515
~ 28 fps
561%
GeForce RTX 2080 Super Mobile:
140 154 163 172 ~ 157 fps
100%
HD Graphics 515:
9.4 [X] Cube i9 Intel Core m3-6Y30 0.9GHz
HD Graphics 515
min:
8.7 fps
fps
1617%
GeForce RTX 2080 Super Mobile:
134 148 158 167 ~ 152 fps
100%
HD Graphics 515:
8.1 [X] Cube i9 Intel Core m3-6Y30 0.9GHz
HD Graphics 515
min:
7.1 fps
fps
1741%
GeForce RTX 2080 Super Mobile:
127 134 148 156 ~ 141 fps
GeForce RTX 2080 Super Mobile:
136 145 ~ 141 fps
4789%
GeForce RTX 2080 Super Mobile:
389.7 471.7 ~ 431 fps
100%
HD Graphics 515:
7.1 fps
4155%
GeForce RTX 2080 Super Mobile:
274.2 280 332 ~ 295 fps
100%
HD Graphics 515:
57 [X] Dell Latitude 12 E7275 Intel Core m7-6Y75 1.2GHz
HD Graphics 515
57.8 65.7 67.2 ~ 62 fps
100%
HD Graphics 515:
13.9 [X] Dell Latitude 12 E7275 Intel Core m7-6Y75 1.2GHz
HD Graphics 515
14.4 15.8 16 ~ 15 fps
100%
HD Graphics 515:
12.5 fps
GeForce RTX 2080 Super Mobile:
185 185 187 ~ 186 fps
GeForce RTX 2080 Super Mobile:
178 182 183 ~ 181 fps
GeForce RTX 2080 Super Mobile:
164 176 179 ~ 173 fps
GeForce RTX 2080 Super Mobile:
92.8 101 ~ 97 fps
GeForce RTX 2080 Super Mobile:
90.2 fps
GeForce RTX 2080 Super Mobile:
96 98.9 ~ 97 fps
100%
HD Graphics 515:
6.8 8.3 ~ 8 fps
100%
HD Graphics 515:
4.1 fps
100%
HD Graphics 515:
13.5 fps
100%
HD Graphics 515:
9.3 fps
100%
HD Graphics 515:
41 41 ~ 41 fps
100%
HD Graphics 515:
27 28 ~ 28 fps
100%
HD Graphics 515:
15 17 ~ 16 fps
100%
HD Graphics 515:
12.5 fps
100%
HD Graphics 515:
38.3 fps
100%
HD Graphics 515:
29.6 fps
100%
HD Graphics 515:
15.1 fps
100%
HD Graphics 515:
161.1 fps
100%
HD Graphics 515:
39.2 fps
100%
HD Graphics 515:
17.1 fps
100%
HD Graphics 515:
10.4 fps
100%
HD Graphics 515:
86.5 fps
100%
HD Graphics 515:
26.3 fps
100%
HD Graphics 515:
14.9 fps
100%
HD Graphics 515:
12.5 fps
100%
HD Graphics 515:
6.7 10.1 ~ 8 fps
100%
HD Graphics 515:
7.5 fps
100%
HD Graphics 515:
9 fps
100%
HD Graphics 515:
3.8 4 4.3 4.4 4.6 [X] Dell Latitude 12 E7275 Intel Core m7-6Y75 1.2GHz
HD Graphics 515
4.7 4.7 4.9 5.1 5.3 5.9 6 6.5 [X] Panasonic Toughbook CF-20 Intel Core m5-6Y57 1.1GHz
HD Graphics 515
6.7 [X] Medion Akoya P3401T 2in1 Intel Core m5-6Y54 1.1GHz
HD Graphics 515
~ 5 fps
100%
HD Graphics 515:
80.8 fps
100%
HD Graphics 515:
24.9 fps
100%
HD Graphics 515:
14.6 fps
100%
HD Graphics 515:
20.2 fps
100%
HD Graphics 515:
12.9 fps
100%
HD Graphics 515:
8.3 fps
100%
HD Graphics 515:
76.7 fps
100%
HD Graphics 515:
57.3 fps
100%
HD Graphics 515:
35.1 fps
100%
HD Graphics 515:
20.2 fps
100%
HD Graphics 515:
61.9 fps
100%
HD Graphics 515:
41.8 fps
100%
HD Graphics 515:
35.1 fps
100%
HD Graphics 515:
20.5 fps
100%
HD Graphics 515:
9.6 fps
100%
HD Graphics 515:
31.1 fps
100%
HD Graphics 515:
18.7 fps
100%
HD Graphics 515:
11.6 fps
100%
HD Graphics 515:
7.1 fps
100%
HD Graphics 515:
50 fps
100%
HD Graphics 515:
27.2 fps
100%
HD Graphics 515:
11.2 fps
Average Gaming Intel HD Graphics 515 → 100% Average Gaming 30-70 fps → 100%
Average Gaming NVIDIA GeForce RTX 2080 Super Mobile → 2022%  Deutsch
 English
 Español
 Français
 Italiano
 Nederlands
 Polski
 Português
 Русский
 Türkçe
 Svenska
 Chinese
 Magyar