Intel HD Graphics 515 vs NVIDIA GeForce RTX 2060 Max-Q
Intel HD Graphics 515 ► remove from comparison
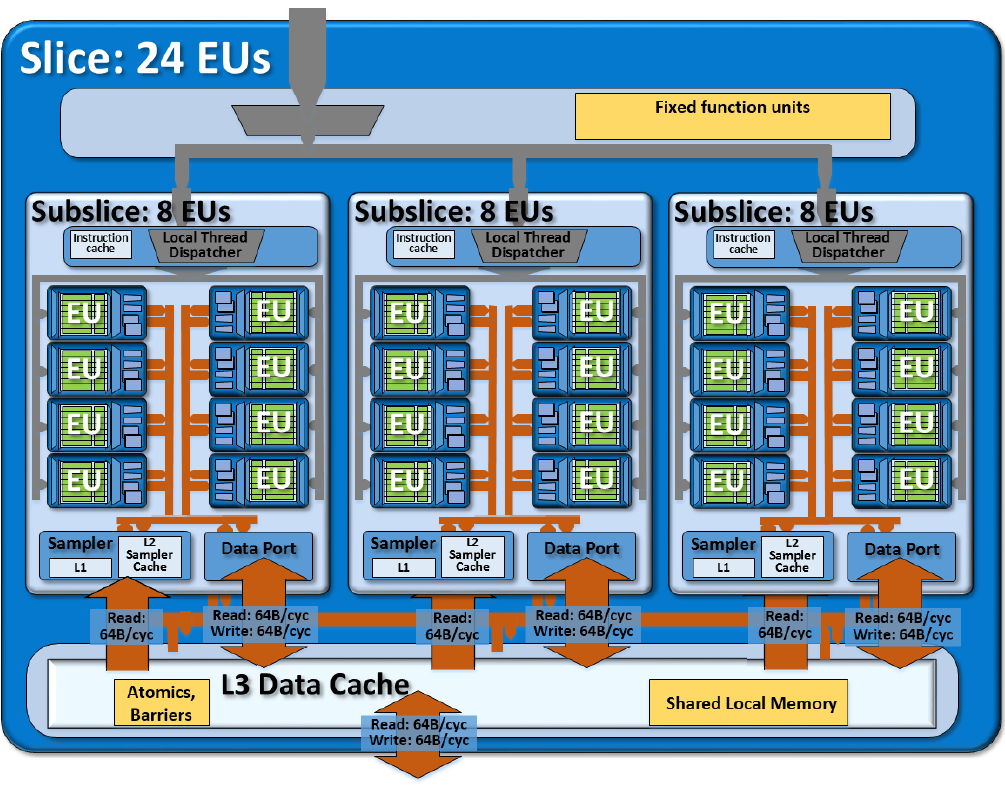
The Intel HD Graphics 515 (GT2) is a low-end integrated graphics unit, which can be found in the Core m-series of the Skylake generation. This "GT2" version of the Skylake GPU offers 24 Execution Units (EUs) clocked at up to 1000 MHz (depending on the CPU model). Due to its lack of dedicated graphics memory or eDRAM cache, the HD 515 has to access the main memory (2x 64bit DDR3L-1600 / LPDDR3-1866).
Performance
According to Intel, the HD Graphics 515 is up to 41 percent faster than the previous HD Graphics 5300 (Broadwell). Nevertheless, the GPU will handle only simple games like Counter-Strike or Dota with decent frame rates. Depending on the specific CPU model, memory configuration and TDP (4.5 W, configurable), performance may vary substantially.
Features
The revised video engine now decodes H.265/HEVC completely in hardware and thereby much more efficiently than before. Displays can be connected via DP 1.2 / eDP 1.3 (max. 3840 x 2160 @ 60 Hz), whereas HDMI is limited to the older version 1.4a (max. 3840 x 2160 @ 30 Hz). However, HDMI 2.0 can be added using a DisplayPort converter. Up to three displays can be controlled simultaneously.
Power Consumption
The HD Graphics 515 can be found in Core m processors with 4.5 W TDP (3.5/3.8 W cTDP down, 7 W cTDP up) and is therefore suited for very thin, mostly passively cooled 2-in-1 notebooks and tablets.
NVIDIA GeForce RTX 2060 Max-Q ► remove from comparison
The NVIDIA GeForce RTX 2060 with Max-Q design is the power saving variant of the mobile GeForce RTX 2060 . Therefore it is a high end gaming graphics card for thin laptops. It is based on the same chip as the RTX 2060 but with reduced clock speeds and a lower power consumption. It was released in 2020 with the Zephyrus G14 gaming laptop.
With the refresh, Nvidia also reworked the Max-Q technologies for more efficiency. Low Voltage GDDR6 (lower clocked but more headroom for the GPU) and improved regulator efficiency should improve the performance per Watt. Two new optional features can also be implemented by the OEM. Max-Q Dynamic Boost is able to shift power from the CPU to the GPU on a per frame basis to increase overall performance. Furthermore, the laptop manufacturer can also implement Advanced Optimus with a dynamic display switch (hardware) to enable Optimus, G-SYNC and high refresh rate displays (up to 4K 120 Hz).
The clock is not the only difference compared to the regular GTX 2060 though. The drivers for the Max-Q version were optimized for efficiency (and not performance; only for Max-Q models), there are optimized voltage converters for 1V operation, high-end cooling methods, and a 40 dB limit for the fan noise (with clock adjustments to ensure this at all times).
The performance should be only slightly below the normal RTX 2060 due to the decreased clock rates. It should be most suited for 1080p gaming at maximum detail level. Raytracing features however may reduce framerates a lot, so using raytracing will be limited to some games.
The chip is specified at a TGP of around 65 Watt and therefore clearly lower than the 80 - 90 Watt of the regular RTX 2060 Mobile.
Intel HD Graphics 515 NVIDIA GeForce RTX 2060 Max-Q GeForce RTX 2000 Series Codename Skylake GT2 N18E-G1 MAX-Q TU106 Architecture Gen. 9 Skylake Turing Pipelines 24 - unified 1920 - unified Core Speed 300 - 1000 (Boost) MHz 975 - 1185 (Boost) MHz Memory Bus Width 64/128 Bit 192 Bit Memory Type DDR3L/LPDDR3 GDDR6 Shared Memory yes no API DirectX 12_1, OpenGL 4.4 DirectX 12_1, OpenGL 4.6 technology 14 nm 12 nm Features QuickSync DLSS, Raytraycing, VR Ready, G-SYNC, Vulkan, Multi Monitor Date of Announcement 01.09.2015 06.01.2019 Memory Speed 11000 MHz Max. Amount of Memory 6 GB Power Consumption 65 Watt Notebook Size large
Benchmarks Performance Rating - 3DMark 11 + Fire Strike + Time Spy - HD Graphics 515
0.3 pt (1%)
...
...
max:
Performance Rating - 3DMark 11 + Fire Strike + Time Spy - GeForce RTX 2060 Max-Q
6.8 pt (20%)
...
NVIDIA GeForce RTX 2060 Max-Q
...
max:
3DMark - 3DMark Time Spy Score
min: 5390 avg: 5813 median: 5844.5 (17%) max: 6171 Points
GPU TDP ? TDP 65 W 100% 91%
3DMark - 3DMark Time Spy Graphics
min: 5357 avg: 5637 median: 5638.5 (15%) max: 5914 Points
GPU TDP ? TDP 65 W 100% 95%
3DMark - 3DMark Ice Storm Unlimited Graphics
min: 43449 avg: 58940 median: 56787 (6%) max: 78808 Points
308872 Points (35%)
3DMark - 3DMark Ice Storm Extreme Graphics
min: 18749 avg: 24669 median: 23314 (3%) max: 33413 Points
95079 Points (12%)
3DMark - 3DMark Cloud Gate Score
min: 2705 avg: 3940 median: 3850.5 (4%) max: 5257 Points
min: 25407 avg: 31253 median: 30659.5 (33%) max: 38287 Points
GPU TDP ? TDP 65 W 23% 100%
3DMark - 3DMark Cloud Gate Graphics
min: 3982 avg: 5440 median: 5467 (1%) max: 7035 Points
min: 38074 avg: 58101 median: 58890 (15%) max: 76551 Points
GPU TDP ? TDP 65 W 13% 100%
3DMark - 3DMark Fire Strike Standard Score
min: 453 avg: 617 median: 623.5 (1%) max: 780 Points
min: 12716 avg: 13699 median: 13716 (24%) max: 14649 Points
GPU TDP ? TDP 65 W 18% 100%
3DMark - 3DMark Fire Strike Standard Graphics
min: 494 avg: 679 median: 691.5 (1%) max: 892 Points
min: 14129 avg: 14900 median: 14909.5 (17%) max: 15650 Points
GPU TDP ? TDP 65 W 17% 100%
3DMark - 3DMark Ice Storm Graphics
min: 31627 avg: 44439 median: 45108 (5%) max: 54558 Points
95273 Points (11%)
3DMark 11 - 3DM11 Performance Score
min: 785 avg: 1105 median: 1115 (2%) max: 1360 Points
min: 16516 avg: 17896 median: 18065 (25%) max: 18937 Points
GPU TDP ? TDP 65 W 16% 100%
3DMark 11 - 3DM11 Performance GPU
min: 714 avg: 1013 median: 1014 (1%) max: 1254 Points
min: 18863 avg: 19881 median: 19778.5 (17%) max: 21105 Points
GPU TDP ? TDP 65 W 15% 100%
3DMark Vantage + Intel HD Graphics 515 3DMark Vantage - 3DM Vant. Perf. total
4672 Points (1%)
3DM Vant. Perf. total + NVIDIA GeForce RTX 2060 Max-Q
50957 Points (15%)
3DM Vant. Perf. GPU no PhysX + Intel HD Graphics 515 3DMark Vantage - 3DM Vant. Perf. GPU no PhysX
4218 Points (2%)
3DM Vant. Perf. GPU no PhysX + NVIDIA GeForce RTX 2060 Max-Q
49207 Points (28%)
3DMark 2001SE - 3DMark 2001 - Standard
20345 Points (21%)
3DMark 03 - 3DMark 03 - Standard
18019 Points (9%)
3DMark 05 - 3DMark 05 - Standard
9173 Points (10%)
3DMark 06 3DMark 06 - Standard 1280x1024 + Intel HD Graphics 515
min: 4968 avg: 6621 median: 6446 (8%) max: 7912 Points
3DMark 06 - Standard 1280x1024 + NVIDIA GeForce RTX 2060 Max-Q
37332 Points (49%)
Unigine Heaven 2.1 - Heaven 2.1 high
min: 15.7 avg: 16.9 median: 16.9 (3%) max: 18 fps
SPECviewperf 12 + Intel HD Graphics 515 SPECviewperf 12 - specvp12 sw-03
17.6 fps (4%)
specvp12 snx-02 + Intel HD Graphics 515 SPECviewperf 12 - specvp12 snx-02
2.1 fps (0%)
specvp12 showcase-01 + Intel HD Graphics 515 SPECviewperf 12 - specvp12 showcase-01
5 fps (1%)
specvp12 mediacal-01 + Intel HD Graphics 515 SPECviewperf 12 - specvp12 mediacal-01
1.8 fps (0%)
specvp12 maya-04 + Intel HD Graphics 515 SPECviewperf 12 - specvp12 maya-04
9 fps (2%)
specvp12 energy-01 + Intel HD Graphics 515 SPECviewperf 12 - specvp12 energy-01
0.1 fps (0%)
specvp12 creo-01 + Intel HD Graphics 515 SPECviewperf 12 - specvp12 creo-01
7.9 fps (3%)
specvp12 catia-04 + Intel HD Graphics 515 SPECviewperf 12 - specvp12 catia-04
9.8 fps (2%)
Cinebench R10 Cinebench R10 Shading (32bit) + Intel HD Graphics 515 Cinebench R10 - Cinebench R10 Shading (32bit)
min: 4740 avg: 6063 median: 6088 (4%) max: 7263 Points
Cinebench R10 Shading (32bit) + NVIDIA GeForce RTX 2060 Max-Q
11800 Points (8%)
Cinebench R11.5 Cinebench R11.5 OpenGL 64 Bit + Intel HD Graphics 515 Cinebench R11.5 - Cinebench R11.5 OpenGL 64 Bit
min: 16.86 avg: 23.6 median: 23.1 (8%) max: 31.86 fps
Cinebench R11.5 OpenGL 64 Bit + NVIDIA GeForce RTX 2060 Max-Q
76.3 fps (26%)
Cinebench R15 + Intel HD Graphics 515 Cinebench R15 - Cinebench R15 OpenGL 64 Bit
min: 18.93 avg: 28.6 median: 29.4 (2%) max: 35.98 fps
Cinebench R15 OpenGL 64 Bit + NVIDIA GeForce RTX 2060 Max-Q
min: 104.1 avg: 132.3 median: 137 (8%) max: 151 fps
GPU TDP ? TDP 65 W 25% 100%
Cinebench R15 OpenGL Ref. Match 64 Bit + Intel HD Graphics 515 Cinebench R15 - Cinebench R15 OpenGL Ref. Match 64 Bit
min: 97.7 avg: 98 median: 97.8 (98%) max: 99.3 %
Cinebench R15 OpenGL Ref. Match 64 Bit + NVIDIA GeForce RTX 2060 Max-Q
99.6 % (100%)
GPU TDP ? TDP 65 W 98% 100%
GFXBench - GFXBench Car Chase Offscreen
20.9 fps (2%)
273 fps (31%)
GFXBench 3.1 - GFXBench Manhattan ES 3.1 Offscreen
min: 25.5 avg: 27.7 median: 27.7 (1%) max: 29.9 fps
411.3 fps (9%)
GFXBench 3.0 - GFXBench 3.0 Manhattan Offscreen
min: 31.9 avg: 36.5 median: 36.7 (2%) max: 43.6 fps
497.9 fps (29%)
GFXBench (DX / GLBenchmark) 2.7 + Intel HD Graphics 515 GFXBench (DX / GLBenchmark) 2.7 - GFXBench T-Rex HD Offscreen C24Z16
min: 70 avg: 75.4 median: 73.2 (1%) max: 87 fps
GFXBench T-Rex HD Offscreen C24Z16 + NVIDIA GeForce RTX 2060 Max-Q
1123 fps (9%)
LuxMark v2.0 64Bit - LuxMark v2.0 Room GPU
min: 173 avg: 183 median: 183 (1%) max: 193 Samples/s
2664 Samples/s (12%)
LuxMark v2.0 64Bit - LuxMark v2.0 Sala GPU
min: 395 avg: 413.5 median: 416 (1%) max: 427 Samples/s
5786 Samples/s (10%)
ComputeMark v2.1 - ComputeMark v2.1 Result
min: 476 avg: 660 median: 704 (1%) max: 741 Points
Power Consumption - Furmark Stress Test Power Consumption - external Monitor *
min: 96.6 avg: 116.3 median: 116.3 (17%) max: 136 Watt
Power Consumption - The Witcher 3 Power Consumption - external Monitor *
min: 107.5 avg: 120.8 median: 120.8 (17%) max: 134 Watt
Power Consumption - Witcher 3 Power Consumption *
min: 99.2 avg: 110.6 median: 108.9 (24%) max: 125.5 Watt
GPU TDP ? TDP 65 W 100% 102%
Power Consumption - Witcher 3 ultra Power Efficiency
min: 0.4858 avg: 0.5 median: 0.5 (46%) max: 0.566 fps per Watt
GPU TDP ? TDP 65 W 100% 92%
Power Consumption - Witcher 3 ultra Power Efficiency - external Monitor
min: 0.4694 avg: 0.5 median: 0.5 (42%) max: 0.543 fps per Watt
Emissions Witcher 3 Fan Noise + NVIDIA GeForce RTX 2060 Max-Q Emissions - Witcher 3 Fan Noise
min: 41.3 avg: 49.4 median: 51.3 (82%) max: 53.7 dB(A)
GPU TDP ? TDP 65 W 100% 79%
Clock Speed - GPU Clock Witcher 3 ultra
1418 MHz (56%)
Clock Speed - GPU Clock Speed Furmark
1171 MHz (46%)
Average Benchmarks Intel HD Graphics 515 → 100% n=22 Average Benchmarks NVIDIA GeForce RTX 2060 Max-Q → 1065% n=22
- Range of benchmark values for this graphics card
- Average benchmark values for this graphics card
* Smaller numbers mean a higher performance
1 This benchmark is not used for the average calculation
Game Benchmarks The following benchmarks stem from our benchmarks of review laptops. The performance depends on the used graphics memory, clock rate, processor, system settings, drivers, and operating systems. So the results don't have to be representative for all laptops with this GPU. For detailed information on the benchmark results, click on the fps number.
GeForce RTX 2060 Max-Q:
257.9 fps
GeForce RTX 2060 Max-Q:
120.4 fps
GeForce RTX 2060 Max-Q:
76.4 fps
GeForce RTX 2060 Max-Q:
56.9 fps
GeForce RTX 2060 Max-Q:
18.9 fps
GeForce RTX 2060 Max-Q:
176.1 fps
GeForce RTX 2060 Max-Q:
108.7 fps
GeForce RTX 2060 Max-Q:
95.7 fps
GeForce RTX 2060 Max-Q:
93.3 fps
GeForce RTX 2060 Max-Q:
194.2 fps
GeForce RTX 2060 Max-Q:
96.3 fps
GeForce RTX 2060 Max-Q:
75.7 fps
GeForce RTX 2060 Max-Q:
78.5 fps
GeForce RTX 2060 Max-Q:
68.5 fps
GeForce RTX 2060 Max-Q:
68.2 fps
GeForce RTX 2060 Max-Q:
85.3 fps
GeForce RTX 2060 Max-Q:
92.9 fps
GeForce RTX 2060 Max-Q:
88 fps
GeForce RTX 2060 Max-Q:
77.8 fps
GeForce RTX 2060 Max-Q:
103.2 fps
GeForce RTX 2060 Max-Q:
88.7 fps
GeForce RTX 2060 Max-Q:
82.2 fps
GeForce RTX 2060 Max-Q:
79 fps
GeForce RTX 2060 Max-Q:
157.4 fps
GeForce RTX 2060 Max-Q:
109.4 fps
GeForce RTX 2060 Max-Q:
103.4 fps
GeForce RTX 2060 Max-Q:
73.5 fps
GeForce RTX 2060 Max-Q:
33.1 fps
GeForce RTX 2060 Max-Q:
123 fps
GeForce RTX 2060 Max-Q:
82 fps
GeForce RTX 2060 Max-Q:
75 fps
GeForce RTX 2060 Max-Q:
55 fps
GeForce RTX 2060 Max-Q:
117 fps
GeForce RTX 2060 Max-Q:
89.5 fps
GeForce RTX 2060 Max-Q:
61.9 fps
GeForce RTX 2060 Max-Q:
48.3 fps
GeForce RTX 2060 Max-Q:
183.7 fps
GeForce RTX 2060 Max-Q:
67.1 fps
GeForce RTX 2060 Max-Q:
50.4 fps
GeForce RTX 2060 Max-Q:
196 fps
GeForce RTX 2060 Max-Q:
137 fps
GeForce RTX 2060 Max-Q:
116 fps
GeForce RTX 2060 Max-Q:
101 fps
GeForce RTX 2060 Max-Q:
201.1 fps
GeForce RTX 2060 Max-Q:
103.3 fps
GeForce RTX 2060 Max-Q:
69.2 fps
GeForce RTX 2060 Max-Q:
50.7 fps
GeForce RTX 2060 Max-Q:
81.5 fps
GeForce RTX 2060 Max-Q:
81.6 fps
GeForce RTX 2060 Max-Q:
61.4 fps
GeForce RTX 2060 Max-Q:
36.5 fps
GeForce RTX 2060 Max-Q:
154 fps
GeForce RTX 2060 Max-Q:
92 fps
GeForce RTX 2060 Max-Q:
74 fps
GeForce RTX 2060 Max-Q:
56 fps
GeForce RTX 2060 Max-Q:
276.7 fps
GeForce RTX 2060 Max-Q:
125.3 fps
GeForce RTX 2060 Max-Q:
105.3 fps
GeForce RTX 2060 Max-Q:
60.5 fps
GeForce RTX 2060 Max-Q:
24.4 fps
GeForce RTX 2060 Max-Q:
105 fps
GeForce RTX 2060 Max-Q:
75 fps
GeForce RTX 2060 Max-Q:
70 fps
GeForce RTX 2060 Max-Q:
63 fps
GeForce RTX 2060 Max-Q:
129.6 fps
GeForce RTX 2060 Max-Q:
72.7 fps
GeForce RTX 2060 Max-Q:
55.2 fps
GeForce RTX 2060 Max-Q:
43.8 fps
GeForce RTX 2060 Max-Q:
143.6 fps
GeForce RTX 2060 Max-Q:
142.8 fps
GeForce RTX 2060 Max-Q:
126.2 fps
GeForce RTX 2060 Max-Q:
116.6 fps
GeForce RTX 2060 Max-Q:
97 fps
GeForce RTX 2060 Max-Q:
79 fps
GeForce RTX 2060 Max-Q:
65 fps
GeForce RTX 2060 Max-Q:
45 fps
100%
HD Graphics 515:
21 (!) [X] Cube i9 Intel Core m3-6Y30 0.9GHz
HD Graphics 515
max:
30 fps
fps
GeForce RTX 2060 Max-Q:
118 118 ~ 118 fps
GeForce RTX 2060 Max-Q:
84 90 ~ 87 fps
GeForce RTX 2060 Max-Q:
75 84 ~ 80 fps
GeForce RTX 2060 Max-Q:
65 74 ~ 70 fps
GeForce RTX 2060 Max-Q:
20 fps
GeForce RTX 2060 Max-Q:
276 [X] MSI Stealth 15M A11SEK 1.47.22.14 D3D12
Intel Core i7-1185G7 3GHz
GeForce RTX 2060 Max-Q
min:
67.5 fps, P1:
216 fps, max:
474 fps
fps
GeForce RTX 2060 Max-Q:
130 [X] MSI Stealth 15M A11SEK 1.47.22.14 D3D12
Intel Core i7-1185G7 3GHz
GeForce RTX 2060 Max-Q
min:
45.5 fps, P1:
106 fps, max:
249 fps
fps
GeForce RTX 2060 Max-Q:
106 [X] MSI Stealth 15M A11SEK 1.47.22.14 D3D12
Intel Core i7-1185G7 3GHz
GeForce RTX 2060 Max-Q
min:
59.6 fps, P1:
80.8 fps, max:
194 fps
fps
GeForce RTX 2060 Max-Q:
93.1 [X] MSI Stealth 15M A11SEK 1.47.22.14 D3D12
Intel Core i7-1185G7 3GHz
GeForce RTX 2060 Max-Q
min:
26.4 fps, P1:
73.6 fps, max:
189 fps
fps
GeForce RTX 2060 Max-Q:
104.5 fps
GeForce RTX 2060 Max-Q:
94.2 fps
GeForce RTX 2060 Max-Q:
75.6 fps
GeForce RTX 2060 Max-Q:
63.6 fps
100%
HD Graphics 515:
14.4 [X] Cube i9 Intel Core m3-6Y30 0.9GHz
HD Graphics 515
fps
GeForce RTX 2060 Max-Q:
59.3 63.7 ~ 62 fps
GeForce RTX 2060 Max-Q:
43.6 fps
GeForce RTX 2060 Max-Q:
24.9 fps
GeForce RTX 2060 Max-Q:
124 fps
GeForce RTX 2060 Max-Q:
110.2 fps
GeForce RTX 2060 Max-Q:
107.4 fps
GeForce RTX 2060 Max-Q:
81.2 fps
GeForce RTX 2060 Max-Q:
155 fps
GeForce RTX 2060 Max-Q:
123 fps
GeForce RTX 2060 Max-Q:
97 fps
GeForce RTX 2060 Max-Q:
76 fps
100%
HD Graphics 515:
42 48 [X] Cube i9 Intel Core m3-6Y30 0.9GHz
HD Graphics 515
min:
42 fps
~ 45 fps
100%
HD Graphics 515:
30 36 [X] Cube i9 Intel Core m3-6Y30 0.9GHz
HD Graphics 515
min:
32 fps
~ 33 fps
100%
HD Graphics 515:
14 24 [X] Cube i9 Intel Core m3-6Y30 0.9GHz
HD Graphics 515
min:
20 fps
~ 19 fps
100%
HD Graphics 515:
26.6 [X] Cube i9 Intel Core m3-6Y30 0.9GHz
HD Graphics 515
min:
23 fps, max:
29 fps
fps
100%
HD Graphics 515:
28 30.1 [X] Cube i9 Intel Core m3-6Y30 0.9GHz
HD Graphics 515
min:
15 fps, max:
44 fps
~ 29 fps
851%
GeForce RTX 2060 Max-Q:
246.9 fps
100%
HD Graphics 515:
10.7 [X] Cube i9 Intel Core m3-6Y30 0.9GHz
HD Graphics 515
max:
16 fps
11 ~ 11 fps
2270%
GeForce RTX 2060 Max-Q:
249.7 fps
GeForce RTX 2060 Max-Q:
219.3 fps
100%
HD Graphics 515:
9.4 [X] Medion Akoya P3401T 2in1 Intel Core m5-6Y54 1.1GHz
HD Graphics 515
fps
100%
HD Graphics 515:
4.3 [X] Medion Akoya P3401T 2in1 Intel Core m5-6Y54 1.1GHz
HD Graphics 515
fps
100%
HD Graphics 515:
17.2 [X] Medion Akoya P3401T 2in1 Intel Core m5-6Y54 1.1GHz
HD Graphics 515
fps
100%
HD Graphics 515:
6.6 [X] Medion Akoya P3401T 2in1 Intel Core m5-6Y54 1.1GHz
HD Graphics 515
fps
100%
HD Graphics 515:
22.3 [X] Medion Akoya P3401T 2in1 Intel Core m5-6Y54 1.1GHz
HD Graphics 515
fps
100%
HD Graphics 515:
10.3 [X] Medion Akoya P3401T 2in1 Intel Core m5-6Y54 1.1GHz
HD Graphics 515
fps
100%
HD Graphics 515:
48 [X] Cube i9 Intel Core m3-6Y30 0.9GHz
HD Graphics 515
min:
42 fps, max:
60 fps
fps
100%
HD Graphics 515:
24.1 [X] Cube i9 Intel Core m3-6Y30 0.9GHz
HD Graphics 515
min:
19 fps, max:
30 fps
fps
100%
HD Graphics 515:
10.1 [X] Cube i9 Intel Core m3-6Y30 0.9GHz
HD Graphics 515
min:
8 fps, max:
14 fps
fps
100%
HD Graphics 515:
21.5 [X] Medion Akoya P3401T 2in1 Intel Core m5-6Y54 1.1GHz
HD Graphics 515
fps
100%
HD Graphics 515:
10.3 [X] Medion Akoya P3401T 2in1 Intel Core m5-6Y54 1.1GHz
HD Graphics 515
fps
100%
HD Graphics 515:
10.7 [X] Medion Akoya P3401T 2in1 Intel Core m5-6Y54 1.1GHz
HD Graphics 515
fps
100%
HD Graphics 515:
7.8 [X] Medion Akoya P3401T 2in1 Intel Core m5-6Y54 1.1GHz
HD Graphics 515
fps
100%
HD Graphics 515:
11.4 [X] Cube i9 Intel Core m3-6Y30 0.9GHz
HD Graphics 515
min:
5 fps, max:
15 fps
fps
100%
HD Graphics 515:
13.8 21.7 [X] Cube i9 Intel Core m3-6Y30 0.9GHz
HD Graphics 515
min:
14 fps, max:
30 fps
~ 18 fps
1666%
GeForce RTX 2060 Max-Q:
299.9 fps
100%
HD Graphics 515:
8.4 fps
3568%
GeForce RTX 2060 Max-Q:
299.7 fps
GeForce RTX 2060 Max-Q:
229.7 fps
GeForce RTX 2060 Max-Q:
146.9 fps
GeForce RTX 2060 Max-Q:
125 fps
GeForce RTX 2060 Max-Q:
125 fps
GeForce RTX 2060 Max-Q:
118.2 fps
GeForce RTX 2060 Max-Q:
111.5 fps
GeForce RTX 2060 Max-Q:
100.4 fps
GeForce RTX 2060 Max-Q:
72.8 fps
GeForce RTX 2060 Max-Q:
66.8 fps
100%
HD Graphics 515:
6.1 8.4 ~ 7 fps
100%
HD Graphics 515:
5.9 fps
100%
HD Graphics 515:
10.1 fps
100%
HD Graphics 515:
9.2 fps
100%
HD Graphics 515:
12 fps
100%
HD Graphics 515:
8.4 fps
100%
HD Graphics 515:
11 fps
100%
HD Graphics 515:
5 fps
100%
HD Graphics 515:
11.2 fps
100%
HD Graphics 515:
4.9 fps
100%
HD Graphics 515:
25.7 fps
100%
HD Graphics 515:
15.2 fps
100%
HD Graphics 515:
13.1 fps
100%
HD Graphics 515:
8.7 fps
100%
HD Graphics 515:
18.7 fps
100%
HD Graphics 515:
10.4 fps
100%
HD Graphics 515:
12.4 fps
100%
HD Graphics 515:
8.1 fps
100%
HD Graphics 515:
15.5 fps
100%
HD Graphics 515:
9.3 fps
100%
HD Graphics 515:
42 (!) fps
100%
HD Graphics 515:
32 [X] Cube i9 Intel Core m3-6Y30 0.9GHz
HD Graphics 515
min:
13 fps, max:
48 fps
32.1 42.8 ~ 36 fps
100%
HD Graphics 515:
23.6 [X] Cube i9 Intel Core m3-6Y30 0.9GHz
HD Graphics 515
min:
10 fps, max:
42 fps
26.3 30.2 ~ 27 fps
100%
HD Graphics 515:
7.4 11.7 ~ 10 fps
100%
HD Graphics 515:
25.7 fps
233%
GeForce RTX 2060 Max-Q:
60 fps
100%
HD Graphics 515:
15.3 fps
392%
GeForce RTX 2060 Max-Q:
60 fps
GeForce RTX 2060 Max-Q:
60 fps
GeForce RTX 2060 Max-Q:
59.2 fps
100%
HD Graphics 515:
48 [X] Cube i9 Intel Core m3-6Y30 0.9GHz
HD Graphics 515
min:
42.2 fps
fps
100%
HD Graphics 515:
25.4 [X] Cube i9 Intel Core m3-6Y30 0.9GHz
HD Graphics 515
min:
21.5 fps
30 [X] Cube i9 Intel Core m3-6Y30 0.9GHz
HD Graphics 515
~ 28 fps
100%
HD Graphics 515:
9.4 [X] Cube i9 Intel Core m3-6Y30 0.9GHz
HD Graphics 515
min:
8.7 fps
fps
100%
HD Graphics 515:
8.1 [X] Cube i9 Intel Core m3-6Y30 0.9GHz
HD Graphics 515
min:
7.1 fps
fps
GeForce RTX 2060 Max-Q:
75.5 83.2 ~ 79 fps
100%
HD Graphics 515:
7.1 fps
GeForce RTX 2060 Max-Q:
24.9 45.5 ~ 35 fps
100%
HD Graphics 515:
57 [X] Dell Latitude 12 E7275 Intel Core m7-6Y75 1.2GHz
HD Graphics 515
57.8 65.7 67.2 ~ 62 fps
100%
HD Graphics 515:
13.9 [X] Dell Latitude 12 E7275 Intel Core m7-6Y75 1.2GHz
HD Graphics 515
14.4 15.8 16 ~ 15 fps
100%
HD Graphics 515:
12.5 fps
GeForce RTX 2060 Max-Q:
173 fps
GeForce RTX 2060 Max-Q:
164 fps
GeForce RTX 2060 Max-Q:
119 fps
GeForce RTX 2060 Max-Q:
68.2 fps
100%
HD Graphics 515:
6.8 8.3 ~ 8 fps
100%
HD Graphics 515:
4.1 fps
100%
HD Graphics 515:
13.5 fps
100%
HD Graphics 515:
9.3 fps
100%
HD Graphics 515:
41 41 ~ 41 fps
100%
HD Graphics 515:
27 28 ~ 28 fps
100%
HD Graphics 515:
15 17 ~ 16 fps
100%
HD Graphics 515:
12.5 fps
100%
HD Graphics 515:
38.3 fps
100%
HD Graphics 515:
29.6 fps
100%
HD Graphics 515:
15.1 fps
100%
HD Graphics 515:
161.1 fps
100%
HD Graphics 515:
39.2 fps
100%
HD Graphics 515:
17.1 fps
100%
HD Graphics 515:
10.4 fps
100%
HD Graphics 515:
86.5 fps
100%
HD Graphics 515:
26.3 fps
100%
HD Graphics 515:
14.9 fps
100%
HD Graphics 515:
12.5 fps
100%
HD Graphics 515:
6.7 10.1 ~ 8 fps
100%
HD Graphics 515:
7.5 fps
100%
HD Graphics 515:
9 fps
752%
GeForce RTX 2060 Max-Q:
278.3 fps
1262%
GeForce RTX 2060 Max-Q:
252.3 fps
1350%
GeForce RTX 2060 Max-Q:
229.5 fps
100%
HD Graphics 515:
3.8 4 4.3 4.4 4.6 [X] Dell Latitude 12 E7275 Intel Core m7-6Y75 1.2GHz
HD Graphics 515
4.7 4.7 4.9 5.1 5.3 5.9 6 6.5 [X] Panasonic Toughbook CF-20 Intel Core m5-6Y57 1.1GHz
HD Graphics 515
6.7 [X] Medion Akoya P3401T 2in1 Intel Core m5-6Y54 1.1GHz
HD Graphics 515
~ 5 fps
2524%
GeForce RTX 2060 Max-Q:
126.2 fps
100%
HD Graphics 515:
80.8 fps
100%
HD Graphics 515:
24.9 fps
100%
HD Graphics 515:
14.6 fps
100%
HD Graphics 515:
20.2 fps
100%
HD Graphics 515:
12.9 fps
100%
HD Graphics 515:
8.3 fps
GeForce RTX 2060 Max-Q:
130.3 fps
GeForce RTX 2060 Max-Q:
67.3 fps
GeForce RTX 2060 Max-Q:
67.4 fps
100%
HD Graphics 515:
76.7 fps
100%
HD Graphics 515:
57.3 fps
100%
HD Graphics 515:
35.1 fps
100%
HD Graphics 515:
20.2 fps
100%
HD Graphics 515:
61.9 fps
100%
HD Graphics 515:
41.8 fps
100%
HD Graphics 515:
35.1 fps
100%
HD Graphics 515:
20.5 fps
100%
HD Graphics 515:
9.6 fps
100%
HD Graphics 515:
31.1 fps
100%
HD Graphics 515:
18.7 fps
100%
HD Graphics 515:
11.6 fps
100%
HD Graphics 515:
7.1 fps
100%
HD Graphics 515:
50 fps
100%
HD Graphics 515:
27.2 fps
100%
HD Graphics 515:
11.2 fps
Average Gaming Intel HD Graphics 515 → 100% Average Gaming 30-70 fps → 100%
Average Gaming NVIDIA GeForce RTX 2060 Max-Q → 1437% Average Gaming 30-70 fps → 313%
 Deutsch
 English
 Español
 Français
 Italiano
 Nederlands
 Polski
 Português
 Русский
 Türkçe
 Svenska
 Chinese
 Magyar