Intel HD Graphics 400 (Braswell) vs 4x NVIDIA RTX A6000
Intel HD Graphics 400 (Braswell) ► remove from comparison
The Intel HD Graphics 400 (Braswell) is an integrated graphics card in the low end SoCs of the Braswell series (2016 Celeron models). It is based on the same architecture as the integrated GPU of the Broadwell graphics cards (e.g. HD Graphics 5300 ), but offers less shader cores and slower clock speeds.
It is a rename from the Intel HD Graphics (Braswell) card that included the faster 16 EU model in the Pentium SoCs. See the Intel HD Graphics Braswell graphics card page for benchmarks .
The performance depends on the processor (different boost speed for the GPU) and the used memory.
Gaming performance ist still only suited for older or less demanding games. Often also the processor is limited gaming performance (e.g. in the dual-core N3000).
The SoC also integrates a video decoding engine that should be able to handle 4K H.265 videos.
4x NVIDIA RTX A6000 ► remove from comparison
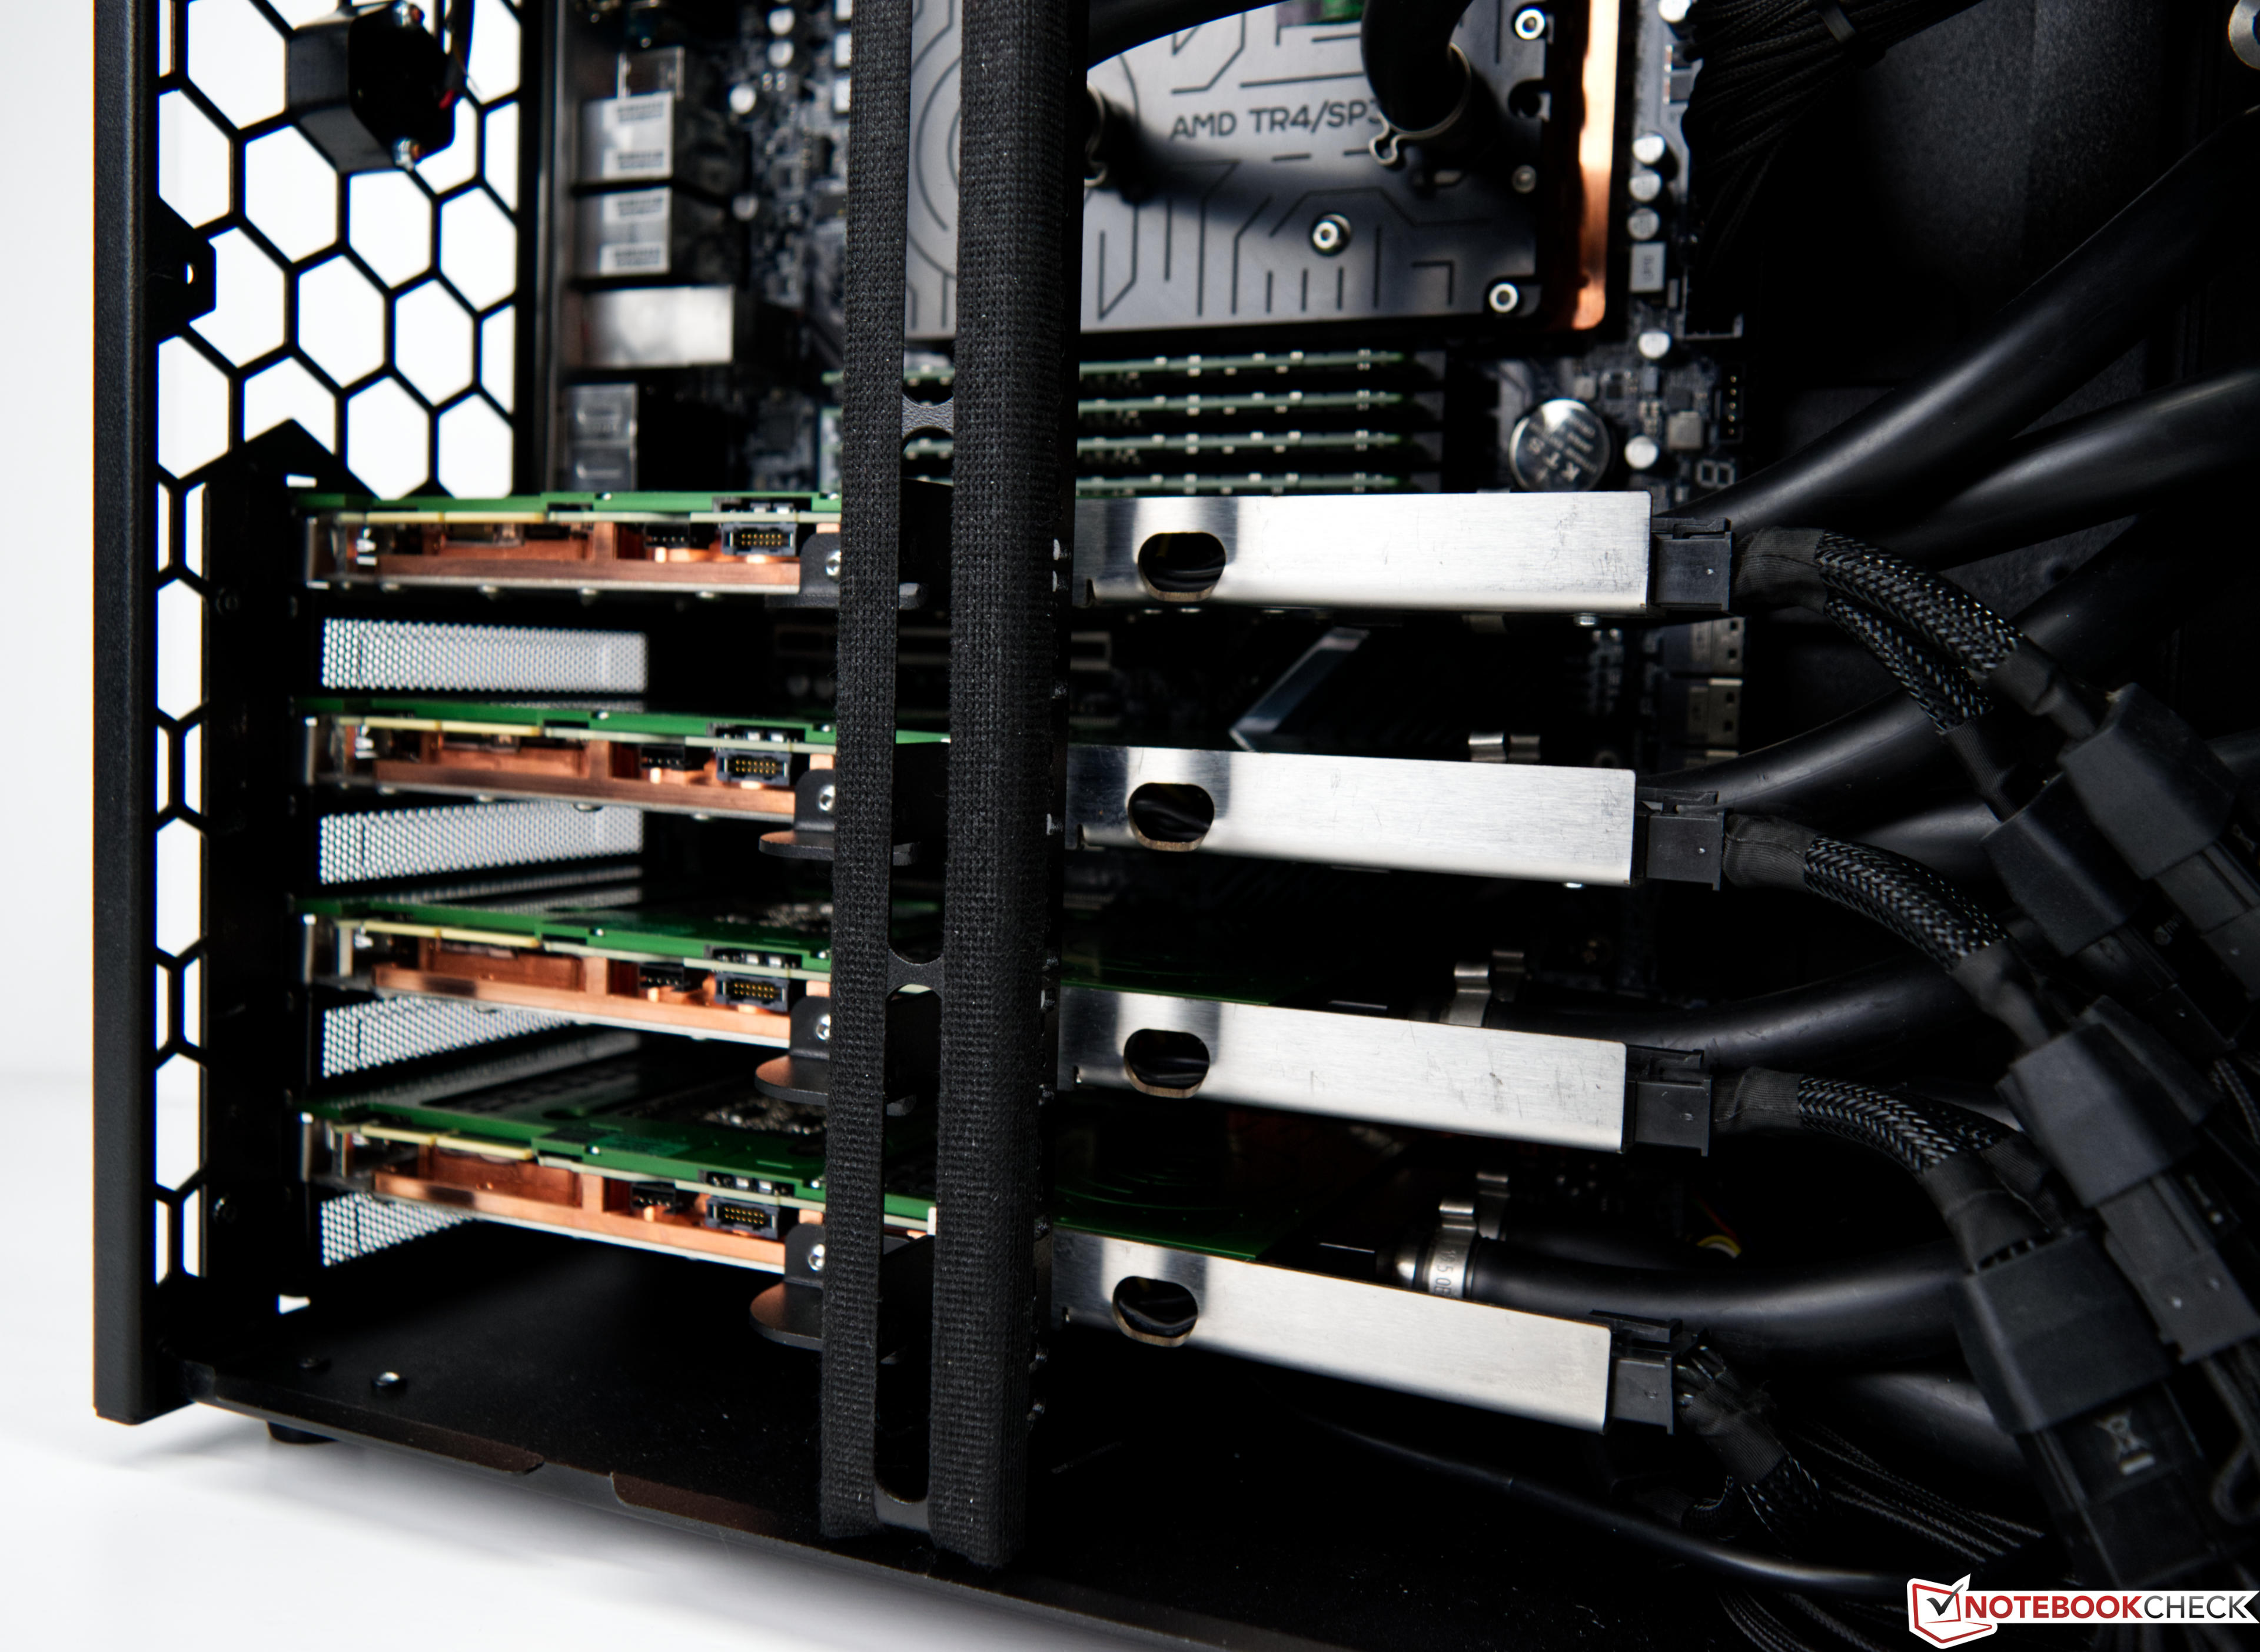
The 4x Nvidia RTX A6000 (Quad NV-Link) is a graphics solution consisting out of four professional RTX A6000 graphics cards connected via NV-Link. Each card uses the GA102 chip and offers 10.752 CUDA cores and 48 GB GDDR6 memory. Only a selected number of professional apps can make use of all four graphics cards, otherwise only one card is used (e.g. in games).
Intel HD Graphics 400 (Braswell) 4x NVIDIA RTX A6000 RTX A6000 Series NVIDIA RTX A6000 (Quad NV-Link) 10752 @ 1.41 - 1.8 GHz 384 Bit @ 16000 MHz NVIDIA RTX A6000 10752 @ 1.41 - 1.8 GHz 384 Bit @ 16000 MHz
Codename Braswell Ampere Architecture Gen. 8 Ampere Pipelines 12 - unified 10752 - unified Core Speed 320 - 640 (Boost) MHz 1410 - 1800 (Boost) MHz Memory Bus Width 64/128 Bit 384 Bit Shared Memory yes no API DirectX 11.2, Shader 5.0 DirectX 12_2, Shader 6.6, OpenGL 4.6 technology 14 nm 8 nm Date of Announcement 01.04.2016 05.10.2020 Memory Speed 16000 MHz Memory Type GDDR6 Max. Amount of Memory 48 GB Power Consumption 300 Watt Transistors 28.3 Billion
CPU in HD Graphics 400 (Braswell) GPU Base Speed GPU Boost / Turbo Intel Atom x5-Z8550 4 x 1440 MHz 200 MHz 600 MHz Intel Celeron N3060 2 x 1600 MHz, 6 W 320 MHz 700 MHz min. - max. 200 - 320 MHz 600 - 700 MHz
Benchmarks Performance Rating - 3DMark 11 + Fire Strike + Time Spy - HD Graphics 400 (Braswell)
0.1 pt (0%)
Intel HD Graphics 400 (Braswell)
...
max:
Performance Rating - 3DMark 11 + Fire Strike + Time Spy - NVIDIA RTX A6000 (Quad NV-Link)
12.7 pt (38%)
...
max:
3DMark - 3DMark Time Spy Score
min: 10303 avg: 11122 median: 11122 (32%) max: 11941 Points
3DMark - 3DMark Time Spy Graphics
10167 Points (27%)
3DMark - 3DMark Ice Storm Unlimited Graphics
min: 17968 avg: 20459 median: 20277 (2%) max: 23161 Points
440592 Points (50%)
GPU TDP ? TDP 300 W 5% 100%
3DMark - 3DMark Ice Storm Extreme Graphics
14334 Points (2%)
404406 Points (52%)
GPU TDP ? TDP 300 W 4% 100%
3DMark - 3DMark Cloud Gate Score
min: 1350 avg: 1553 median: 1457 (2%) max: 2087 Points
41996 Points (45%)
GPU TDP ? TDP 300 W 4% 100%
3DMark - 3DMark Cloud Gate Graphics
min: 1519 avg: 1865 median: 1841 (0%) max: 2455 Points
92363 Points (24%)
GPU TDP ? TDP 300 W 2% 100%
3DMark - 3DMark Fire Strike Standard Score
min: 176 avg: 188 median: 188 (0%) max: 200 Points
24576 Points (43%)
GPU TDP ? TDP 300 W 1% 100%
3DMark - 3DMark Fire Strike Standard Graphics
min: 202 avg: 218 median: 218 (0%) max: 234 Points
27937 Points (32%)
GPU TDP ? TDP 300 W 1% 100%
3DMark - 3DMark Ice Storm Graphics
min: 13689 avg: 18517 median: 18516.5 (2%) max: 23344 Points
407114 Points (49%)
GPU TDP ? TDP 300 W 5% 100%
3DMark - 3DMark Sling Shot (ES 3.0) Unlimited
min: 1502 avg: 1926 median: 1925.5 (8%) max: 2349 Points
3DMark - 3DMark Sling Shot (ES 3.0) Unlimited Graphics
min: 1452 avg: 2046 median: 2046 (4%) max: 2640 Points
3DMark - 3DMark Sling Shot Extreme (ES 3.1) Unlimited
1180 Points (6%)
3DMark - 3DMark Sling Shot Extreme (ES 3.1) Unlimited Graphics
977 Points (3%)
3DMark - 3DMark Night Raid
min: 43353 avg: 49697 median: 49696.5 (47%) max: 56040 Points
3DMark - 3DMark Night Raid Graphics Score
min: 72784 avg: 102103 median: 102102 (39%) max: 131421 Points
3DMark 11 - 3DM11 Performance Score
min: 289 avg: 386.1 median: 397 (1%) max: 478 Points
29277 Points (41%)
GPU TDP ? TDP 300 W 1% 100%
3DMark 11 - 3DM11 Performance GPU
min: 247 avg: 341.1 median: 349 (0%) max: 418 Points
38132 Points (33%)
GPU TDP ? TDP 300 W 1% 100%
3DMark Vantage + 4x NVIDIA RTX A6000 3DMark Vantage - 3DM Vant. Perf. total
78808 Points (23%)
3DM Vant. Perf. GPU no PhysX + 4x NVIDIA RTX A6000 3DMark Vantage - 3DM Vant. Perf. GPU no PhysX
83834 Points (48%)
3DMark 05 - 3DMark 05 - Standard
35288 Points (39%)
3DMark 06 3DMark 06 - Standard 1280x1024 + Intel HD Graphics 400 (Braswell)
2474 Points (3%)
3DMark 06 - Standard 1280x1024 + 4x NVIDIA RTX A6000
38668 Points (51%)
GPU TDP ? TDP 300 W 6% 100%
Unigine Valley 1.0 - Unigine Valley 1.0 DX
134.7 fps (44%)
SPECviewperf 12 + 4x NVIDIA RTX A6000 SPECviewperf 12 - specvp12 sw-03
208 fps (52%)
specvp12 snx-02 + 4x NVIDIA RTX A6000 SPECviewperf 12 - specvp12 snx-02
333 fps (49%)
specvp12 showcase-01 + 4x NVIDIA RTX A6000 SPECviewperf 12 - specvp12 showcase-01
237 fps (52%)
specvp12 mediacal-01 + 4x NVIDIA RTX A6000 SPECviewperf 12 - specvp12 mediacal-01
156 fps (40%)
specvp12 maya-04 + 4x NVIDIA RTX A6000 SPECviewperf 12 - specvp12 maya-04
147 fps (40%)
specvp12 energy-01 + 4x NVIDIA RTX A6000 SPECviewperf 12 - specvp12 energy-01
39.3 fps (35%)
specvp12 creo-01 + 4x NVIDIA RTX A6000 SPECviewperf 12 - specvp12 creo-01
127 fps (51%)
specvp12 catia-04 + 4x NVIDIA RTX A6000 SPECviewperf 12 - specvp12 catia-04
208 fps (34%)
specvp12 3dsmax-05 + 4x NVIDIA RTX A6000 SPECviewperf 12 - specvp12 3dsmax-05
245 fps (43%)
SPECviewperf 13 specvp13 sw-04 + 4x NVIDIA RTX A6000 SPECviewperf 13 - specvp13 sw-04
191 fps (51%)
specvp13 snx-03 + 4x NVIDIA RTX A6000 SPECviewperf 13 - specvp13 snx-03
604 fps (67%)
specvp13 showcase-02 + 4x NVIDIA RTX A6000 SPECviewperf 13 - specvp13 showcase-02
239 fps (52%)
specvp13 medical-02 + 4x NVIDIA RTX A6000 SPECviewperf 13 - specvp13 medical-02
180 fps (38%)
specvp13 maya-05 + 4x NVIDIA RTX A6000 SPECviewperf 13 - specvp13 maya-05
405 fps (46%)
specvp13 energy-02 + 4x NVIDIA RTX A6000 SPECviewperf 13 - specvp13 energy-02
128 fps (41%)
specvp13 creo-02 + 4x NVIDIA RTX A6000 SPECviewperf 13 - specvp13 creo-02
292 fps (43%)
specvp13 catia-05 + 4x NVIDIA RTX A6000 SPECviewperf 13 - specvp13 catia-05
359 fps (40%)
specvp13 3dsmax-06 + 4x NVIDIA RTX A6000 SPECviewperf 13 - specvp13 3dsmax-06
247 fps (43%)
SPECviewperf 2020 specvp2020 solidworks-05 4k + 4x NVIDIA RTX A6000 SPECviewperf 2020 - specvp2020 solidworks-05 4k
141 fps (42%)
specvp2020 snx-04 4k + 4x NVIDIA RTX A6000 SPECviewperf 2020 - specvp2020 snx-04 4k
367 fps (38%)
specvp2020 medical-03 4k + 4x NVIDIA RTX A6000 SPECviewperf 2020 - specvp2020 medical-03 4k
32.1 fps (31%)
specvp2020 maya-06 4k + 4x NVIDIA RTX A6000 SPECviewperf 2020 - specvp2020 maya-06 4k
262 fps (43%)
specvp2020 energy-03 4k + 4x NVIDIA RTX A6000 SPECviewperf 2020 - specvp2020 energy-03 4k
46.1 fps (10%)
specvp2020 creo-03 4k + 4x NVIDIA RTX A6000 SPECviewperf 2020 - specvp2020 creo-03 4k
75.6 fps (36%)
specvp2020 catia-06 4k + 4x NVIDIA RTX A6000 SPECviewperf 2020 - specvp2020 catia-06 4k
67.5 fps (44%)
specvp2020 3dsmax-07 4k + 4x NVIDIA RTX A6000 SPECviewperf 2020 - specvp2020 3dsmax-07 4k
95.7 fps (40%)
Cinebench R10 Cinebench R10 Shading (32bit) + Intel HD Graphics 400 (Braswell) Cinebench R10 - Cinebench R10 Shading (32bit)
min: 1627 avg: 2057 median: 2052.5 (1%) max: 2510 Points
Cinebench R10 Shading (32bit) + 4x NVIDIA RTX A6000
6831 Points (5%)
GPU TDP ? TDP 300 W 30% 100%
Cinebench R11.5 Cinebench R11.5 OpenGL 64 Bit + Intel HD Graphics 400 (Braswell) Cinebench R11.5 - Cinebench R11.5 OpenGL 64 Bit
min: 9.97 avg: 10.1 median: 10 (3%) max: 10.12 fps
Cinebench R11.5 OpenGL 64 Bit + 4x NVIDIA RTX A6000
76.2 fps (26%)
GPU TDP ? TDP 300 W 13% 100%
Cinebench R15 + Intel HD Graphics 400 (Braswell) Cinebench R15 - Cinebench R15 OpenGL 64 Bit
min: 8.48 avg: 11 median: 11.3 (1%) max: 13.98 fps
Cinebench R15 OpenGL 64 Bit + 4x NVIDIA RTX A6000
204.8 fps (12%)
GPU TDP ? TDP 300 W 5% 100%
Cinebench R15 OpenGL Ref. Match 64 Bit + Intel HD Graphics 400 (Braswell) Cinebench R15 - Cinebench R15 OpenGL Ref. Match 64 Bit
98 % (98%)
Cinebench R15 OpenGL Ref. Match 64 Bit + 4x NVIDIA RTX A6000
99.6 % (100%)
GPU TDP ? TDP 300 W 98% 100%
GFXBench - GFXBench 5.0 Aztec Ruins High Tier Offscreen
3.3 fps (1%)
GFXBench - GFXBench 5.0 Aztec Ruins Normal Tier Offscreen
9.3 fps (1%)
GFXBench 3.1 - GFXBench Manhattan ES 3.1 Offscreen
min: 7.2 avg: 10.6 median: 10.6 (0%) max: 14 fps
GFXBench 3.0 - GFXBench 3.0 Manhattan Offscreen
min: 14 avg: 16 median: 16 (1%) max: 18 fps
GFXBench (DX / GLBenchmark) 2.7 + Intel HD Graphics 400 (Braswell) GFXBench (DX / GLBenchmark) 2.7 - GFXBench T-Rex HD Offscreen C24Z16
min: 27 avg: 29 median: 29 (0%) max: 31 fps
LuxMark v2.0 64Bit - LuxMark v2.0 Room GPU
22134 Samples/s (100%)
LuxMark v2.0 64Bit - LuxMark v2.0 Sala GPU
57054 Samples/s (100%)
ComputeMark v2.1 - ComputeMark v2.1 Result
43210 Points (47%)
Power Consumption - Furmark Stress Test Power Consumption - external Monitor *
650 Watt (92%)
Power Consumption - The Witcher 3 Power Consumption - external Monitor *
716 Watt (100%)
Power Consumption - Witcher 3 ultra Power Efficiency - external Monitor
0.2 fps per Watt (20%)
Average Benchmarks Intel HD Graphics 400 (Braswell) → 100% n=14 Average Benchmarks 4x NVIDIA RTX A6000 → 4560% n=14
- Range of benchmark values for this graphics card
- Average benchmark values for this graphics card
* Smaller numbers mean a higher performance
1 This benchmark is not used for the average calculation
Game Benchmarks The following benchmarks stem from our benchmarks of review laptops. The performance depends on the used graphics memory, clock rate, processor, system settings, drivers, and operating systems. So the results don't have to be representative for all laptops with this GPU. For detailed information on the benchmark results, click on the fps number.
NVIDIA RTX A6000 (Quad NV-Link):
328 [X] 815237
AMD Ryzen Threadripper PRO 3975WX 3.5GHz
NVIDIA RTX A6000 (Quad NV-Link)
min:
255 fps, P1:
226 fps, max:
360 fps
fps
NVIDIA RTX A6000 (Quad NV-Link):
303 [X] 815237
AMD Ryzen Threadripper PRO 3975WX 3.5GHz
NVIDIA RTX A6000 (Quad NV-Link)
min:
226 fps, P1:
207 fps, max:
346 fps
fps
NVIDIA RTX A6000 (Quad NV-Link):
278 [X] 815237
AMD Ryzen Threadripper PRO 3975WX 3.5GHz
NVIDIA RTX A6000 (Quad NV-Link)
min:
200 fps, P1:
169 fps, max:
327 fps
fps
NVIDIA RTX A6000 (Quad NV-Link):
159 [X] 815237
AMD Ryzen Threadripper PRO 3975WX 3.5GHz
NVIDIA RTX A6000 (Quad NV-Link)
min:
131 fps, P1:
117 fps, max:
171 fps
fps
NVIDIA RTX A6000 (Quad NV-Link):
149 [X] 815237
AMD Ryzen Threadripper PRO 3975WX 3.5GHz
NVIDIA RTX A6000 (Quad NV-Link)
min:
111 fps, P1:
100 fps, max:
158 fps
fps
NVIDIA RTX A6000 (Quad NV-Link):
96.8 [X] 815237
AMD Ryzen Threadripper PRO 3975WX 3.5GHz
NVIDIA RTX A6000 (Quad NV-Link)
min:
80 fps, P1:
81 fps, max:
107 fps
fps
NVIDIA RTX A6000 (Quad NV-Link):
277 [X] 759689
AMD Ryzen Threadripper PRO 3975WX 3.5GHz
NVIDIA RTX A6000 (Quad NV-Link)
min:
231 fps, max:
300 fps
fps
NVIDIA RTX A6000 (Quad NV-Link):
241 [X] 759689
AMD Ryzen Threadripper PRO 3975WX 3.5GHz
NVIDIA RTX A6000 (Quad NV-Link)
min:
193 fps, max:
274 fps
fps
NVIDIA RTX A6000 (Quad NV-Link):
241 [X] 759689
AMD Ryzen Threadripper PRO 3975WX 3.5GHz
NVIDIA RTX A6000 (Quad NV-Link)
min:
202 fps, max:
267 fps
fps
NVIDIA RTX A6000 (Quad NV-Link):
221 [X] 759689
AMD Ryzen Threadripper PRO 3975WX 3.5GHz
NVIDIA RTX A6000 (Quad NV-Link)
min:
170 fps, max:
254 fps
fps
NVIDIA RTX A6000 (Quad NV-Link):
210 [X] 759689
AMD Ryzen Threadripper PRO 3975WX 3.5GHz
NVIDIA RTX A6000 (Quad NV-Link)
min:
170 fps, max:
249 fps
fps
NVIDIA RTX A6000 (Quad NV-Link):
136 [X] 759689
AMD Ryzen Threadripper PRO 3975WX 3.5GHz
NVIDIA RTX A6000 (Quad NV-Link)
min:
114 fps, max:
160 fps
fps
NVIDIA RTX A6000 (Quad NV-Link):
40 [X] AMD Ryzen Threadripper PRO 3975WX 3.5GHz
NVIDIA RTX A6000 (Quad NV-Link)
min:
23 fps, max:
65 fps
fps
NVIDIA RTX A6000 (Quad NV-Link):
40 [X] AMD Ryzen Threadripper PRO 3975WX 3.5GHz
NVIDIA RTX A6000 (Quad NV-Link)
min:
23 fps, max:
59 fps
fps
NVIDIA RTX A6000 (Quad NV-Link):
38 [X] AMD Ryzen Threadripper PRO 3975WX 3.5GHz
NVIDIA RTX A6000 (Quad NV-Link)
min:
25 fps, max:
54 fps
fps
NVIDIA RTX A6000 (Quad NV-Link):
37 [X] AMD Ryzen Threadripper PRO 3975WX 3.5GHz
NVIDIA RTX A6000 (Quad NV-Link)
min:
23 fps, max:
59 fps
fps
NVIDIA RTX A6000 (Quad NV-Link):
37 [X] AMD Ryzen Threadripper PRO 3975WX 3.5GHz
NVIDIA RTX A6000 (Quad NV-Link)
min:
22 fps, max:
51 fps
fps
NVIDIA RTX A6000 (Quad NV-Link):
36 [X] AMD Ryzen Threadripper PRO 3975WX 3.5GHz
NVIDIA RTX A6000 (Quad NV-Link)
min:
20 fps, max:
55 fps
fps
NVIDIA RTX A6000 (Quad NV-Link):
119 [X] AMD Ryzen Threadripper PRO 3975WX 3.5GHz
NVIDIA RTX A6000 (Quad NV-Link)
min:
72.6 fps, max:
199.68 fps
fps
NVIDIA RTX A6000 (Quad NV-Link):
106 [X] AMD Ryzen Threadripper PRO 3975WX 3.5GHz
NVIDIA RTX A6000 (Quad NV-Link)
min:
66.01 fps, max:
175.96 fps
fps
NVIDIA RTX A6000 (Quad NV-Link):
95.7 [X] AMD Ryzen Threadripper PRO 3975WX 3.5GHz
NVIDIA RTX A6000 (Quad NV-Link)
min:
59.73 fps, max:
153.09 fps
fps
NVIDIA RTX A6000 (Quad NV-Link):
87.9 [X] AMD Ryzen Threadripper PRO 3975WX 3.5GHz
NVIDIA RTX A6000 (Quad NV-Link)
min:
56.75 fps, max:
137.17 fps
fps
NVIDIA RTX A6000 (Quad NV-Link):
83.5 [X] AMD Ryzen Threadripper PRO 3975WX 3.5GHz
NVIDIA RTX A6000 (Quad NV-Link)
min:
56.07 fps, max:
126.84 fps
fps
NVIDIA RTX A6000 (Quad NV-Link):
67 [X] AMD Ryzen Threadripper PRO 3975WX 3.5GHz
NVIDIA RTX A6000 (Quad NV-Link)
min:
41.38 fps, max:
103.26 fps
fps
100%
HD Graphics 400 (Braswell):
14.1 fps
NVIDIA RTX A6000 (Quad NV-Link):
317 [X] 1.47.22.14 D3D12
AMD Ryzen Threadripper PRO 3975WX 3.5GHz
NVIDIA RTX A6000 (Quad NV-Link)
min:
41.3 fps, P1:
235 fps, max:
482 fps
fps
NVIDIA RTX A6000 (Quad NV-Link):
260 [X] 1.47.22.14 D3D12
AMD Ryzen Threadripper PRO 3975WX 3.5GHz
NVIDIA RTX A6000 (Quad NV-Link)
min:
47.8 fps, P1:
188 fps, max:
444 fps
fps
NVIDIA RTX A6000 (Quad NV-Link):
257 [X] 1.47.22.14 D3D12
AMD Ryzen Threadripper PRO 3975WX 3.5GHz
NVIDIA RTX A6000 (Quad NV-Link)
min:
52.3 fps, P1:
186 fps, max:
429 fps
fps
NVIDIA RTX A6000 (Quad NV-Link):
258 [X] 1.47.22.14 D3D12
AMD Ryzen Threadripper PRO 3975WX 3.5GHz
NVIDIA RTX A6000 (Quad NV-Link)
min:
38.6 fps, P1:
179 fps, max:
419 fps
fps
NVIDIA RTX A6000 (Quad NV-Link):
252 [X] 1.47.22.14 D3D12
AMD Ryzen Threadripper PRO 3975WX 3.5GHz
NVIDIA RTX A6000 (Quad NV-Link)
min:
62.6 fps, P1:
175 fps, max:
406 fps
fps
NVIDIA RTX A6000 (Quad NV-Link):
246 [X] 1.47.22.14 D3D12
AMD Ryzen Threadripper PRO 3975WX 3.5GHz
NVIDIA RTX A6000 (Quad NV-Link)
min:
41 fps, P1:
167 fps, max:
401 fps
fps
NVIDIA RTX A6000 (Quad NV-Link):
18 [X] AMD Ryzen Threadripper PRO 3975WX 3.5GHz
NVIDIA RTX A6000 (Quad NV-Link)
min:
11 fps, max:
34 fps
fps
NVIDIA RTX A6000 (Quad NV-Link):
18 [X] AMD Ryzen Threadripper PRO 3975WX 3.5GHz
NVIDIA RTX A6000 (Quad NV-Link)
min:
12 fps, max:
31 fps
fps
NVIDIA RTX A6000 (Quad NV-Link):
17 [X] AMD Ryzen Threadripper PRO 3975WX 3.5GHz
NVIDIA RTX A6000 (Quad NV-Link)
min:
11 fps, max:
25 fps
fps
NVIDIA RTX A6000 (Quad NV-Link):
18 [X] AMD Ryzen Threadripper PRO 3975WX 3.5GHz
NVIDIA RTX A6000 (Quad NV-Link)
min:
9 fps, max:
30 fps
fps
NVIDIA RTX A6000 (Quad NV-Link):
17 [X] AMD Ryzen Threadripper PRO 3975WX 3.5GHz
NVIDIA RTX A6000 (Quad NV-Link)
min:
10 fps, max:
29 fps
fps
NVIDIA RTX A6000 (Quad NV-Link):
18 [X] AMD Ryzen Threadripper PRO 3975WX 3.5GHz
NVIDIA RTX A6000 (Quad NV-Link)
min:
11 fps, max:
27 fps
fps
NVIDIA RTX A6000 (Quad NV-Link):
109 [X] AMD Ryzen Threadripper PRO 3975WX 3.5GHz
NVIDIA RTX A6000 (Quad NV-Link)
fps
NVIDIA RTX A6000 (Quad NV-Link):
96.8 [X] AMD Ryzen Threadripper PRO 3975WX 3.5GHz
NVIDIA RTX A6000 (Quad NV-Link)
fps
NVIDIA RTX A6000 (Quad NV-Link):
78.3 [X] AMD Ryzen Threadripper PRO 3975WX 3.5GHz
NVIDIA RTX A6000 (Quad NV-Link)
fps
NVIDIA RTX A6000 (Quad NV-Link):
67.8 [X] AMD Ryzen Threadripper PRO 3975WX 3.5GHz
NVIDIA RTX A6000 (Quad NV-Link)
fps
NVIDIA RTX A6000 (Quad NV-Link):
175 [X] 1.3
AMD Ryzen Threadripper PRO 3975WX 3.5GHz
NVIDIA RTX A6000 (Quad NV-Link)
fps
NVIDIA RTX A6000 (Quad NV-Link):
167 [X] 1.3
AMD Ryzen Threadripper PRO 3975WX 3.5GHz
NVIDIA RTX A6000 (Quad NV-Link)
fps
NVIDIA RTX A6000 (Quad NV-Link):
131 [X] 1.3
AMD Ryzen Threadripper PRO 3975WX 3.5GHz
NVIDIA RTX A6000 (Quad NV-Link)
fps
NVIDIA RTX A6000 (Quad NV-Link):
113 [X] 1.3
AMD Ryzen Threadripper PRO 3975WX 3.5GHz
NVIDIA RTX A6000 (Quad NV-Link)
fps
NVIDIA RTX A6000 (Quad NV-Link):
56.3 [X] 1.3
AMD Ryzen Threadripper PRO 3975WX 3.5GHz
NVIDIA RTX A6000 (Quad NV-Link)
fps
100%
HD Graphics 400 (Braswell):
18.5 fps
100%
HD Graphics 400 (Braswell):
16 fps
100%
HD Graphics 400 (Braswell):
12.7 fps
100%
HD Graphics 400 (Braswell):
6.8 fps
100%
HD Graphics 400 (Braswell):
10.7 fps
100%
HD Graphics 400 (Braswell):
20.9 fps
100%
HD Graphics 400 (Braswell):
5.8 fps
100%
HD Graphics 400 (Braswell):
9.7 fps
100%
HD Graphics 400 (Braswell):
15 15.1 ~ 15 fps
100%
HD Graphics 400 (Braswell):
9.5 9.7 ~ 10 fps
100%
HD Graphics 400 (Braswell):
5.3 fps
100%
HD Graphics 400 (Braswell):
7.3 fps
100%
HD Graphics 400 (Braswell):
3.2 fps
100%
HD Graphics 400 (Braswell):
36.5 fps
100%
HD Graphics 400 (Braswell):
14.2 fps
100%
HD Graphics 400 (Braswell):
9 fps
100%
HD Graphics 400 (Braswell):
13 fps
100%
HD Graphics 400 (Braswell):
8 fps
100%
HD Graphics 400 (Braswell):
13.3 fps
100%
HD Graphics 400 (Braswell):
21.3 fps
723%
NVIDIA RTX A6000 (Quad NV-Link):
154 [X] AMD Ryzen Threadripper PRO 3975WX 3.5GHz
NVIDIA RTX A6000 (Quad NV-Link)
min:
130.6 fps, max:
-1 fps
fps
100%
HD Graphics 400 (Braswell):
11.4 fps
1187%
NVIDIA RTX A6000 (Quad NV-Link):
135.3 [X] AMD Ryzen Threadripper PRO 3975WX 3.5GHz
NVIDIA RTX A6000 (Quad NV-Link)
min:
115.4 fps, max:
-1 fps
fps
NVIDIA RTX A6000 (Quad NV-Link):
126.8 [X] AMD Ryzen Threadripper PRO 3975WX 3.5GHz
NVIDIA RTX A6000 (Quad NV-Link)
min:
103.2 fps, max:
-1 fps
fps
NVIDIA RTX A6000 (Quad NV-Link):
115.3 [X] AMD Ryzen Threadripper PRO 3975WX 3.5GHz
NVIDIA RTX A6000 (Quad NV-Link)
min:
93.7 fps, max:
-1 fps
fps
NVIDIA RTX A6000 (Quad NV-Link):
109.3 [X] AMD Ryzen Threadripper PRO 3975WX 3.5GHz
NVIDIA RTX A6000 (Quad NV-Link)
min:
82.8 fps, max:
-1 fps
fps
100%
HD Graphics 400 (Braswell):
8.5 fps
4129%
NVIDIA RTX A6000 (Quad NV-Link):
351 [X] AMD Ryzen Threadripper PRO 3975WX 3.5GHz
NVIDIA RTX A6000 (Quad NV-Link)
min:
17 fps, P0.1:
55.7 fps, P1:
175 fps, max:
602 fps
fps
100%
HD Graphics 400 (Braswell):
5.6 fps
5911%
NVIDIA RTX A6000 (Quad NV-Link):
331 [X] AMD Ryzen Threadripper PRO 3975WX 3.5GHz
NVIDIA RTX A6000 (Quad NV-Link)
min:
22 fps, P0.1:
86.4 fps, P1:
203 fps, max:
468 fps
fps
NVIDIA RTX A6000 (Quad NV-Link):
305 [X] AMD Ryzen Threadripper PRO 3975WX 3.5GHz
NVIDIA RTX A6000 (Quad NV-Link)
min:
55.7 fps, P0.1:
85.6 fps, P1:
170 fps, max:
445 fps
fps
NVIDIA RTX A6000 (Quad NV-Link):
173 [X] AMD Ryzen Threadripper PRO 3975WX 3.5GHz
NVIDIA RTX A6000 (Quad NV-Link)
min:
18.6 fps, P0.1:
58.7 fps, P1:
91.1 fps, max:
314 fps
fps
NVIDIA RTX A6000 (Quad NV-Link):
142 [X] AMD Ryzen Threadripper PRO 3975WX 3.5GHz
NVIDIA RTX A6000 (Quad NV-Link)
min:
35.4 fps, P0.1:
62.7 fps, P1:
101 fps, max:
411 fps
fps
100%
HD Graphics 400 (Braswell):
40.1 fps
100%
HD Graphics 400 (Braswell):
11.7 fps
100%
HD Graphics 400 (Braswell):
14.3 fps
1182%
NVIDIA RTX A6000 (Quad NV-Link):
169 [X] AMD Ryzen Threadripper PRO 3975WX 3.5GHz
NVIDIA RTX A6000 (Quad NV-Link)
min:
0.803 fps, P1:
62.5 fps, max:
292 fps
fps
NVIDIA RTX A6000 (Quad NV-Link):
162 [X] AMD Ryzen Threadripper PRO 3975WX 3.5GHz
NVIDIA RTX A6000 (Quad NV-Link)
min:
3.97 fps, P1:
50 fps, max:
281 fps
fps
NVIDIA RTX A6000 (Quad NV-Link):
142 [X] AMD Ryzen Threadripper PRO 3975WX 3.5GHz
NVIDIA RTX A6000 (Quad NV-Link)
min:
2.64 fps, P1:
27 fps, max:
268 fps
fps
NVIDIA RTX A6000 (Quad NV-Link):
88.5 [X] AMD Ryzen Threadripper PRO 3975WX 3.5GHz
NVIDIA RTX A6000 (Quad NV-Link)
min:
0.4426 fps, P1:
20.4 fps, max:
166 fps
fps
NVIDIA RTX A6000 (Quad NV-Link):
88.4 [X] AMD Ryzen Threadripper PRO 3975WX 3.5GHz
NVIDIA RTX A6000 (Quad NV-Link)
min:
1.477 fps, P1:
20.8 fps, max:
164 fps
fps
NVIDIA RTX A6000 (Quad NV-Link):
139 [X] AMD Ryzen Threadripper PRO 3975WX 3.5GHz
NVIDIA RTX A6000 (Quad NV-Link)
min:
0.64 fps, P1:
25 fps, max:
249 fps
fps
100%
HD Graphics 400 (Braswell):
5.4 fps
100%
HD Graphics 400 (Braswell):
2.9 fps
100%
HD Graphics 400 (Braswell):
27 fps
100%
HD Graphics 400 (Braswell):
16 fps
100%
HD Graphics 400 (Braswell):
11.5 11.9 ~ 12 fps
100%
HD Graphics 400 (Braswell):
7 fps
100%
HD Graphics 400 (Braswell):
37 fps
100%
HD Graphics 400 (Braswell):
7.6 fps
100%
HD Graphics 400 (Braswell):
6.5 fps
100%
HD Graphics 400 (Braswell):
4.8 fps
100%
HD Graphics 400 (Braswell):
28.9 fps
100%
HD Graphics 400 (Braswell):
12.5 fps
100%
HD Graphics 400 (Braswell):
11.8 fps
100%
HD Graphics 400 (Braswell):
16.2 fps
100%
HD Graphics 400 (Braswell):
12.3 fps
100%
HD Graphics 400 (Braswell):
7.9 fps
100%
HD Graphics 400 (Braswell):
30 fps
100%
HD Graphics 400 (Braswell):
28 fps
100%
HD Graphics 400 (Braswell):
17 fps
100%
HD Graphics 400 (Braswell):
30 fps
100%
HD Graphics 400 (Braswell):
30 fps
100%
HD Graphics 400 (Braswell):
19.9 fps
100%
HD Graphics 400 (Braswell):
12.5 fps
100%
HD Graphics 400 (Braswell):
6.2 fps
100%
HD Graphics 400 (Braswell):
1.8 fps
100%
HD Graphics 400 (Braswell):
24.8 fps
100%
HD Graphics 400 (Braswell):
10.2 (!) fps
100%
HD Graphics 400 (Braswell):
21.1 fps
100%
HD Graphics 400 (Braswell):
10.8 fps
100%
HD Graphics 400 (Braswell):
8.7 fps
100%
HD Graphics 400 (Braswell):
10.5 fps
100%
HD Graphics 400 (Braswell):
18.3 fps
100%
HD Graphics 400 (Braswell):
27.7 fps
100%
HD Graphics 400 (Braswell):
19.8 fps
100%
HD Graphics 400 (Braswell):
9.5 fps
100%
HD Graphics 400 (Braswell):
18.4 fps
100%
HD Graphics 400 (Braswell):
11.3 fps
100%
HD Graphics 400 (Braswell):
29.4 fps
100%
HD Graphics 400 (Braswell):
14.3 fps
100%
HD Graphics 400 (Braswell):
12.5 fps
100%
HD Graphics 400 (Braswell):
34.5 fps
100%
HD Graphics 400 (Braswell):
8.8 fps
100%
HD Graphics 400 (Braswell):
5.6 fps
100%
HD Graphics 400 (Braswell):
60 88.5 [X] Medion Akoya E2228T-MD61250 Intel Atom x5-Z8350 1.4GHz
HD Graphics 400 (Braswell)
~ 74 fps
100%
HD Graphics 400 (Braswell):
22.6 [X] Medion Akoya E2228T-MD61250 Intel Atom x5-Z8350 1.4GHz
HD Graphics 400 (Braswell)
25.2 ~ 24 fps
100%
HD Graphics 400 (Braswell):
9.9 [X] Medion Akoya E2228T-MD61250 Intel Atom x5-Z8350 1.4GHz
HD Graphics 400 (Braswell)
fps
Average Gaming Intel HD Graphics 400 (Braswell) → 100% Average Gaming 30-70 fps → 100%
Average Gaming 4x NVIDIA RTX A6000 → 2626% 4x NVIDIA RTX A6000 low med. high ultra QHD 4K F1 2021 328 303 278 159 149 96.8 F1 2020 277 241 241 221 210 136 Far Cry New Dawn 40 40 38 37 37 36 Metro Exodus 119 106 95.7 87.9 83.5 67 Strange Brigade 317 260 257 258 252 246 Far Cry 5 18 18 17 18 17 18 X-Plane 11.11 109 96.8 78.3 67.8 Final Fantasy XV Benchmark 175 167 131 113 56.3 Dota 2 Reborn 154 135.3 126.8 115.3 109.3 The Witcher 3 351 331 305 173 142 GTA V 169 162 142 88.5 88.4 139 < 30 fps < 60 fps < 120 fps ≥ 120 fps 1 1 2 7 1 1 2 7 1 1 2 7 1 1 3 4 1 1 3 3 1 2 4 4
For more games that might be playable and a list of all games and graphics cards visit our Gaming List
v1.28
log 04. 00:03:37
#0 checking url part for id 7349 +0s ... 0s
#1 checking url part for id 11095 +0s ... 0s
#2 redirected to Ajax server, took 1720044217 +0s ... 0s
#3 did not recreate cache, as it is less than 5 days old! Created at Mon, 01 Jul 2024 05:16:07 +0200 +0s ... 0s
#4 composed specs +0.05s ... 0.05s
#5 did output specs +0s ... 0.05s
#6 start showIntegratedCPUs +0s ... 0.05s
#7 getting avg benchmarks for device 7349 +0.021s ... 0.071s
#8 got single benchmarks 7349 +0.023s ... 0.094s
#9 getting avg benchmarks for device 11095 +0.004s ... 0.098s
#10 got single benchmarks 11095 +0.004s ... 0.102s
#11 got avg benchmarks for devices +0s ... 0.102s
#12 min, max, avg, median took s +0.035s ... 0.136s
#13 before gaming benchmark output +0s ... 0.136s
#14 Got 154 rows for game benchmarks. +0.009s ... 0.145s
#15 composed SQL query for gamebenchmarks +0s ... 0.145s
#16 got data and put it in $dataArray +0.002s ... 0.148s
#17 benchmarks composed for output. +0.016s ... 0.163s
#18 calculated avg scores. +0s ... 0.163s
#19 return log +0.002s ... 0.166s
Please share our article, every link counts!
Redaktion, 2017-09- 8 (Update: 2023-07- 1)
 Deutsch
 English
 Español
 Français
 Italiano
 Nederlands
 Polski
 Português
 Русский
 Türkçe
 Svenska
 Chinese
 Magyar