Notebookcheck Logo

Intel Graphics 4-Cores iGPU (Arc) vs Intel Arc A570M

Intel Graphics 4-Cores iGPU (Arc)

► remove from comparison Intel Graphics 4-Core

The Intel Graphics iGPU with 4 cores is an integrated graphics card based on the Xe LPG architecture (similar to the dedicated Arc GPUs, but with a focus on efficiency). It offers 4 Xe cores (64 Xe vector engines), 4 ray tracing units, 4 samplers and 2 pixel backends.

In contrast to the more powerful variant with 8 cores in the H Meteor Lake CPUs, the small variant is not allowed to use the Arc name.

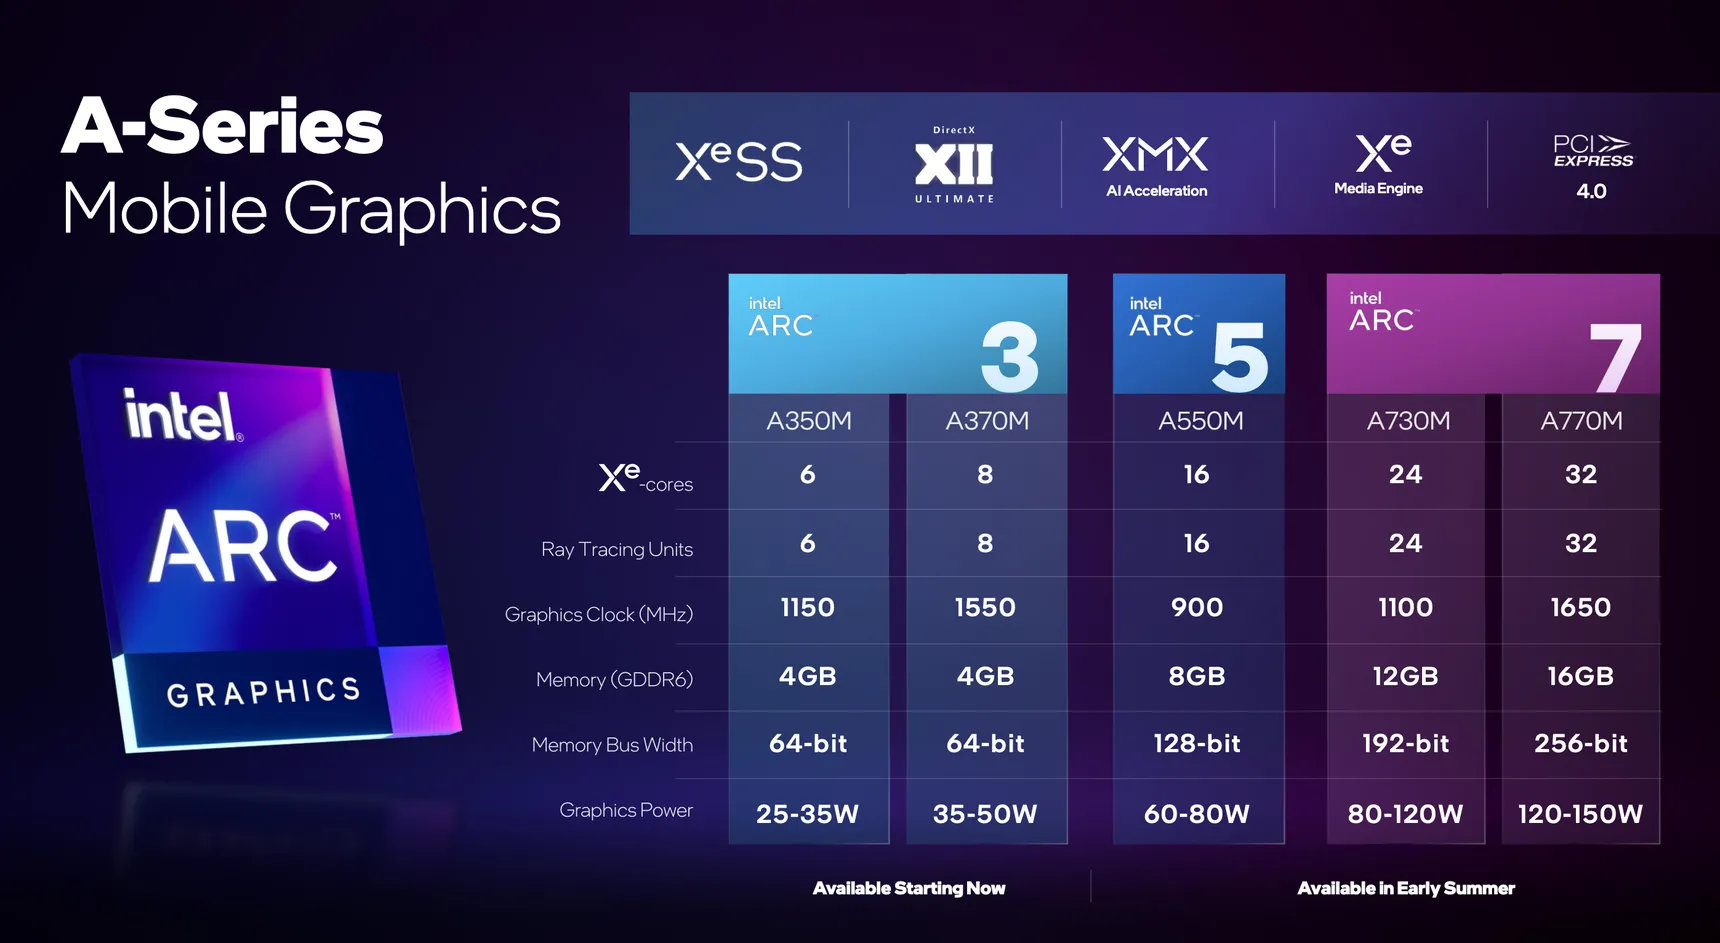
The iGPU supports DirectX 12 Ultimate (probably DX 12_2 like the desktop Arc GPUs). The graphics unit also supports XeSS AI Super Sampling.

The media engine of Meteor Lake is in the SOC tile and supports up to 8k60 10-bit HDR encode and decode of MPEG2, AVC, VP9, HEVC and AV1. The display engine is also in the SoC tile and supports HDMI 2.1 and DisplayPort 2.1 20G with up to 8K60 HDR.

The GPU Tile of the Meteor Lake chip is manufactured at TSMC in 5nm (5N process).

Intel Arc A570M

► remove from comparison Intel A570M

The Intel Arc A570M (device ID 5696) is a dedicated mobile lower- mid-range graphics card for laptops based on Xe HPG microarchitecture. It uses the ACM-G12 chip and offers all 16 Xe-cores (256 ALUs), 16 ray tracing units and a 128-bit memory bus for 8 GB GDDR6 graphics memory. The cores can clock from 300 MHz (low frequency mode) to 1300 MHz (high frequency) or in short bursts 2050+ MHz (short bursts / Turbo).

The performance of the Arc A570M should be between the Radeon RX 6500M and 6600M and therefore well suited even for demanding games in medium to high detail settings and 1080p. The slower Arc A370M is based on the smaller ACM-G11 chip and should be significantly slower, the similar Arc A550M is a slower clocked variant with a slightly lower TDP.

The chip also integrates two media engines for VP9, AVC, HEVC, and AV1 8k en- and decoding. The 4 display pipes support up to 4x 4k120 HDR via DMI 2.0B or DisplayPort 2.0 10G. 

The A570M is produced in 6nm at TSMC (N6 process) and supports dynamic power share (using Deep Link) with 12th gen Intel CPUs (Alder Lake).

Intel Graphics 4-Cores iGPU (Arc)Intel Arc A570M
Arc Series
Arc 8-Core compare 8 @ 2.3 GHz
Arc 7-Core compare 7 @ 2.2 GHz
Graphics 4-Core 4 @ 1.95 GHz
Arc A770 compare 4096 @ 2.1 - 2.4 GHz256 Bit @ 16000 MHz
Arc A750 compare 3584 @ 2.05 - 2.4 GHz256 Bit @ 16000 MHz
Arc A580 compare 3072 @ 1.7 - 2 GHz256 Bit @ 16000 MHz
A770M compare 4096 @ 1.65 GHz256 Bit @ 16000 MHz
A730M compare 3072 @ 1.1 GHz192 Bit @ 14000 MHz
A570M 16 @ 0.9 - 1.3 GHz128 Bit @ 14000 MHz
A550M compare 16 @ 0.9 - 2.01 GHz128 Bit @ 14000 MHz
A530M compare 12 @ 0.9 - 1.3 GHz128 Bit @ 14000 MHz
A370M compare 8 @ 1.55 GHz64 Bit @ 14000 MHz
Arc A380 compare 1024 @ 2 GHz96 Bit @ 15500 MHz
A310 compare 6 @ 2 GHz64 Bit @ 15500 MHz
A350M compare 6 @ 1.15 GHz64 Bit @ 14000 MHz
CodenameMeteor Lake iGPUAlchemist
ArchitectureXe LPGXe HPG
Pipelines4 - unified16 - unified
Raytracing Cores416
Core Speed1950 (Boost) MHz900 - 1300 (Boost) MHz
CacheL1: 768 KBL2: 8 MB
Shared Memorynono
APIDirectX 12_2, OpenGL 4.6, Vulkan 1.3DirectX 12_2, Shader 6.6, OpenGL 4.6, OpenCL 3.0, Vulkan 1.3
technology5 nm6 nm
DisplaysHDMI 2.1, DisplayPort 2.1 20G4 Displays (max.), HDMI 2.0b, DisplayPort 2.0 10G Ready
Date of Announcement14.12.2023 31.07.2023
TMUs128
ROPs64
Memory Speed14000 effective = 1750 MHz
Memory Bus Width128 Bit
Memory TypeGDDR6
Max. Amount of Memory8 GB
Memory Bandwidth224 GB/s
Power Consumption75 Watt (75 - 95 Watt TGP)
PCIe4 16x
Link to Manufacturer Pagewww.intel.com
CPU in Graphics 4-CoreGPU Base SpeedGPU Boost / Turbo
Intel Core Ultra 7 165U12 x 3800 MHz, 15 W? MHz2000 MHz
Intel Core Ultra 7 155U12 x 3800 MHz, 15 W? MHz1950 MHz
Intel Core Ultra 7 164U12 x 3800 MHz, 9 W? MHz1800 MHz
min. - max.? MHz1750 - 2000 MHz

Benchmarks

Performance Rating - 3DMark 11 + Fire Strike + Time Spy - Graphics 4-Core
2.4 pt (7%)
3DMark - 3DMark Time Spy Score
min: 1876     avg: 2099     median: 2152 (6%)     max: 2315 Points
3DMark - 3DMark Time Spy Graphics
min: 1668     avg: 1876     median: 1930 (5%)     max: 2067 Points
3DMark - 3DMark Ice Storm Unlimited Graphics
295187 Points (33%)
3DMark - 3DMark Ice Storm Extreme Graphics
75102 Points (10%)
3DMark - 3DMark Cloud Gate Score
min: 20124     avg: 21638     median: 21595 (23%)     max: 23325 Points
3DMark - 3DMark Cloud Gate Graphics
min: 25031     avg: 27936     median: 28416.5 (7%)     max: 30198 Points
3DMark - 3DMark Fire Strike Standard Score
min: 3952     avg: 4796     median: 4975 (9%)     max: 5179 Points
3DMark - 3DMark Fire Strike Standard Graphics
min: 4284     avg: 5109     median: 5366 (6%)     max: 5498 Points
3DMark - 3DMark Ice Storm Graphics
89439 Points (11%)
3DMark - 3DMark Wild Life Extreme Unlimited
3681 Points (4%)
3DMark - 3DMark Night Raid
18070 Points (17%)
3DMark - 3DMark Night Raid Graphics Score
21828 Points (8%)
3DMark 11 - 3DM11 Performance Score
min: 6340     avg: 7247     median: 7353 (10%)     max: 7589 Points
3DMark 11 - 3DM11 Performance GPU
min: 6007     avg: 6762     median: 6827 (6%)     max: 7107 Points
Cinebench R15
Cinebench R15 OpenGL 64 Bit + Intel Graphics 4-Cores iGPU (Arc)
Cinebench R15 - Cinebench R15 OpenGL 64 Bit
min: 94.3     avg: 102.9     median: 103.6 (6%)     max: 112 fps
Cinebench R15 OpenGL Ref. Match 64 Bit + Intel Graphics 4-Cores iGPU (Arc)
Cinebench R15 - Cinebench R15 OpenGL Ref. Match 64 Bit
97.8 % (98%)
Basemark GPU 1.2 - Basemark GPU 1.2 Vulkan Official Medium Offscreen 1080
min: 104.6     avg: 159.4     median: 104.6 (1%)     max: 315 fps
Basemark GPU 1.2 - Basemark GPU 1.2 Vulkan Official High Offscreen 2160
3.6 fps (1%)
Geekbench 6.2 - Geekbench 6.2 GPU OpenCL
min: 14713     avg: 16685     median: 16695 (5%)     max: 17837 Points
Geekbench 6.2 - Geekbench 6.2 GPU Vulkan
min: 12449     avg: 17445     median: 18064 (6%)     max: 19667 Points
Power Consumption - Furmark Stress Test Power Consumption - external Monitor *
min: 25.3     avg: 29.3     median: 26 (4%)     max: 38 Watt
Power Consumption - The Witcher 3 Power Consumption - external Monitor *
min: 24.4     avg: 27.7     median: 26.8 (4%)     max: 32.2 Watt
Power Consumption - Witcher 3 Power Consumption *
min: 27.4     avg: 32.3     median: 30.7 (7%)     max: 41.5 Watt
Power Consumption - Witcher 3 ultra Power Efficiency
min: 0.4313     avg: 0.5     median: 0.5 (43%)     max: 0.544 fps per Watt
Power Consumption - Witcher 3 ultra Power Efficiency - external Monitor
min: 0.4877     avg: 0.5     median: 0.5 (45%)     max: 0.603 fps per Watt
Emissions Witcher 3 Fan Noise + Intel Graphics 4-Cores iGPU (Arc)
Emissions - Witcher 3 Fan Noise
min: 27.3     avg: 37.3     median: 37 (59%)     max: 44.9 dB(A)

Average Benchmarks Intel Graphics 4-Cores iGPU (Arc) → 0% n=

- Range of benchmark values for this graphics card
- Average benchmark values for this graphics card
* Smaller numbers mean a higher performance
1 This benchmark is not used for the average calculation

Game Benchmarks

The following benchmarks stem from our benchmarks of review laptops. The performance depends on the used graphics memory, clock rate, processor, system settings, drivers, and operating systems. So the results don't have to be representative for all laptops with this GPU. For detailed information on the benchmark results, click on the fps number.

low 1920x1080
100%
Graphics 4-Core:
17.8 18.5 19.3 20.3 20.9 21.6 ~ 20 fps
med. 1920x1080
100%
Graphics 4-Core:
13.8 15 15.3 16.7 16.9 17.6 ~ 16 fps
high 1920x1080
100%
Graphics 4-Core:
11.9 12.4 13 14.3 14.4 14.9 ~ 13 fps
ultra 1920x1080
100%
Graphics 4-Core:
10.3 11.1 11.2 12.5 12.7 13 ~ 12 fps
low 1920x1080
100%
Graphics 4-Core:
15 15.4 16.2 17.7 17.8 18.8 ~ 17 fps
med. 1920x1080
100%
Graphics 4-Core:
12.3 12.6 12.8 14.5 15.5 ~ 14 fps
high 1920x1080
100%
Graphics 4-Core:
10.6 11 13.2 ~ 12 fps
ultra 1920x1080
100%
Graphics 4-Core:
10.6 12.1 ~ 11 fps
F1 23

F1 23

2023
low 1920x1080
100%
Graphics 4-Core:
40.1 43.8 ~ 42 fps
med. 1920x1080
100%
Graphics 4-Core:
37.3 39.8 ~ 39 fps
high 1920x1080
100%
Graphics 4-Core:
23.9 26 ~ 25 fps
ultra 1920x1080
100%
Graphics 4-Core:
7.1  fps
F1 22

F1 22

2022
low 1920x1080
100%
Graphics 4-Core:
39.9 41.7 43.8 46.3 46.6 ~ 44 fps
med. 1920x1080
100%
Graphics 4-Core:
35.9 39.7 40.5 41.9 42 ~ 40 fps
high 1920x1080
100%
Graphics 4-Core:
29.5 30.8 ~ 30 fps
ultra 1920x1080
100%
Graphics 4-Core:
7.6 8 ~ 8 fps
low 1920x1080
100%
Graphics 4-Core:
27.2 27.6 29.9 30.8 ~ 29 fps
med. 1920x1080
100%
Graphics 4-Core:
21.1 22.9 24 24.2 ~ 23 fps
high 1920x1080
100%
Graphics 4-Core:
14.1 16.1 16.3 16.8 ~ 16 fps
ultra 1920x1080
100%
Graphics 4-Core:
11.3 12.7 13.6 13.8 ~ 13 fps
Strange Brigade

Strange Brigade

2018
low 1280x720
100%
Graphics 4-Core:
73.7 111.2 115 118.1 118.4 120.4 121.1 ~ 111 fps
med. 1920x1080
100%
Graphics 4-Core:
32.9 47 49.1 50 50 50.8 52.1 ~ 47 fps
high 1920x1080
100%
Graphics 4-Core:
26.6 34.7 37.7 39.2 39.6 40 41.9 ~ 37 fps
ultra 1920x1080
100%
Graphics 4-Core:
22.9 28.4 29.9 30.2 30.3 32 33.3 ~ 30 fps
Far Cry 5

Far Cry 5

2018
low 1280x720
100%
Graphics 4-Core:
33 38 41 46 47 48 48 ~ 43 fps
med. 1920x1080
100%
Graphics 4-Core:
20 23 24 25 25 25 28 ~ 24 fps
high 1920x1080
100%
Graphics 4-Core:
19 21 23 23 24 25 25 ~ 23 fps
ultra 1920x1080
100%
Graphics 4-Core:
18 18 21 21 22 22 23 ~ 21 fps
low 1280x720
100%
Graphics 4-Core:
34.7 35 36.2 36.5 36.8 37.6 40 ~ 37 fps
med. 1920x1080
100%
Graphics 4-Core:
27.3 28 28.2 28.2 28.3 29.7 30.1 ~ 29 fps
high 1920x1080
100%
Graphics 4-Core:
22.8 23.2 23.4 23.4 23.6 24.8 25.3 ~ 24 fps
low 1280x720
100%
Graphics 4-Core:
35.4 35.7 37.4 37.6 42.7 48.1 48.2 ~ 41 fps
med. 1920x1080
100%
Graphics 4-Core:
19.5 22 23 23.4 23.6 25.9 26 ~ 23 fps
high 1920x1080
100%
Graphics 4-Core:
15.7 16.3 16.3 16.7 17.5 18.2 18.2 ~ 17 fps
low 1280x720
100%
Graphics 4-Core:
74.1 82.6 91.4 91.8 92.9 93.8 101.9 ~ 90 fps
med. 1366x768
100%
Graphics 4-Core:
43.7 52.2 54.3 59.7 60.7 69 72.2 ~ 59 fps
high 1920x1080
100%
Graphics 4-Core:
48.4 52.8 57.2 60.4 61 61.1 61.6 ~ 58 fps
ultra 1920x1080
100%
Graphics 4-Core:
45.5 50 54 54.2 56.9 57.3 57.6 ~ 54 fps
low 1024x768
100%
Graphics 4-Core:
66.5 79.6 86.8 91 92.1 92.1 92.9 ~ 86 fps
med. 1366x768
100%
Graphics 4-Core:
41.3 49.6 51.1 56.2 57 57 57 ~ 53 fps
high 1920x1080
100%
Graphics 4-Core:
21.4 28 28.4 31 32.4 32.4 33.3 ~ 30 fps
ultra 1920x1080
100%
Graphics 4-Core:
11.9 14.9 15 16.3 17.6 17.9 17.9 ~ 16 fps
GTA V

GTA V

2015
low 1024x768
100%
Graphics 4-Core:
139.1  fps
med. 1366x768
100%
Graphics 4-Core:
123.9  fps
high 1920x1080
100%
Graphics 4-Core:
21.9  fps
ultra 1920x1080
100%
Graphics 4-Core:
9  fps

Average Gaming Intel Graphics 4-Cores iGPU (Arc) → 100%

Average Gaming 30-70 fps → 100%

Intel Graphics 4-Cores iGPU (Arc)lowmed.highultraQHD4K
Cyberpunk 2077 2.1 Phantom Liberty20161312
Baldur's Gate 317141211
F1 234239257.14
F1 224440308
Tiny Tina's Wonderlands29231613
Strange Brigade111473730
Far Cry 543242321
X-Plane 11.11372924
Final Fantasy XV Benchmark412317
Dota 2 Reborn90595854
The Witcher 386533016
GTA V139.1123.921.99
< 30 fps
< 60 fps
< 120 fps
≥ 120 fps
3
5
3
1
6
5

1
8
4

8
2


For more games that might be playable and a list of all games and graphics cards visit our Gaming List

Add one or more devices and compare

In the following list you can select (and also search for) devices that should be added to the comparison. You can select more than one device.

restrict list:

show all (including archived), 2024, 2023
v1.28
log 04. 06:27:56

#0 checking url part for id 12259 +0s ... 0s

#1 checking url part for id 11610 +0s ... 0s

#2 redirected to Ajax server, took 1720067276 +0s ... 0s

#3 did not recreate cache, as it is less than 5 days old! Created at Thu, 04 Jul 2024 05:15:44 +0200 +0s ... 0s

#4 composed specs +0.053s ... 0.053s

#5 did output specs +0s ... 0.053s

#6 start showIntegratedCPUs +0s ... 0.053s

#7 getting avg benchmarks for device 12259 +0.022s ... 0.076s

#8 got single benchmarks 12259 +0.011s ... 0.086s

#9 getting avg benchmarks for device 11610 +0s ... 0.087s

#10 got single benchmarks 11610 +0s ... 0.087s

#11 got avg benchmarks for devices +0s ... 0.087s

#12 min, max, avg, median took s +0.012s ... 0.099s

#13 before gaming benchmark output +0s ... 0.099s

#14 Got 235 rows for game benchmarks. +0.014s ... 0.112s

#15 composed SQL query for gamebenchmarks +0s ... 0.112s

#16 got data and put it in $dataArray +0.001s ... 0.113s

#17 benchmarks composed for output. +0.005s ... 0.118s

#18 calculated avg scores. +0s ... 0.118s

#19 return log +0.002s ... 0.12s

Please share our article, every link counts!
> Expert Reviews and News on Laptops, Smartphones and Tech Innovations > Benchmarks / Tech > Graphics Card Comparison - Head 2 Head
Redaktion, 2017-09- 8 (Update: 2023-07- 1)