 Deutsch
 English
 Español
 Français
 Italiano
 Nederlands
 Polski
 Português
 Русский
 Türkçe
 Svenska
 Chinese
 Magyar
Gigabyte Aero 17 XA HDR Laptop Review: This is a *Really* Good 17-inch Laptop
Unveiled at Computex 2019, the 17.3-inch Aero 17 follows on the footsteps of the 14-inch Aero 14 and 15.6-inch Aero 15. The Aero is Gigabyte's most successful flagship laptop series to date as these systems tend to offer higher specifications than your typical Ultrabook while still being just as portable for gamers, creators, and demanding multimedia users.
The table below summarizes the Aero 17 SKUs available at launch. Being a top tier series, all options are high-end configurations ranging from the hexa-core Core i7-9750H to the octa-core Core i9-9980HK with four different Nvidia Turing GPU options (GTX 1660 Ti, RTX 2060, RTX 2070 Max-Q, and RTX 2080 Max-Q) and either 1080p144 or 4k60 IPS. Aside from their high specs, Aero laptops are distinguished by their individually pre-calibrated X-Rite Pantone Certified panels that professionals can appreciate.
While Gigabyte generally avoids advertising its professional Aero series as dedicated gaming laptops in order to avoid overlap with its Aorus series, comparisons to other ultra-thin high-performance 17.3-inch gaming laptops like the Acer Predator Triton, Razer Blade Pro 17, Asus Zephyrus GX701, and the MSI GS75 are inevitable. Prices start at $1700 for the Aero 17 SA up to $2400 for the Aero 17 XA. Our particular test unit today is the Aero 17 HDR XA.
More Gigabyte reviews:
Model | AERO 17 HDR YA | AERO 17 HDR XA | AERO 17 XA | AERO 17 WA | AERO 17 SA | ||
OS | Windows 10 Pro High End / Windows 10 Pro / Windows 10 | ||||||
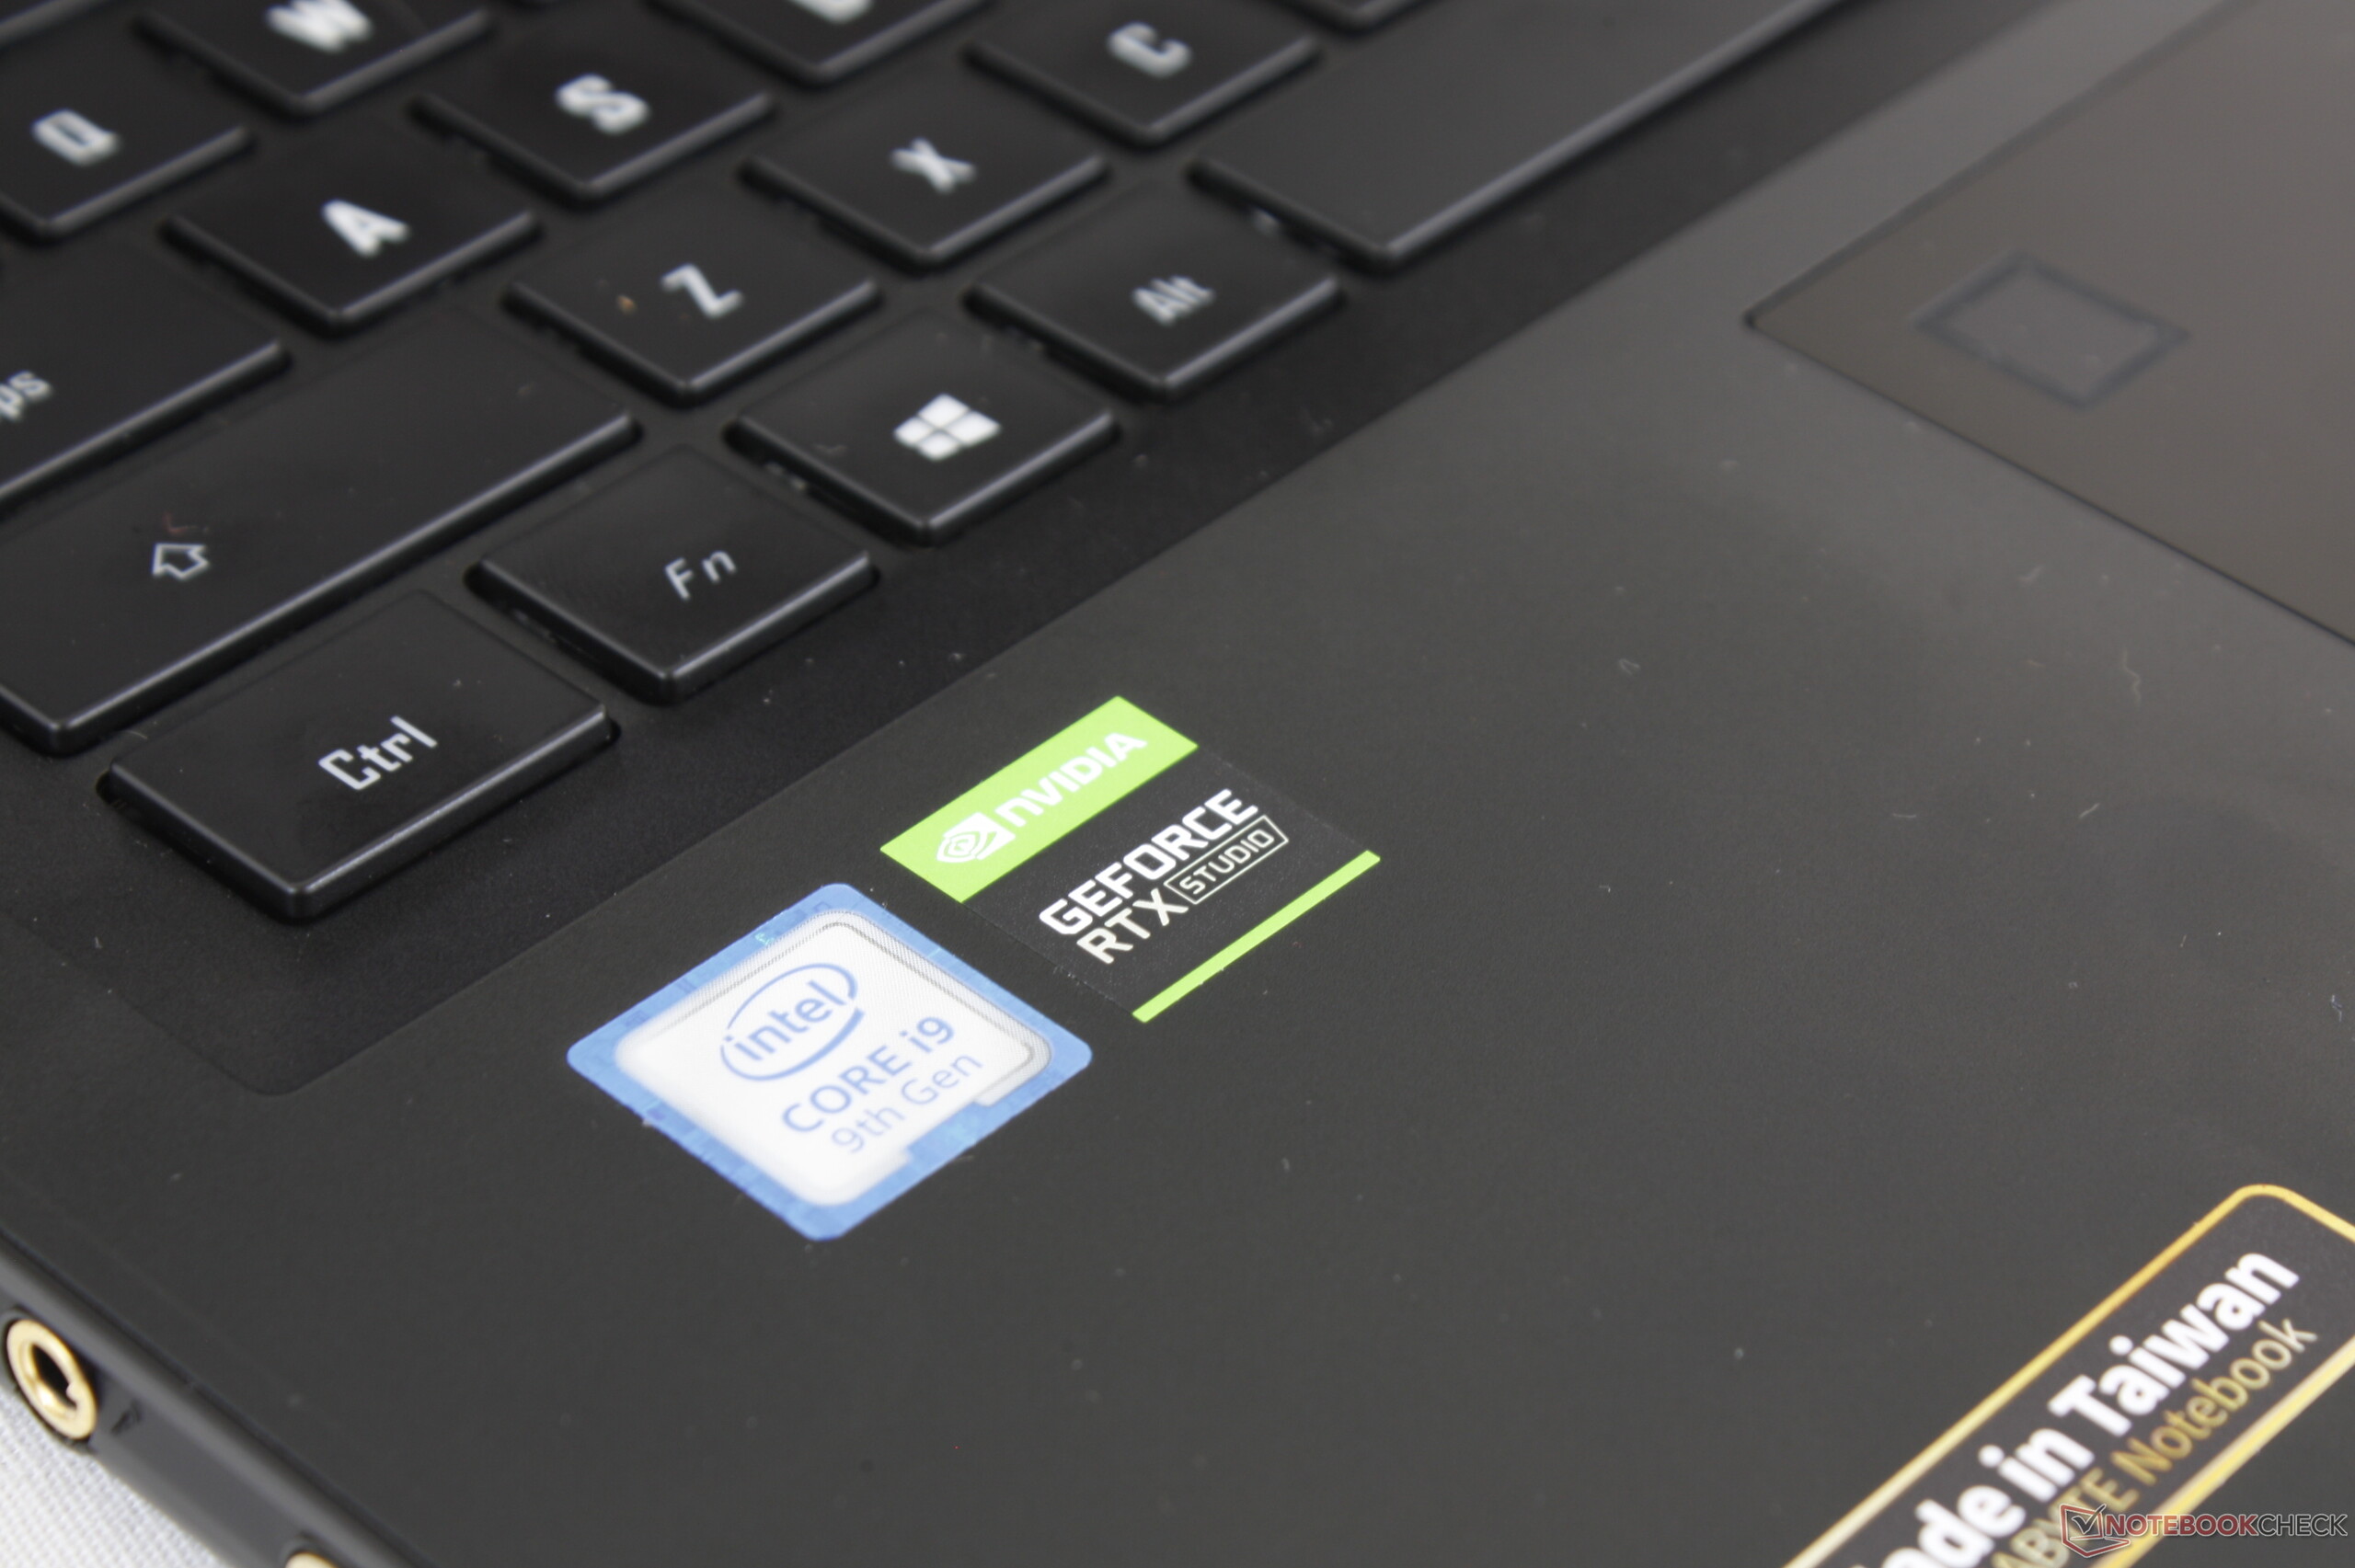
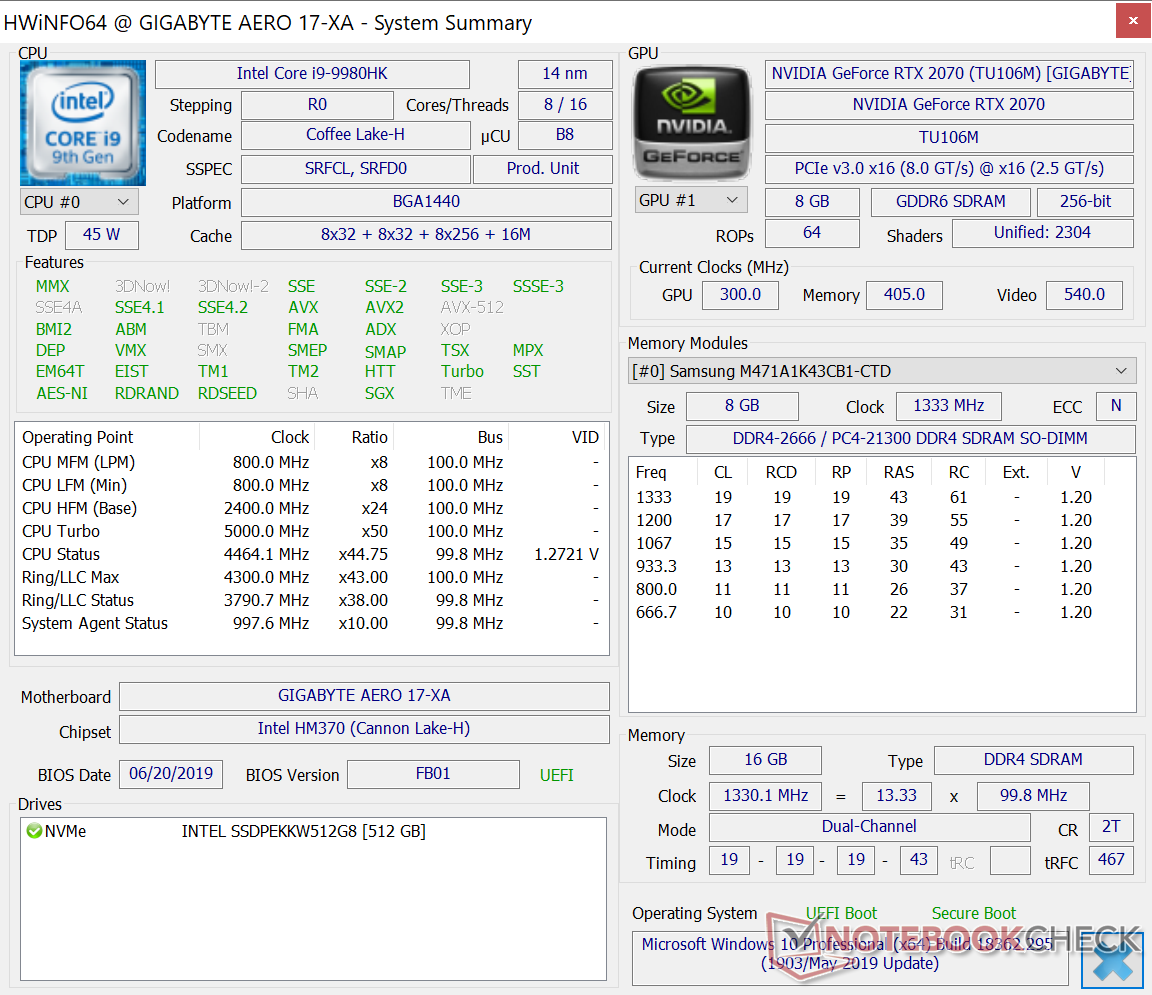
CPU | Intel® Core™ i9-9980HK | Intel® Core™ i7-9750H | |||||
Display | AUO 4K Adobe RGB 100% Panel | LG FHD 144Hz IPS Panel | |||||
*X-Rite™ Pantone® Certified, individually factory calibrated | |||||||
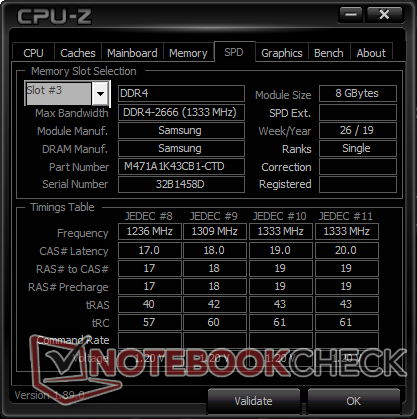
RAM | Samsung® DDR4 2666MHz, 2 slots (Max 64GB) | ||||||
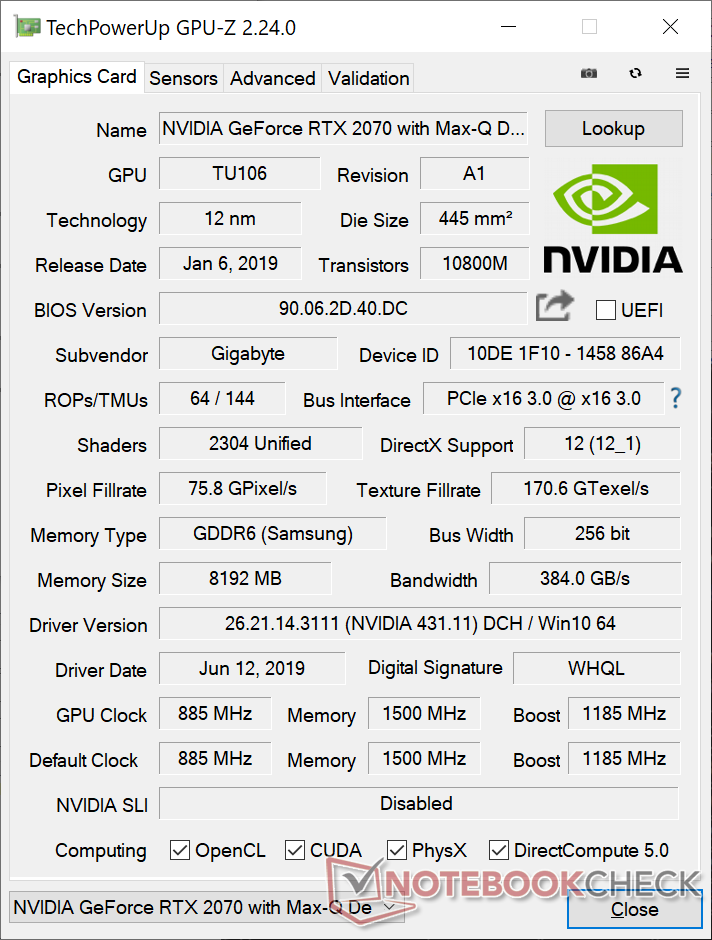
Graphics | NVIDIA® GeForce RTX™ 2080 With Max-Q Design | NVIDIA® GeForce RTX™ 2070 With Max-Q Design | NVIDIA® GeForce RTX™ 2070 With Max-Q Design | NVIDIA® GeForce RTX™ 2060 | NVIDIA® GeForce® GTX 1660 Ti | ||
Storage | Intel® 760P SSD (2x M.2 SSD slots) | ||||||
I/O | 3x USB 3.1 Gen1 (Type-A) | 1x DP 1.4 & USB3.1 (USB Type-C) 1x headphone jack 1x microphone | 1x UHS-II SD reader 1x RJ-45 LAN Port | ||||
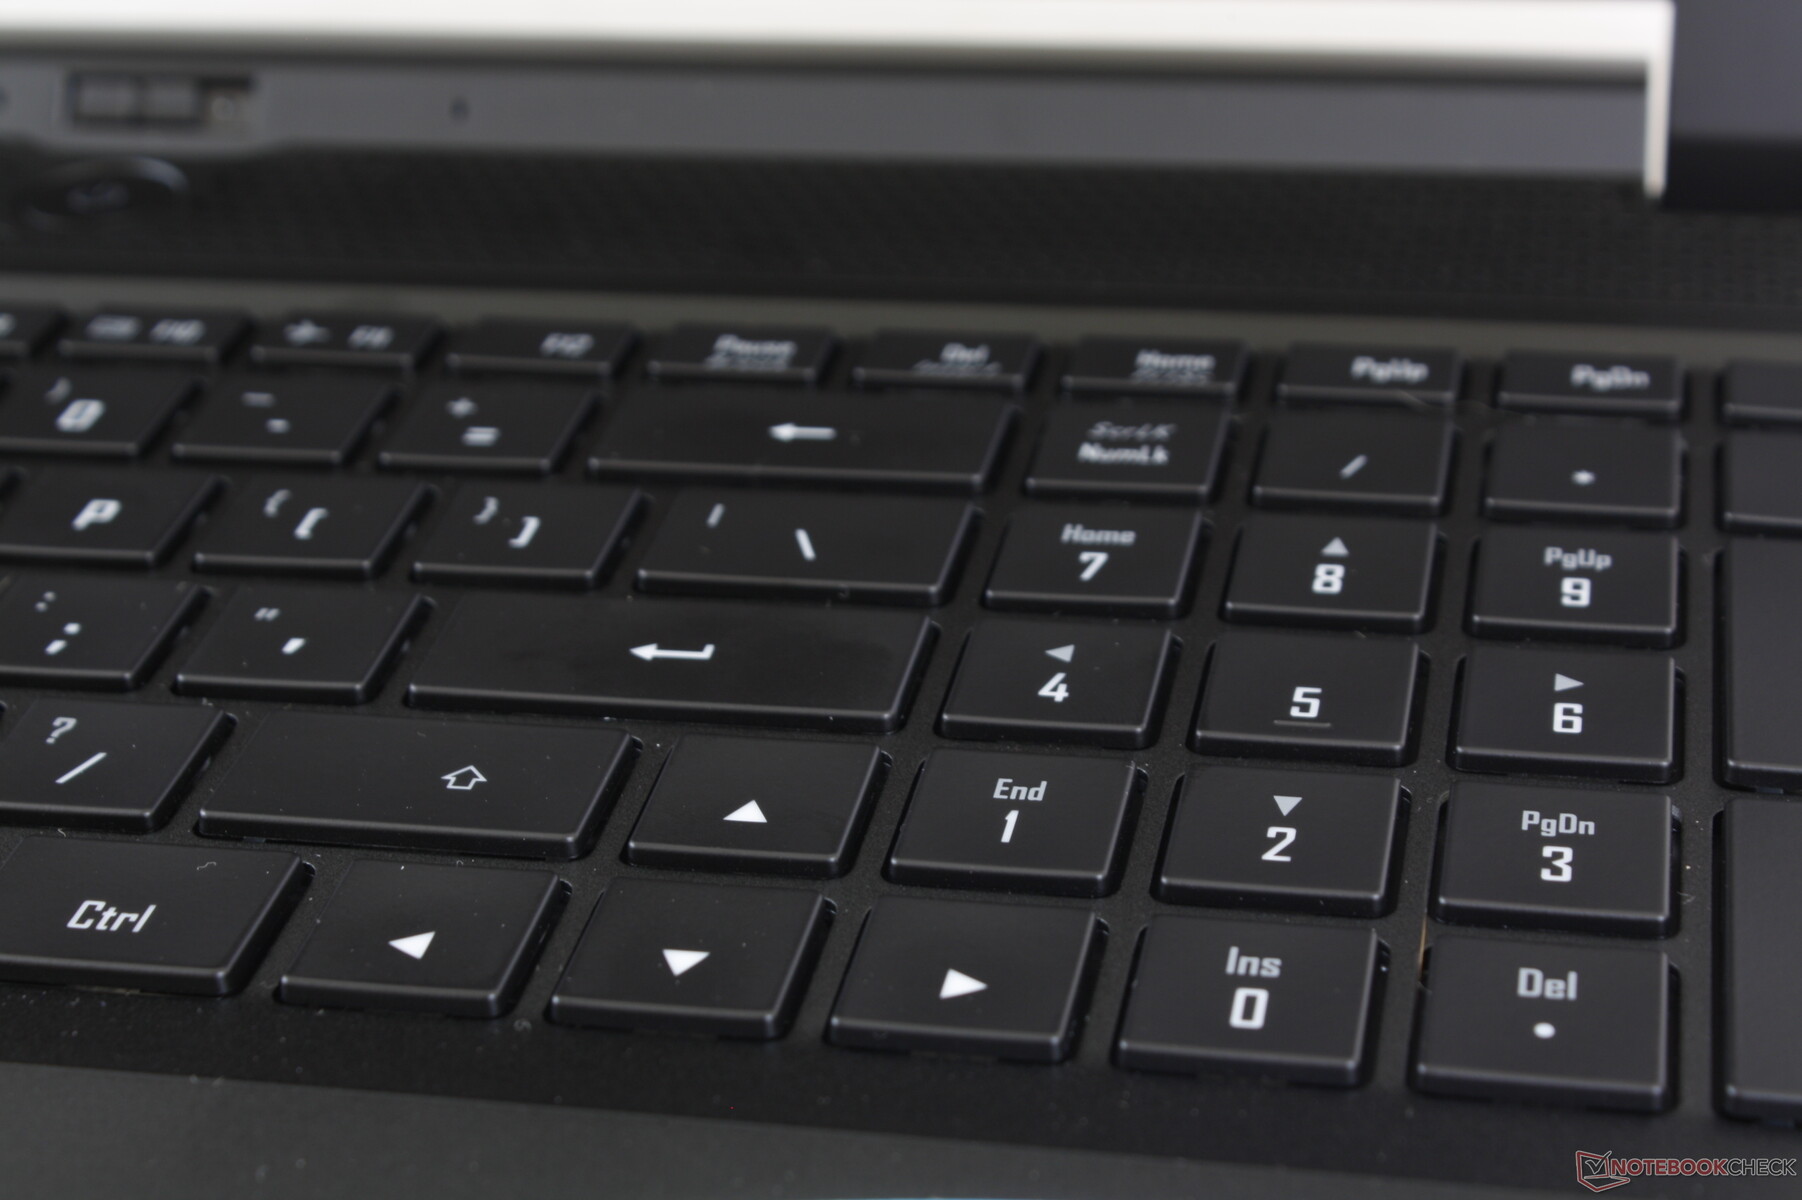
Keyboard Type | GIGABYTE Fusion Per-key RGB Backlit | ||||||
Network | Killer™ Ethernet E2600 LAN Chip / Killer™ Wi-Fi 6 AX1650 (Intel AX200) Bluetooth: Bluetooth V5.0 + LE | ||||||
Adapter | 230W | ||||||
Battery | Li Polymer 94.24Wh | ||||||
Dimensions | 396(W) x 270(D) x 21.4(H) mm / 15.6(W) x 10.6(D) x 0.84(H) inch | ||||||
Weight | ~2.5 kg / 5.5 lb | ||||||
| |||||||
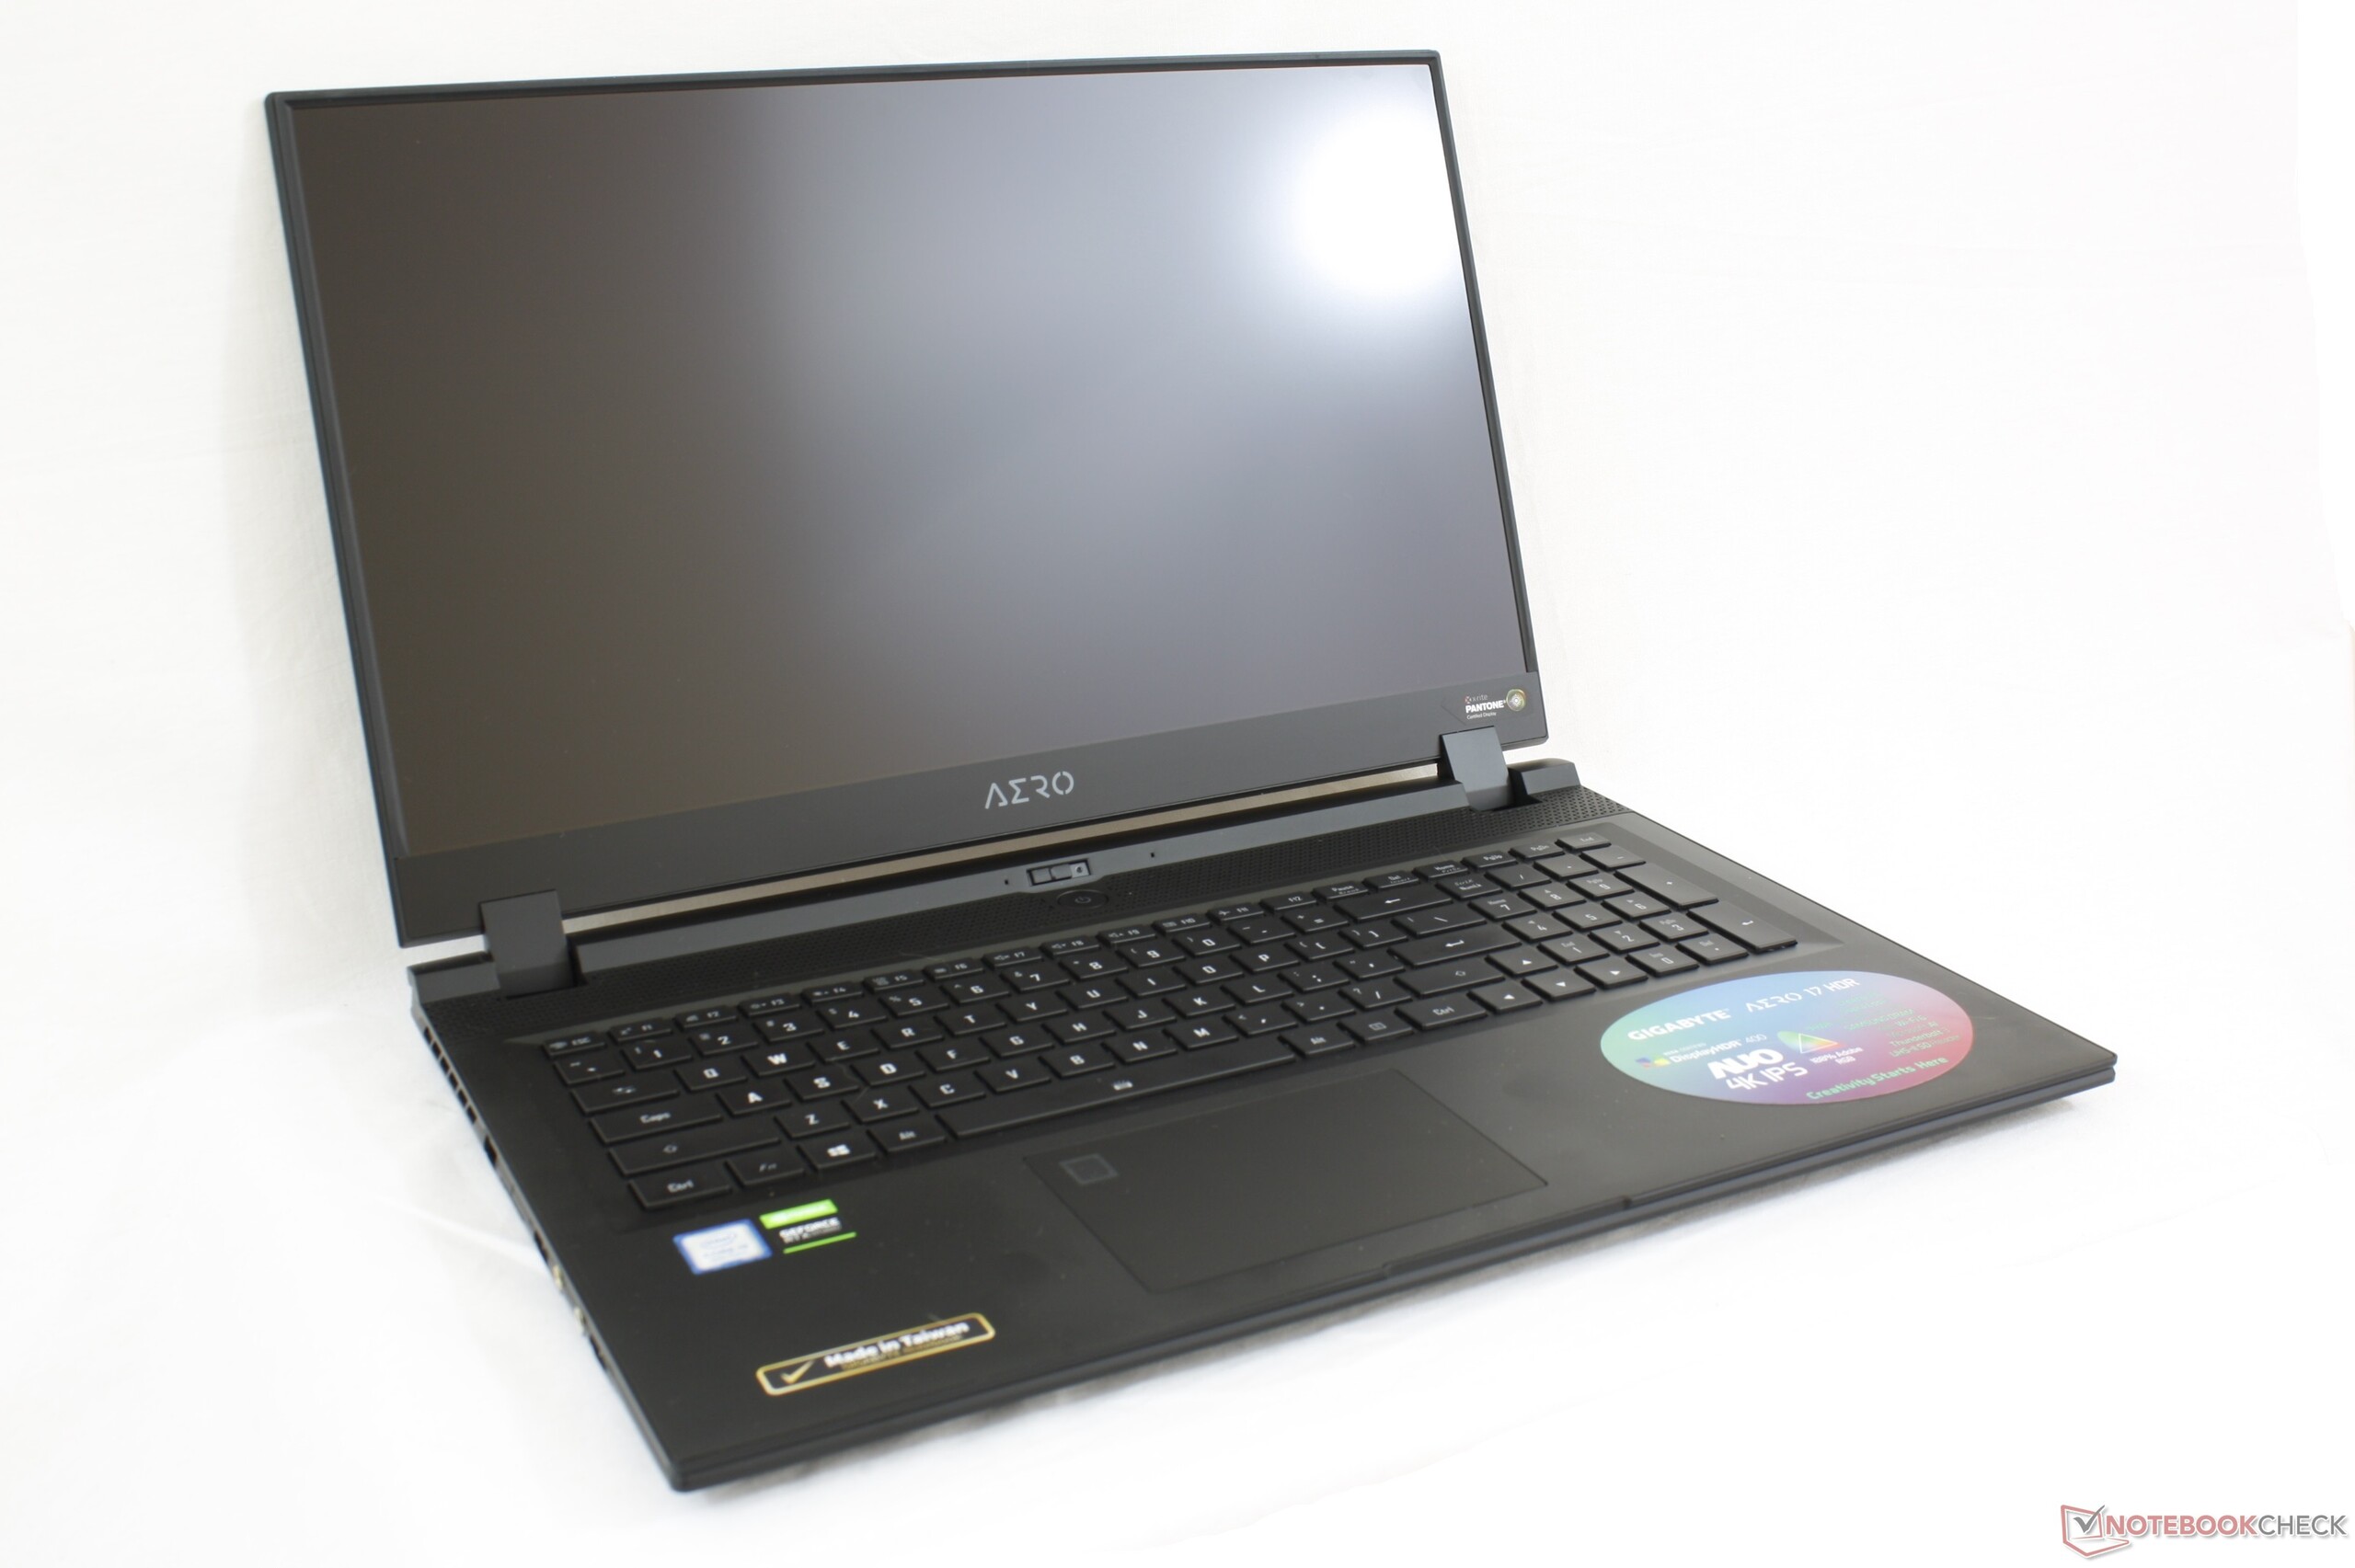
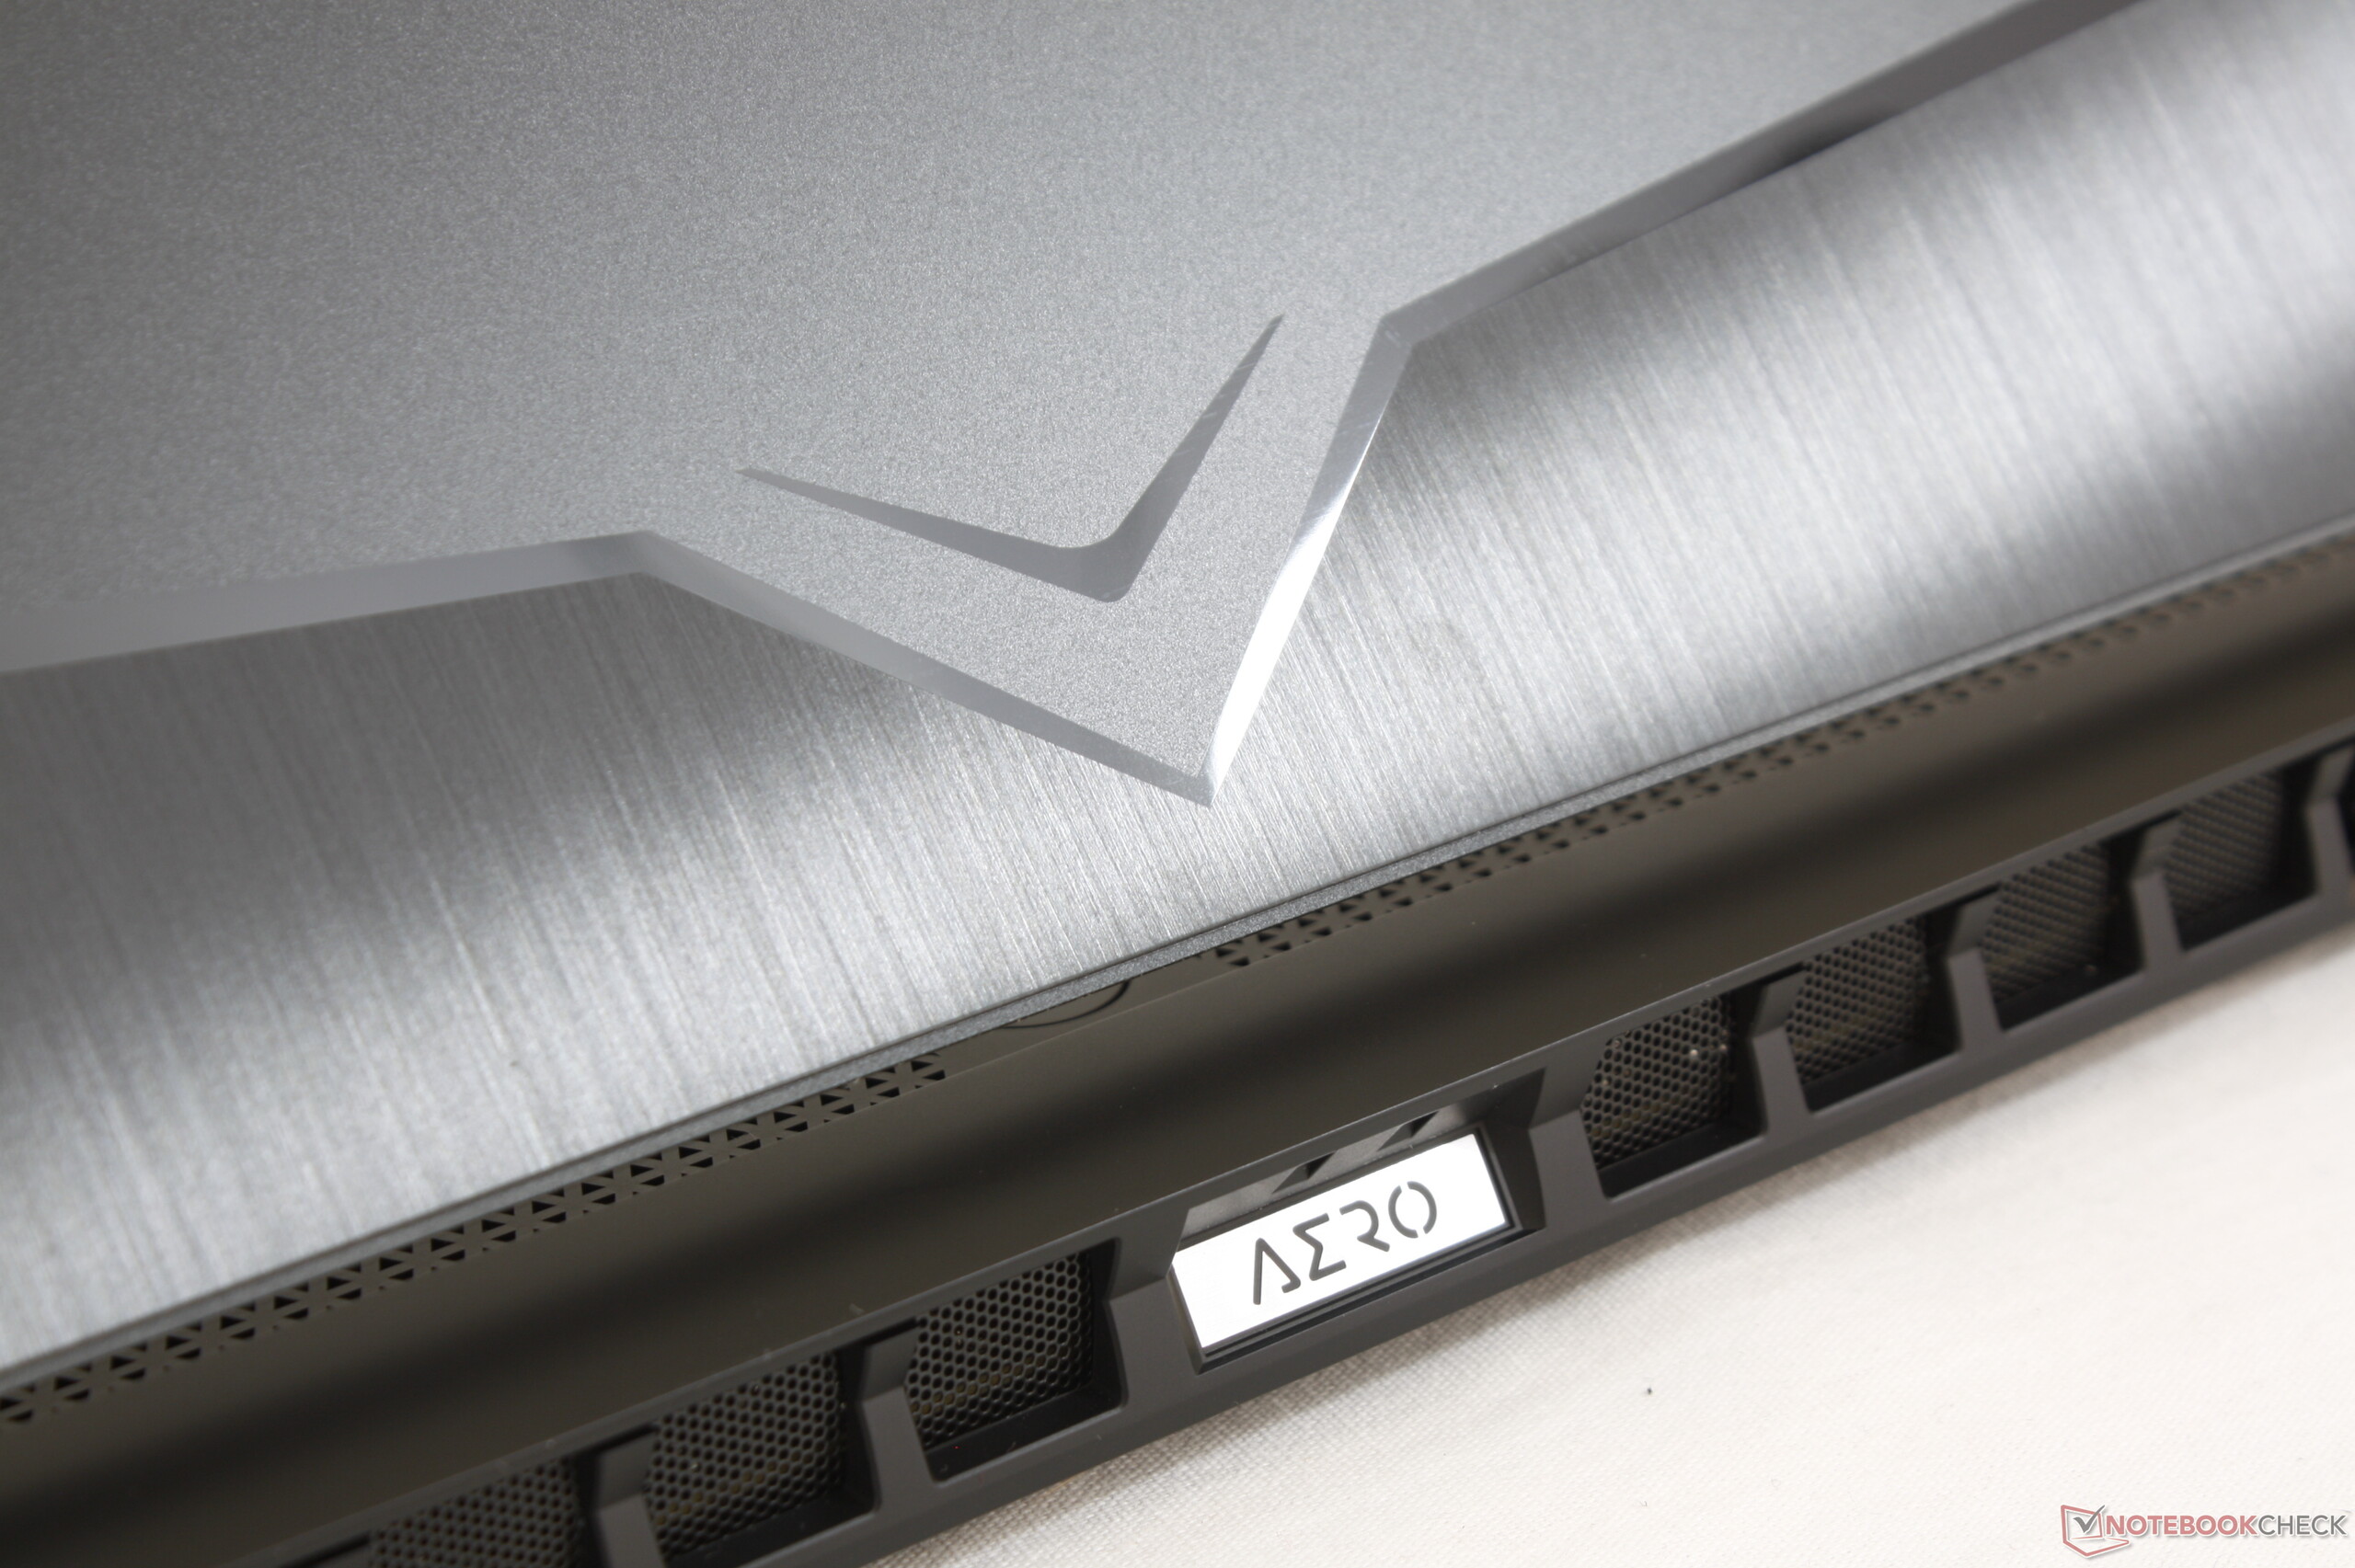
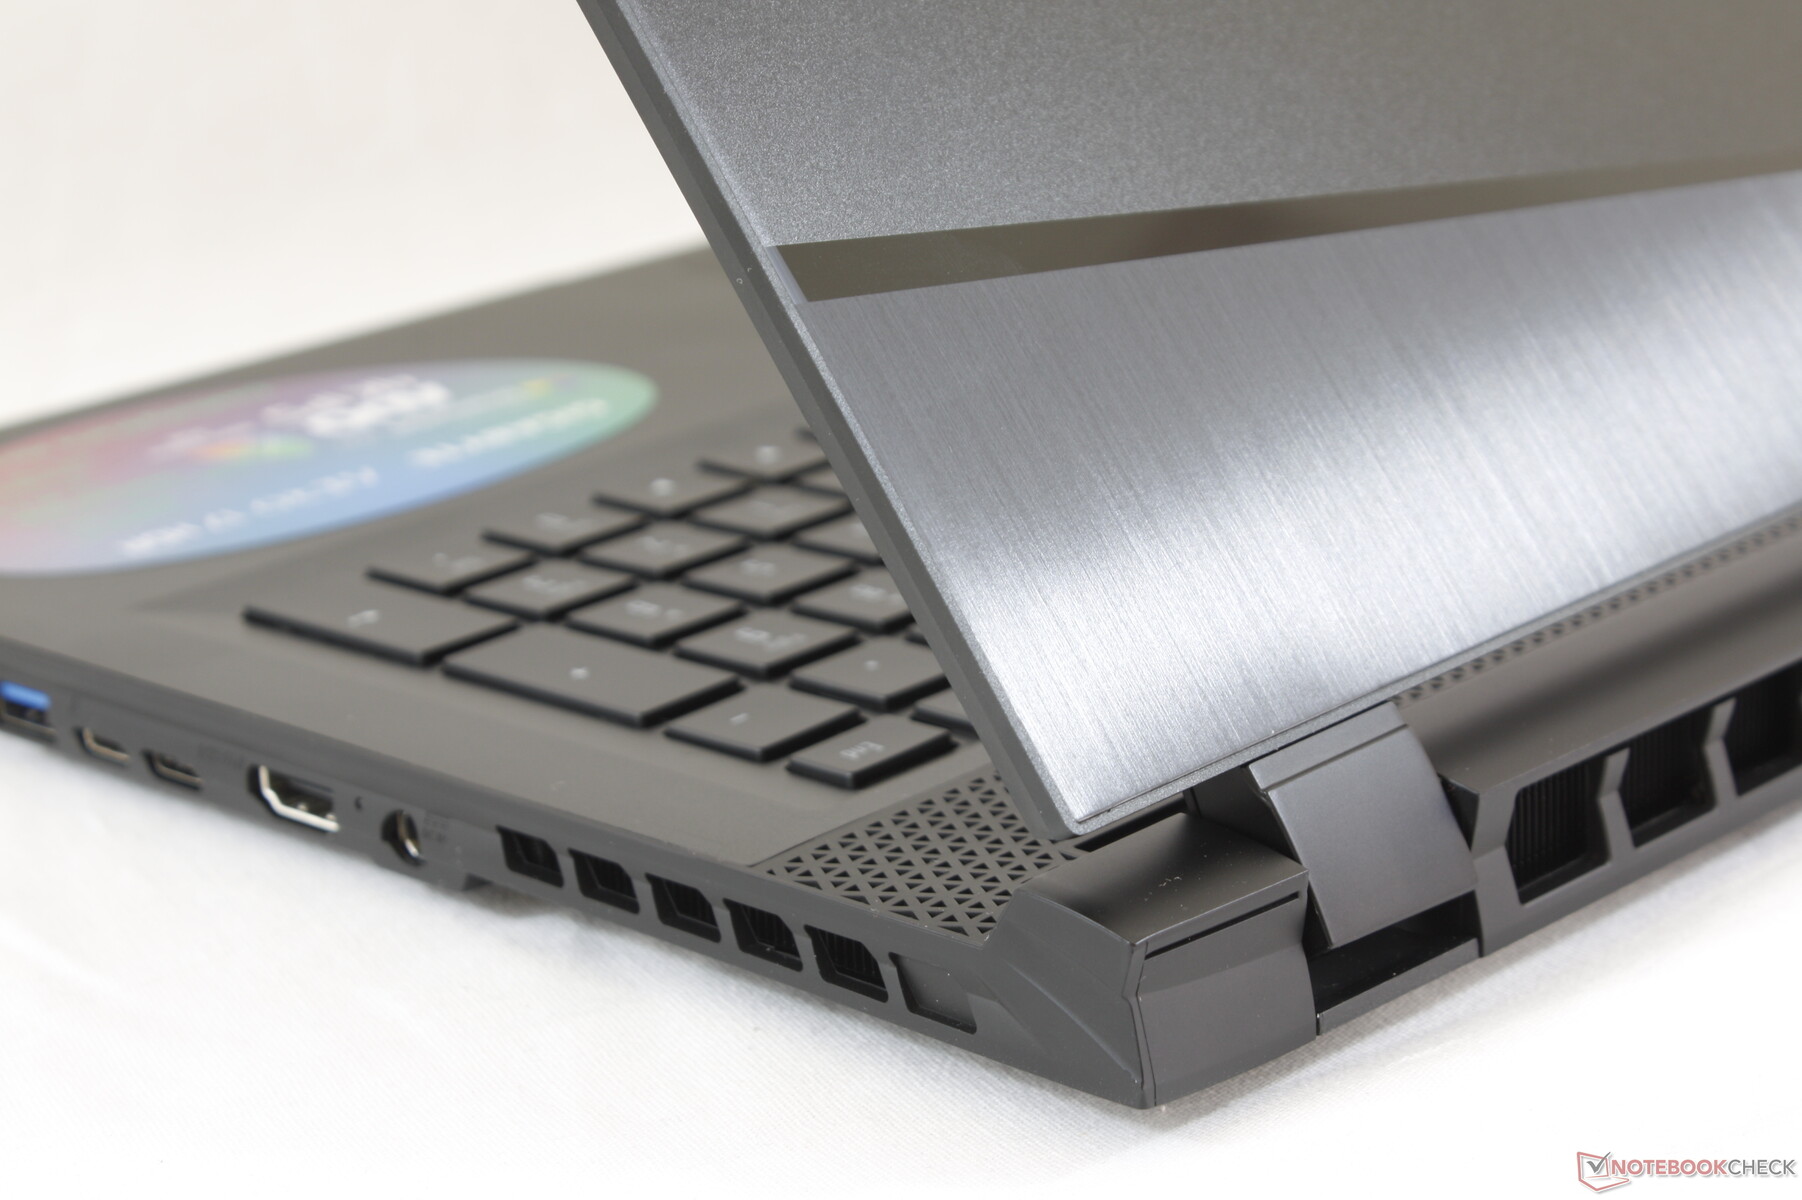
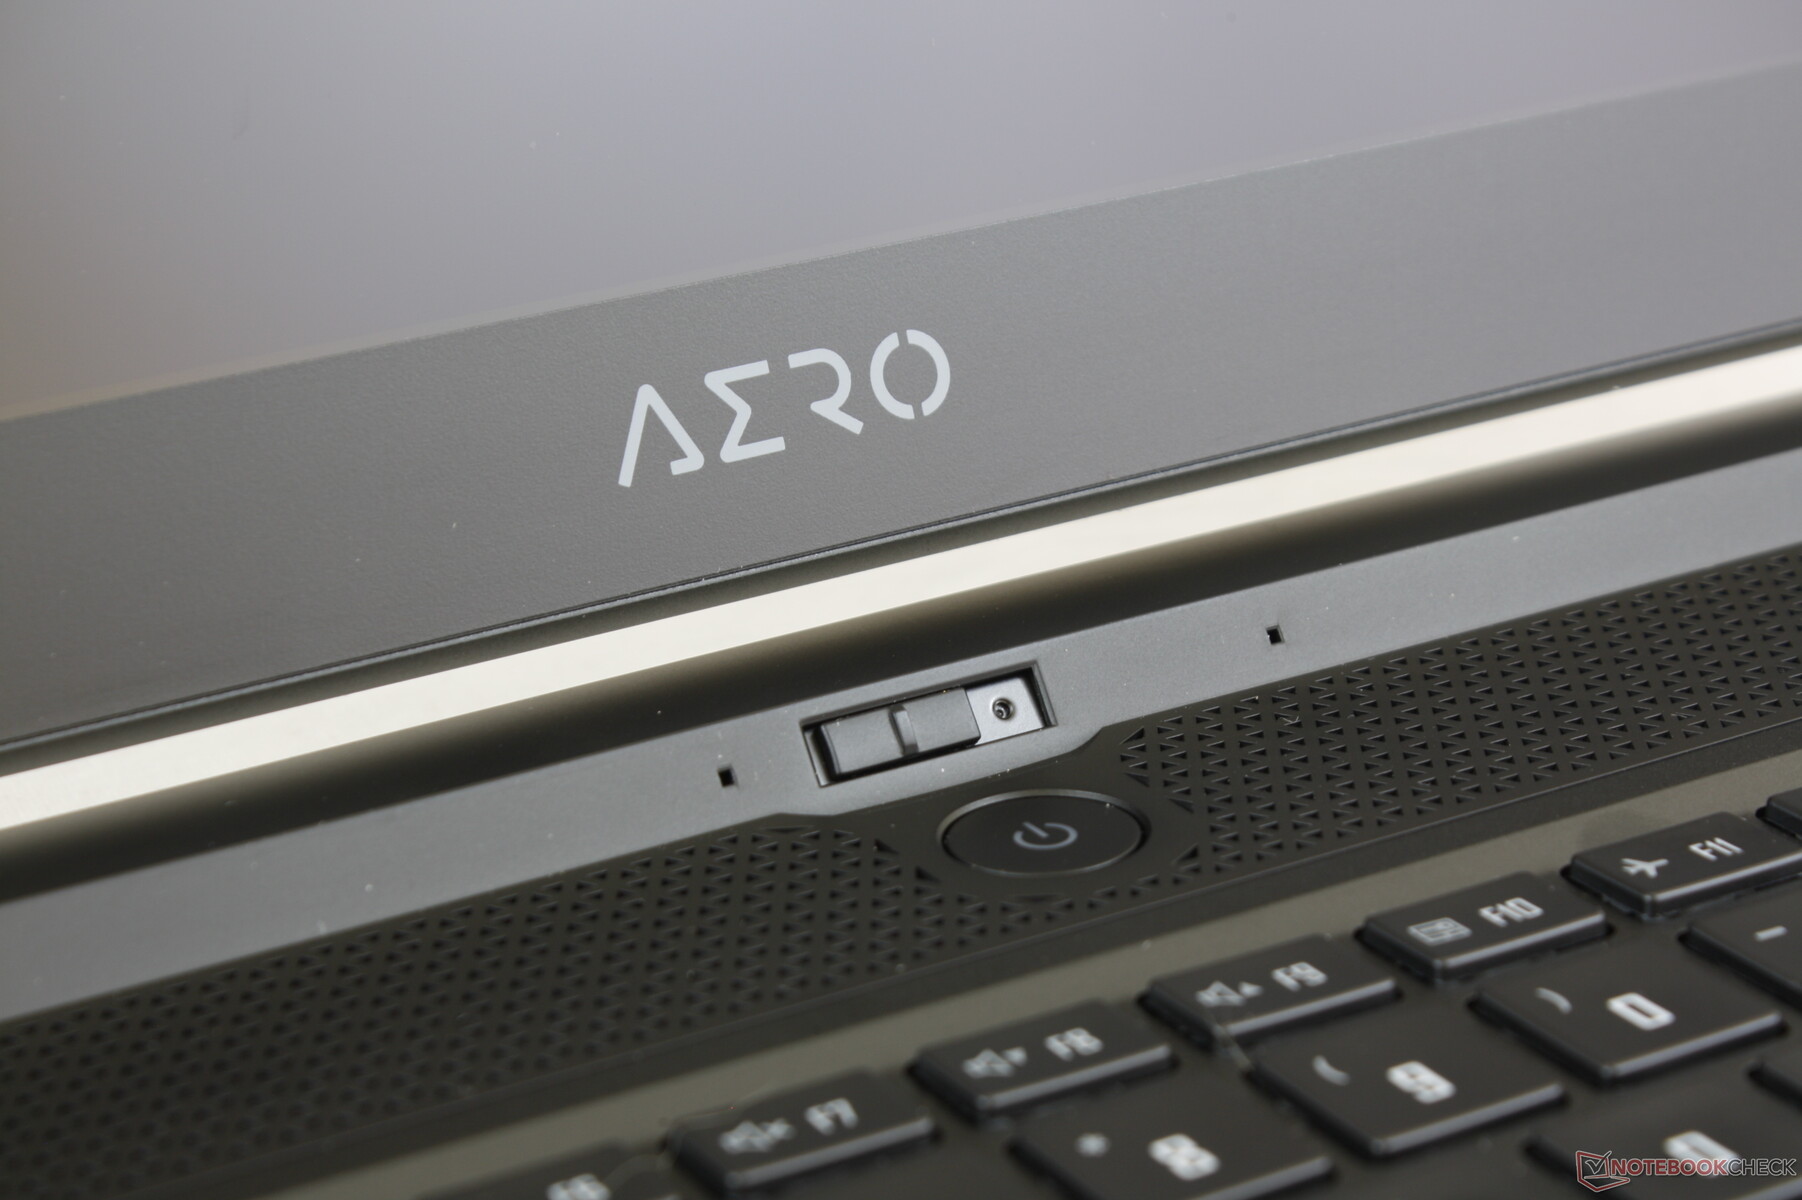
Case
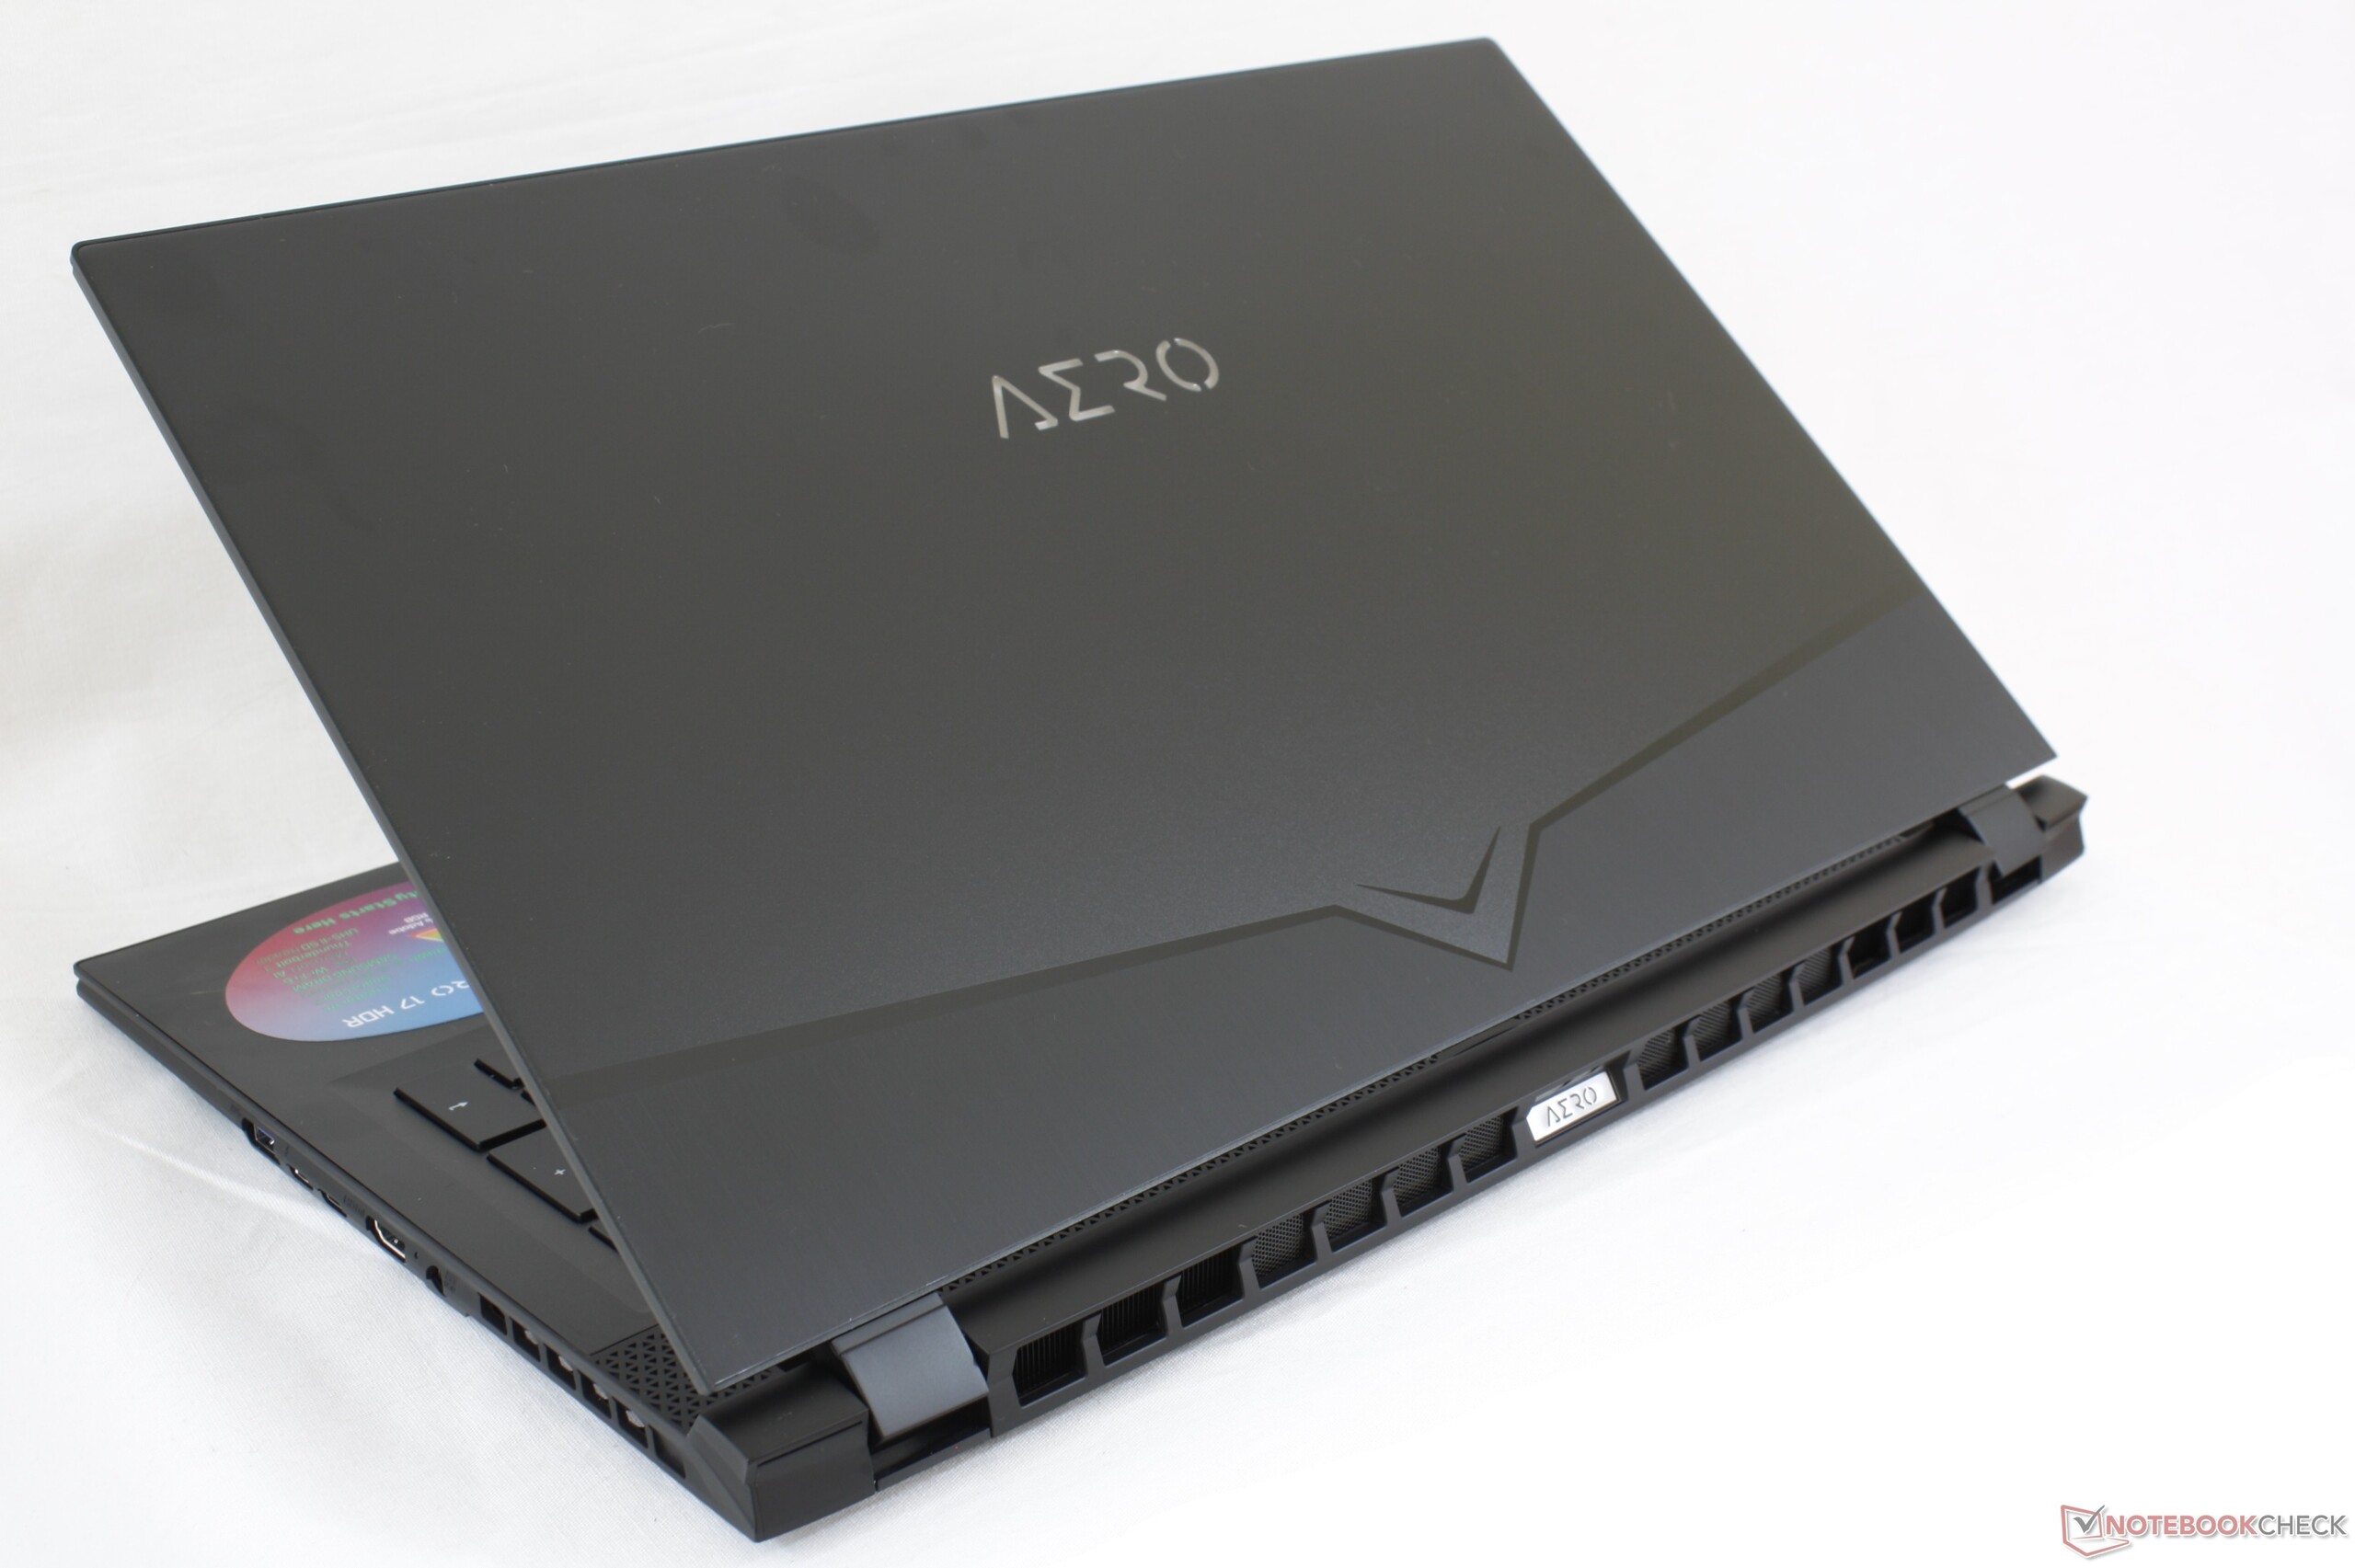
The Aero 17 shares the same compressed aluminum chassis design as its smaller Aero 15 sibling and so our existing comments still apply. Corners and edges are sharper and more defined around the rear when compared to something like the MSI GS75 or Asus Zephyrus GX531. Unlike the "gamery" Razer Blade Pro 17 series or the gaudy Alienware m17 series, the Aero 15 design manages to look natural in both professional and gamer settings alike.
Chassis rigidity is excellent and comparable to the Alienware m17 while being significantly smaller. The system exhibits less twisting, warping, and creaking than the aforementioned MSI or Asus for very strong first impressions. On the other hand, we still have to give the small edge to Razer and its Blade Pro 17 because pressing down on the palm rests, keyboard center, or outer lid of the Aero 17 will show slightly more depressions.
Overall dimensions are very similar to the ultra-thin Asus Zephyrus S GX701 with differences of only 2 to 3 millimeters at most. They even weigh about the same at 2.5 to 2.6 kg. While the Razer Blade Pro 17 is thinner and heavier for a denser feel and the MSI GS75 is even smaller and lighter, the Aero 17 is still much more portable than most other 17.3-inch laptops in the market.
Connectivity
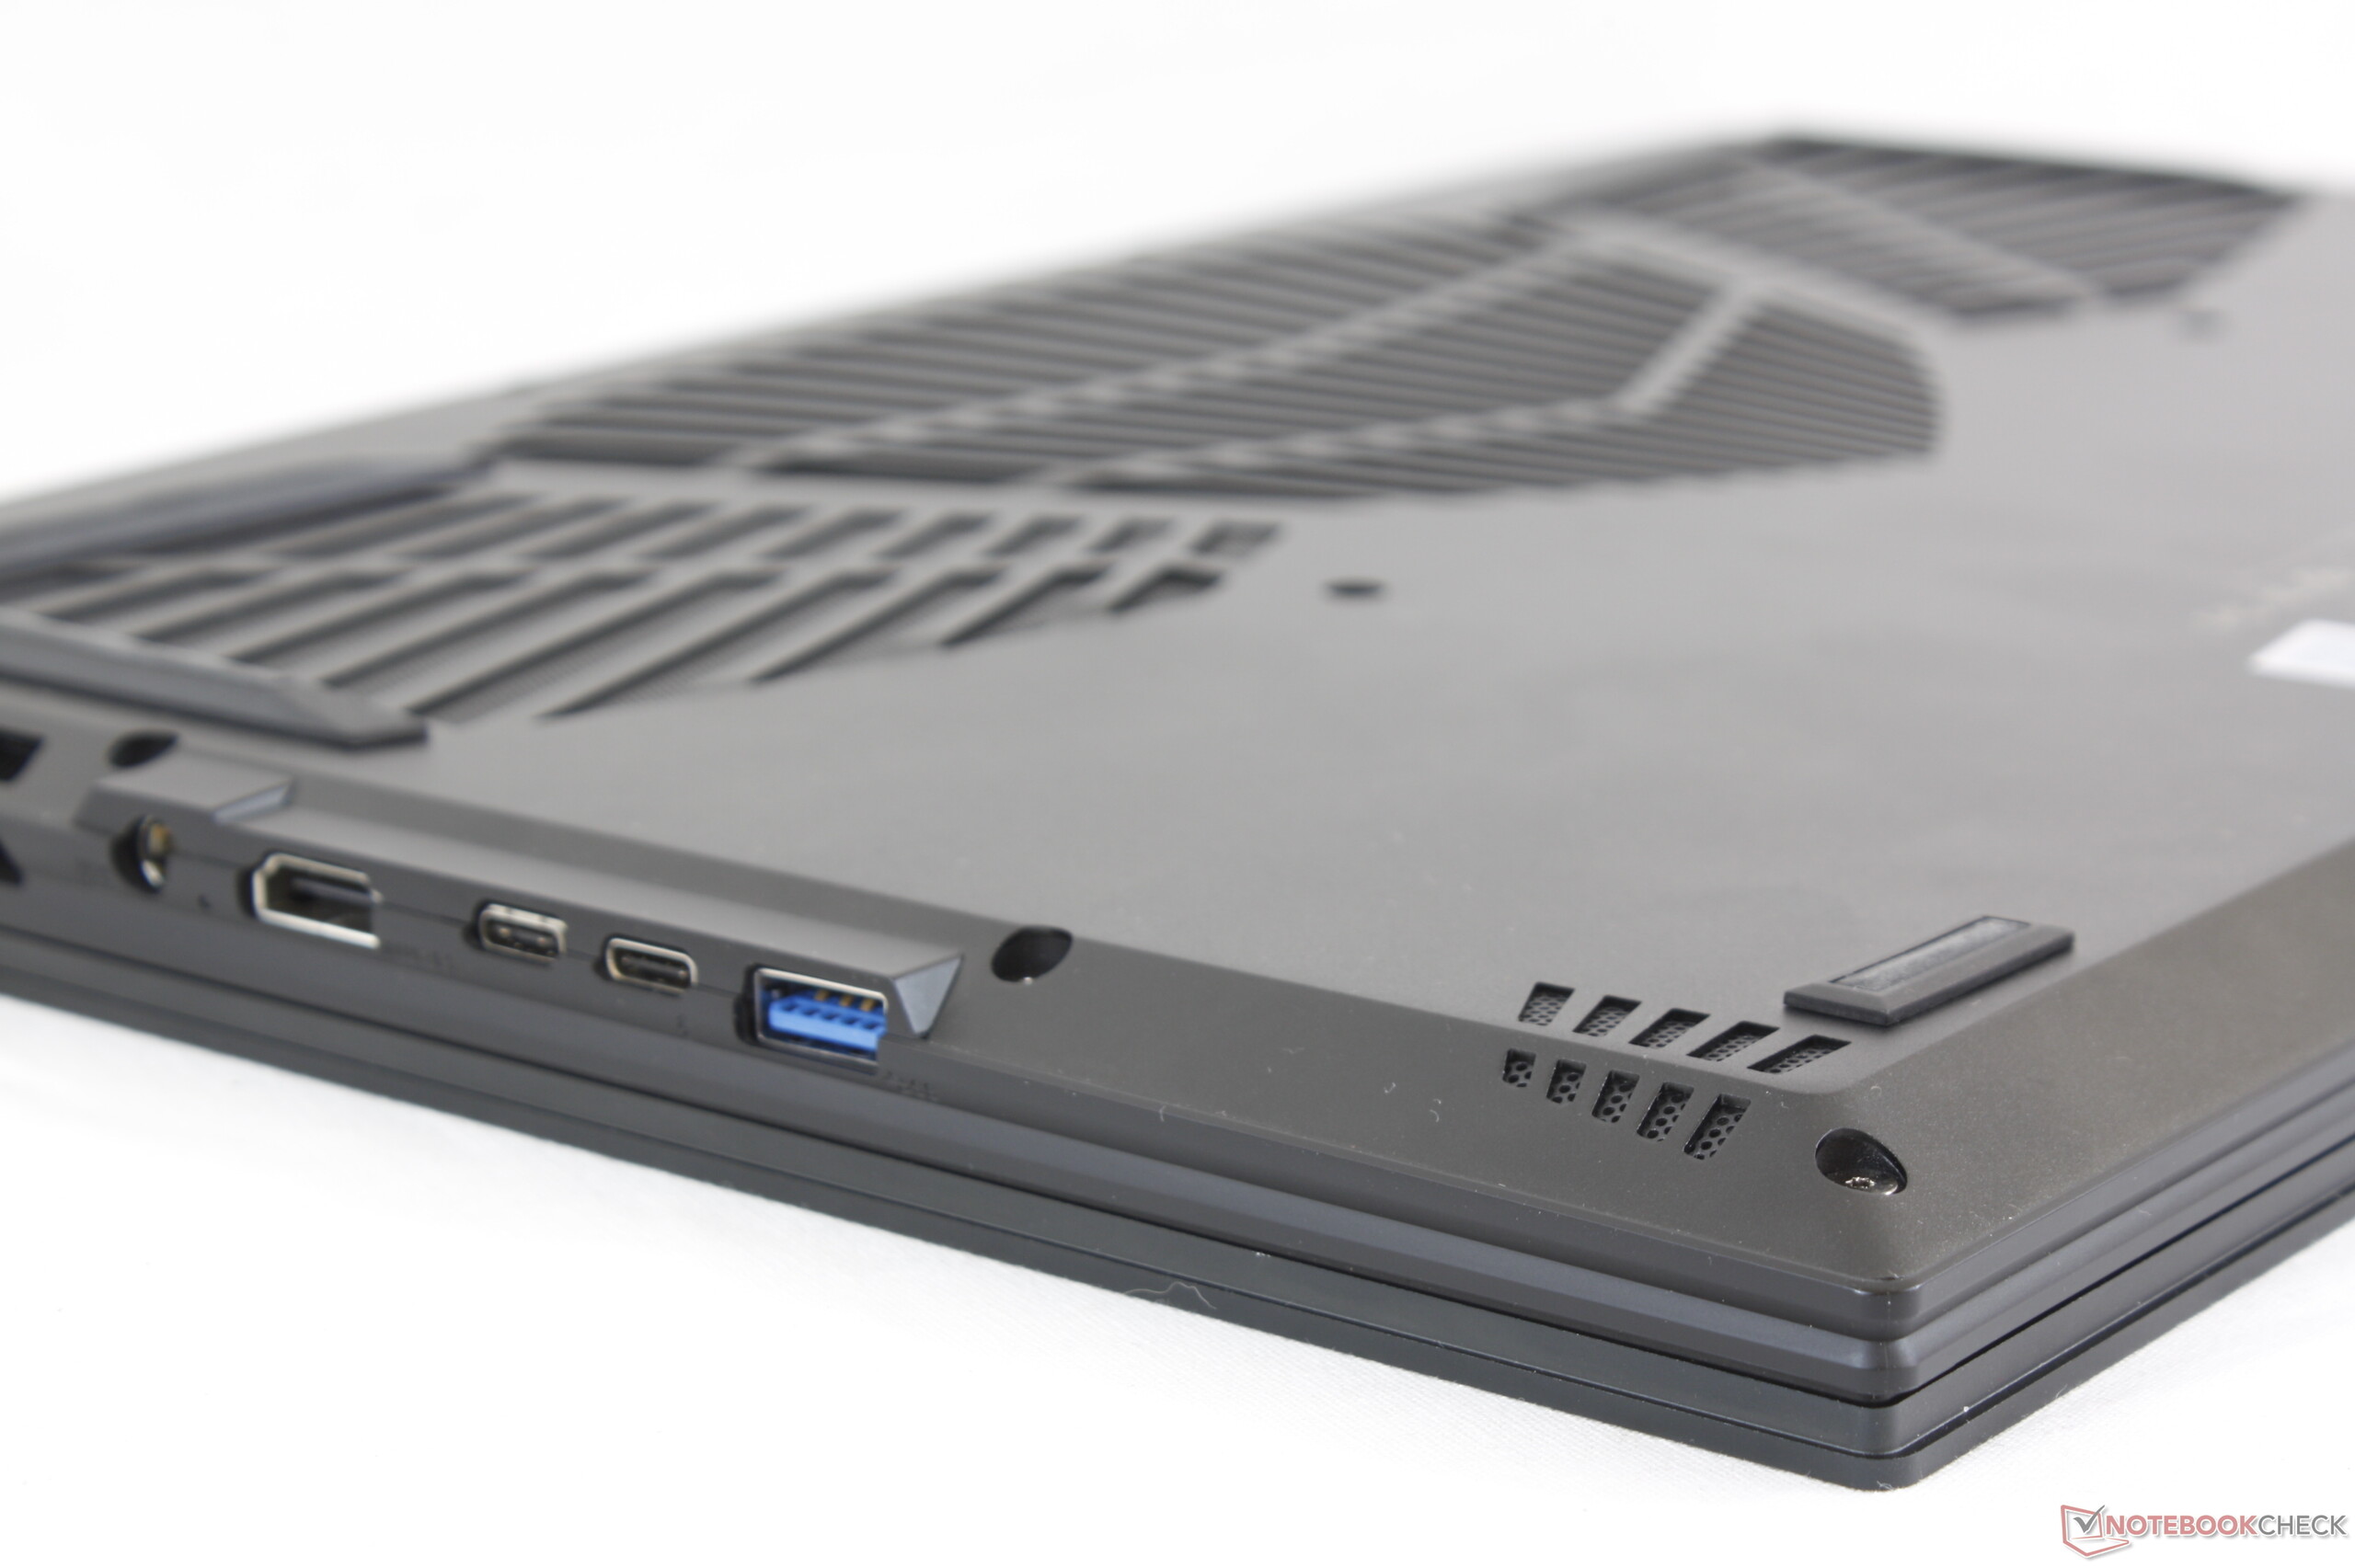
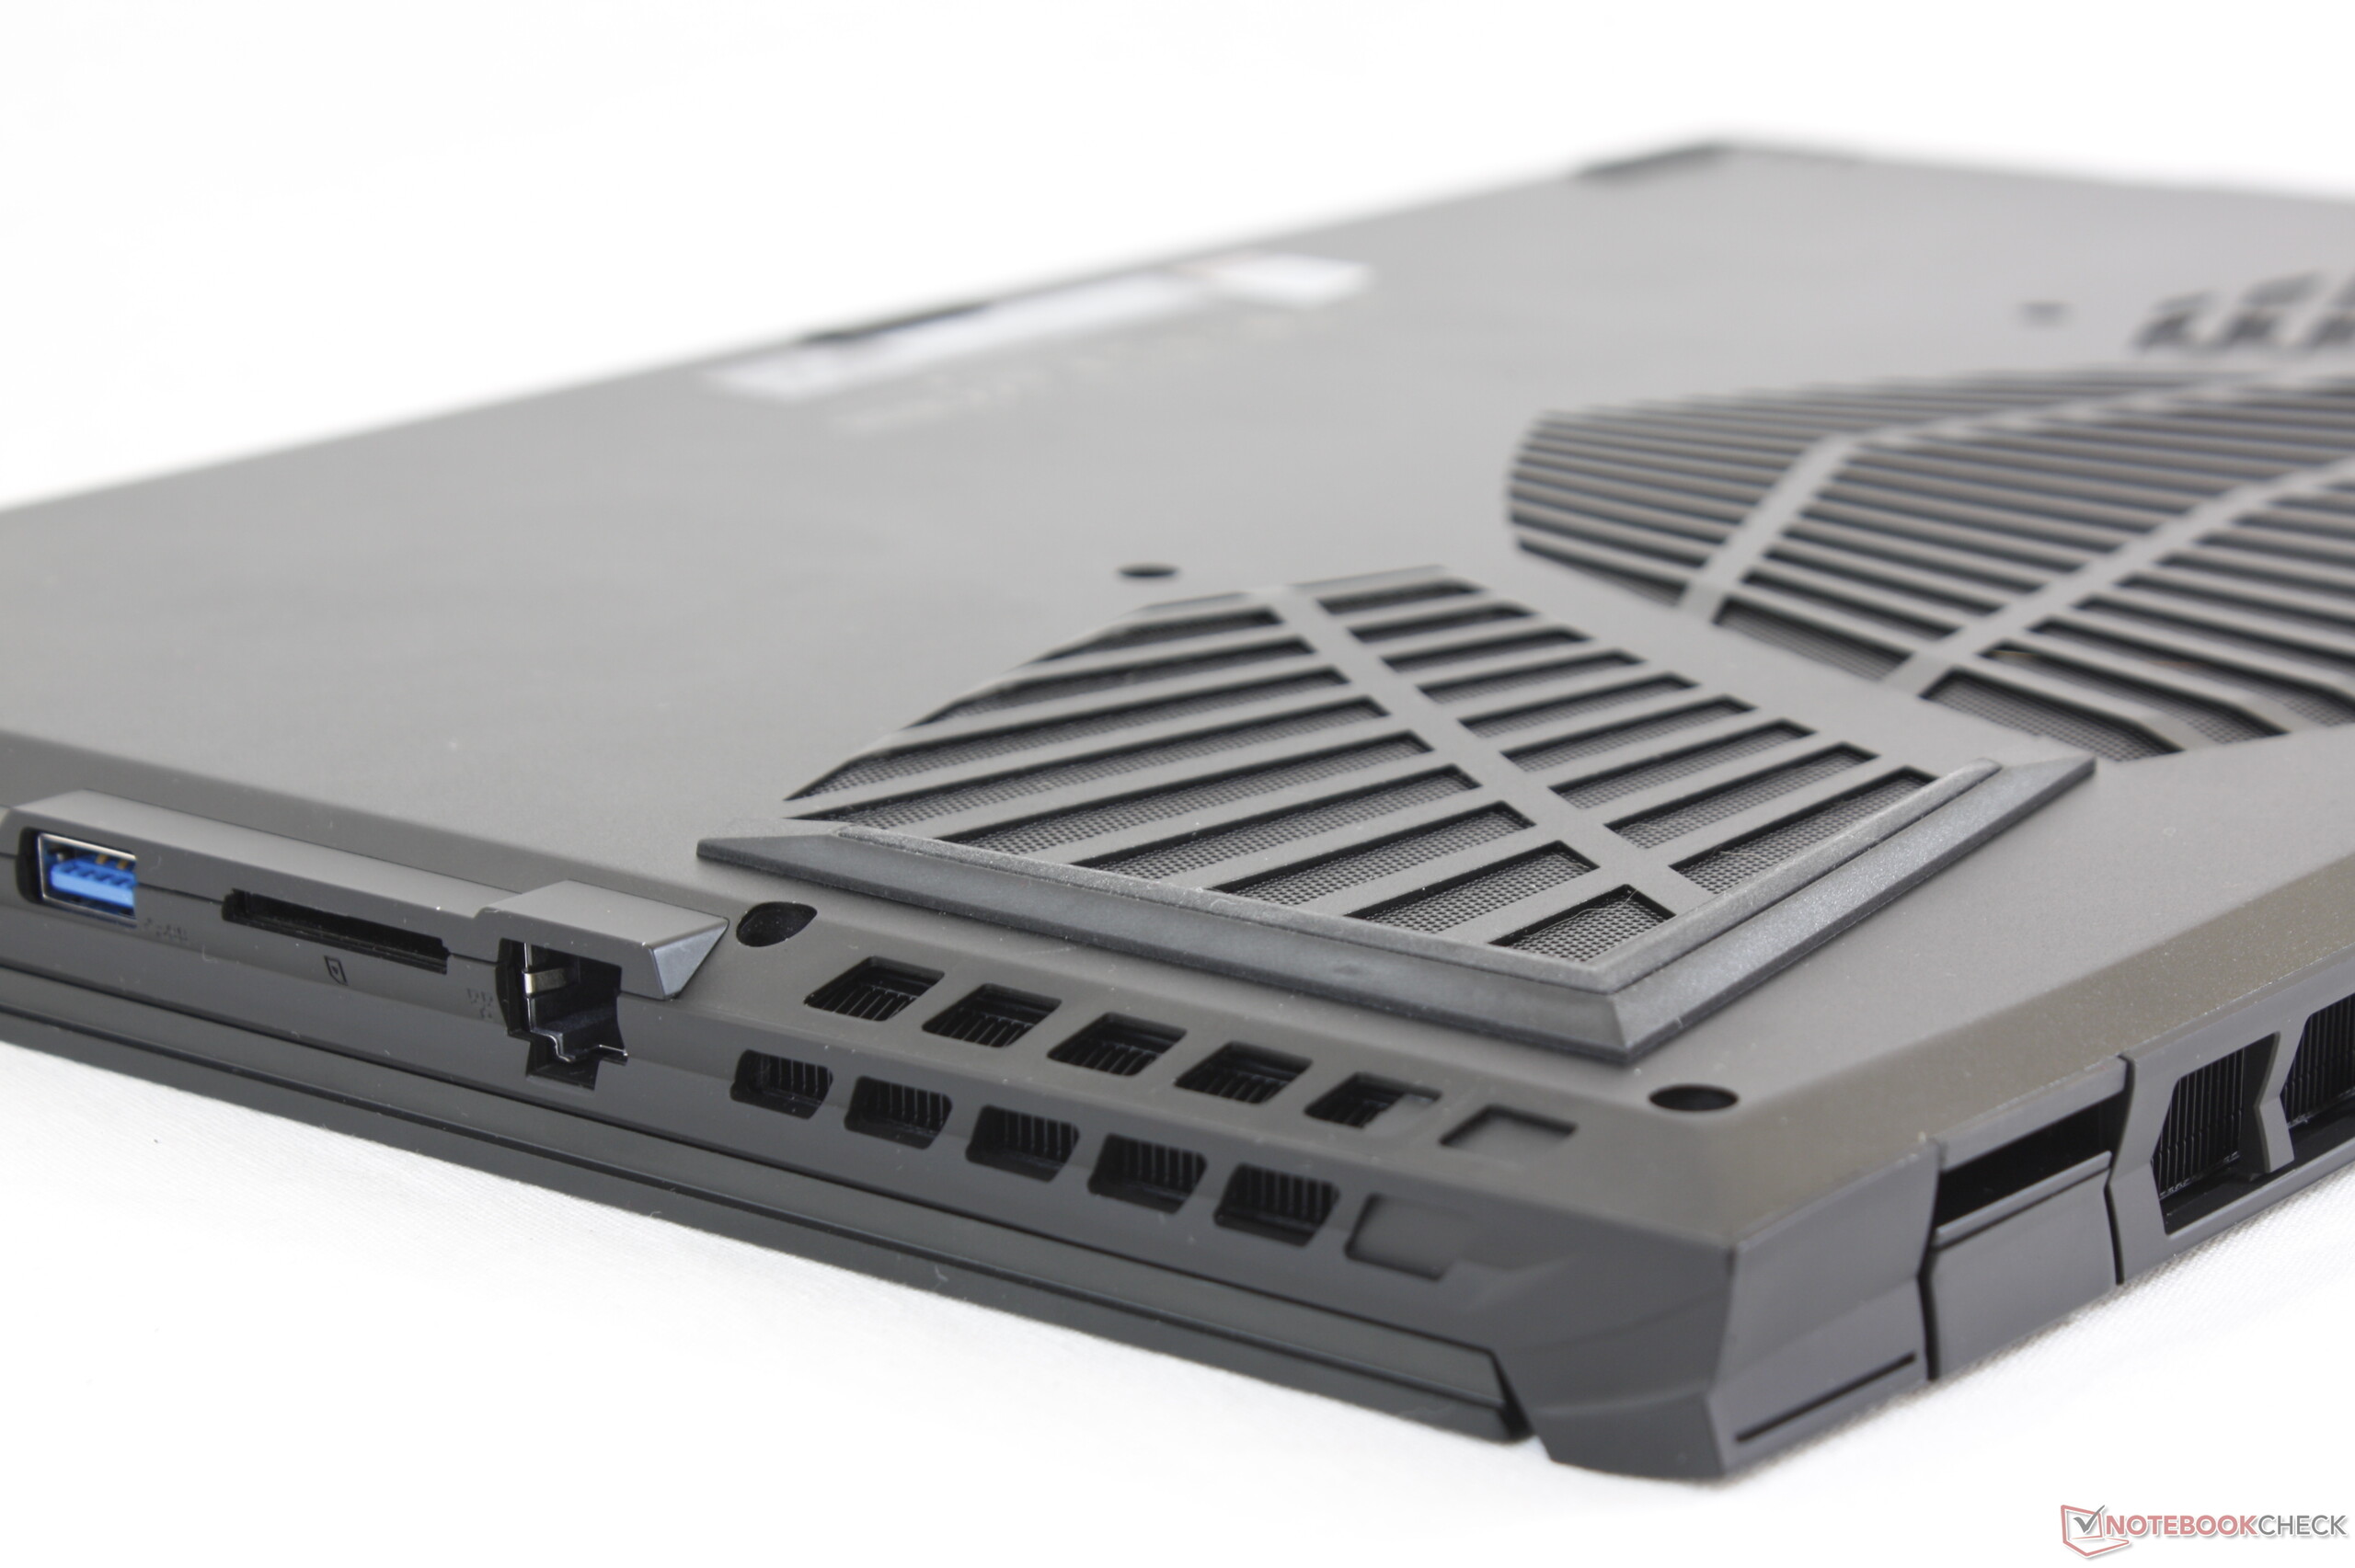
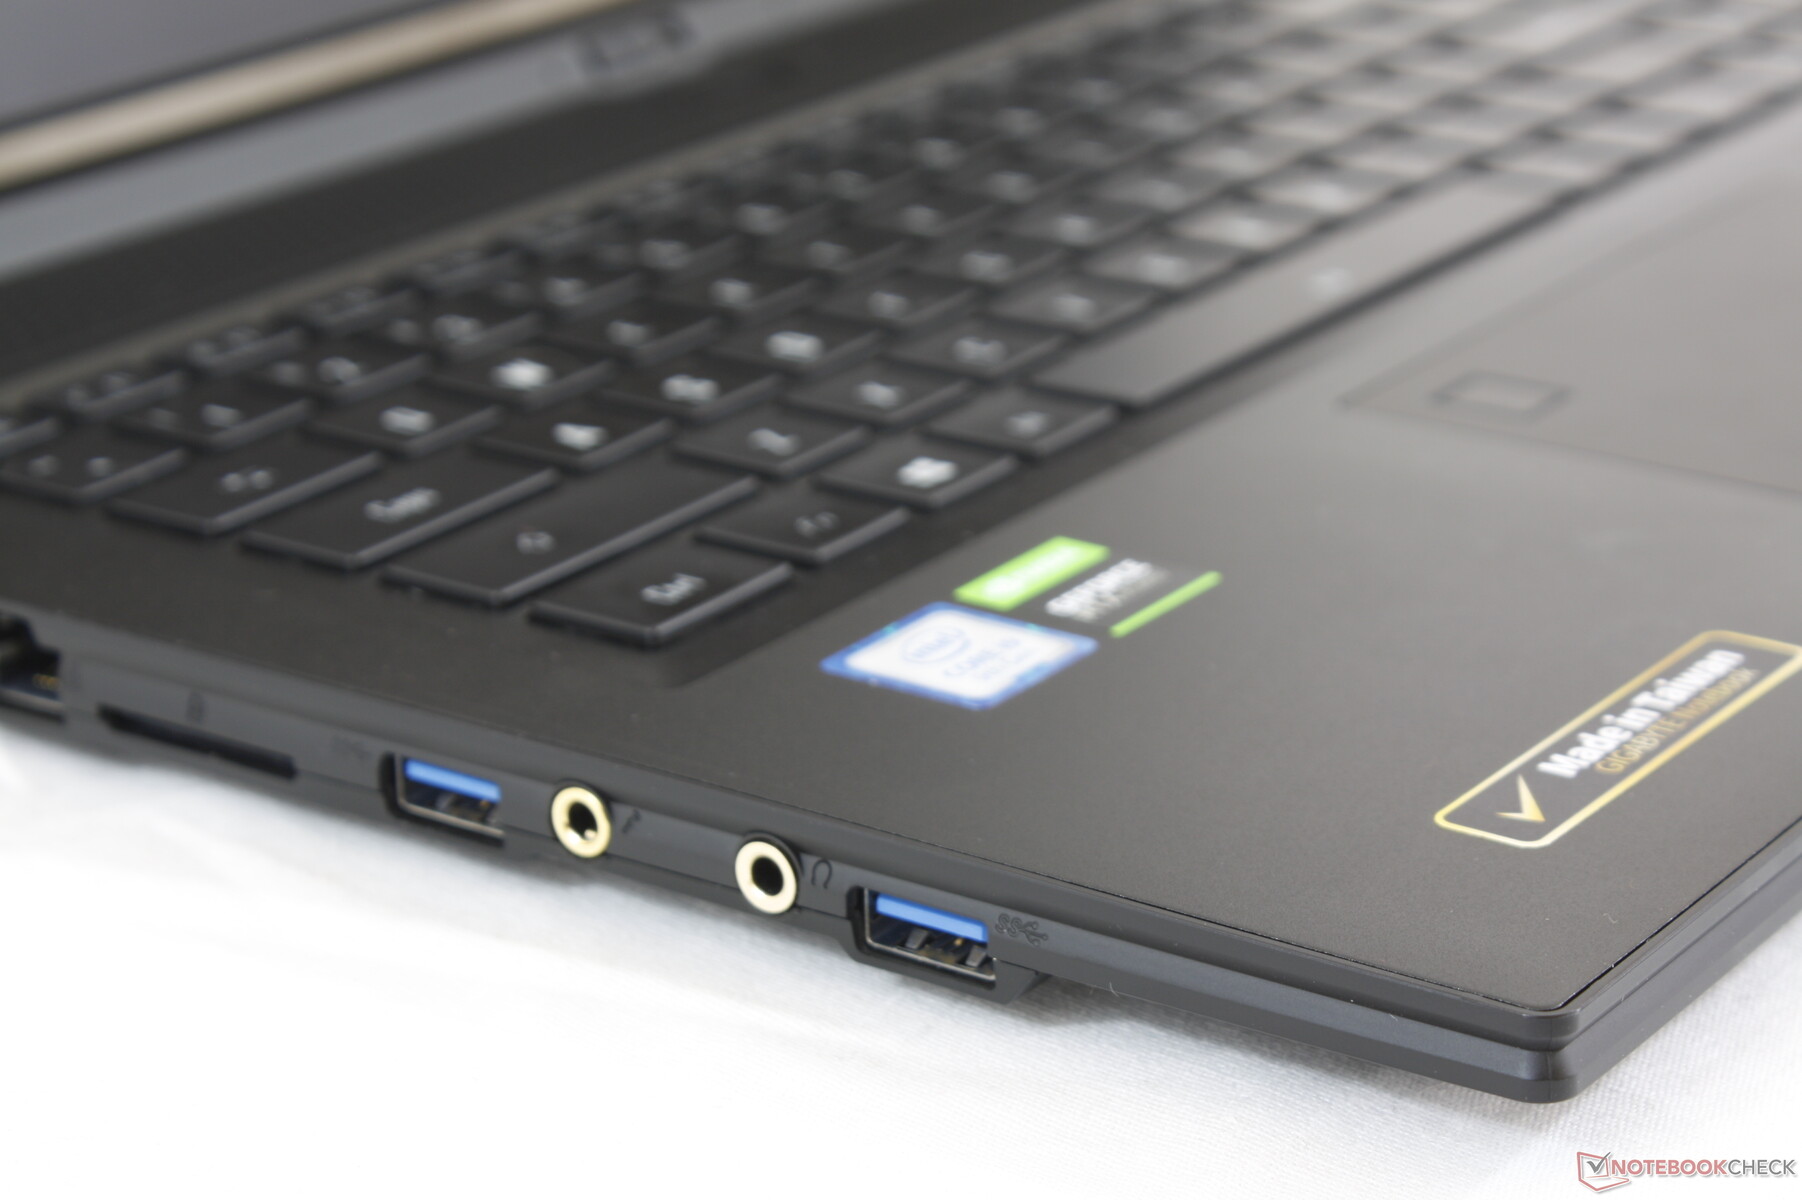
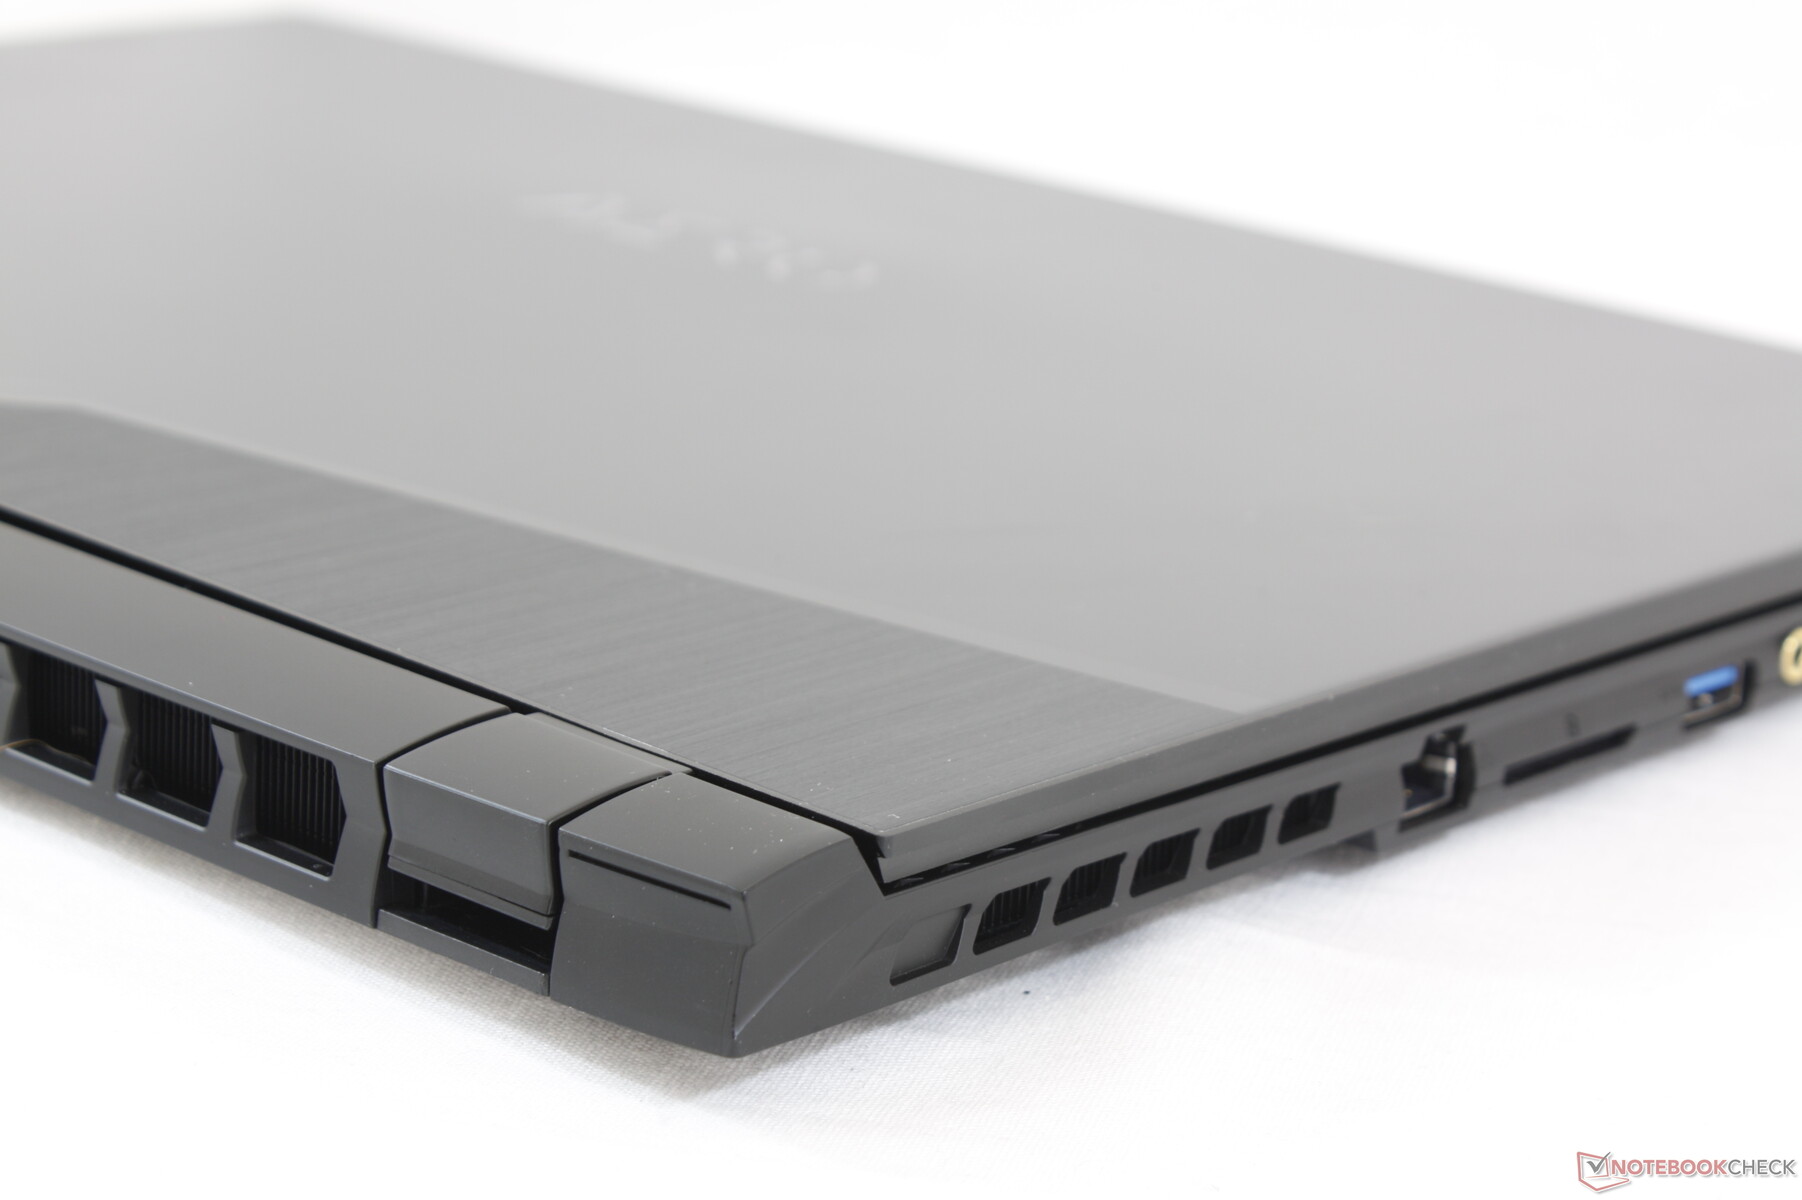
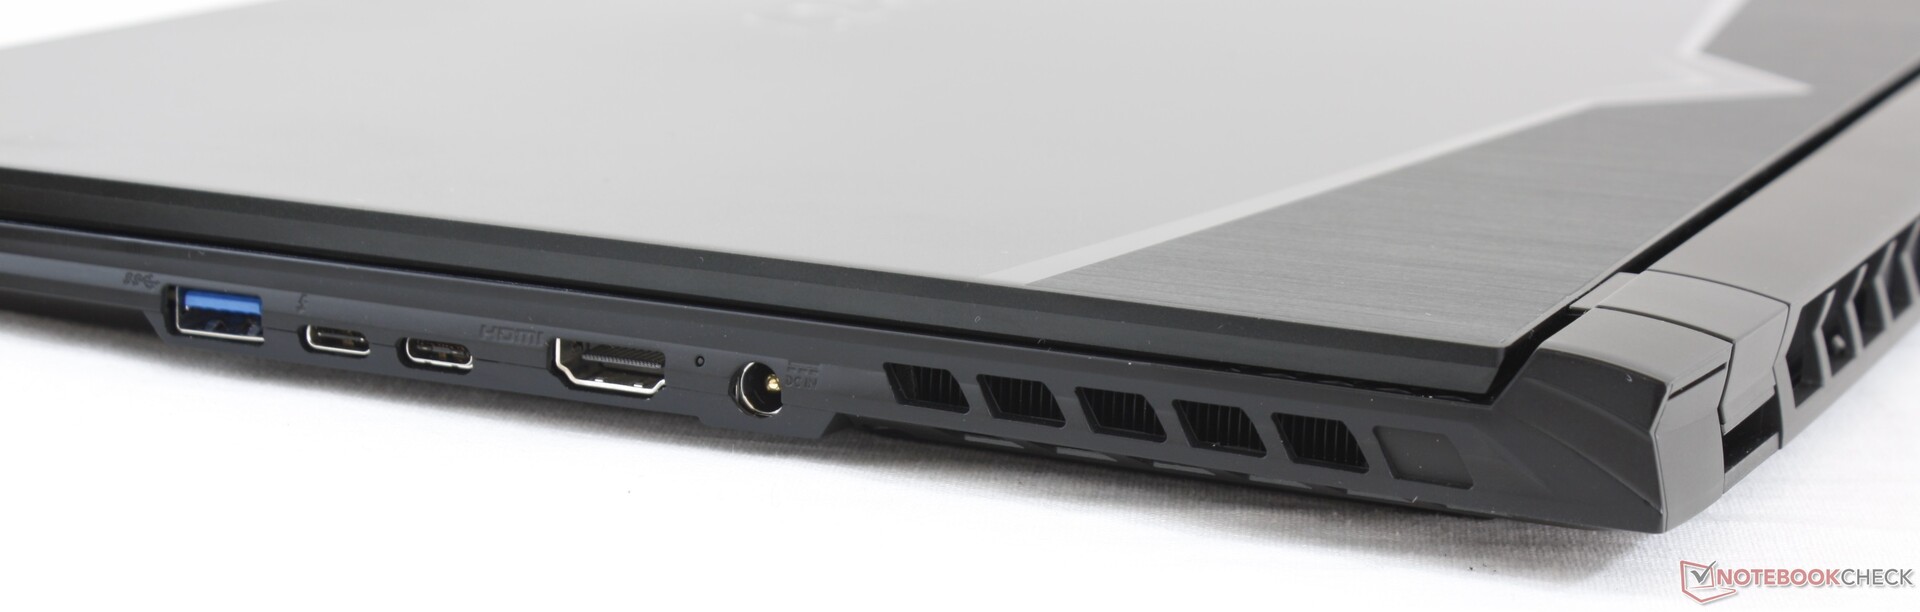
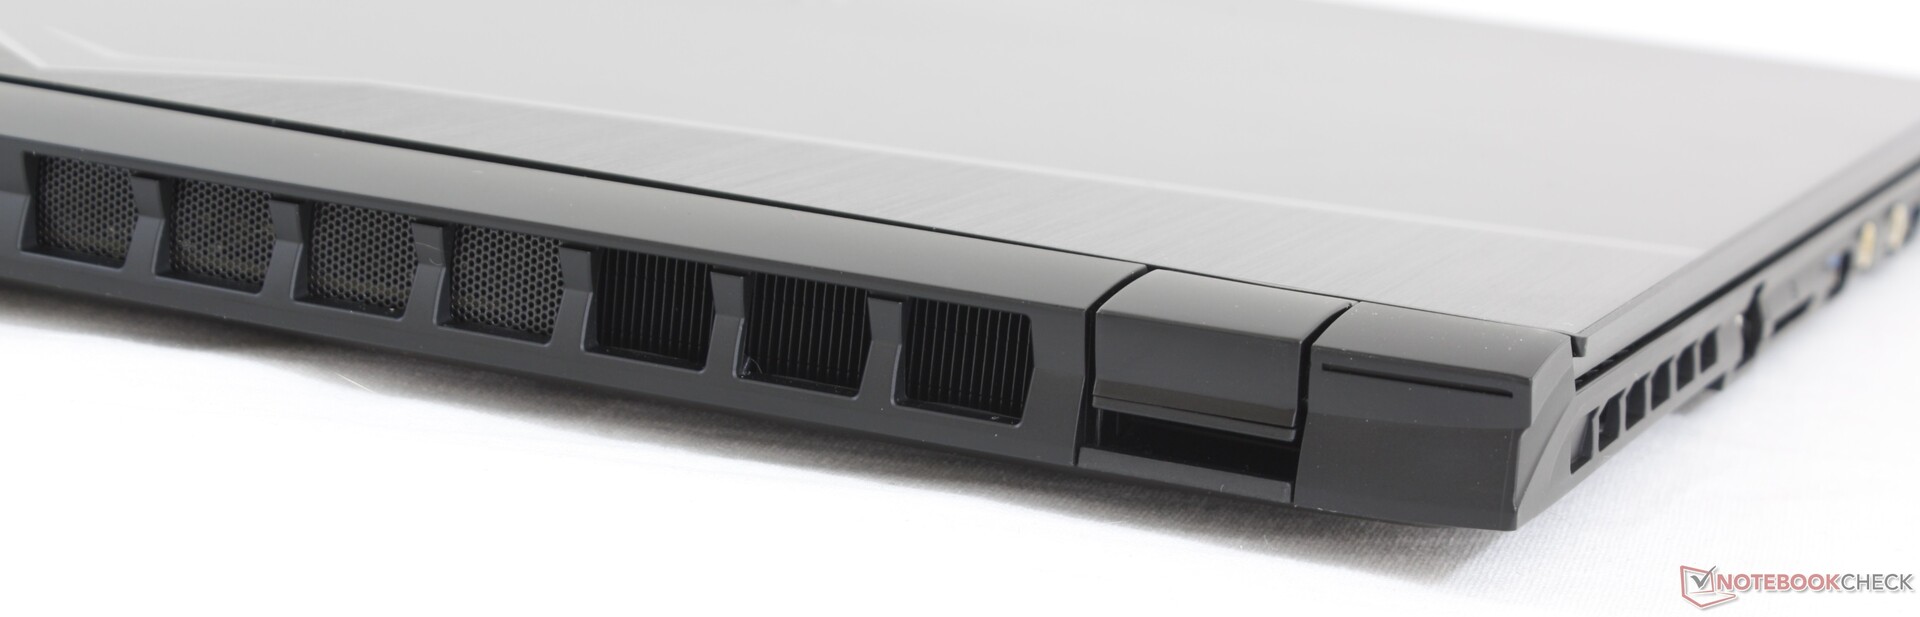
Port options cover the usual including USB Type-C, DisplayPort, HDMI, and Thunderbolt 3. Our main concern is the positioning of the ports as they are quite close to the front where cables can potentially get in the way. Furthermore, the ports along the right edge are tightly spaced meaning that thicker USB Type-C cables or adapters can block an adjacent port.
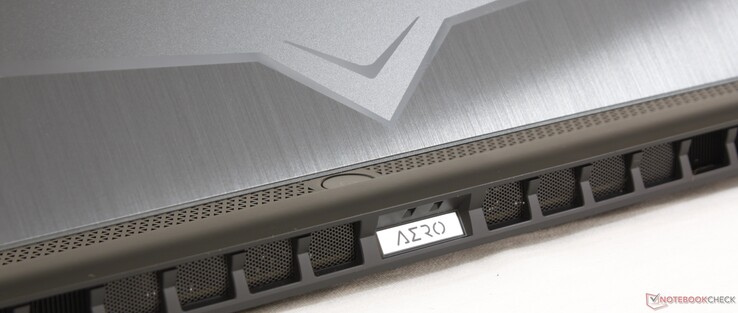
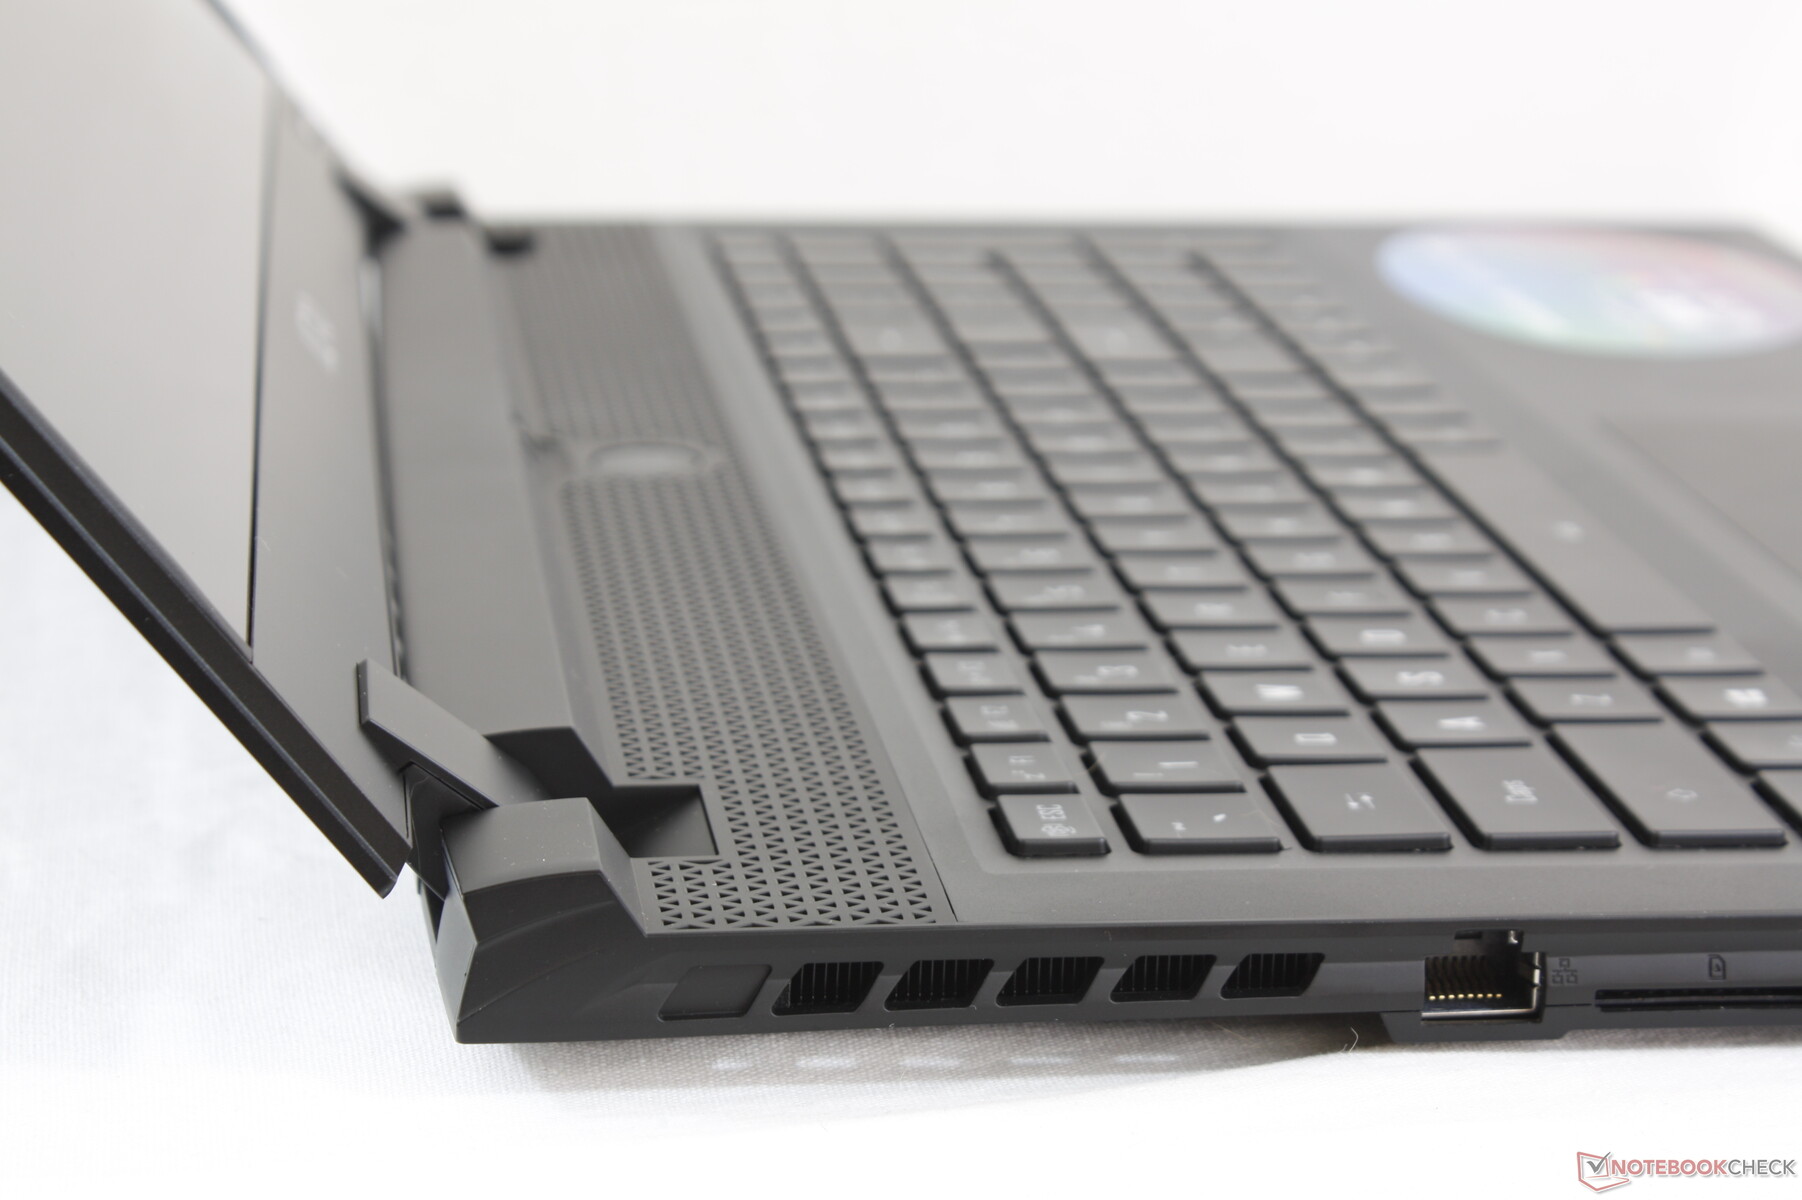
There are no ports along the rear since its entire length has been dedicated to cooling.
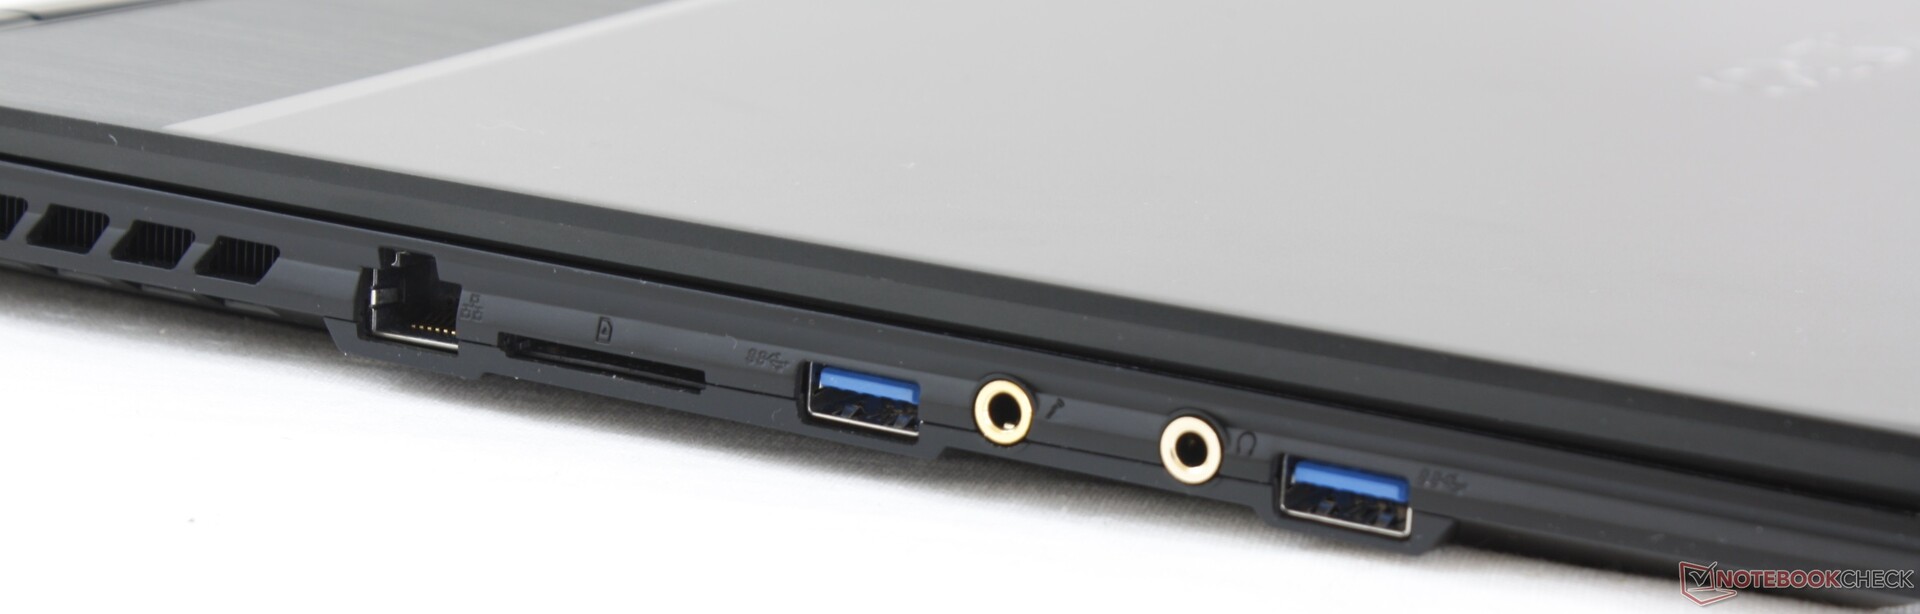
SD Card Reader
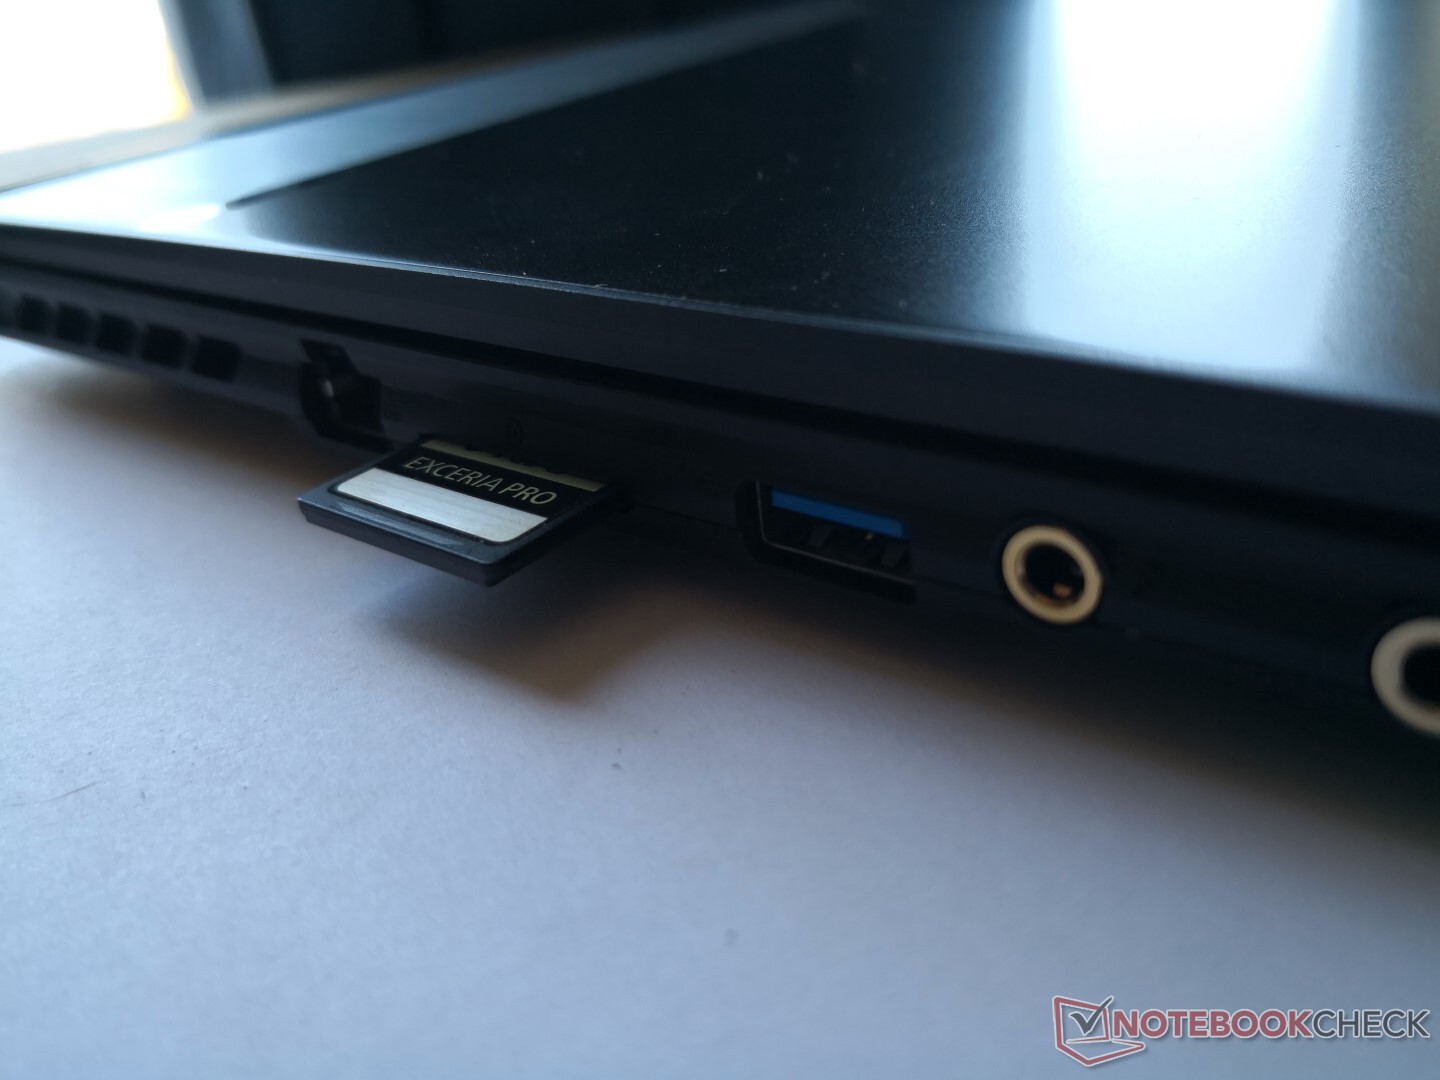
The integrated card reader offers fast read rates of up to 238 MB/s to be able to move 1 GB worth of images from our UHS-II test card to desktop in about 5 seconds. Our main issue with the reader is that it is not spring-loaded and so a fully inserted card will still protrude by almost half its length for unsafe transporting. In comparison, most other 17.3-inch laptops with card readers will house the SD card flush against the edge.
| SD Card Reader | |
| average JPG Copy Test (av. of 3 runs) | |
| Gigabyte Aero 17 XA RP77 (Toshiba Exceria Pro SDXC 64 GB UHS-II) | |
| Aorus X7 DT v8 (Toshiba Exceria Pro SDXC 64 GB UHS-II) | |
| Razer Blade Pro 17 RTX 2080 Max-Q (Toshiba Exceria Pro SDXC 64 GB UHS-II) | |
| MSI GS73 Stealth 8RF-011 (Toshiba Exceria Pro SDXC 64 GB UHS-II) | |
| Dell Inspiron 7390 2-in-1 (Toshiba Exceria Pro M501 UHS-II) | |
| maximum AS SSD Seq Read Test (1GB) | |
| Aorus X7 DT v8 (Toshiba Exceria Pro SDXC 64 GB UHS-II) | |
| Gigabyte Aero 17 XA RP77 (Toshiba Exceria Pro SDXC 64 GB UHS-II) | |
| MSI GS73 Stealth 8RF-011 (Toshiba Exceria Pro SDXC 64 GB UHS-II) | |
| Razer Blade Pro 17 RTX 2080 Max-Q (Toshiba Exceria Pro SDXC 64 GB UHS-II) | |
| Dell Inspiron 7390 2-in-1 (Toshiba Exceria Pro M501 UHS-II) | |
Communication
The Aero 17 series is Wi-Fi 6 ready with its Killer AX1650 WLAN for theoretical transfer rates of up to 2.4 Gbps if your wireless router can support it. The AX1650 benefits from Killer Control Center 2.0 features not found on the standard Intel AX200.
We experienced no connectivity issues during our time with the unit. Performance can be faster than what we've recorded below as our test server is limited by a 1 Gbps line.
Maintenance
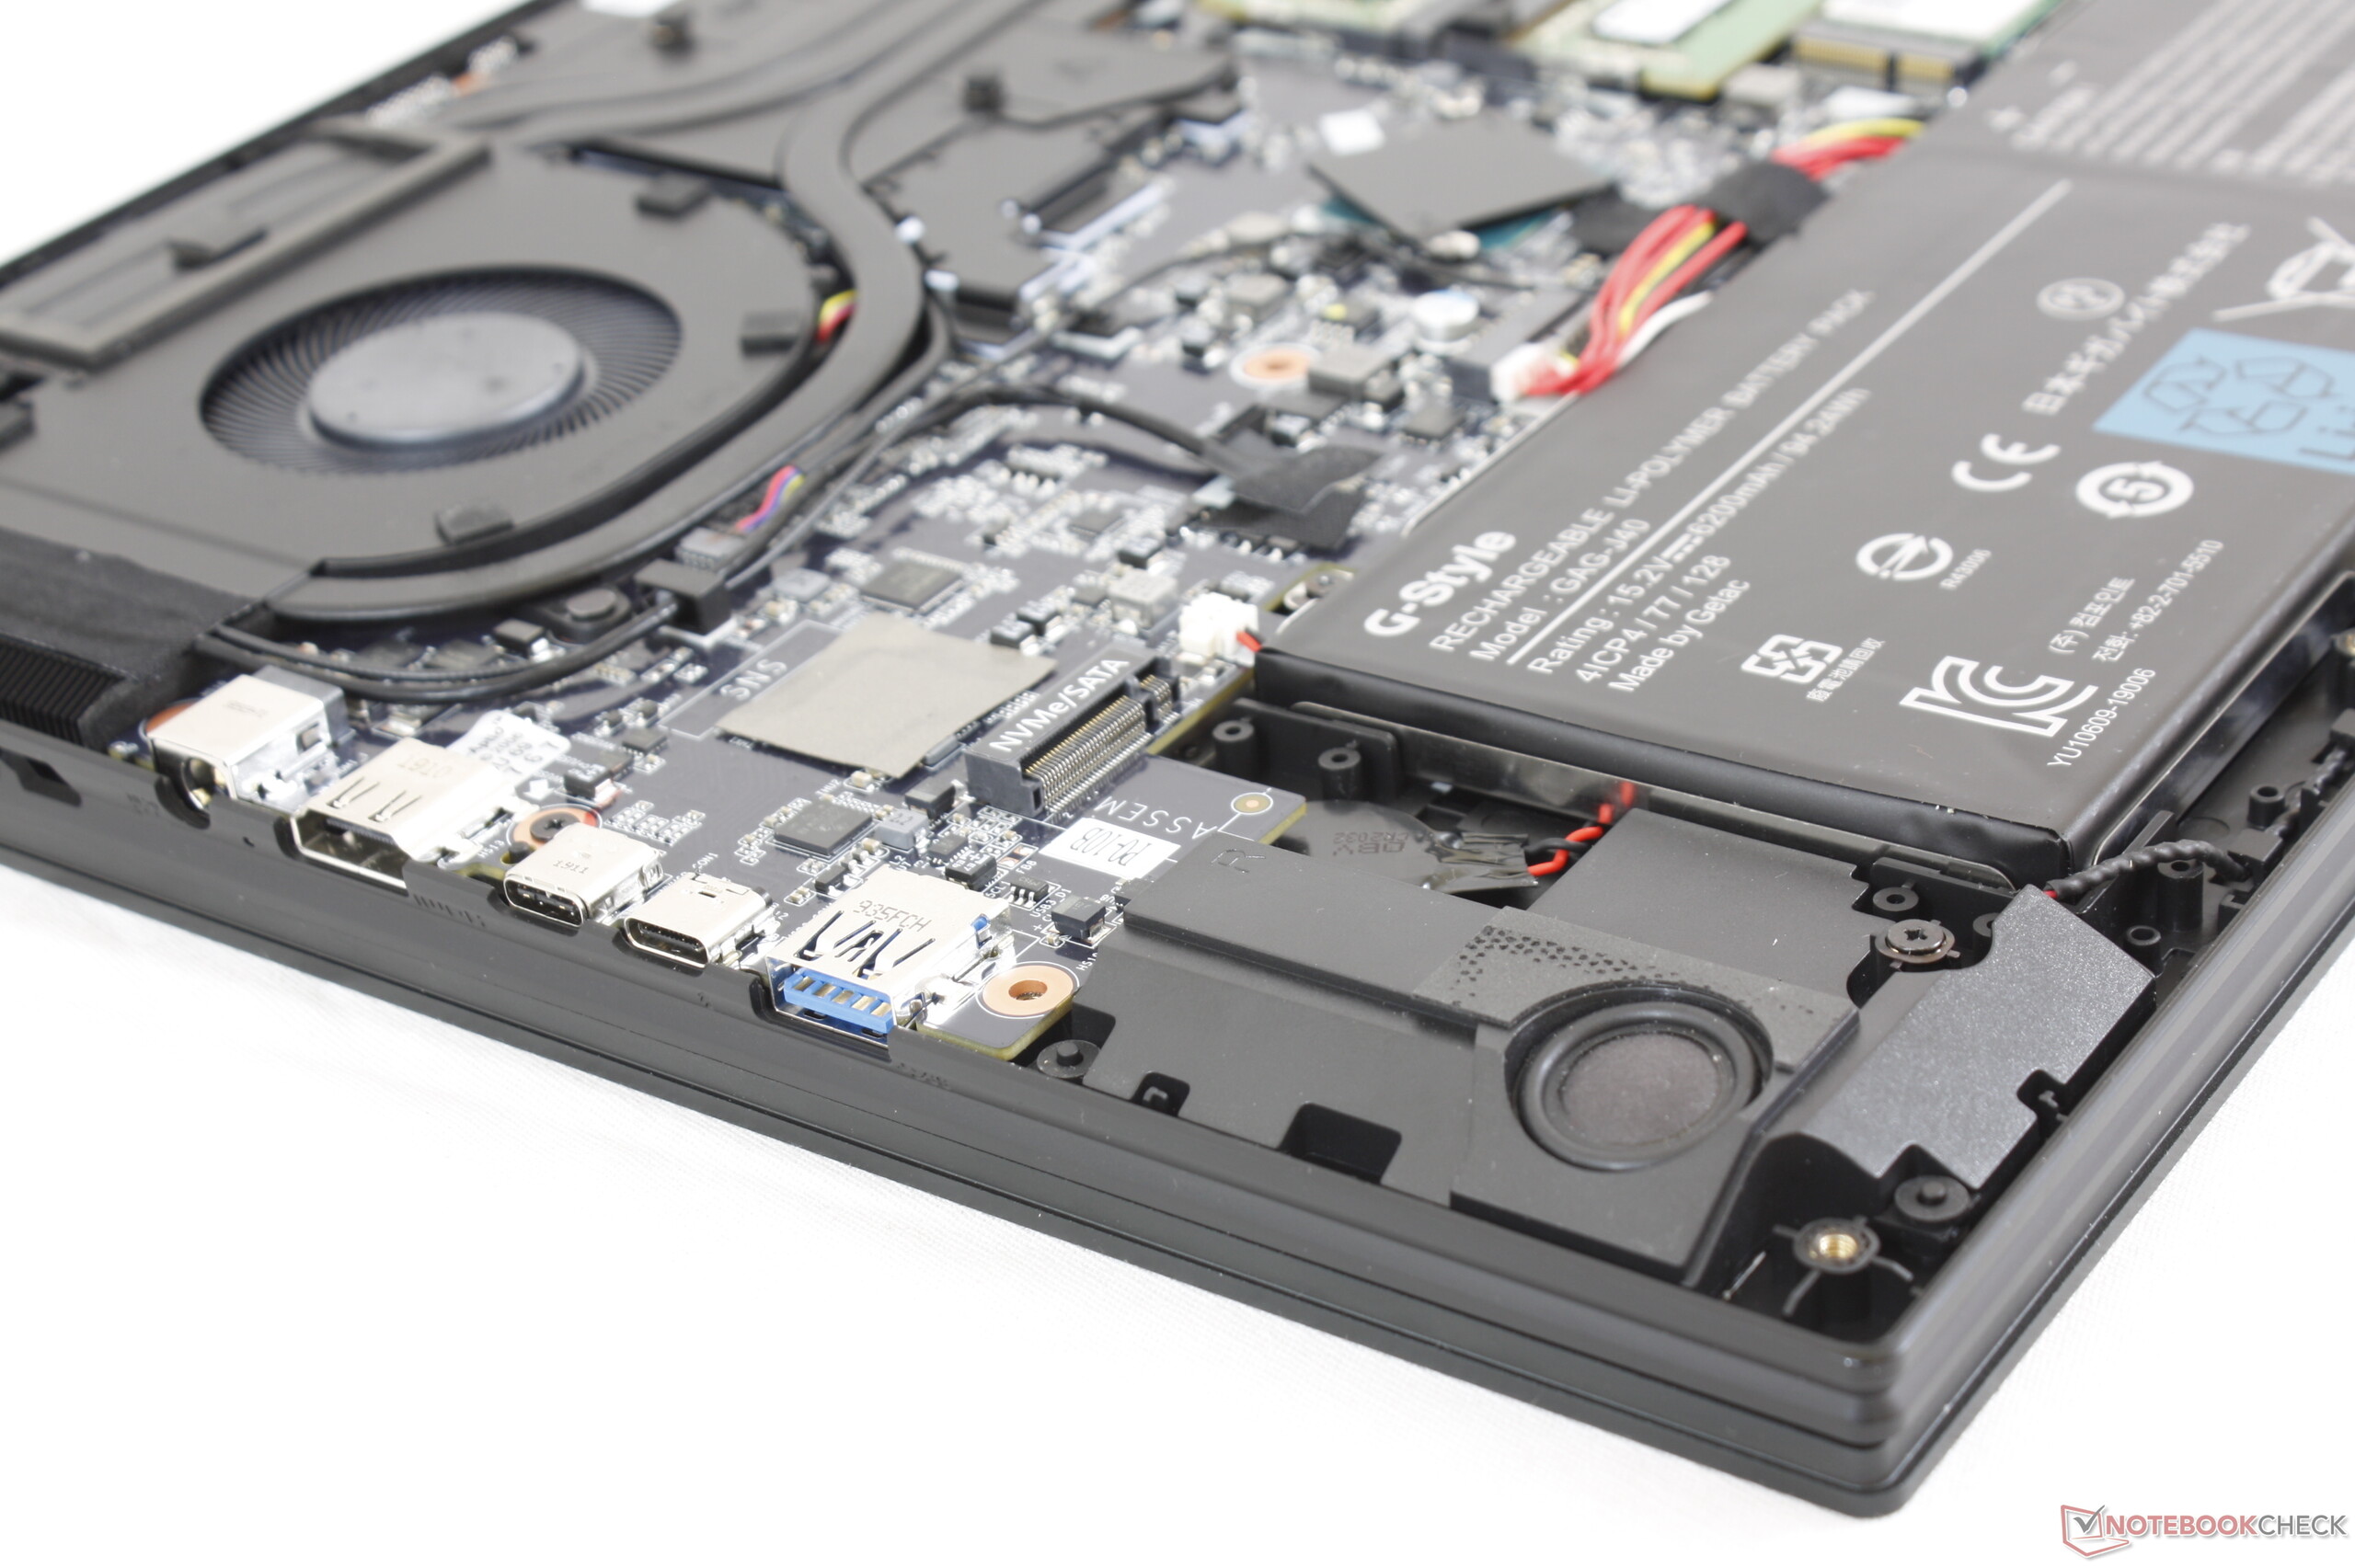
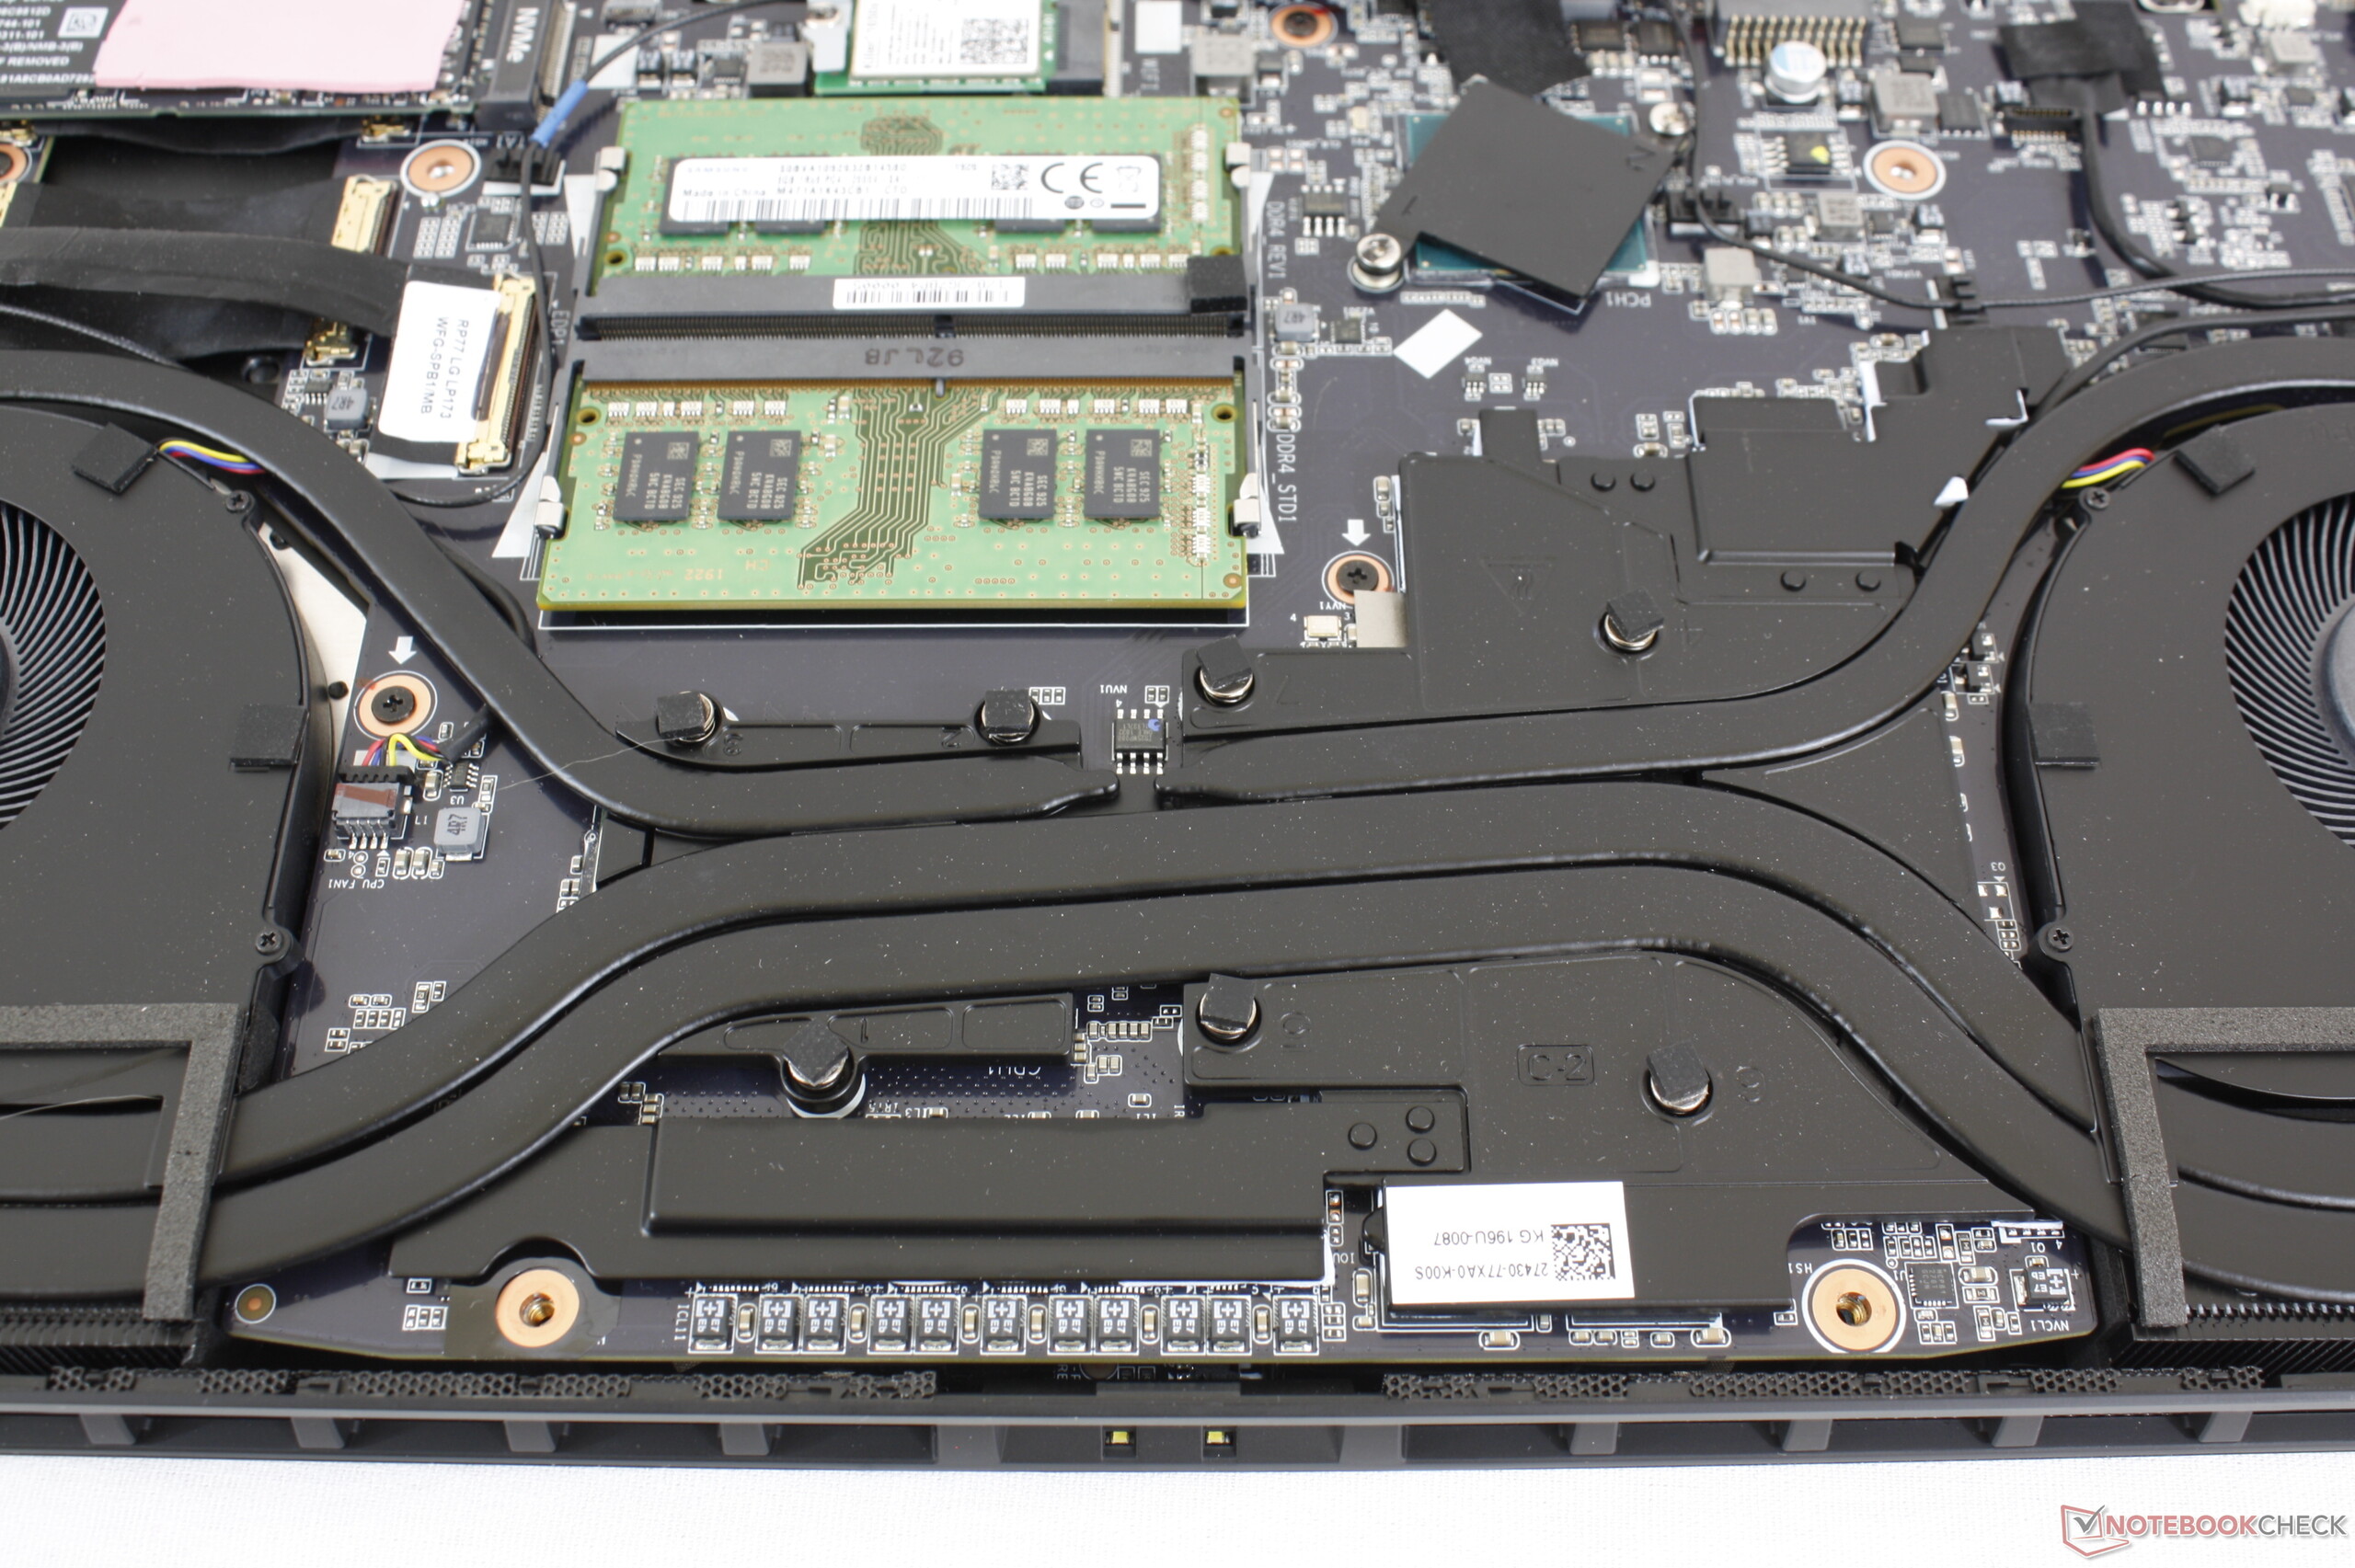
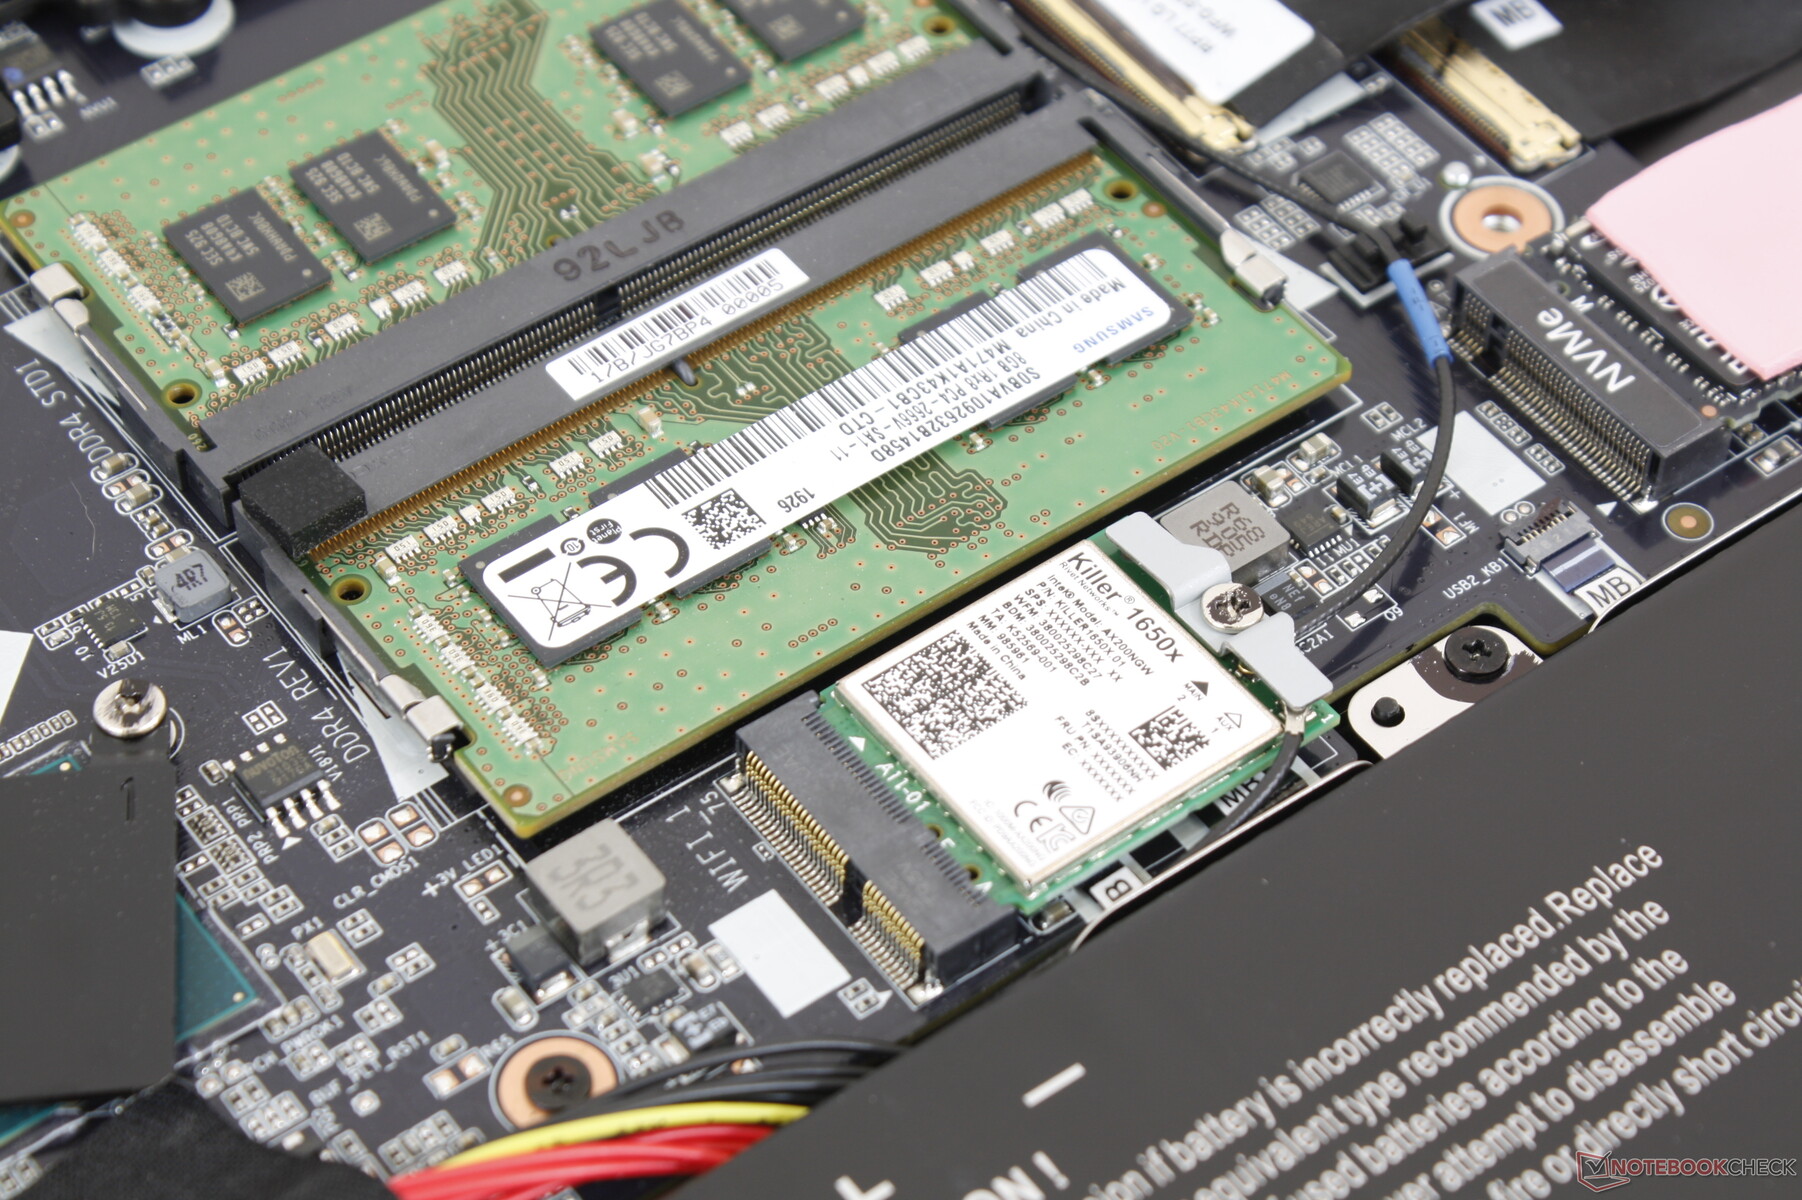
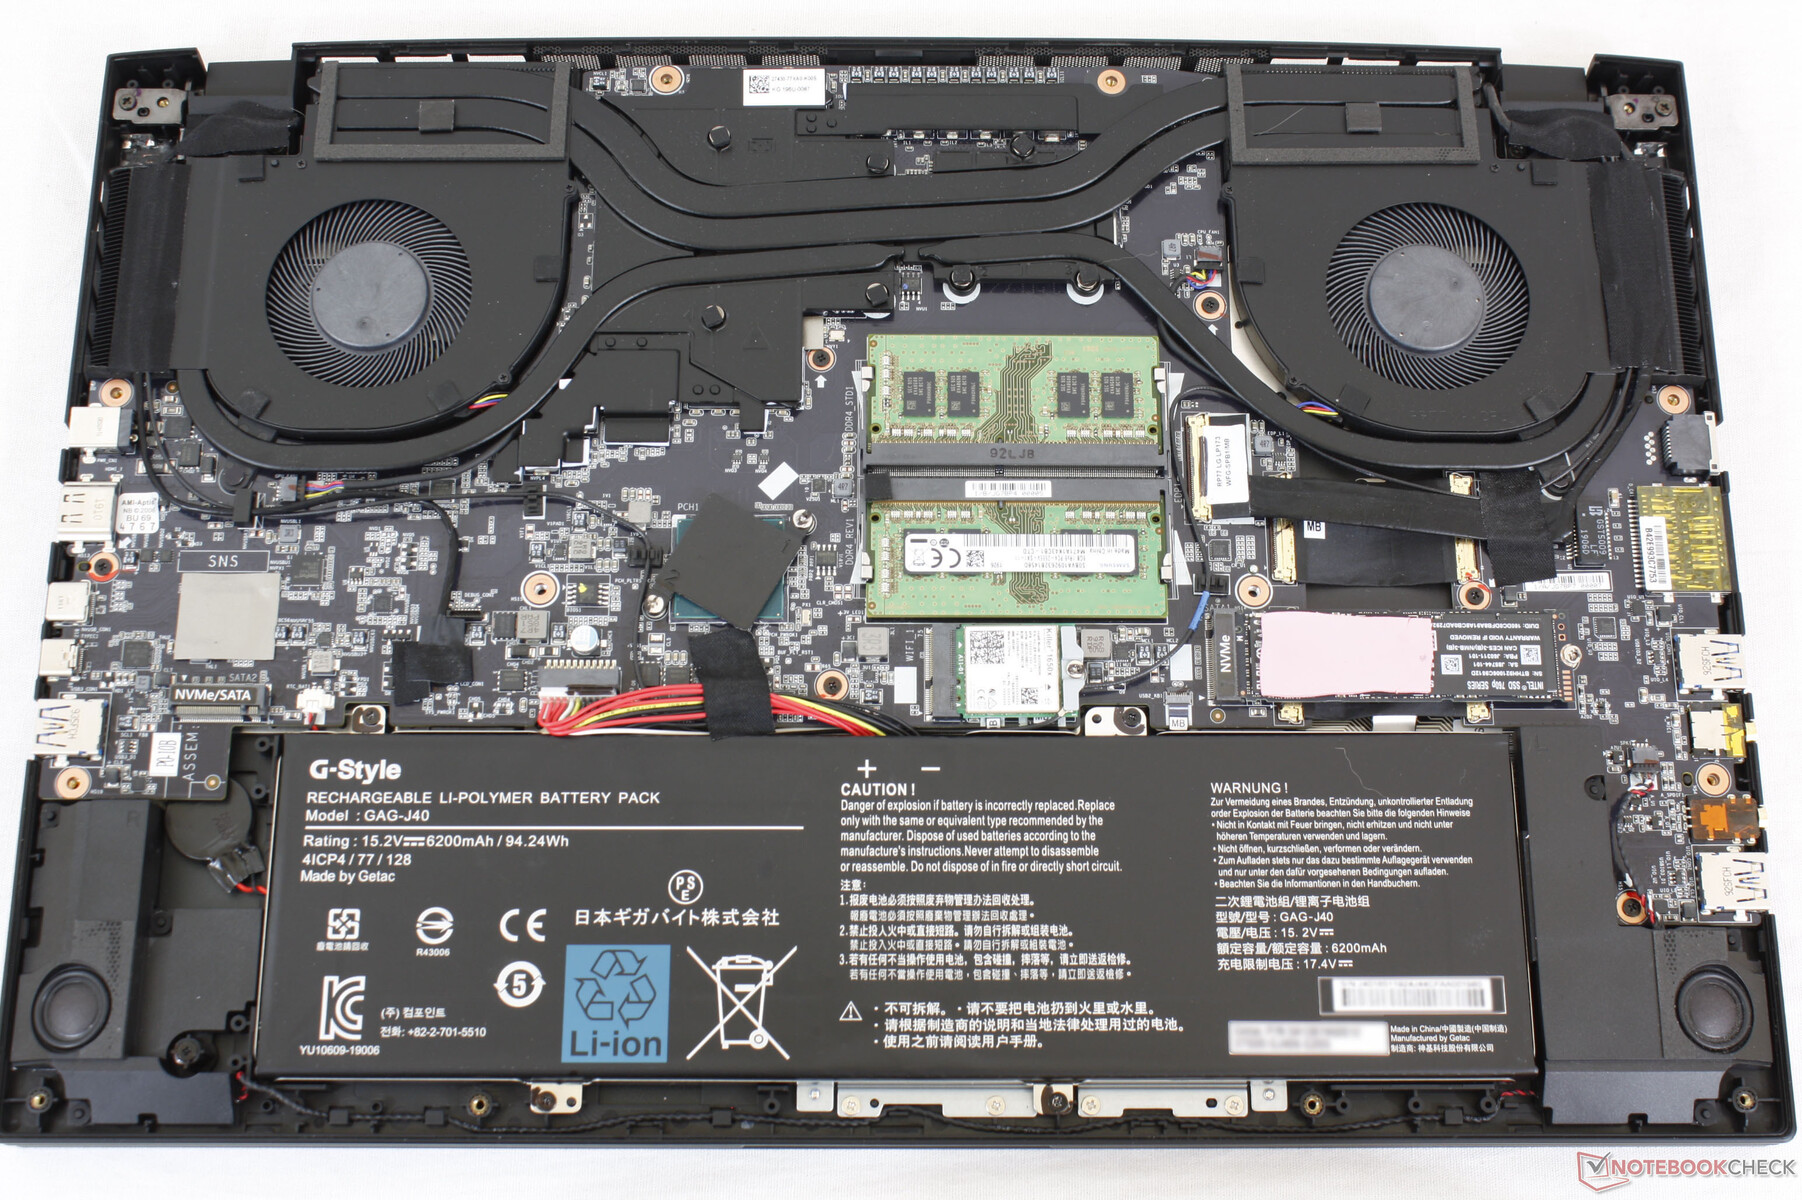
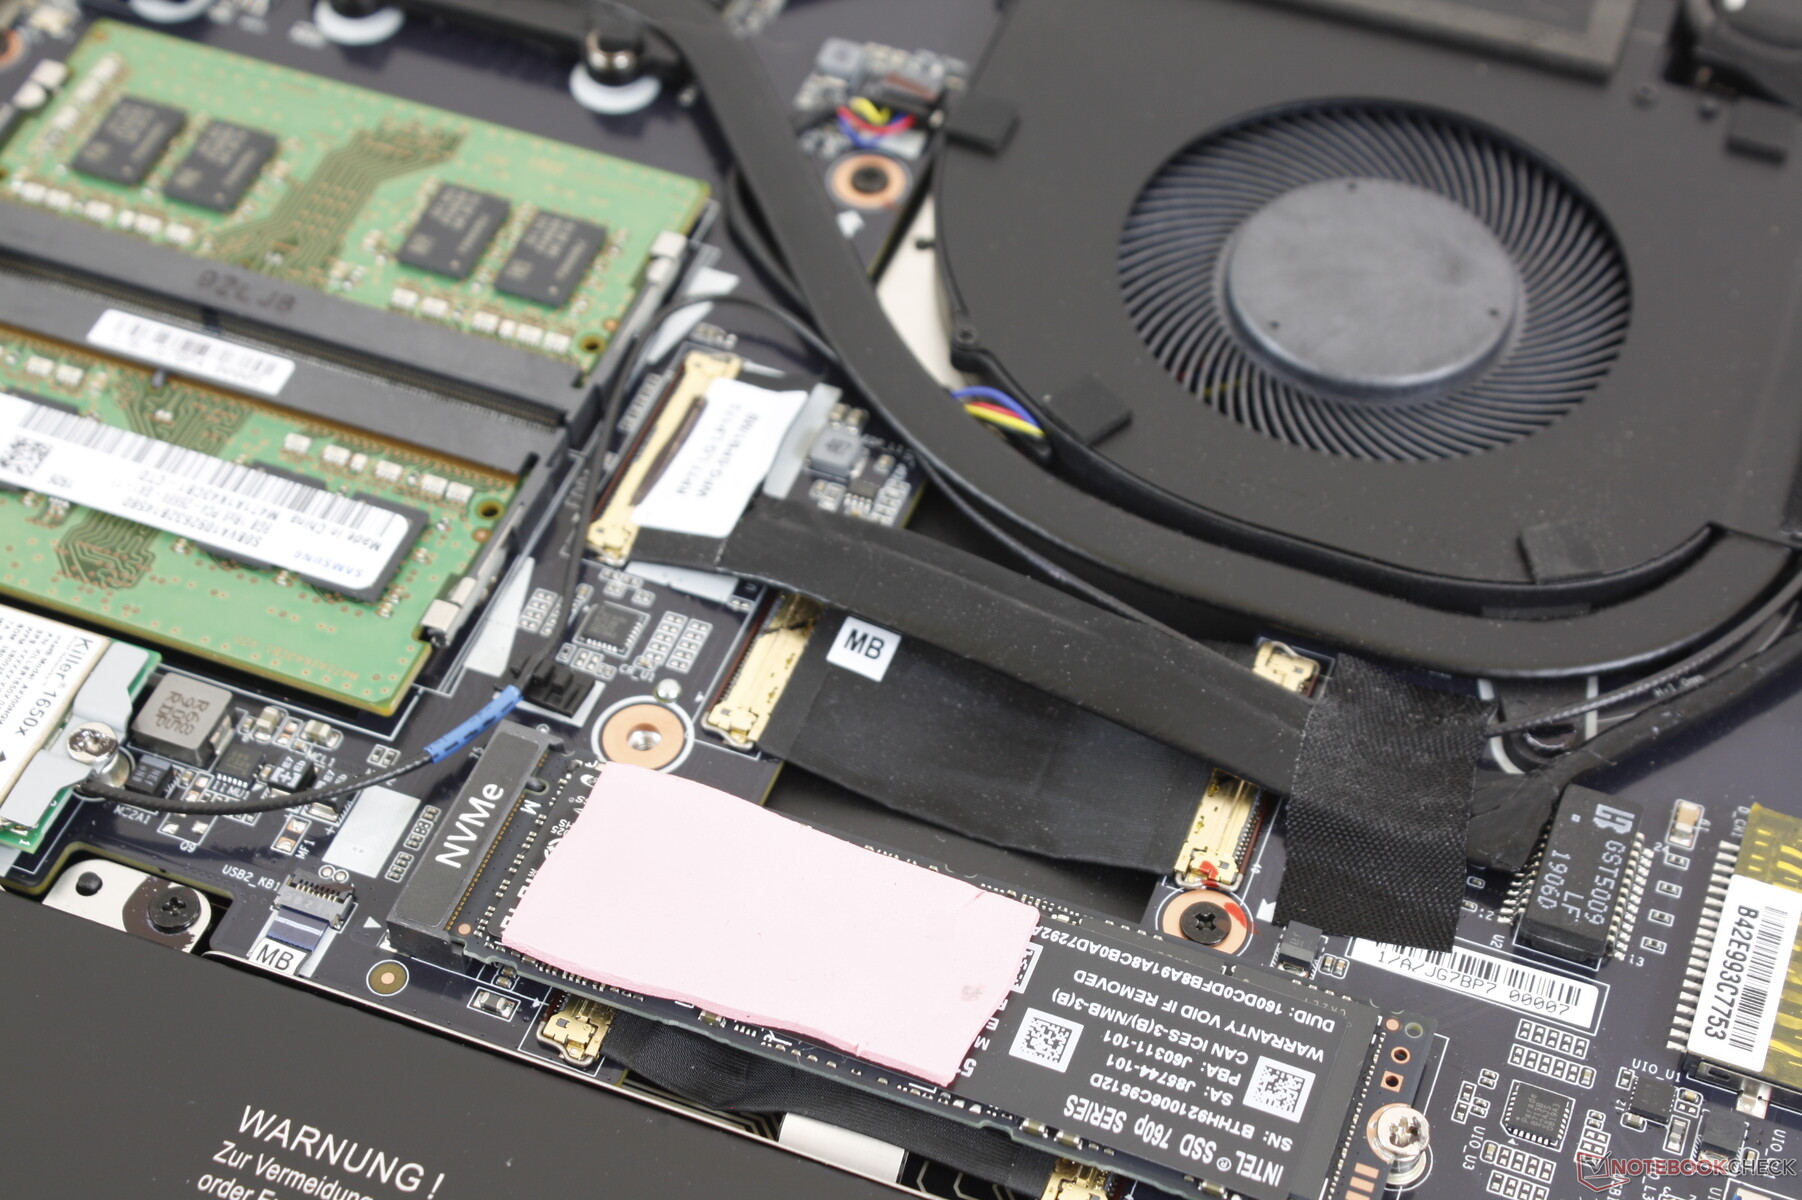
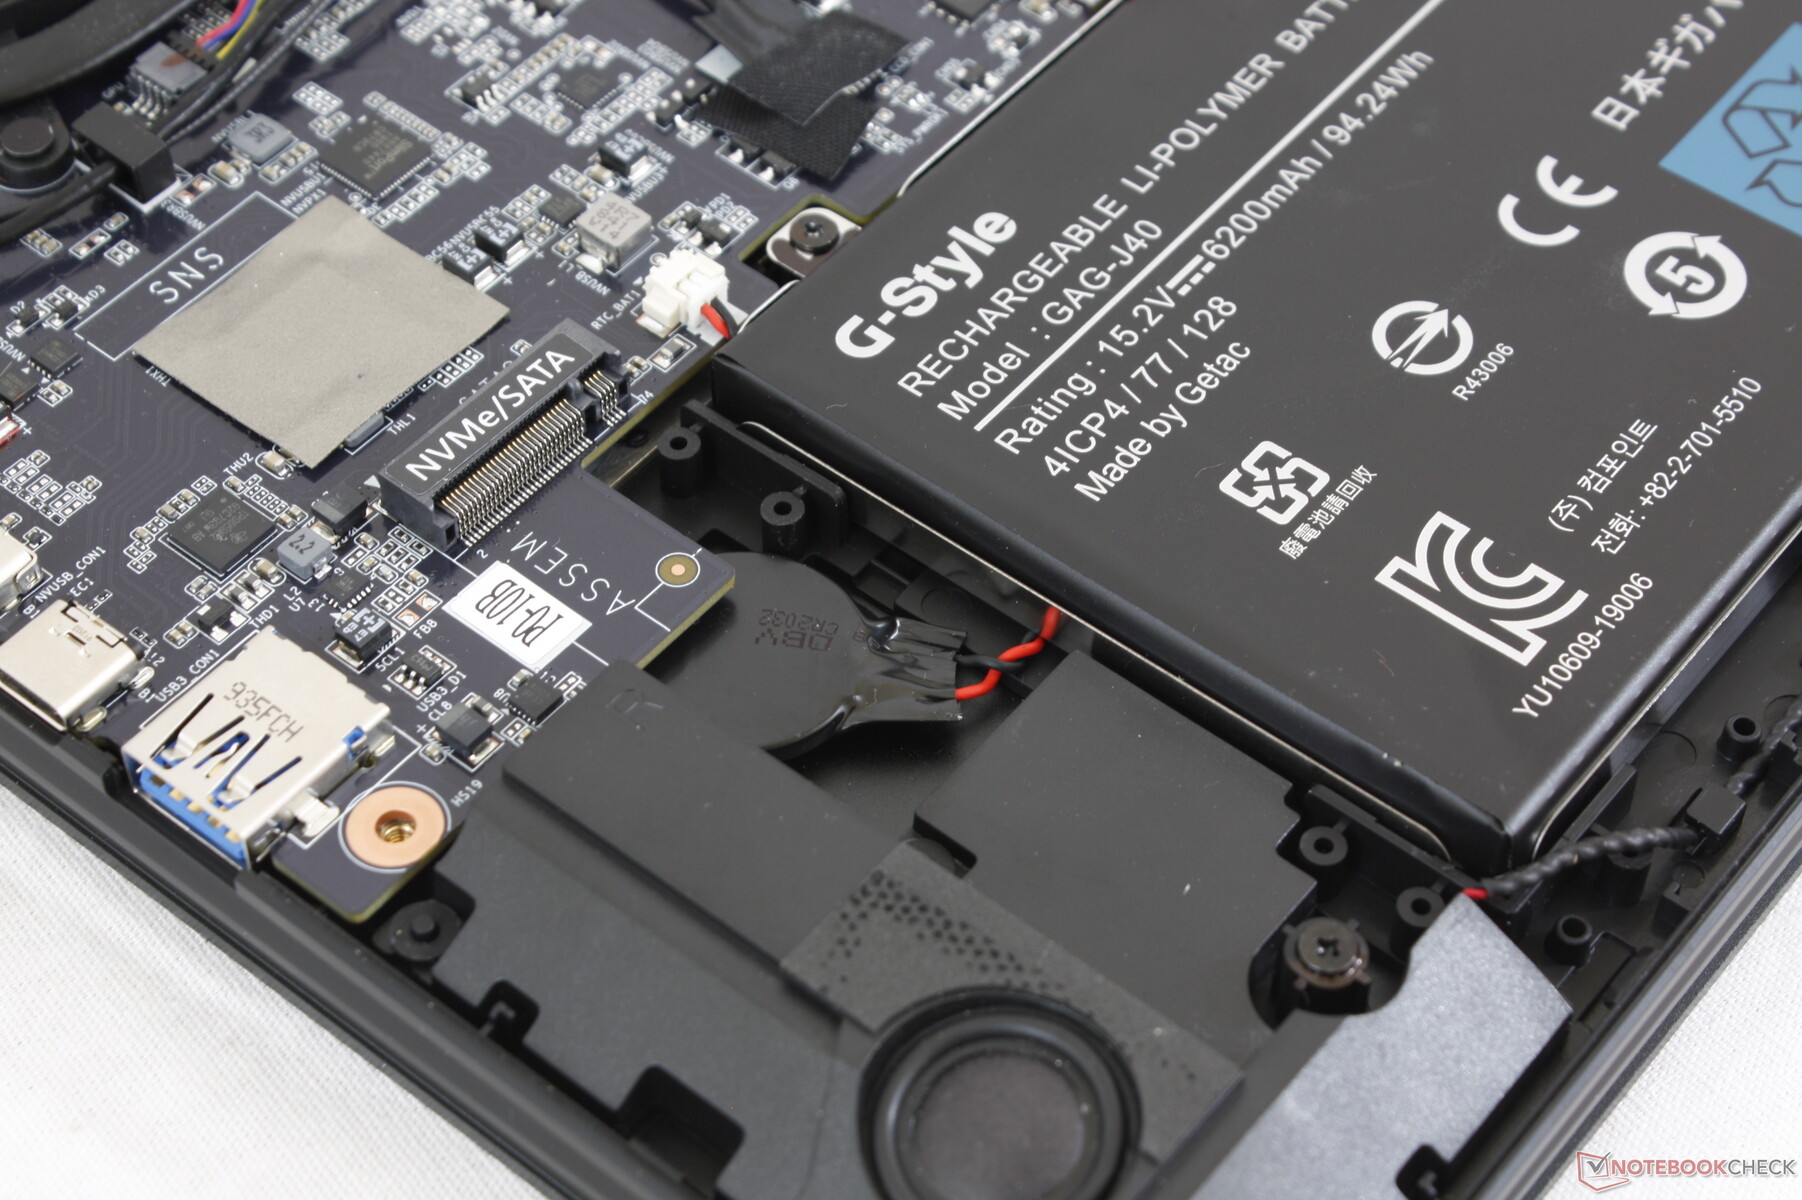
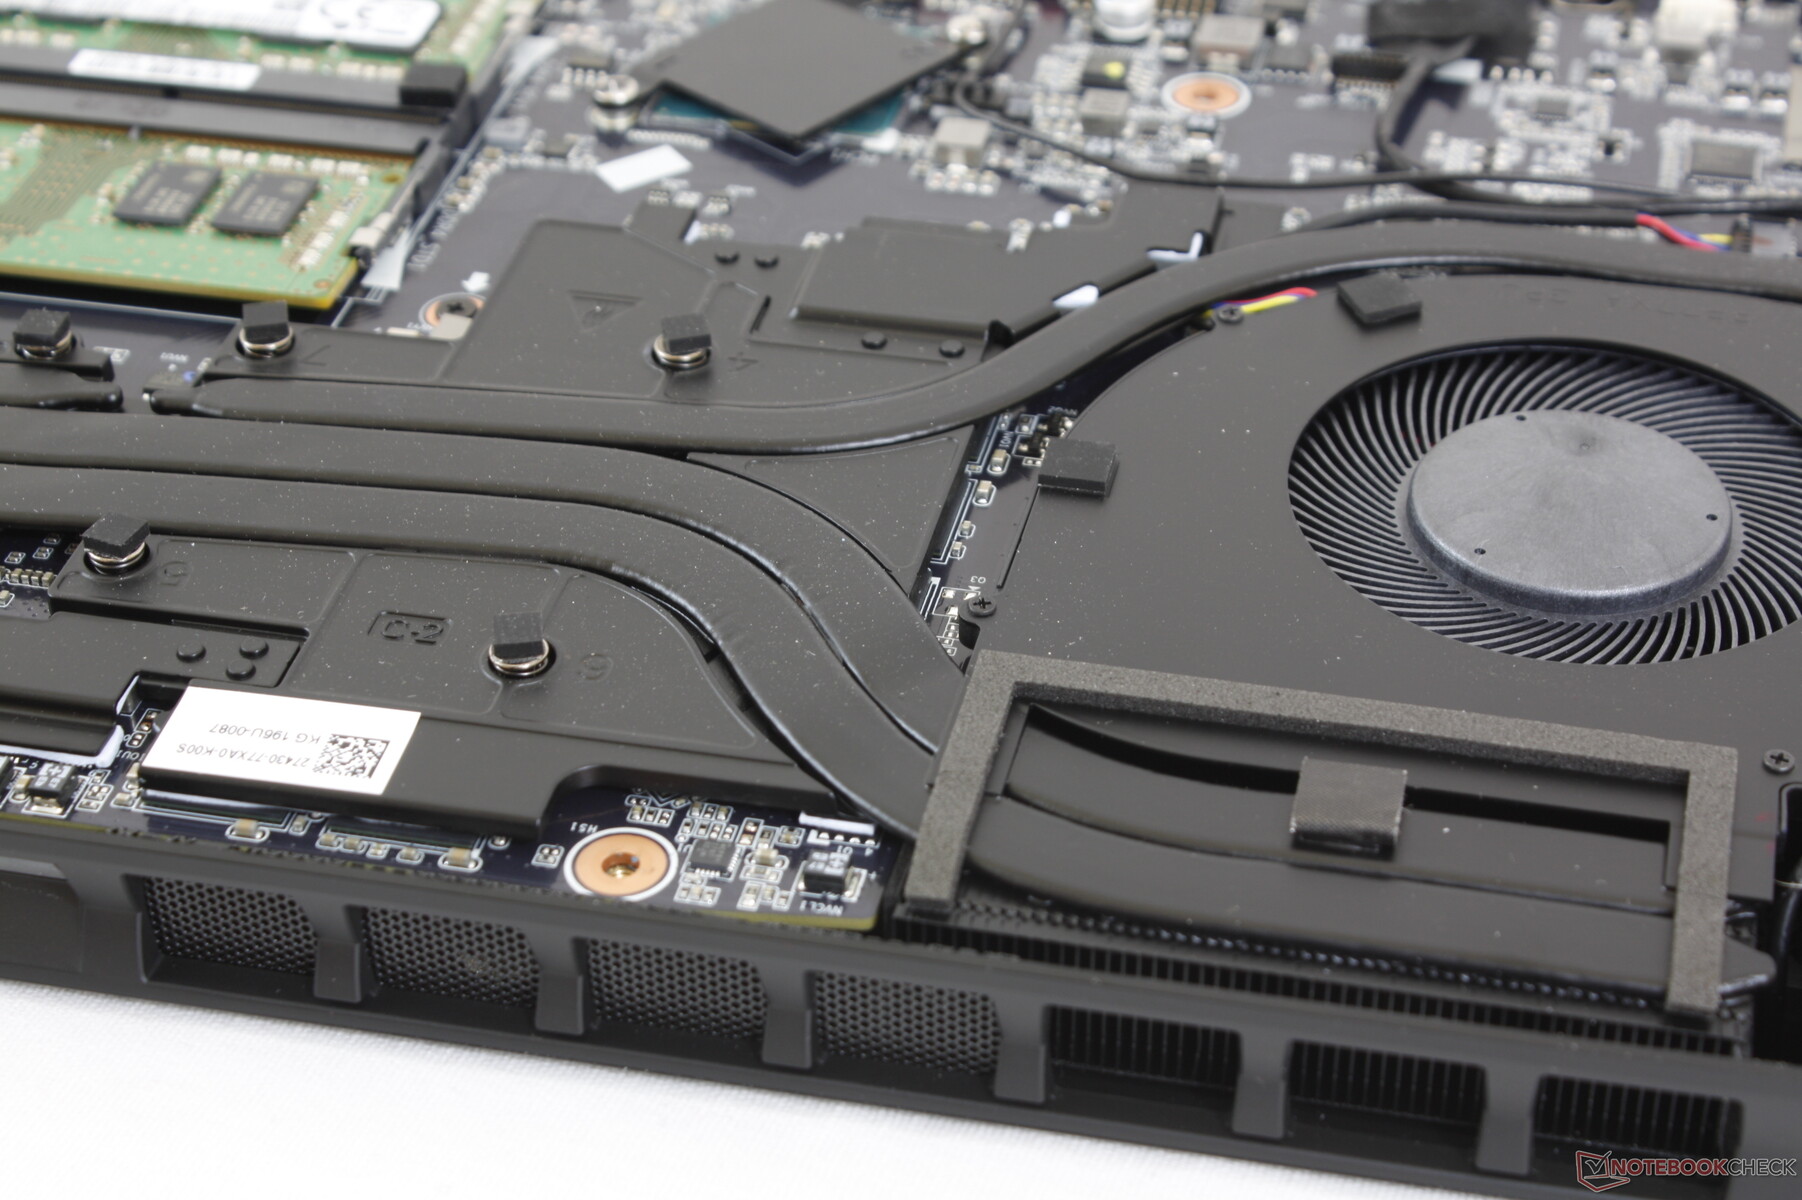
The bottom panel can be easily removed with a T6 Torx screwdriver and a sharp edge. However, keep in mind that some stickers must be torn to remove the screws which could potentially impact the manufacturer warranty.
Users have direct access to the the batteries, both M.2 storage bays, both DDR4 SODIMM slots, and the WLAN module.
Accessories and Warranty
The only included extra in the box is a velvet cleaning cloth to accompany the usual manuals and AC adapter.
Gigabyte offers two-year global warranty as standard for its Aero laptops.
Input Devices
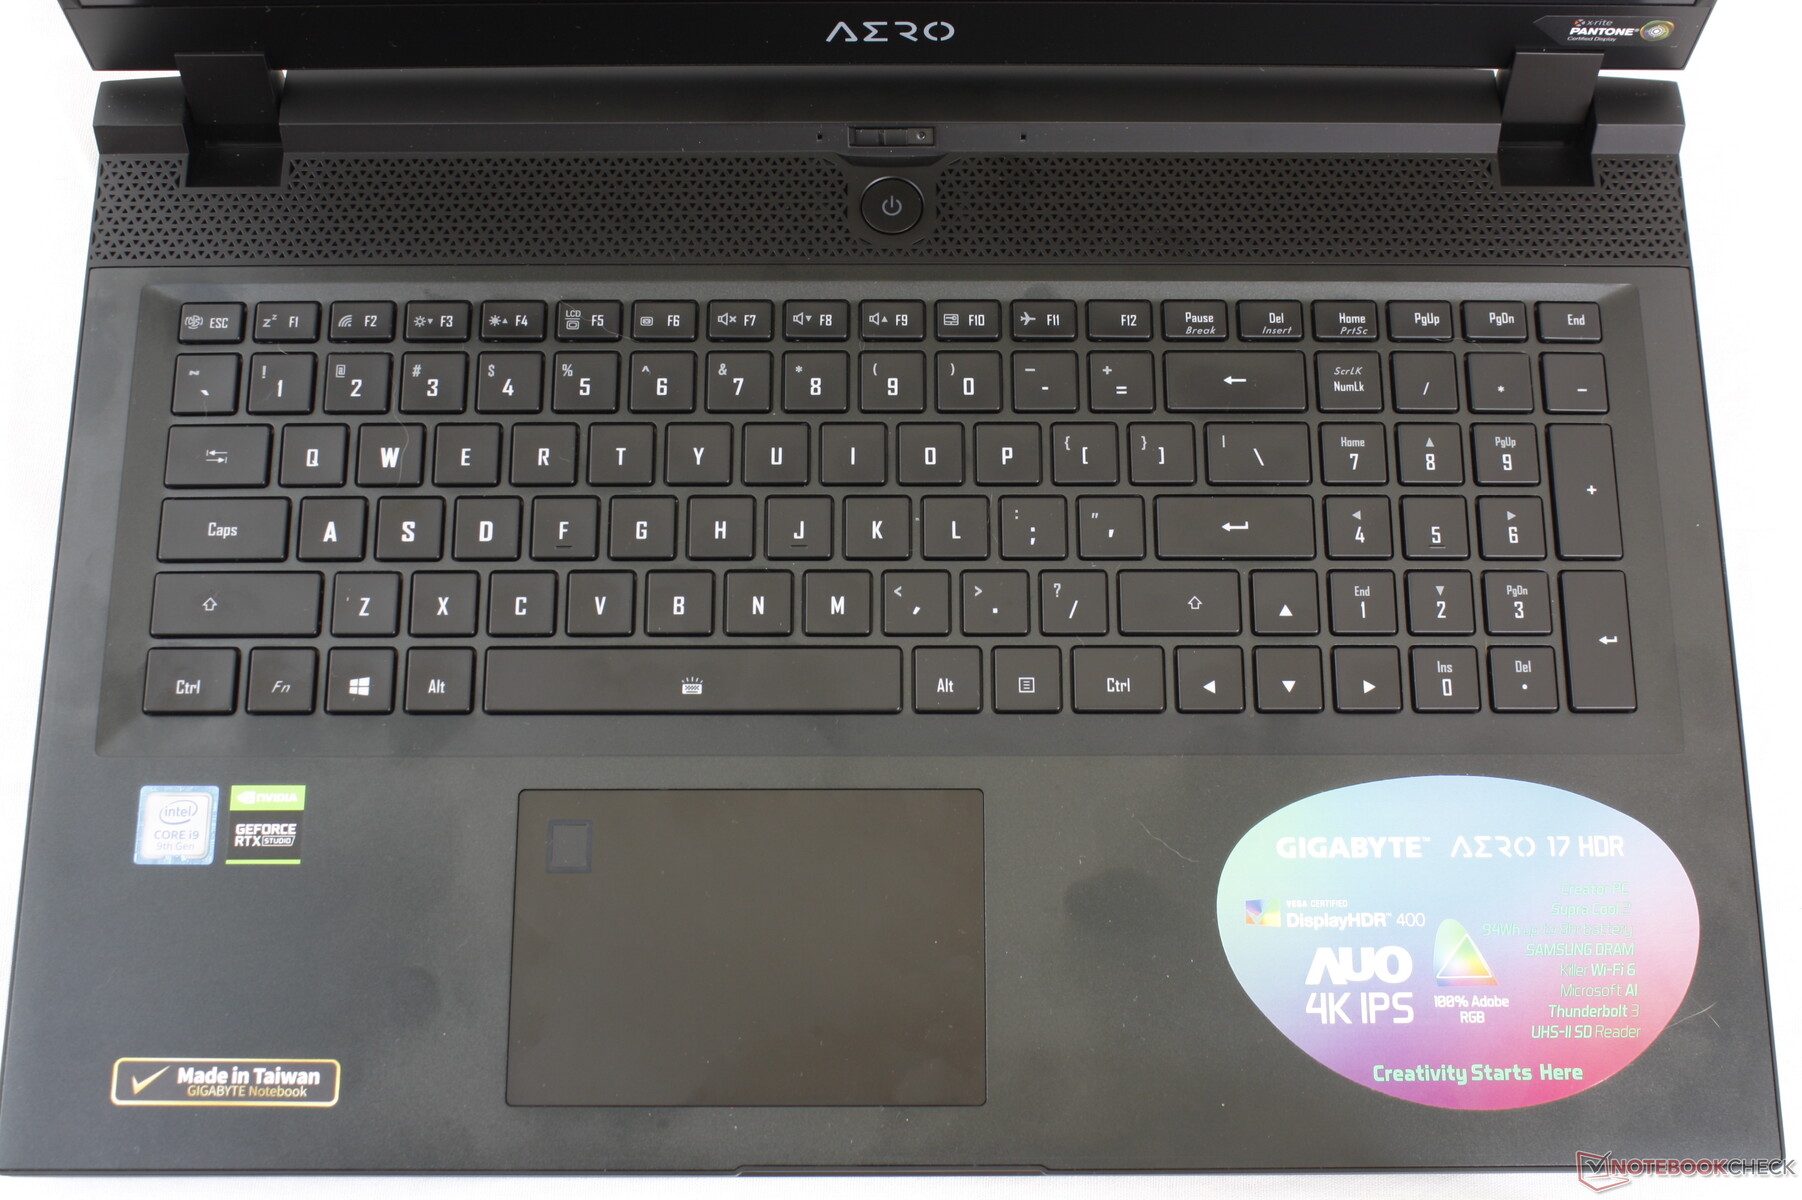
Keyboard
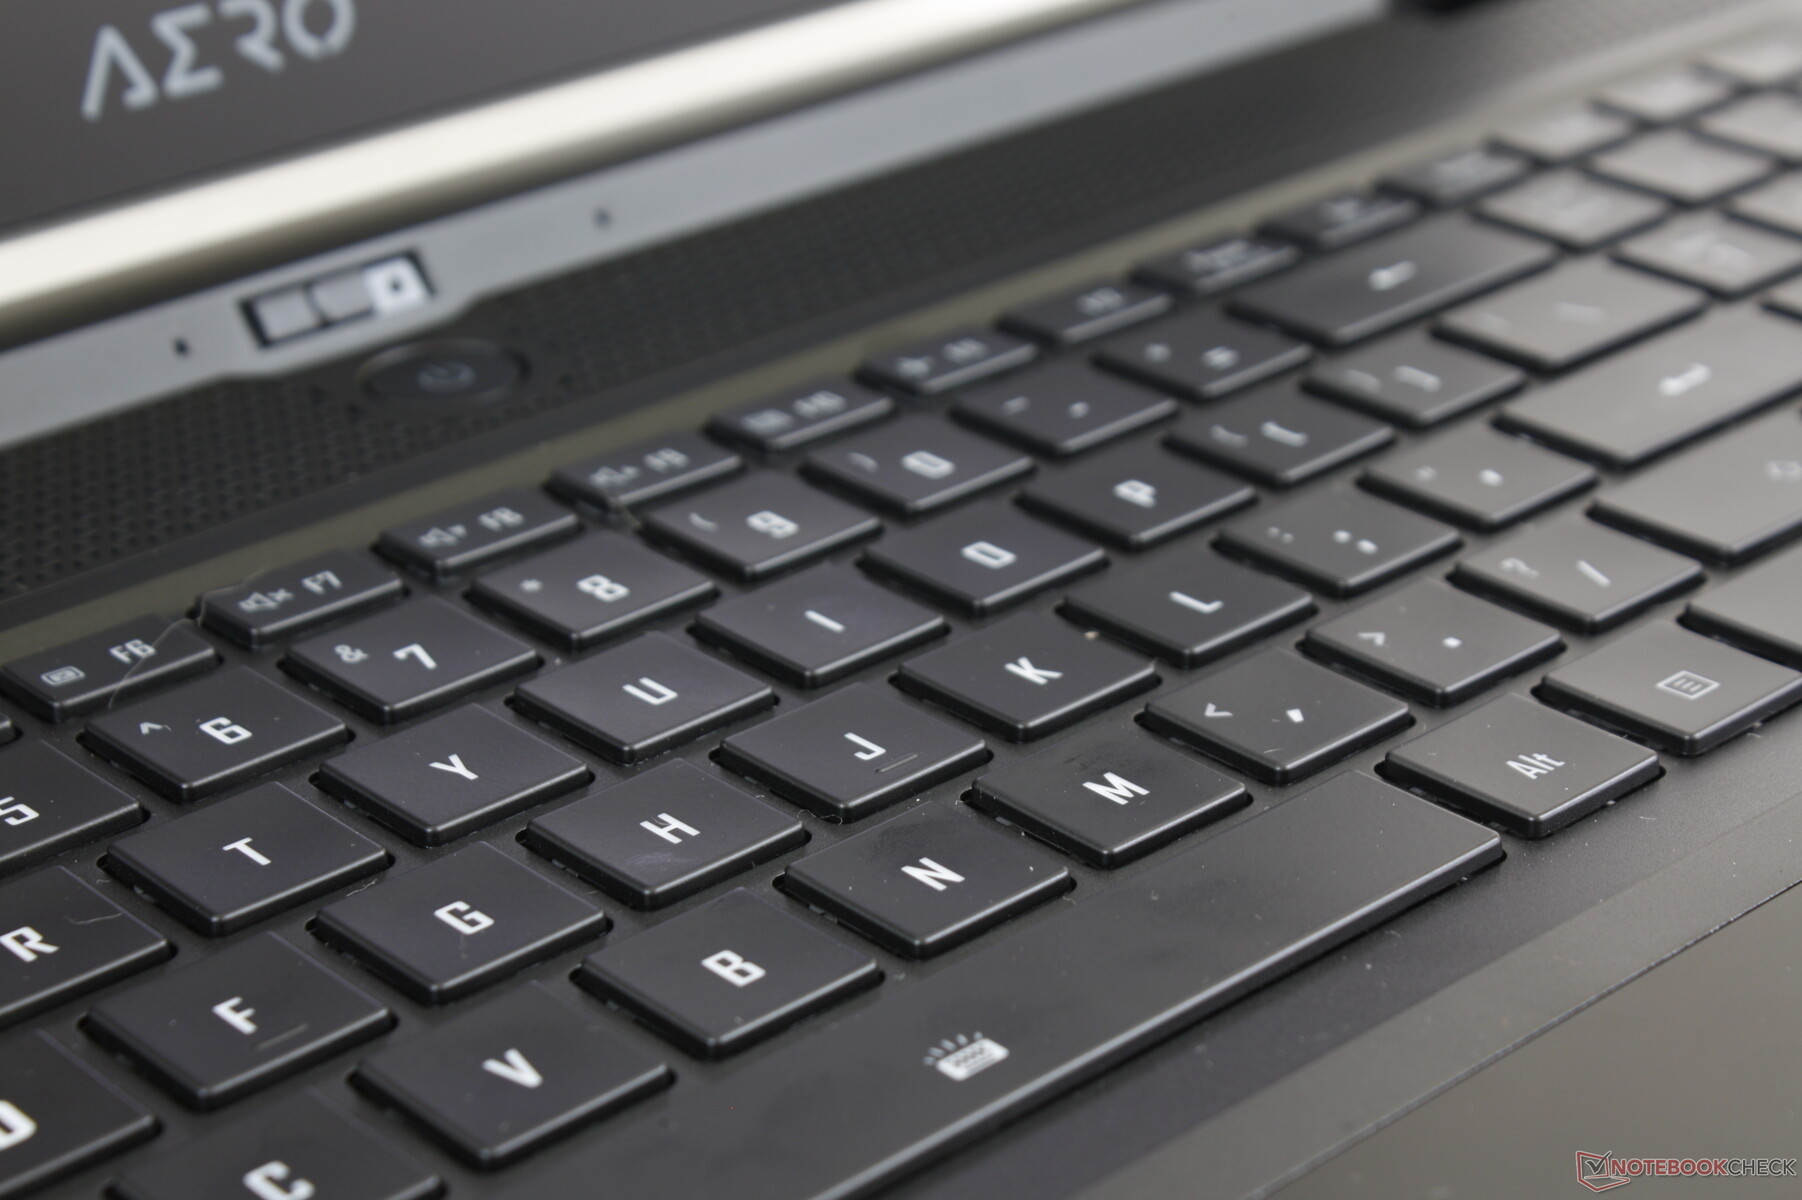
The keyboard is identical to the one on the Aero 15 and so many of our same comments apply here. Key feedback remains somewhat light and spongy in contrast to the firmer and deeper keys of the MSI GS/GE/GT SteelSeries keyboards or the HP Spectre x360 15 keyboard. The typing experience is most similar to the Razer Blade 15 or Blade Pro 17 except that Gigabyte integrates a full-size NumPad. We know Gigabyte is capable of producing more comfortable keyboards as exemplified by the older P55W and its 2.2 mm key travel.
As detailed on our page here, the per-key RGB lighting offers two levels of brightness for only the primary key symbols. Secondary symbols like ?, :, >, <, (, ), {, }, +, and more are all unlit. In comparison, each and every symbol on the latest Razer Blade laptops are all lit. This is likely an oversight on Gigabyte's part.
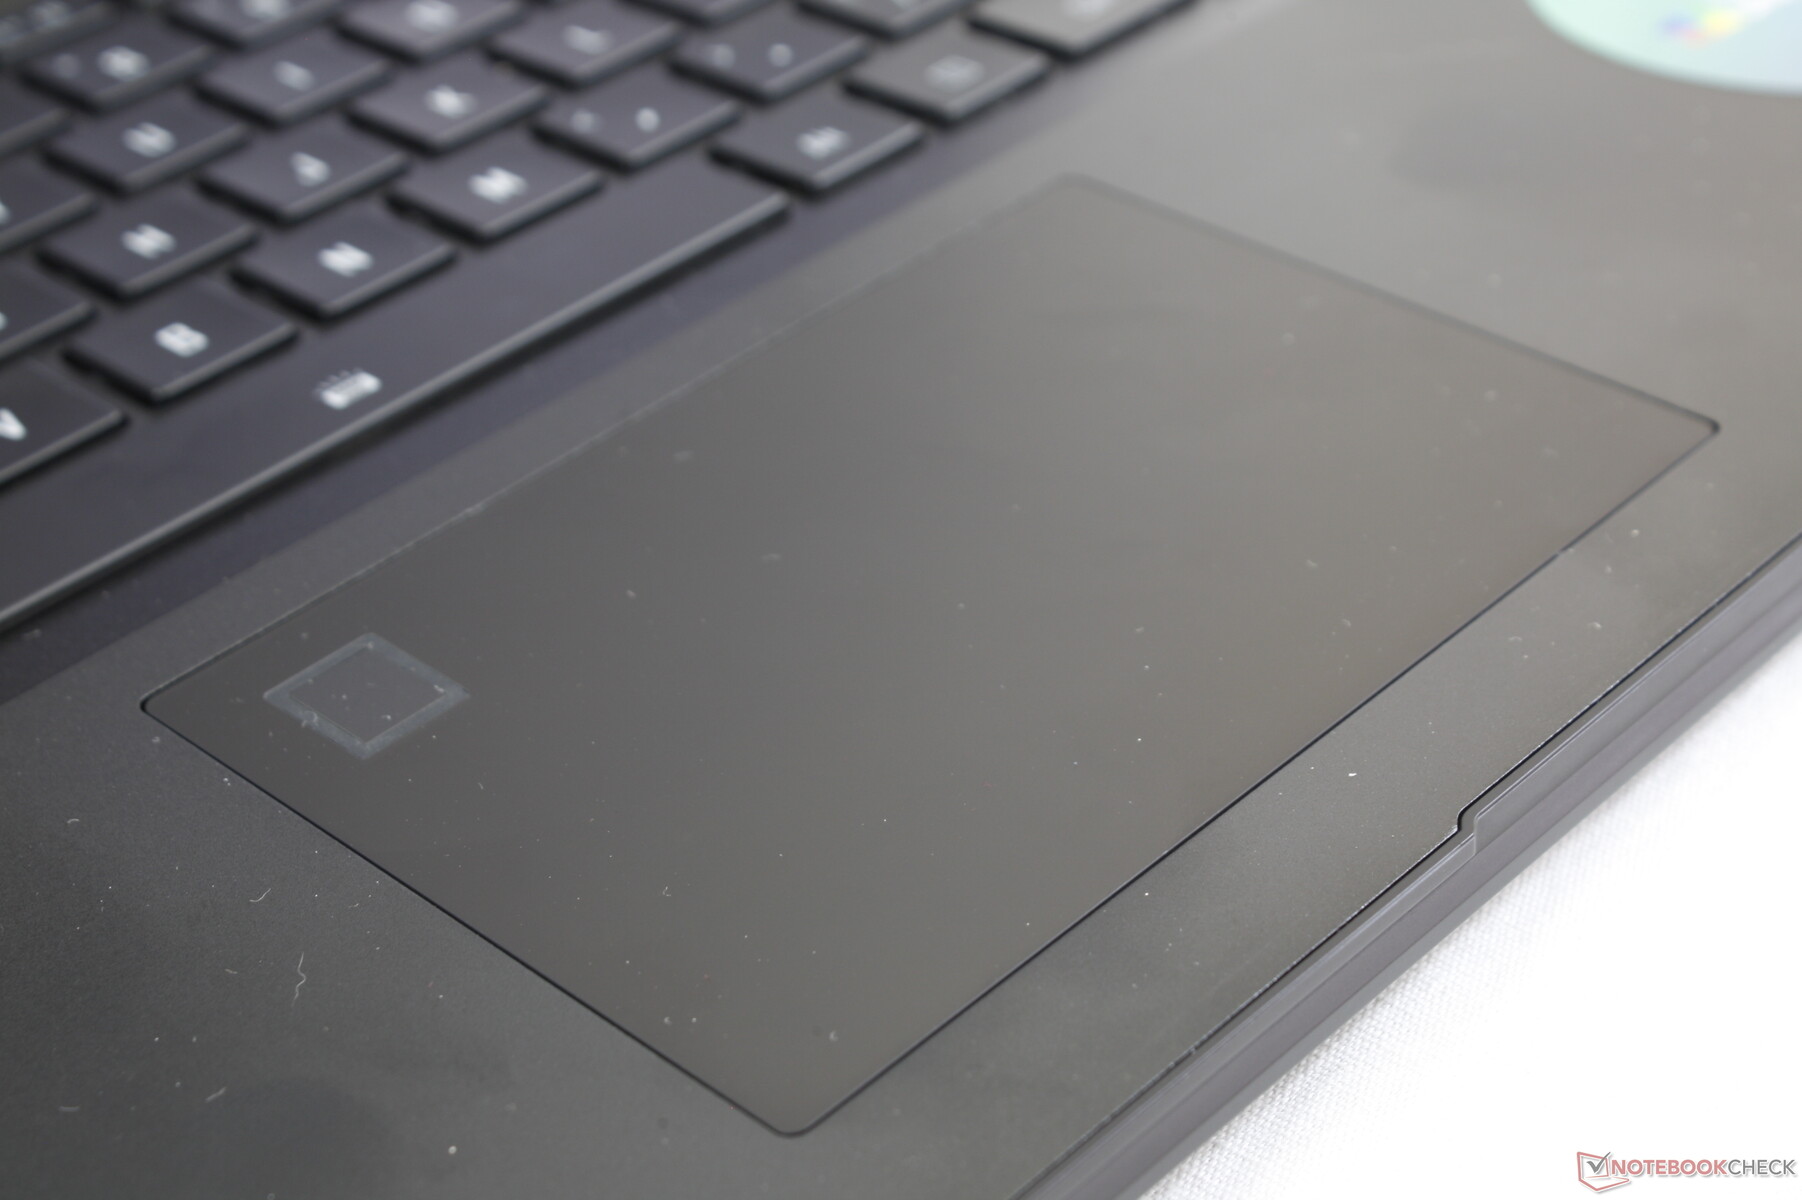
Touchpad
The clickpad is slightly smaller (10.5 x 7 cm) than the one on the 15.6-inch Dell XPS 15 (10.5 x 8.5 cm). Even so, its surface is smoother than the surrounding palm rests for a uniform glide with almost no sticking regardless of movement speed.
Our main complaint about the clickpad is that its integrated mouse keys are a bit on the spongy side. The shallow travel requires more force than usual to register an input as well which could be fatiguing if clicking repeatedly. We would have preferred dedicated mouse keys to better differentiate the Aero series from the Aorus series especially since the Aero series caters more to professionals.
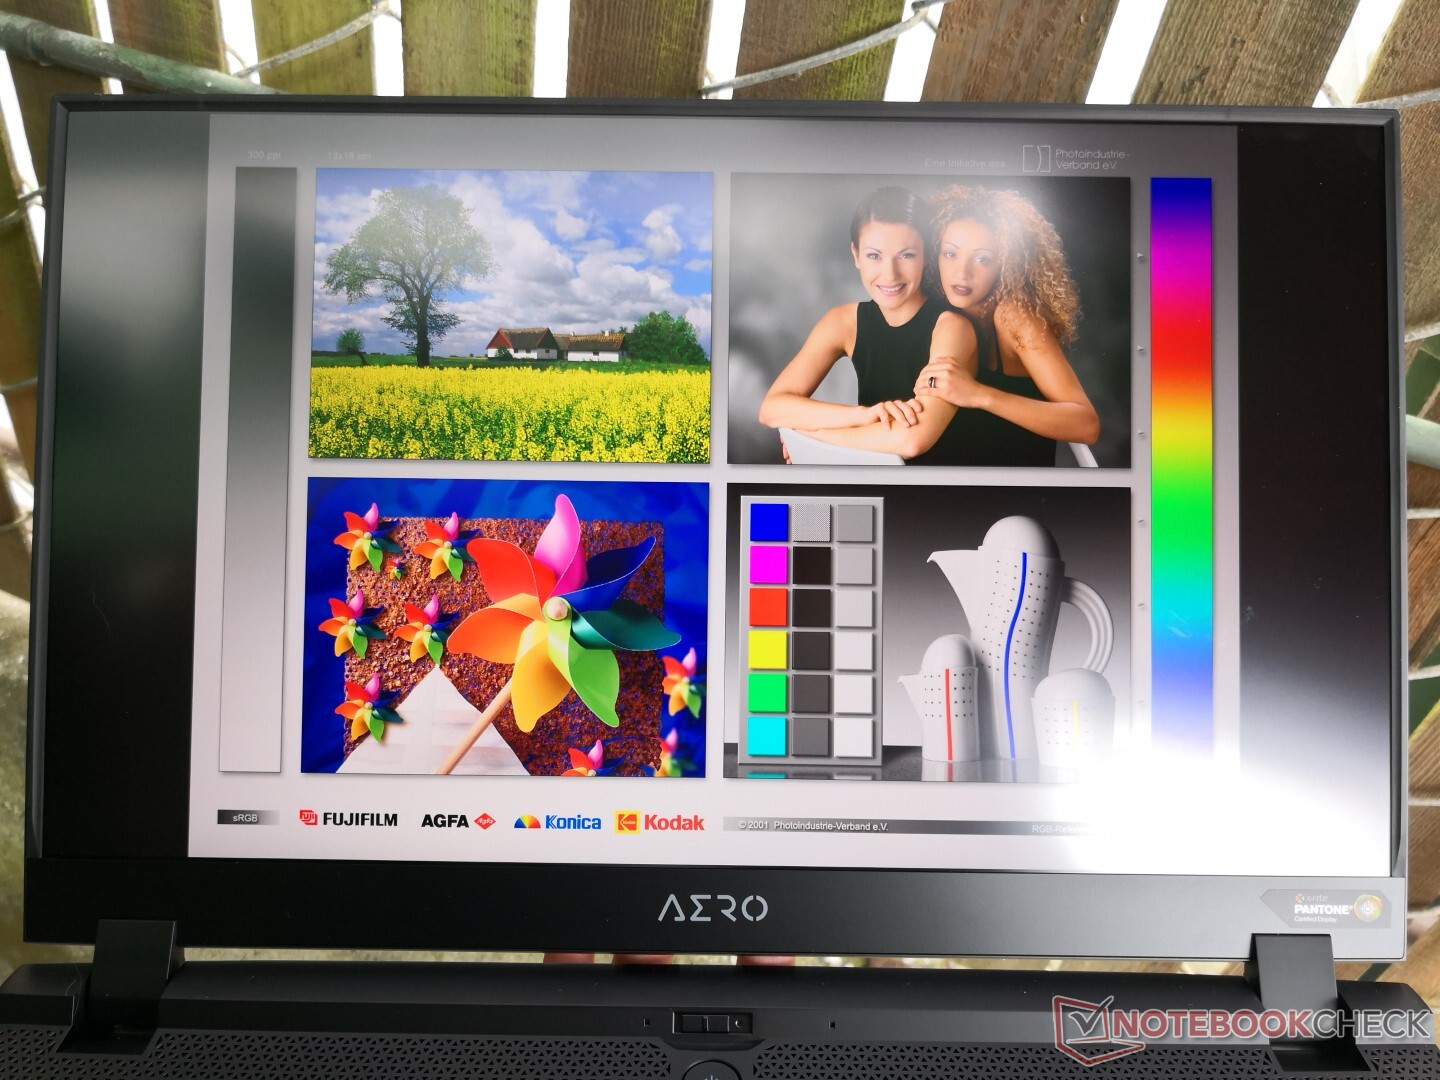
Display
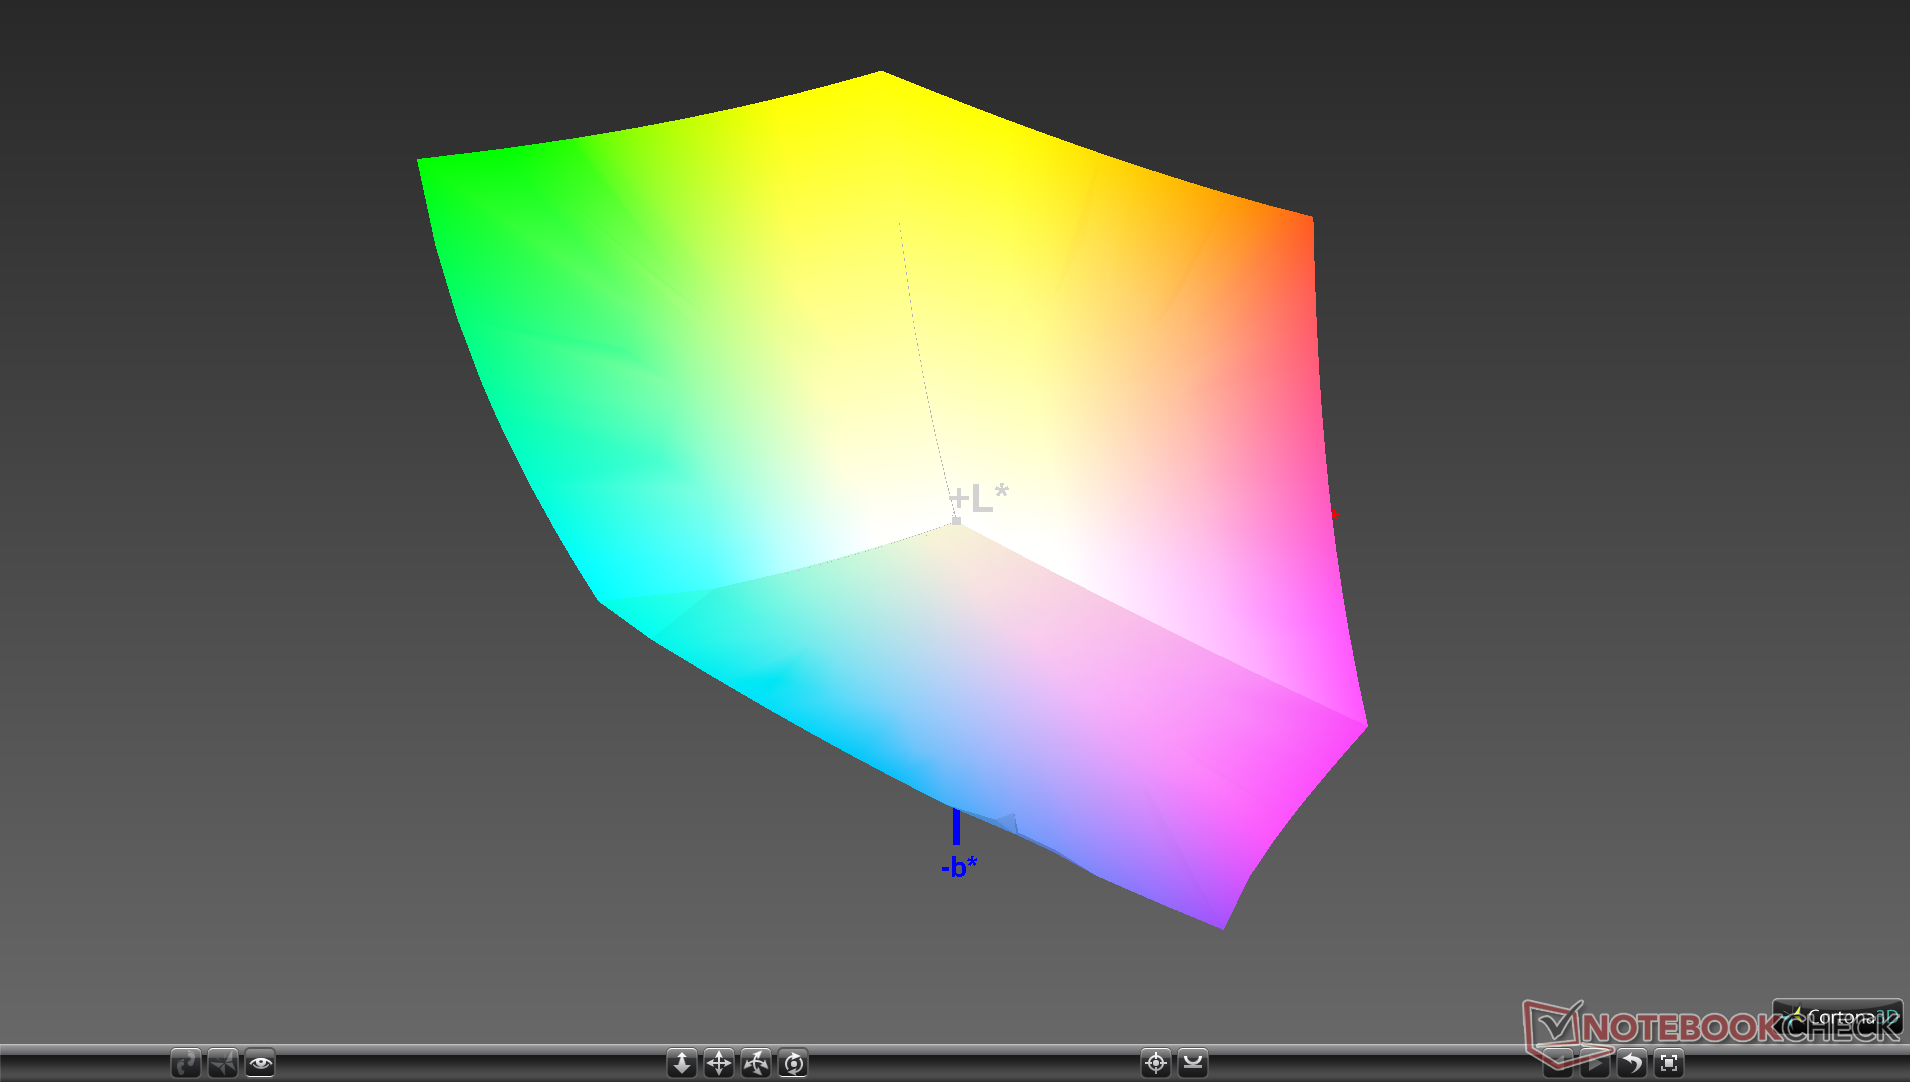
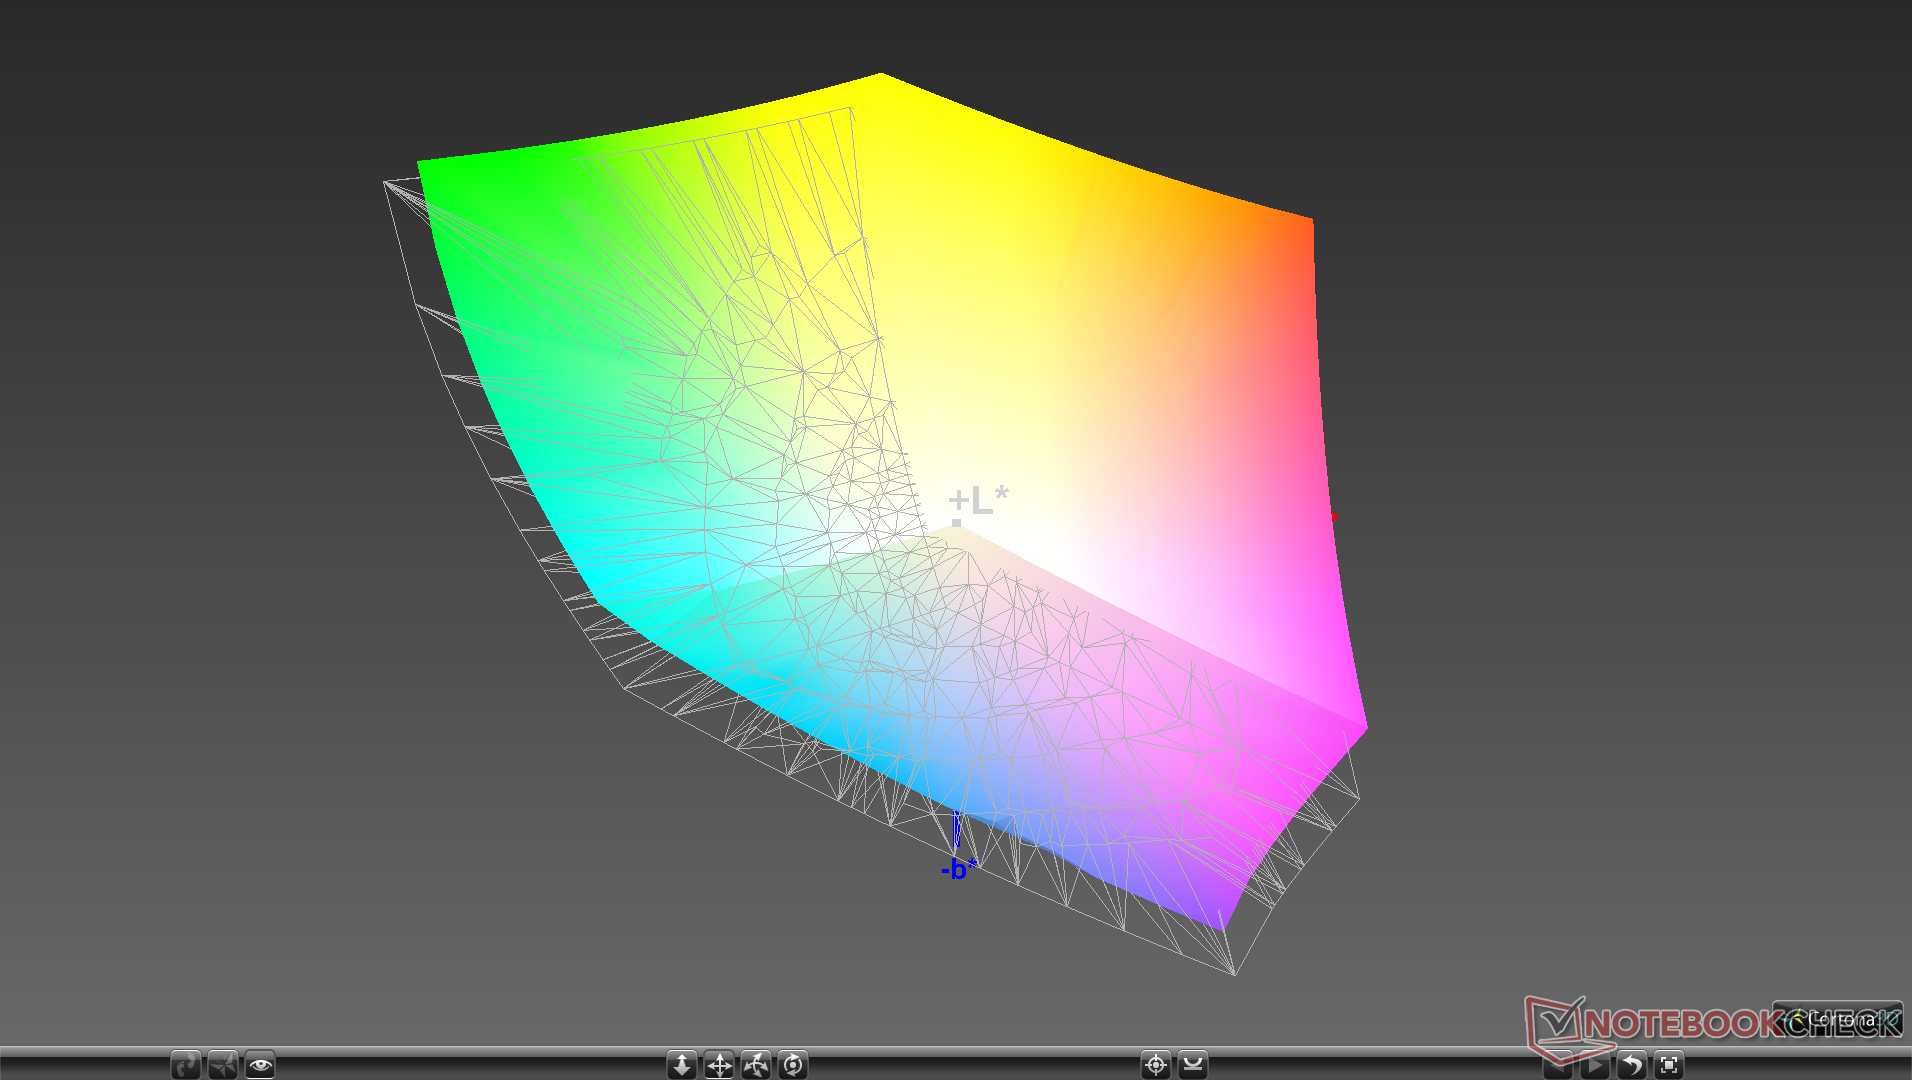
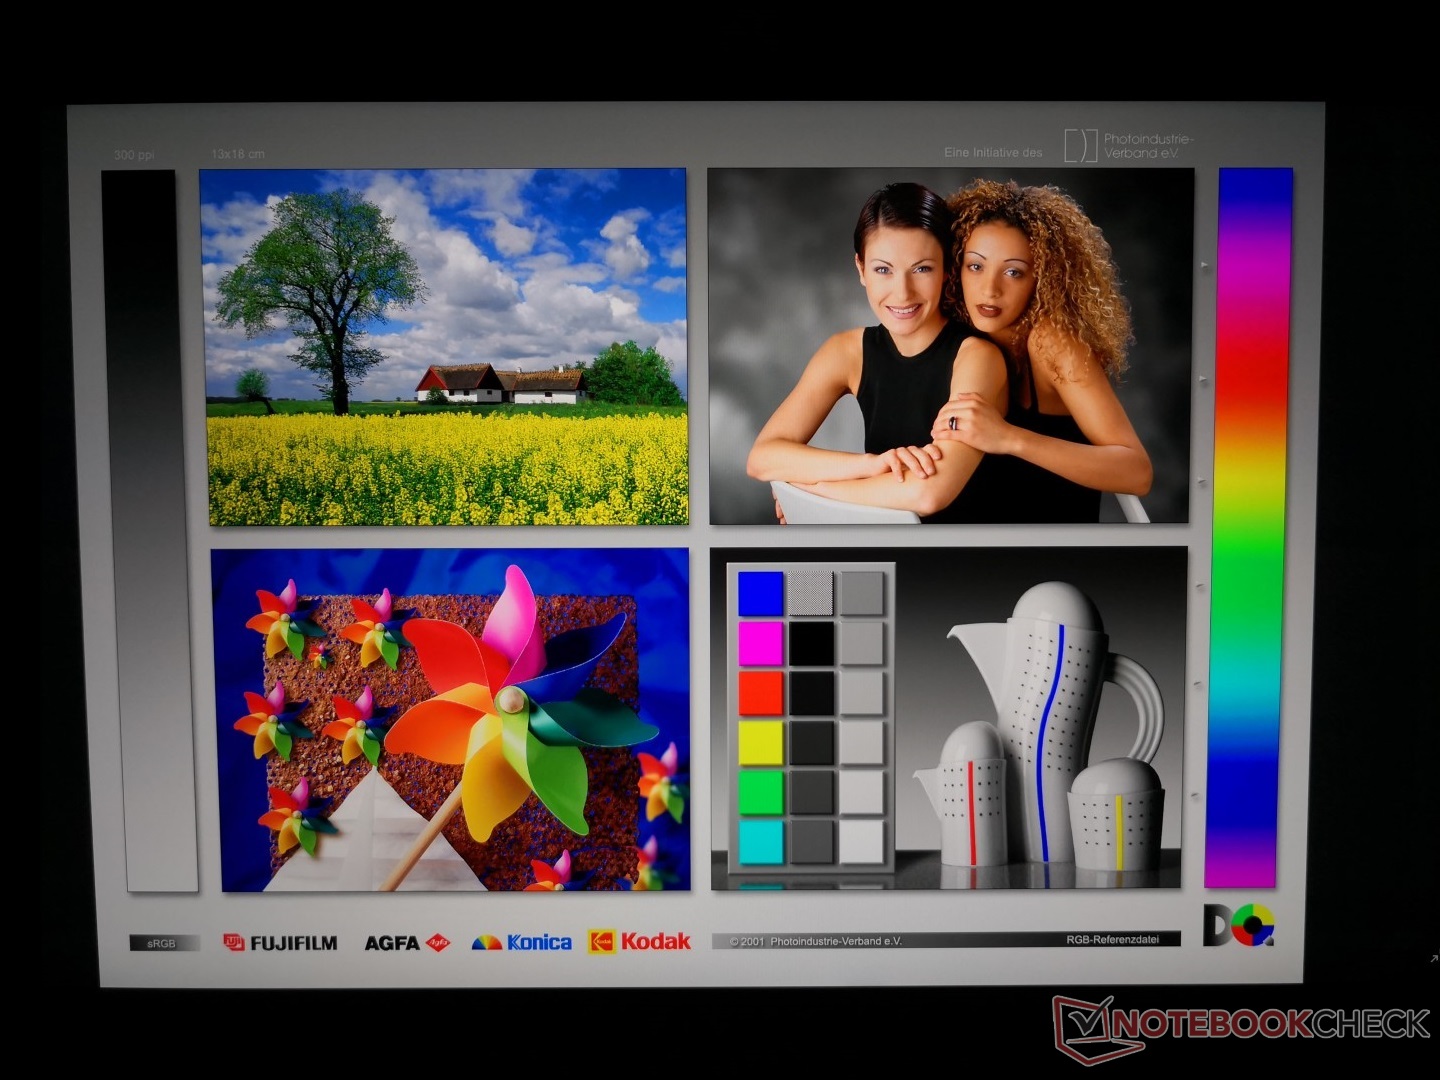
Aero laptops are notable for their color-accurate pre-calibrated Pantone certified displays and the Aero 17 is no exception. The 4K UHD AU Optronics B173ZAN03.2 IPS panel on our test unit is a newer version of the 4K UHD AU Optronics B173ZAN01.0 IPS panel as found on the last generation Alienware m17. Attributes like the wide color space (>100 percent sRGB) and high contrast ratio (~1500:1) remain. Response times, however, continue to be only average meaning that ghosting is still noticeable when gaming. This specific drawback makes the Aorus series or the standard FHD SKUs more attractive to gamers as these alternatives tend to offer displays with faster response times.
The most distinguishing characteristic of the Aero 17 HDR400 display is its very high brightness. At almost 650 nits, the Aero is two times brighter than most other 17.3-inch consumer laptops currently in the market. Both the high brightness and high contrast ratio are requirements for an HDR panel in order to accentuate the minute details of a scene that is both very dark and very bright.
There is a slight layer of graininess on the Aero that is common amongst most matte panels. While this makes the display a bit less sharp than a glossy alternative, the differences are not significant enough to be a real concern. Uneven backlight bleeding is also kept to a minimum in spite of the very high brightness.
We're able to notice a small bug related to the brightness setting. When at 23 percent brightness or under, the display will not change brightness at all. It's not until you reach 24 percent brightness or greater will the display brightness start to change. In other words, you've already reached the minimum brightness of the display when the brightness setting is at 23 percent.
| |||||||||||||||||||||||||
Brightness Distribution: 90 %
Center on Battery: 667.3 cd/m²
Contrast: 1451:1 (Black: 0.46 cd/m²)
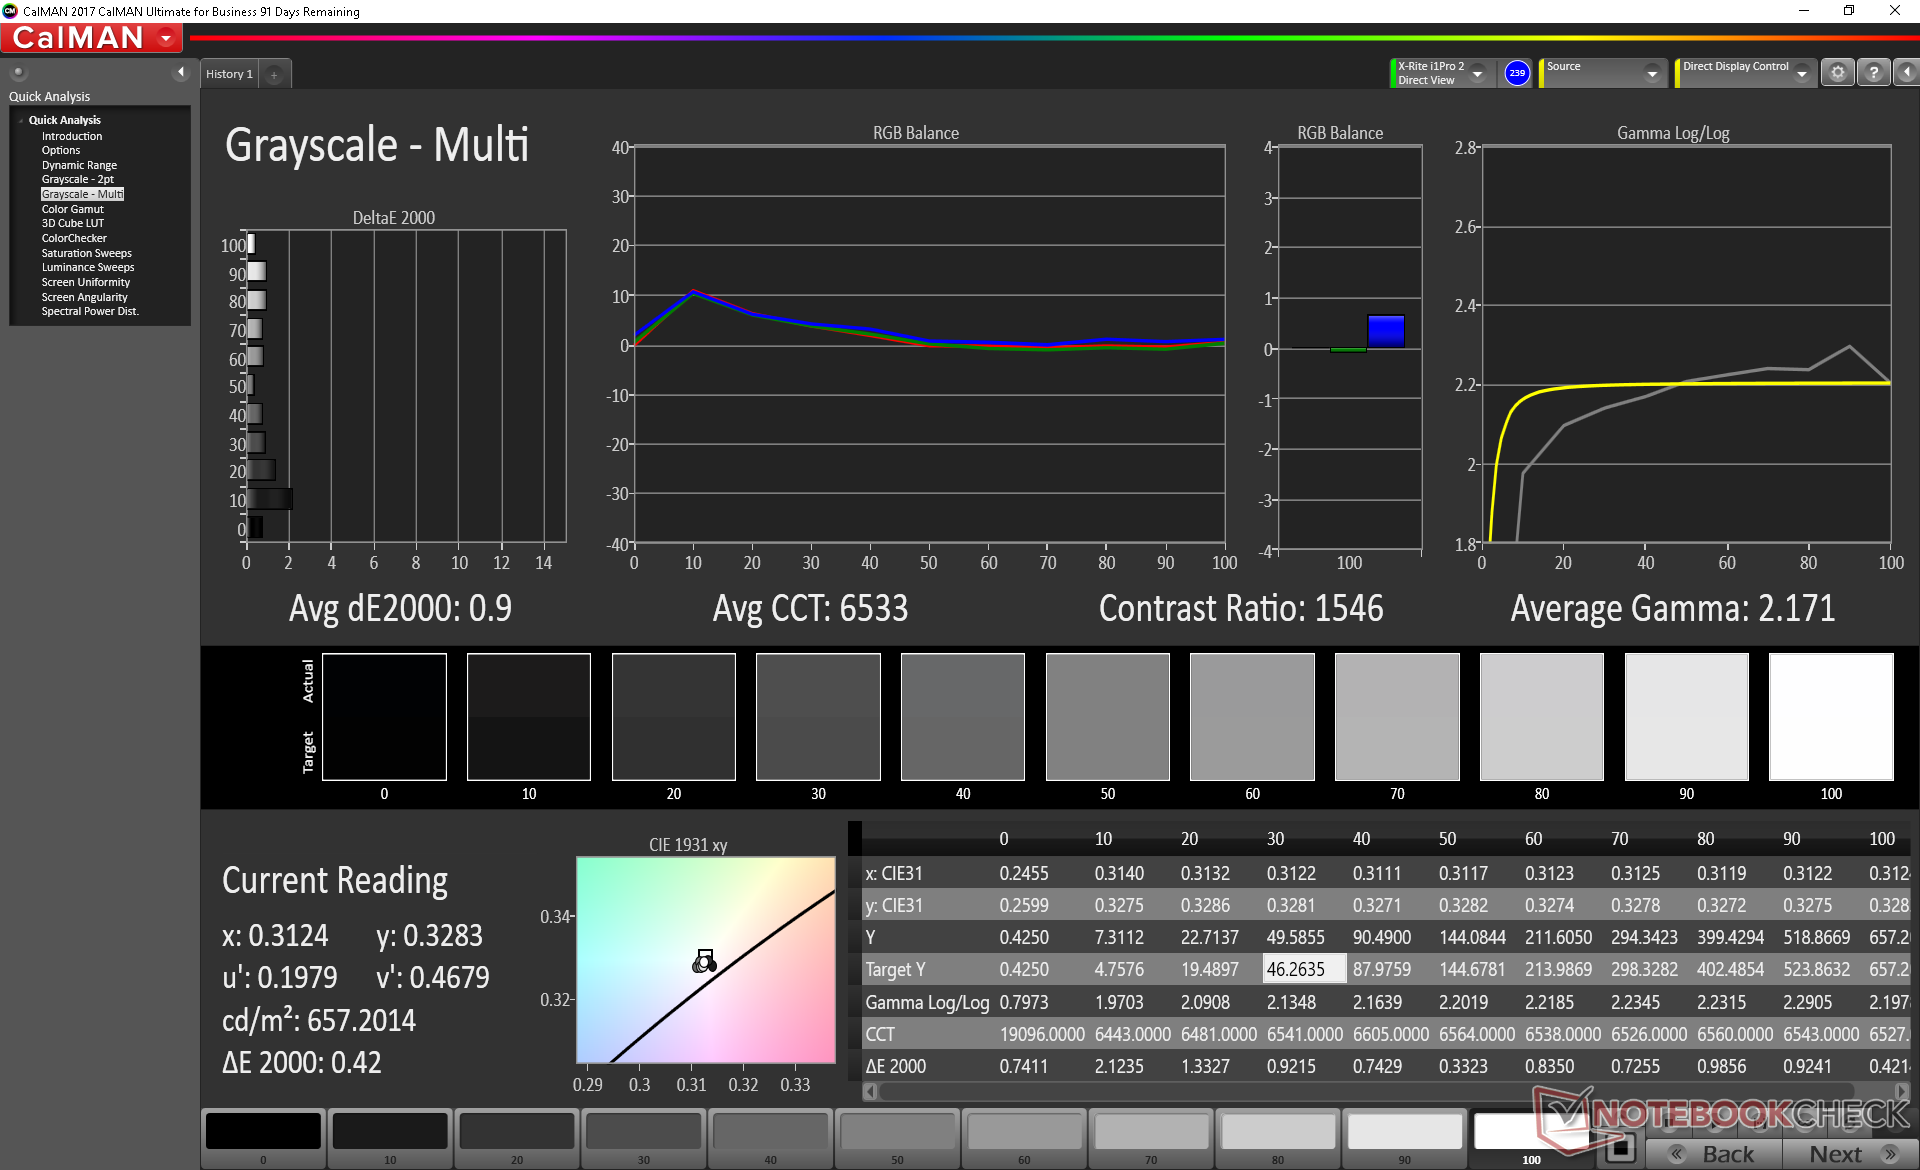
ΔE Color 3.53 | 0.5-29.43 Ø5, calibrated: 3.79
ΔE Greyscale 0.9 | 0.57-98 Ø5.3
100% sRGB (Argyll 1.6.3 3D)
87.1% AdobeRGB 1998 (Argyll 1.6.3 3D)
99.5% AdobeRGB 1998 (Argyll 2.2.0 3D)
100% sRGB (Argyll 2.2.0 3D)
86.8% Display P3 (Argyll 2.2.0 3D)
Gamma: 2.17
| Gigabyte Aero 17 XA RP77 AU Optronics B173ZAN03.2, IPS, 17.30, 3840x2160 | Razer Blade Pro 17 RTX 2080 Max-Q AU Optronics B173HAN04.0, IPS, 17.30, 1920x1080 | Aorus X7 DT v8 AU Optronics B173HAN03.0 (AUO309D), IPS, 17.30, 1920x1080 | Alienware m17 P37E AU Optronics B173ZAN01.0, IPS, 17.30, 3840x2160 | Asus Zephyrus S GX701GX B173HAN04.0 (AUO409D), IPS, 17.30, 1920x1080 | Asus Strix Hero III G731GV AU Optronics AUO B173HAN04.0, IPS, 17.30, 1920x1080 | |
|---|---|---|---|---|---|---|
| Display | -26% | -22% | 0% | -25% | -26% | |
| Display P3 Coverage | 86.8 | 60.6 -30% | 65.3 -25% | 86.4 0% | 62.9 -28% | 62.9 -28% |
| sRGB Coverage | 100 | 89 -11% | 91.2 -9% | 99.9 0% | 87.8 -12% | 87.2 -13% |
| AdobeRGB 1998 Coverage | 99.5 | 62.1 -38% | 66.3 -33% | 99.1 0% | 63.9 -36% | 63.8 -36% |
| Response Times | 77% | 61% | 15% | 76% | 73% | |
| Response Time Grey 50% / Grey 80% * | 45.6 ? | 6.8 ? 85% | 18 ? 61% | 35.6 ? 22% | 7.2 ? 84% | 6.8 ? 85% |
| Response Time Black / White * | 30.4 ? | 9.6 ? 68% | 12 ? 61% | 28 ? 8% | 9.6 ? 68% | 12 ? 61% |
| PWM Frequency | ||||||
| Screen | -32% | -10% | -61% | -4% | -31% | |
| Brightness middle | 667.3 | 299.3 -55% | 297 -55% | 357.9 -46% | 288 -57% | 312.3 -53% |
| Brightness | 633 | 294 -54% | 281 -56% | 347 -45% | 287 -55% | 297 -53% |
| Brightness Distribution | 90 | 94 4% | 84 -7% | 94 4% | 91 1% | 91 1% |
| Black Level * | 0.46 | 0.29 37% | 0.23 50% | 0.33 28% | 0.2 57% | 0.21 54% |
| Contrast | 1451 | 1032 -29% | 1291 -11% | 1085 -25% | 1440 -1% | 1487 2% |
| Colorchecker dE 2000 * | 3.53 | 2.55 28% | 2.19 38% | 6.57 -86% | 2.33 34% | 3.6 -2% |
| Colorchecker dE 2000 max. * | 6.88 | 4.73 31% | 4.81 30% | 9.86 -43% | 5.34 22% | 6.74 2% |
| Colorchecker dE 2000 calibrated * | 3.79 | 2.9 23% | 6.74 -78% | 2.47 35% | 3.95 -4% | |
| Greyscale dE 2000 * | 0.9 | 3.5 -289% | 1.31 -46% | 4.3 -378% | 1.19 -32% | 3.1 -244% |
| Gamma | 2.17 101% | 2.28 96% | 2.42 91% | 2.6 85% | 2.41 91% | 2.26 97% |
| CCT | 6533 99% | 7101 92% | 6464 101% | 6403 102% | 6710 97% | 7002 93% |
| Color Space (Percent of AdobeRGB 1998) | 87.1 | 57 -35% | 59 -32% | 88.4 1% | 57 -35% | 56.6 -35% |
| Color Space (Percent of sRGB) | 100 | 88.7 -11% | 91 -9% | 100 0% | 88 -12% | 86.6 -13% |
| Total Average (Program / Settings) | 6% /
-17% | 10% /
-3% | -15% /
-40% | 16% /
2% | 5% /
-17% |
* ... smaller is better
Color space is wider than any 144 Hz or 240 Hz IPS alternative to appeal to professionals. On the other hand, this comes at the cost of refresh rate as the 4K UHD SKUs are limited to 60 Hz. Gigabyte promises 100 percent AdobeRGB coverage which is similar to our 87 percent recording of the AdobeRGB 3D space.
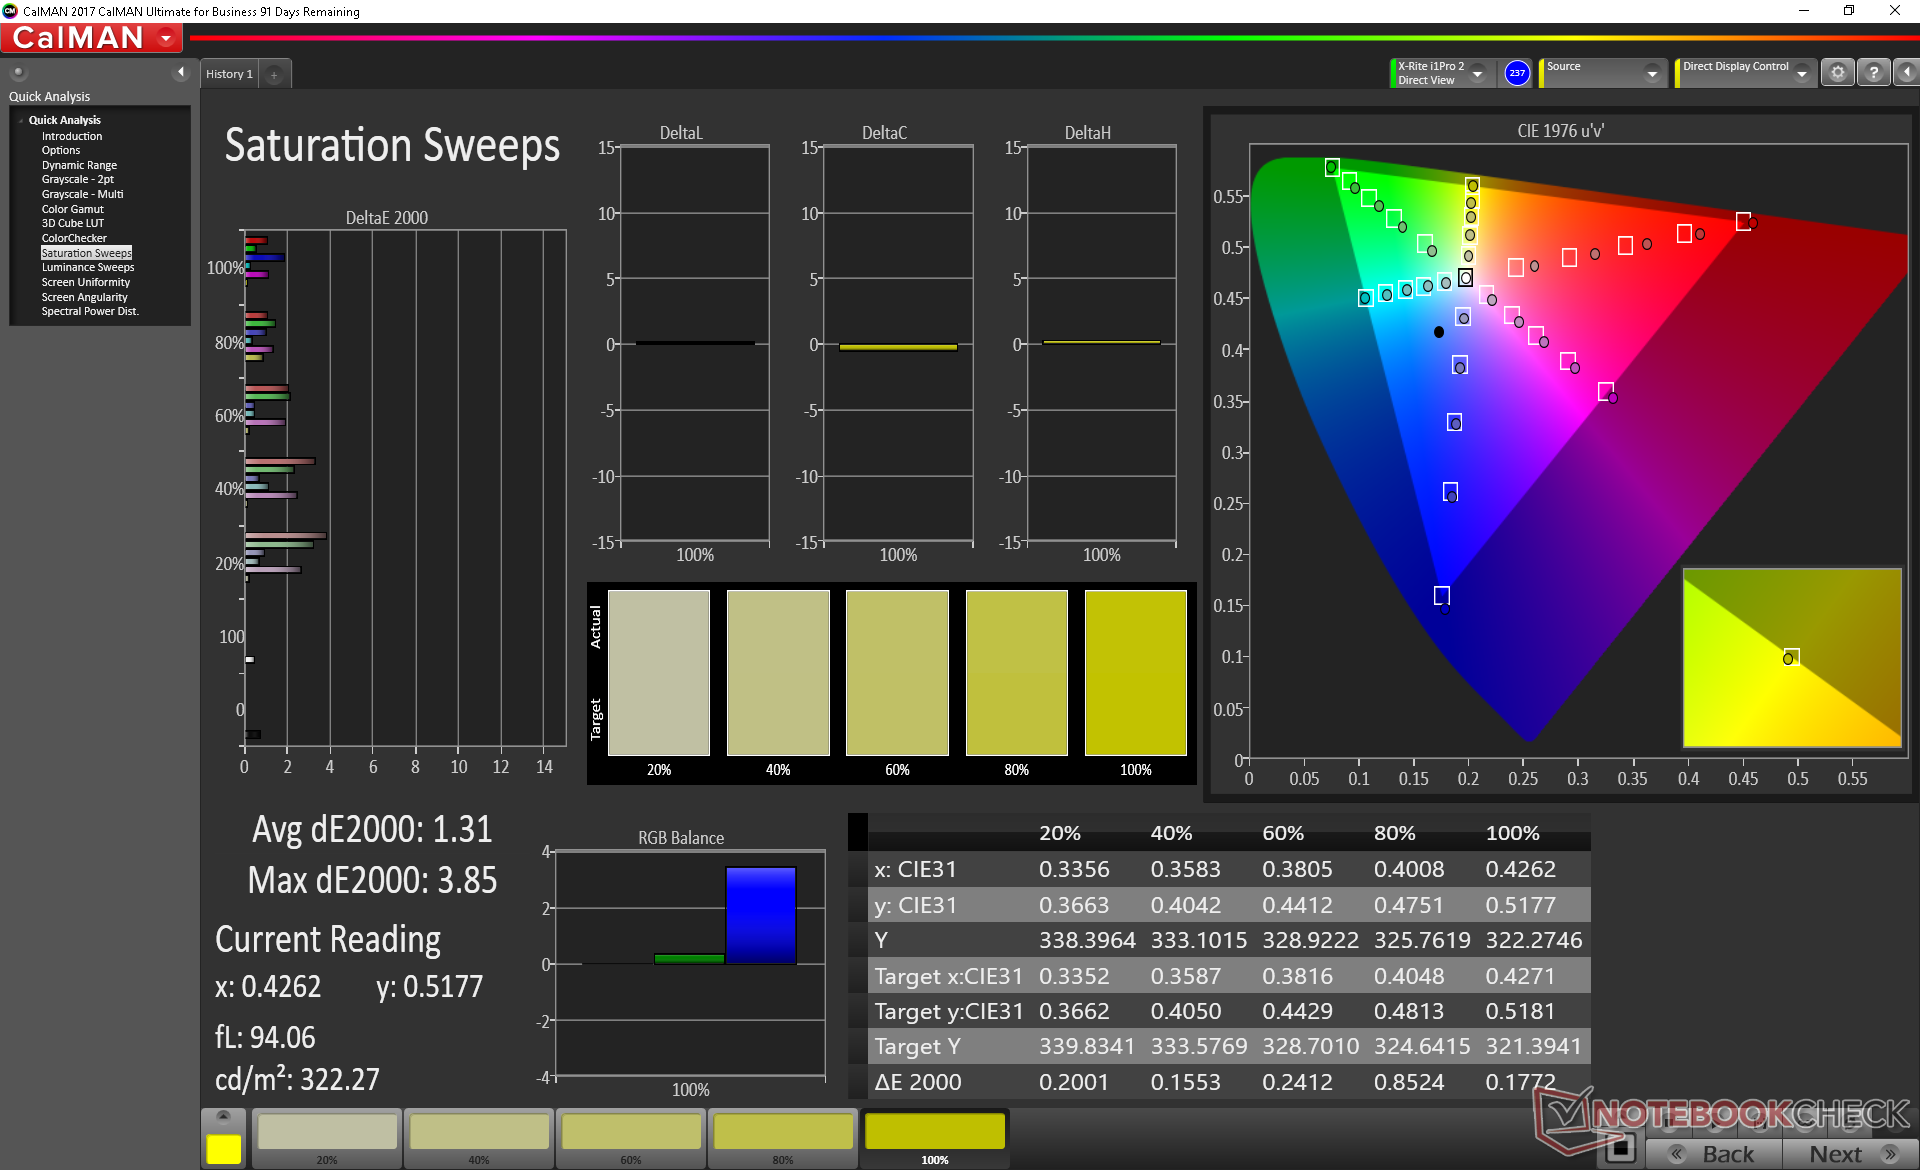
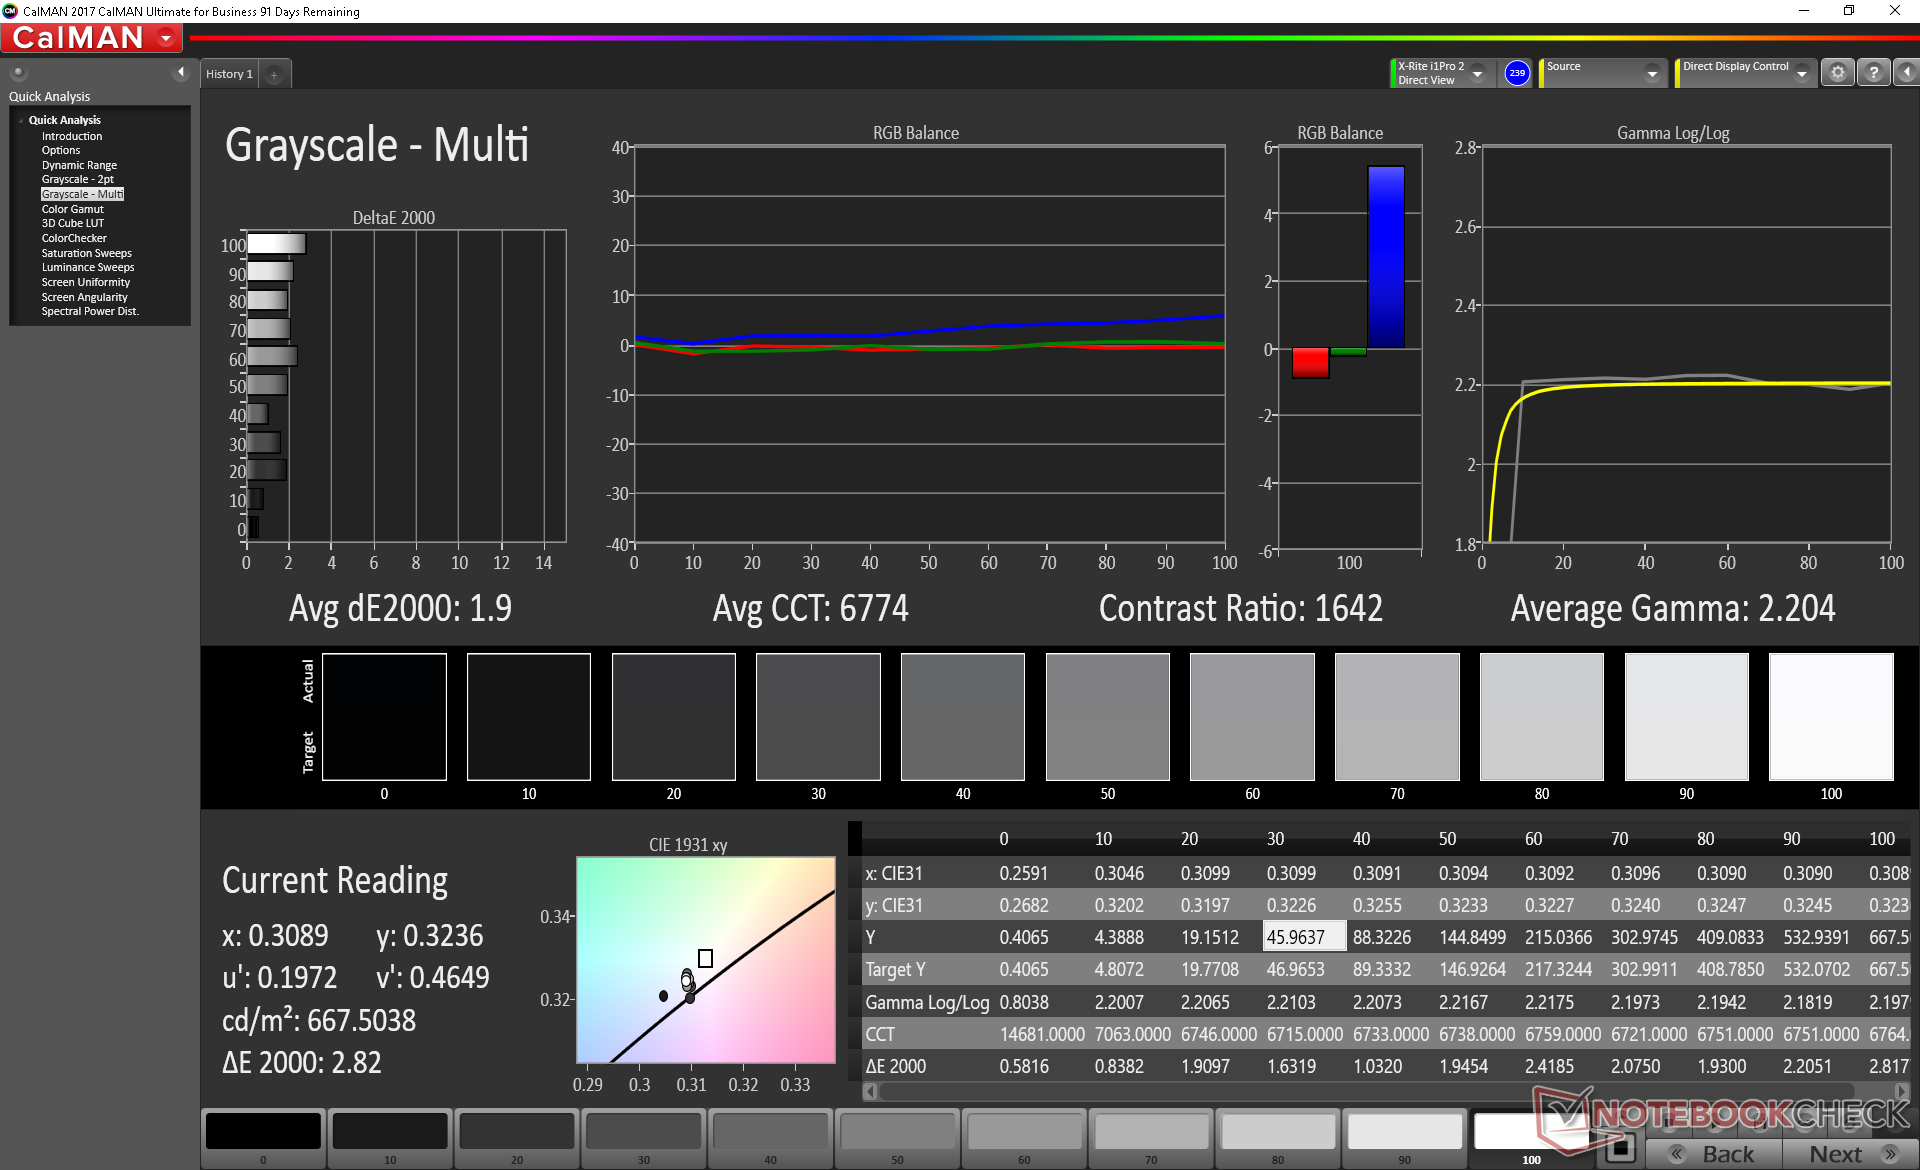
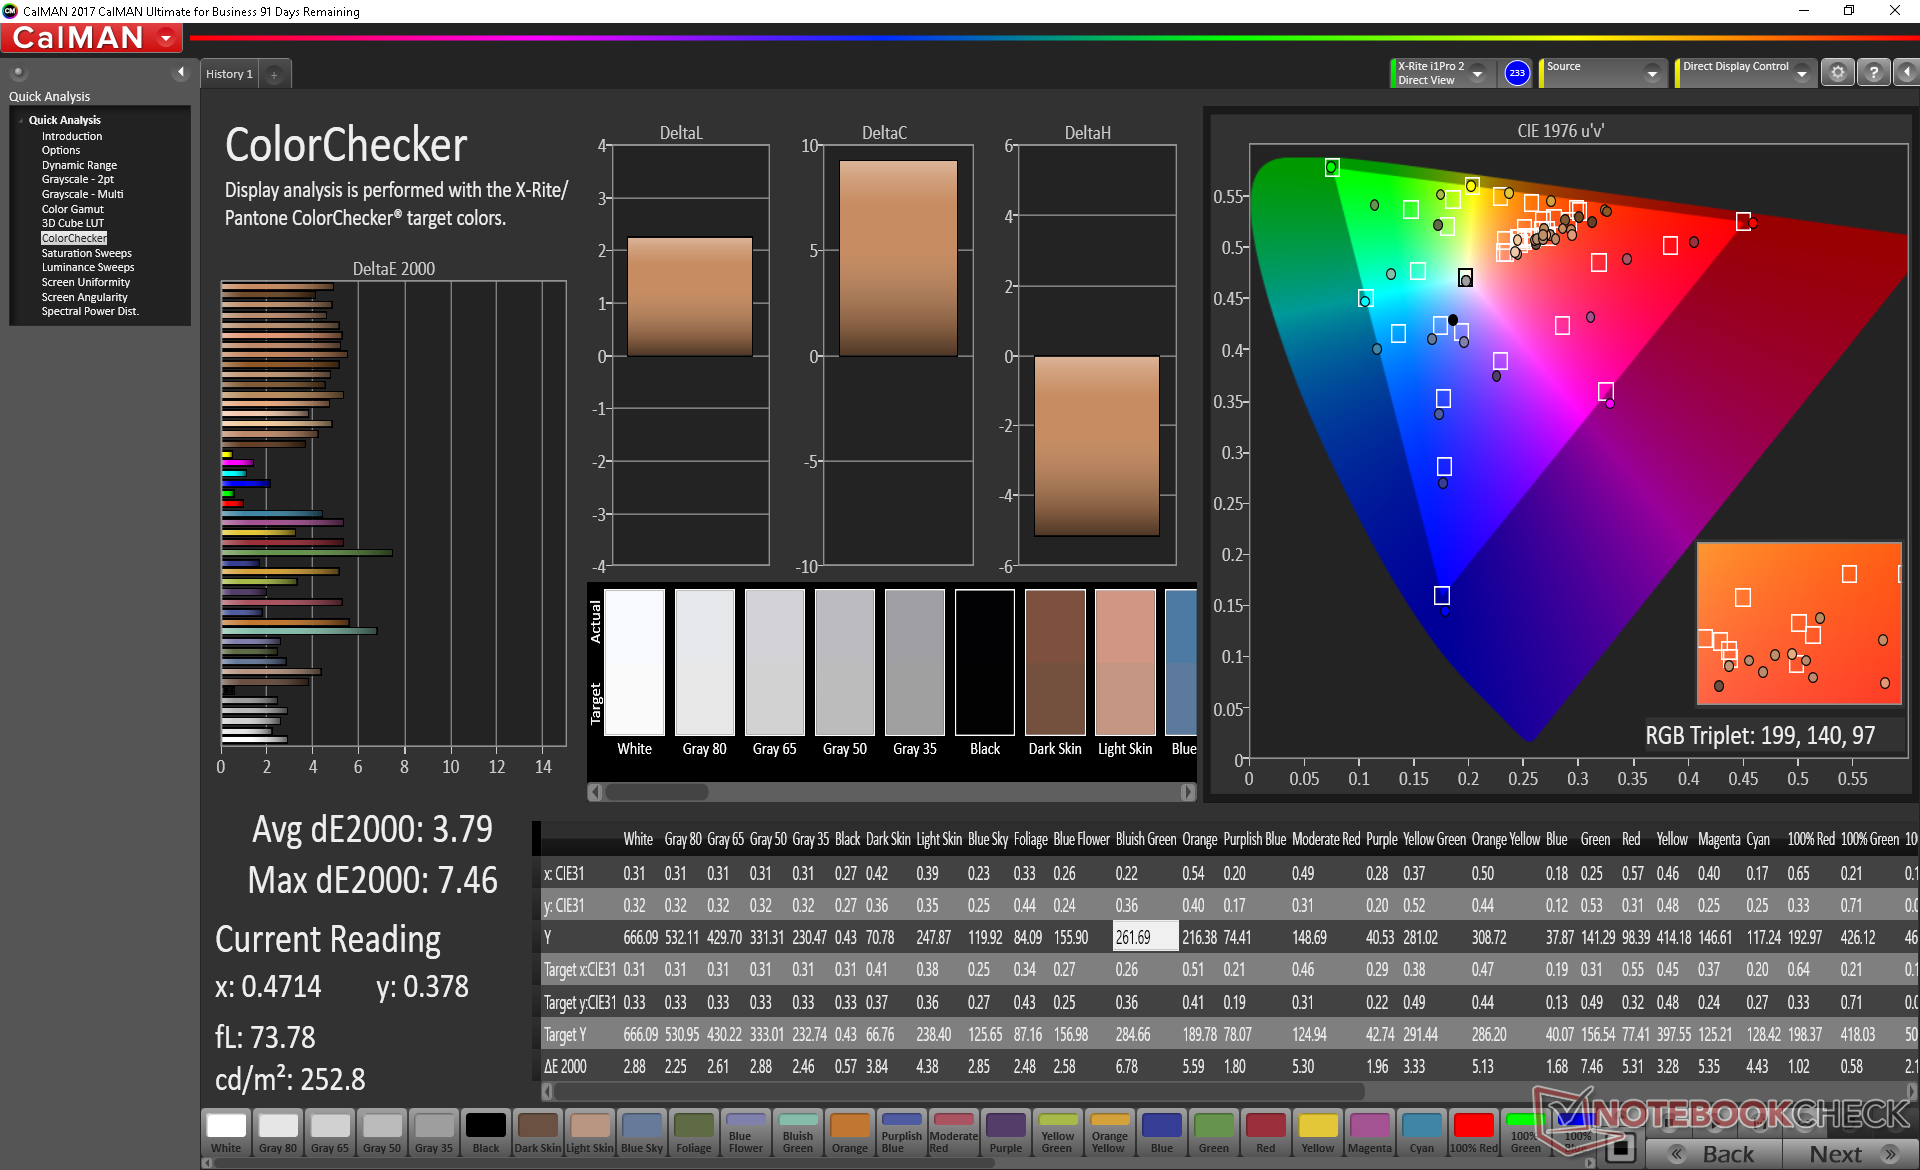
Further measurements with an X-Rite colorimeter prove just how accurate Aero displays can be out of the box. Even without any end-user calibration, average grayscale and color saturation deltaE values sit at just 0.9 and 1.31, respectively, when up against the AdobeRGB standard. Most multimedia laptops would be lucky to have deltaE values this low after calibration.


Display Response Times
| ↔ Response Time Black to White | ||
|---|---|---|
| 30.4 ms ... rise ↗ and fall ↘ combined | ↗ 16.4 ms rise | 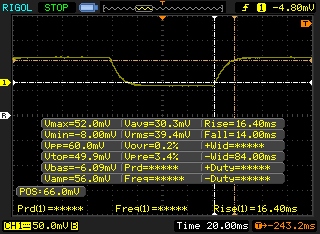 |
| ↘ 14 ms fall | ||
| The screen shows slow response rates in our tests and will be unsatisfactory for gamers. In comparison, all tested devices range from 0.1 (minimum) to 240 (maximum) ms. » 80 % of all devices are better. This means that the measured response time is worse than the average of all tested devices (21.5 ms). | ||
| ↔ Response Time 50% Grey to 80% Grey | ||
| 45.6 ms ... rise ↗ and fall ↘ combined | ↗ 24.4 ms rise | 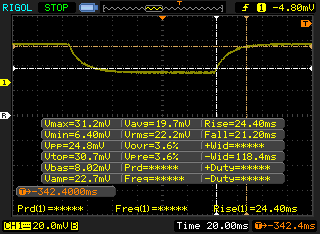 |
| ↘ 21.2 ms fall | ||
| The screen shows slow response rates in our tests and will be unsatisfactory for gamers. In comparison, all tested devices range from 0.2 (minimum) to 636 (maximum) ms. » 75 % of all devices are better. This means that the measured response time is worse than the average of all tested devices (33.7 ms). | ||
Screen Flickering / PWM (Pulse-Width Modulation)
| Screen flickering / PWM not detected | 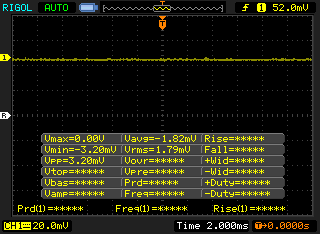 | ||
In comparison: 53 % of all tested devices do not use PWM to dim the display. If PWM was detected, an average of 17903 (minimum: 5 - maximum: 3846000) Hz was measured. | |||
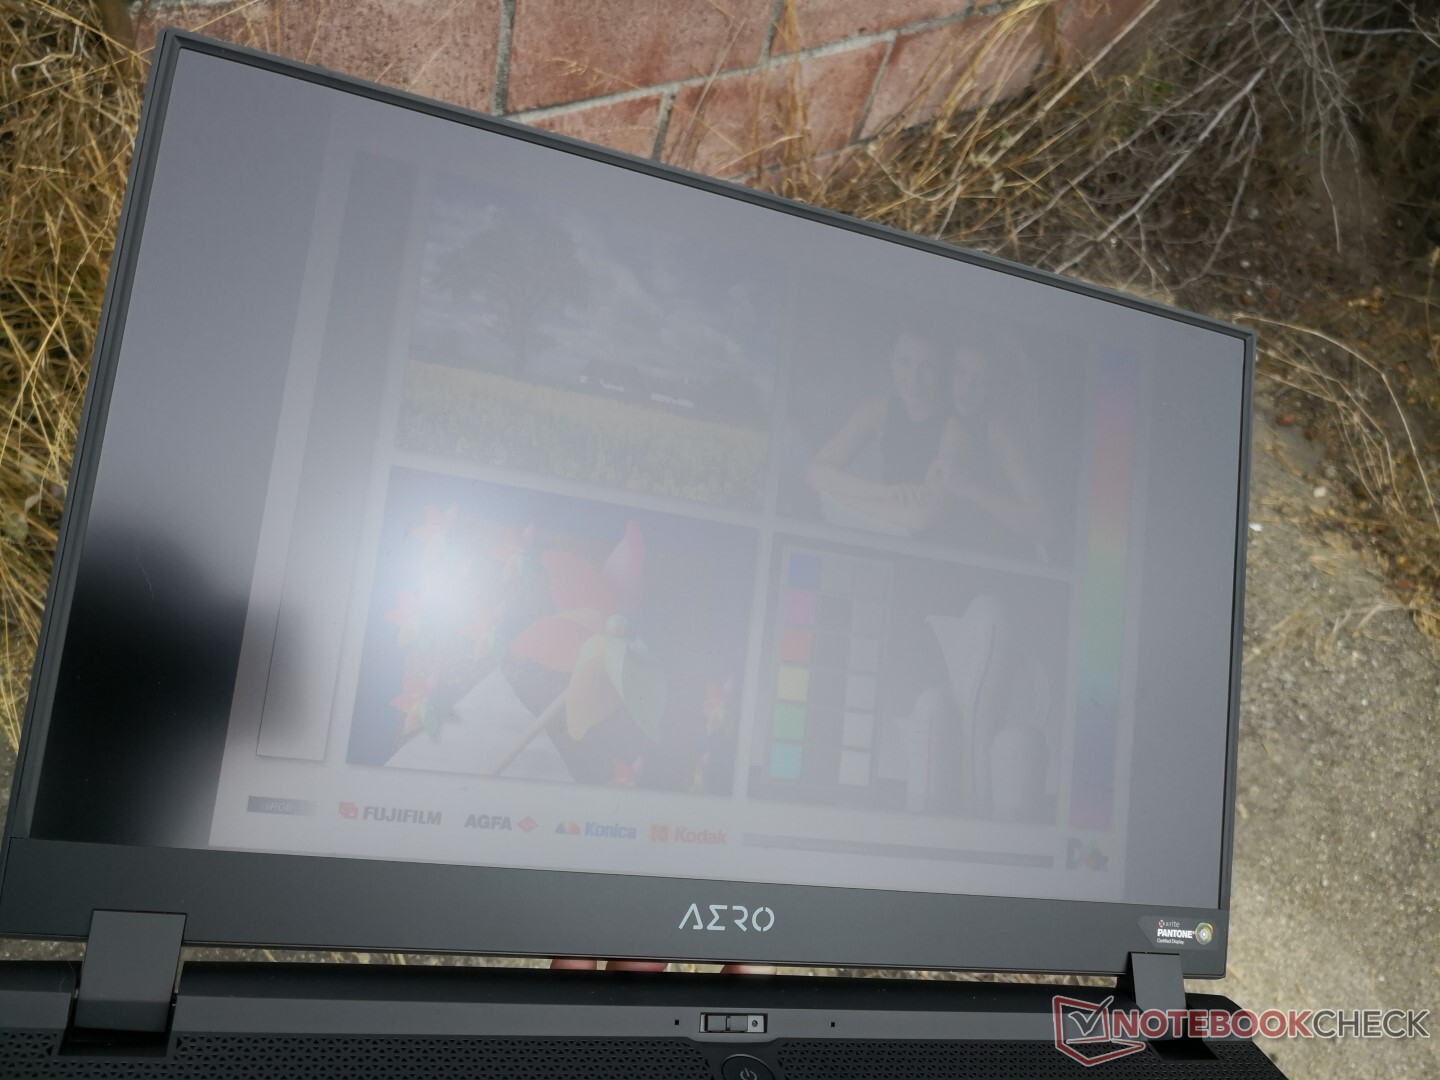
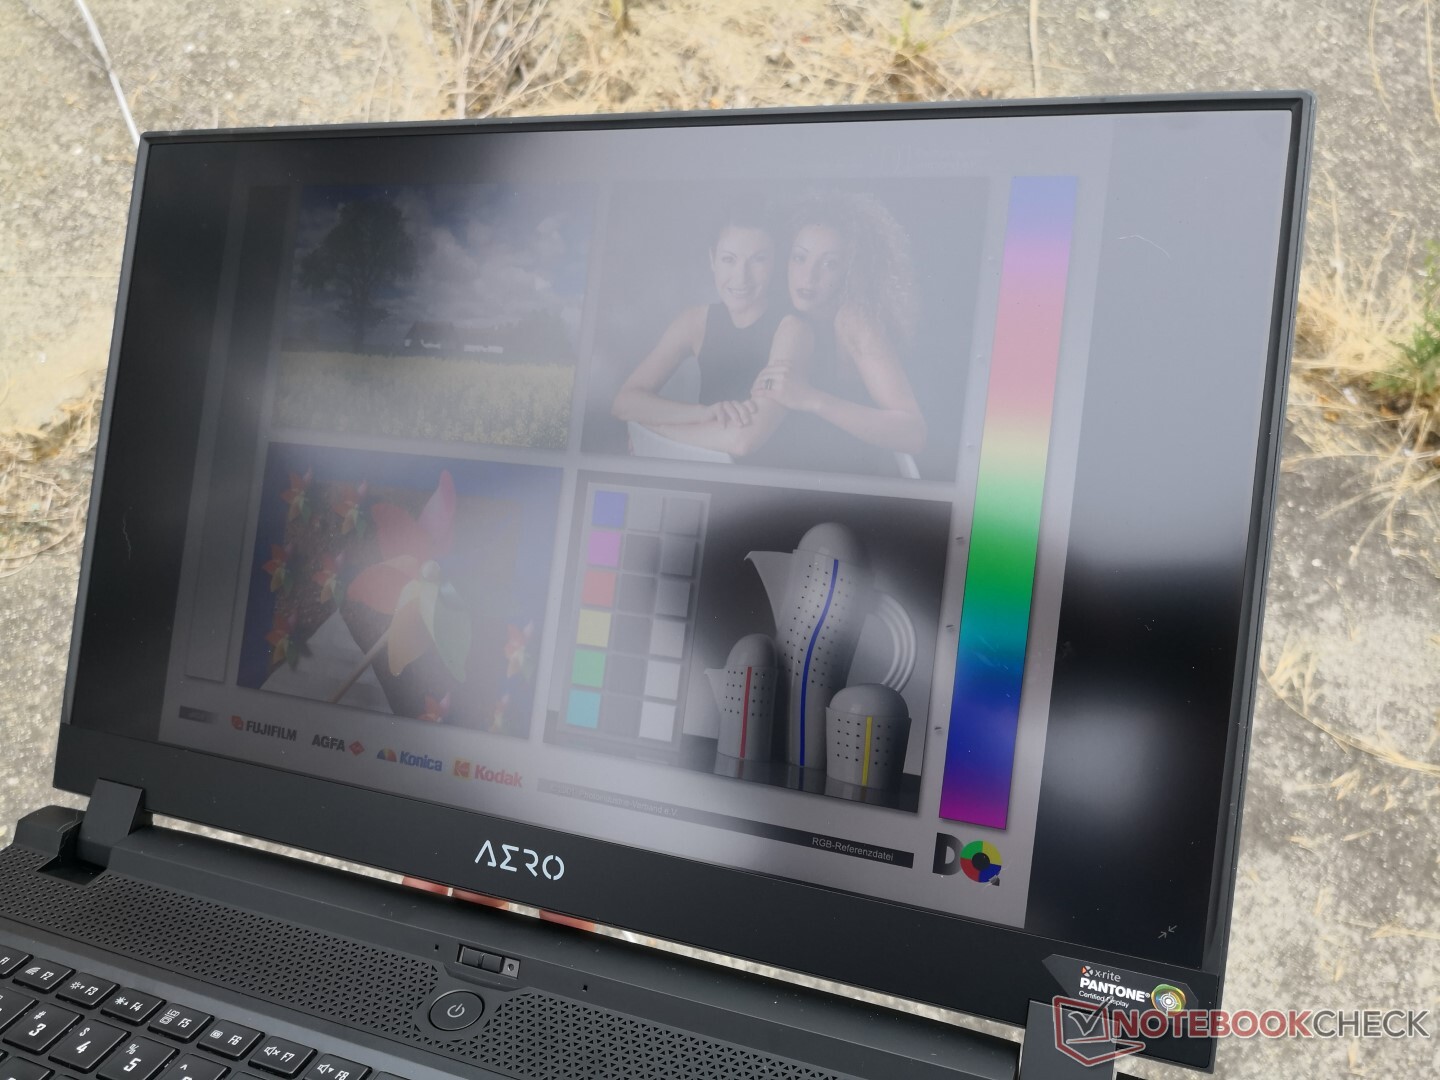
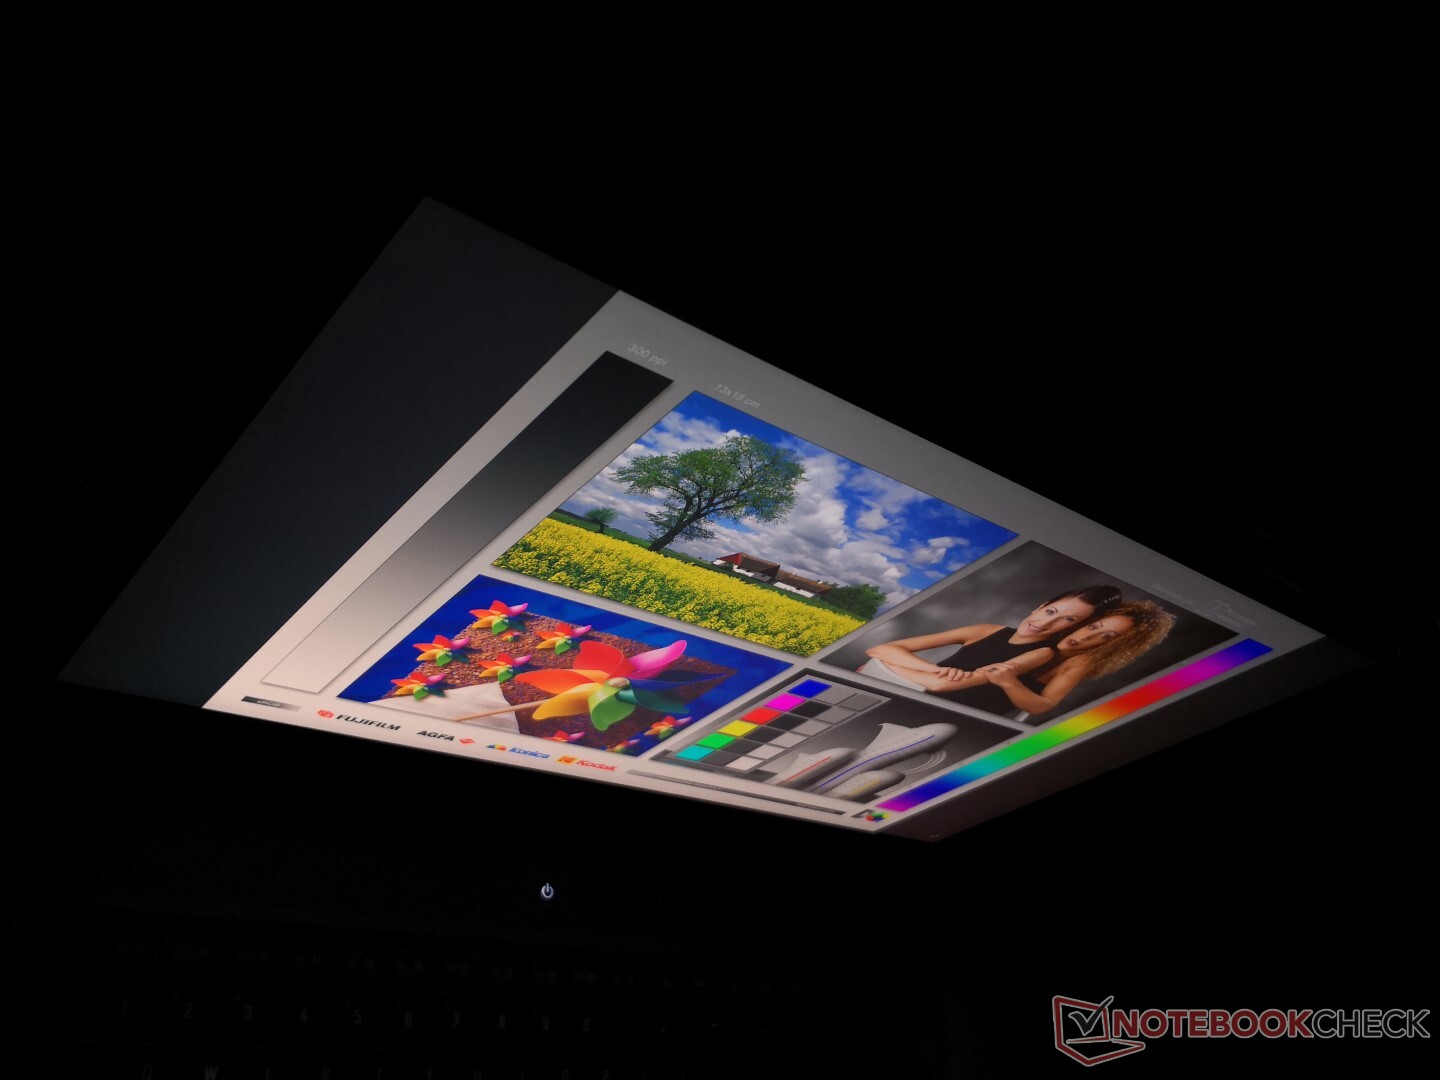
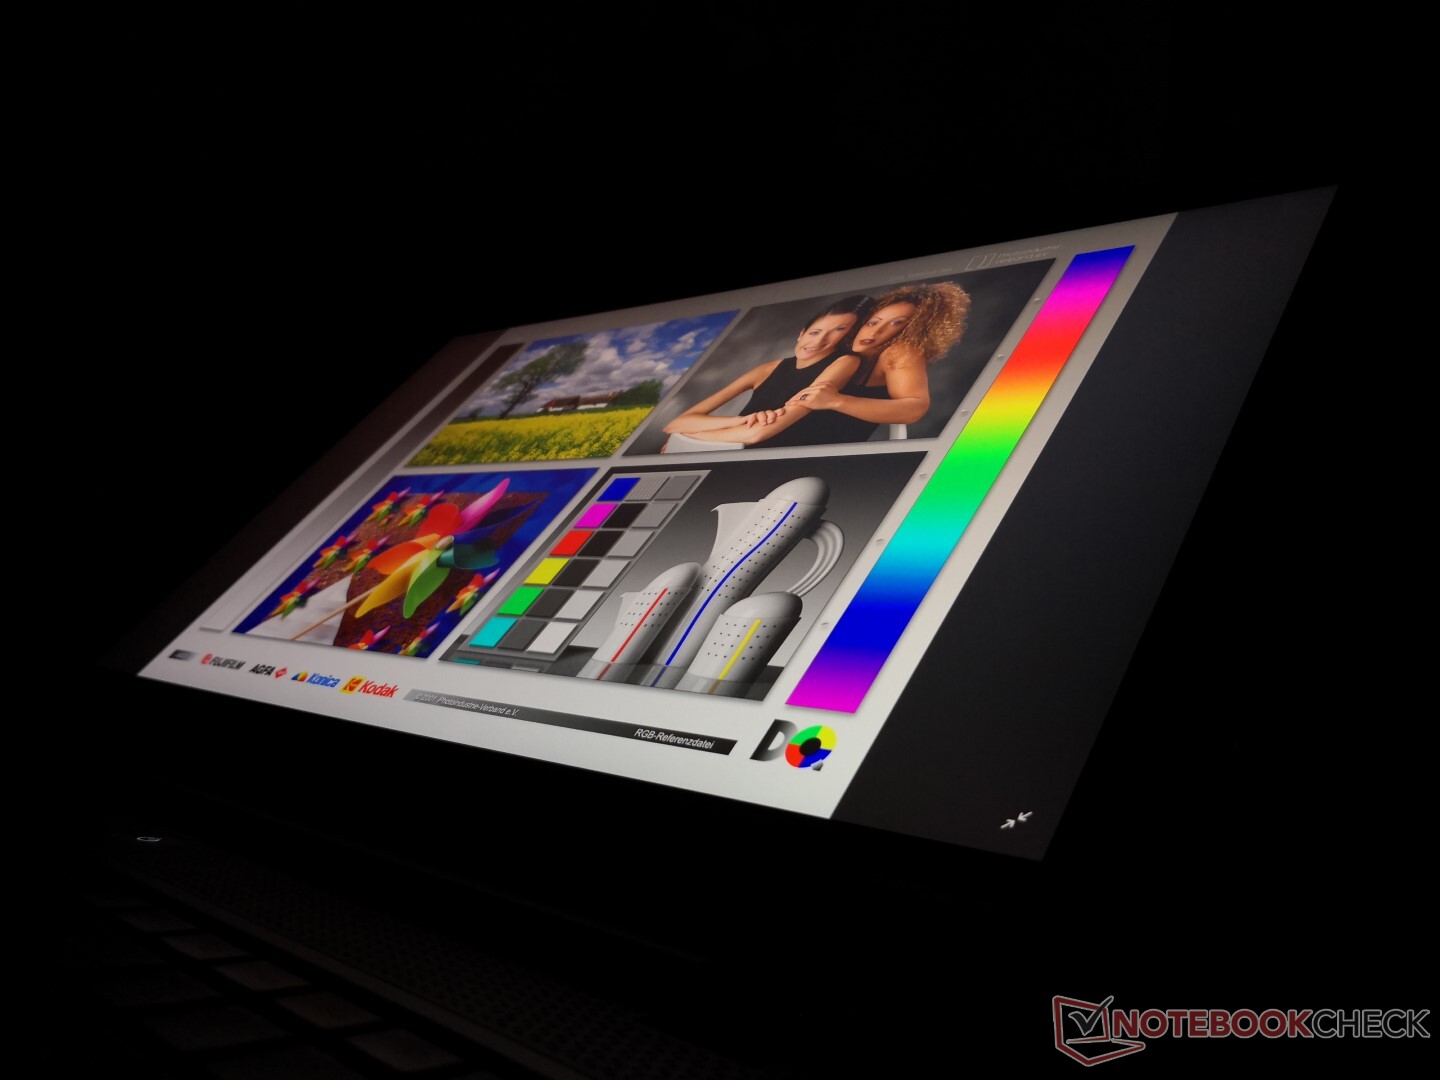
Outdoor visibility is better than other 17.3-inch laptops due to the brighter backlight. Even so, glare from the sky will still be prevalent as shown by the images below unless if working under shade. We recommend a high text scaling setting especially since this is a 4K panel.
Performance
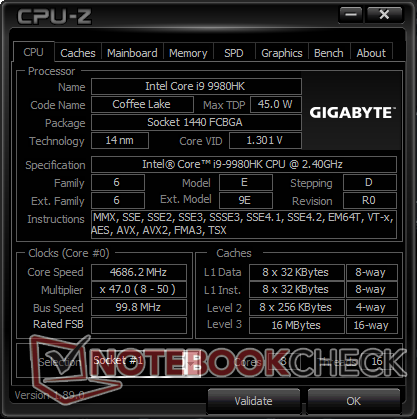
The octa-core Core i9-9980HK is Intel's premier 10th gen Coffee Lake-H offering to succeed the last generation hexa-core Core i9-8950HK. Gigabyte is clearly gunning for the high-end space no matter the configuration. Optimus comes standard to automatically exclude G-Sync.
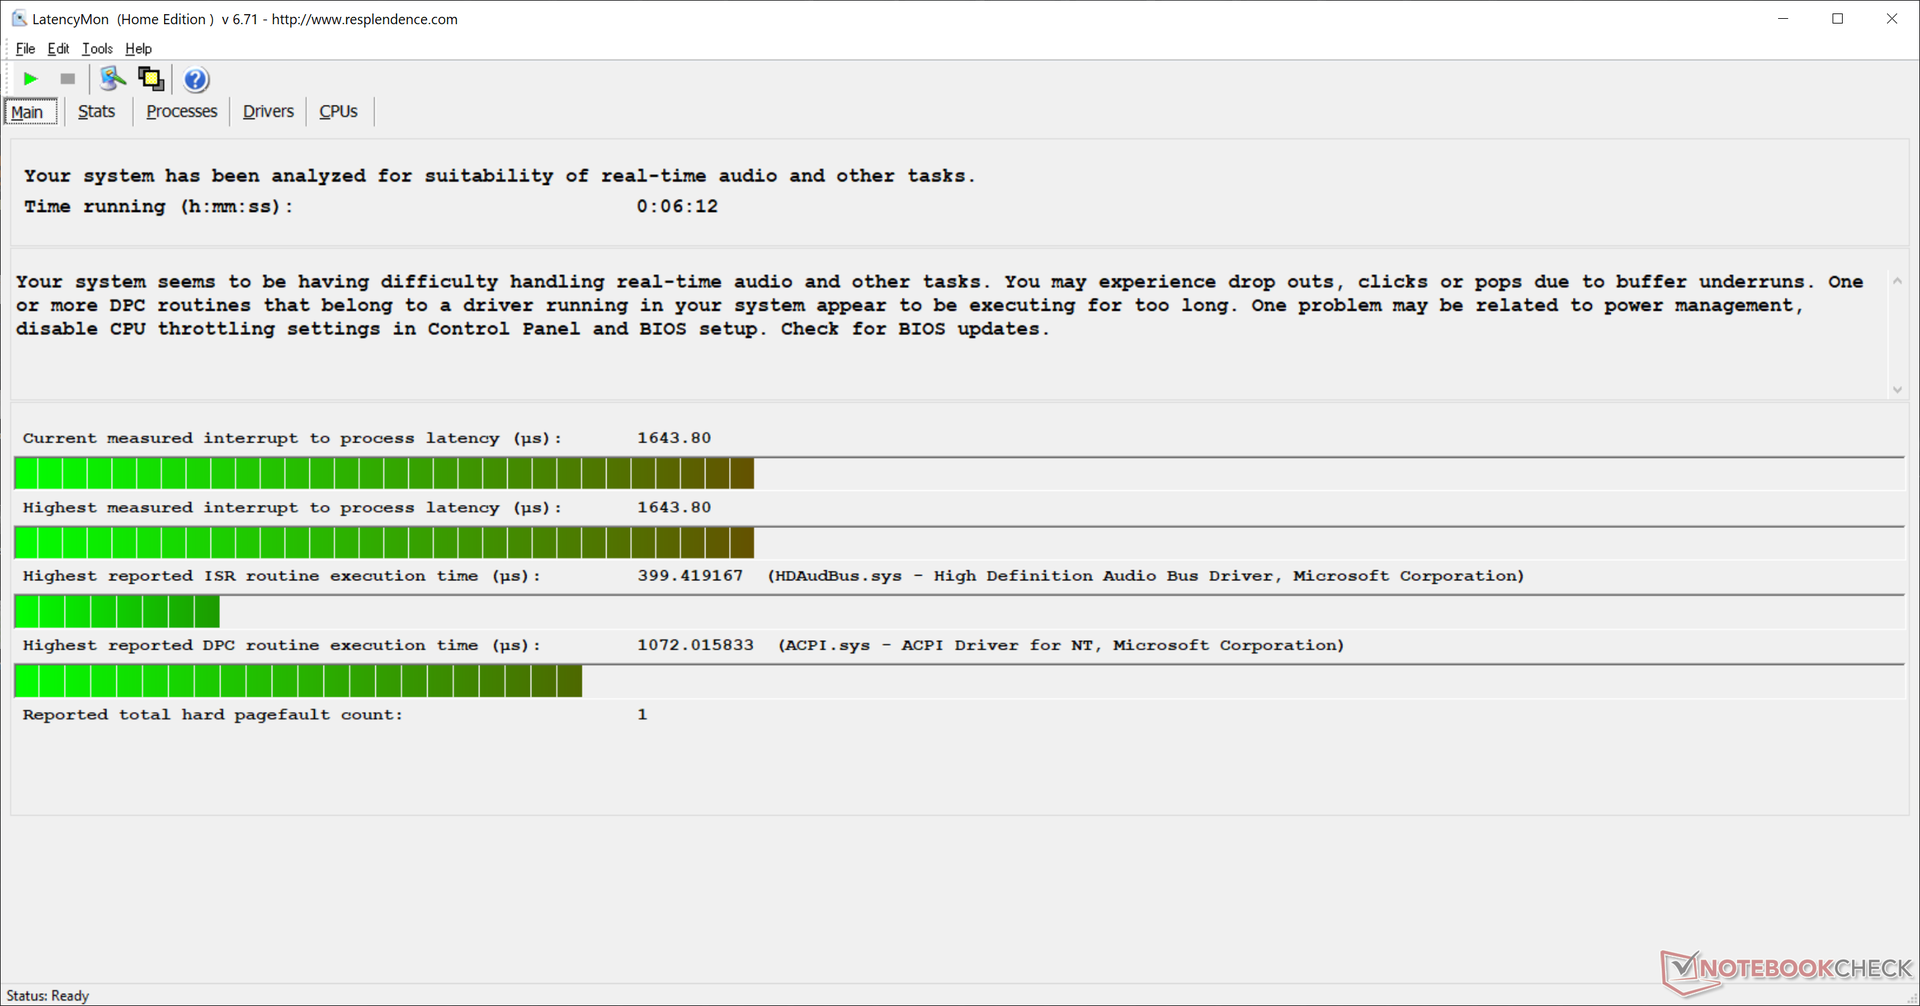
LatencyMon shows DPC latency issues even when wireless is disabled. However, the single spike would occur only once during a 10-minute period.
Processor
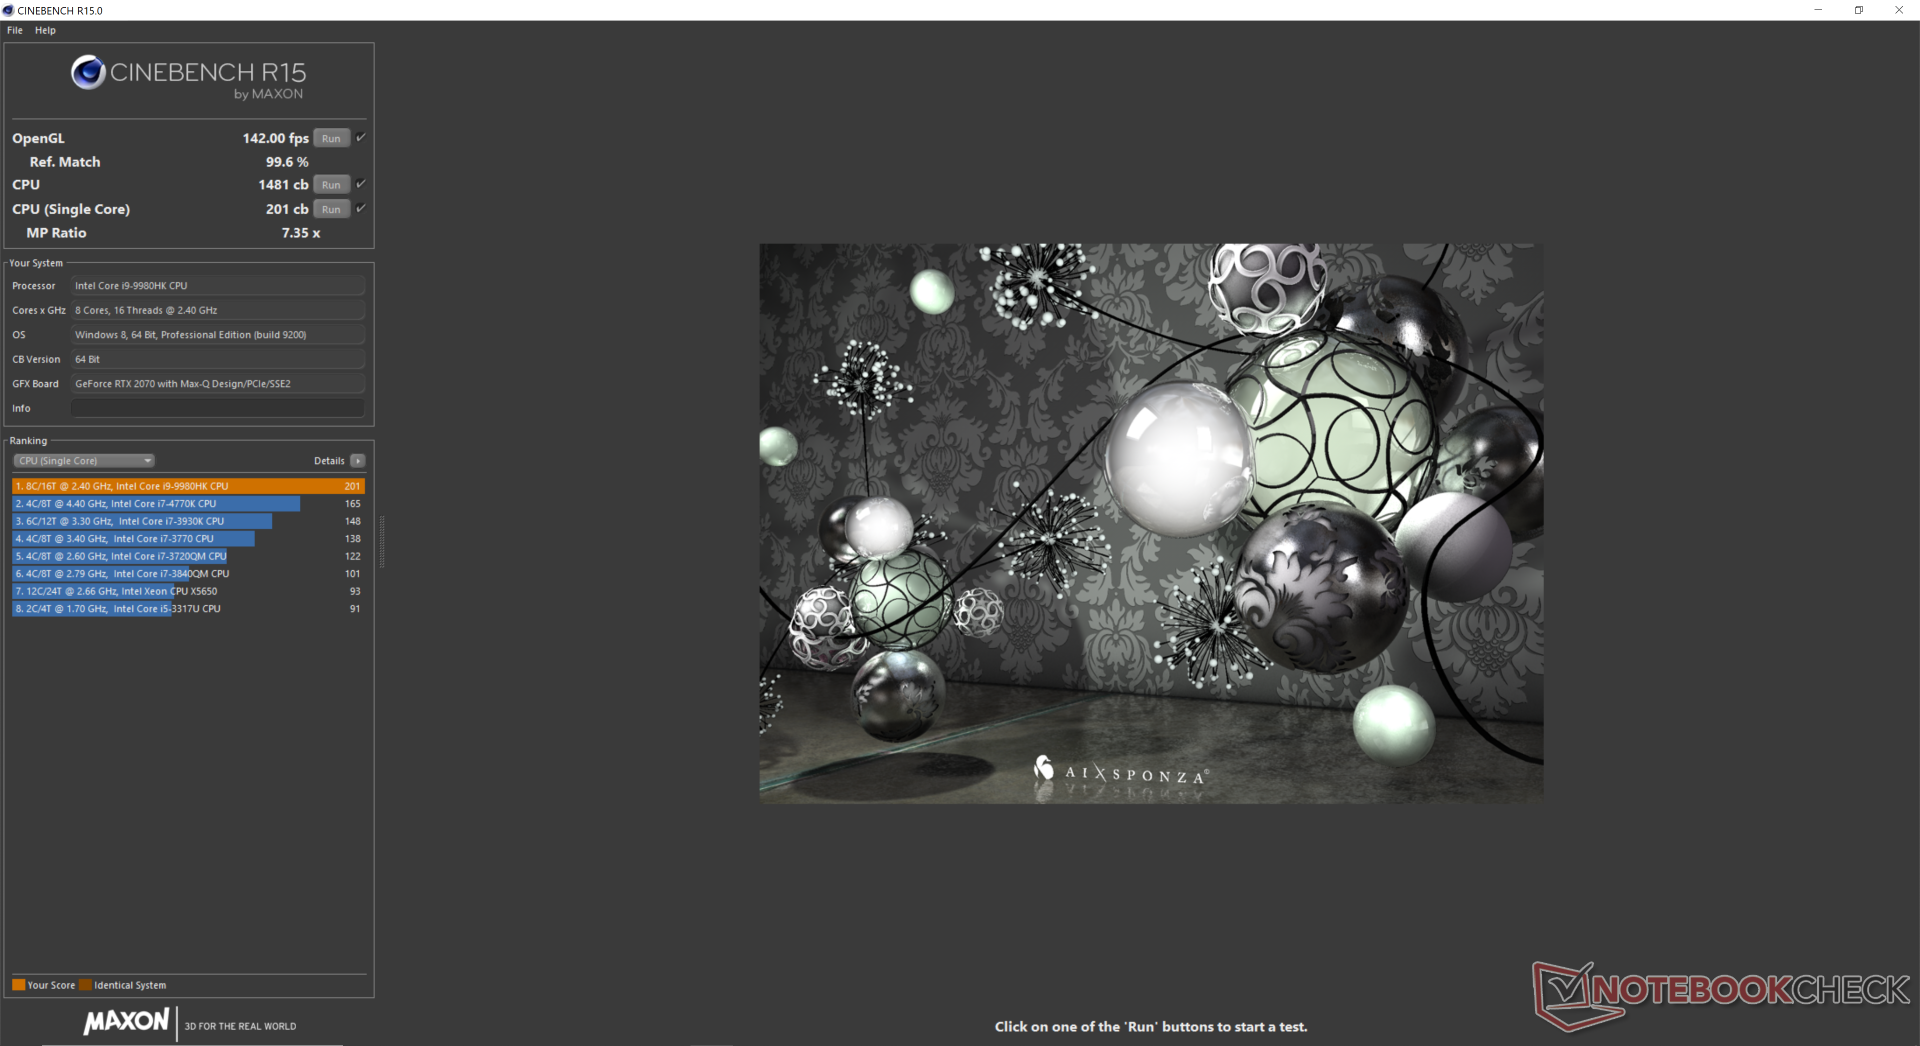
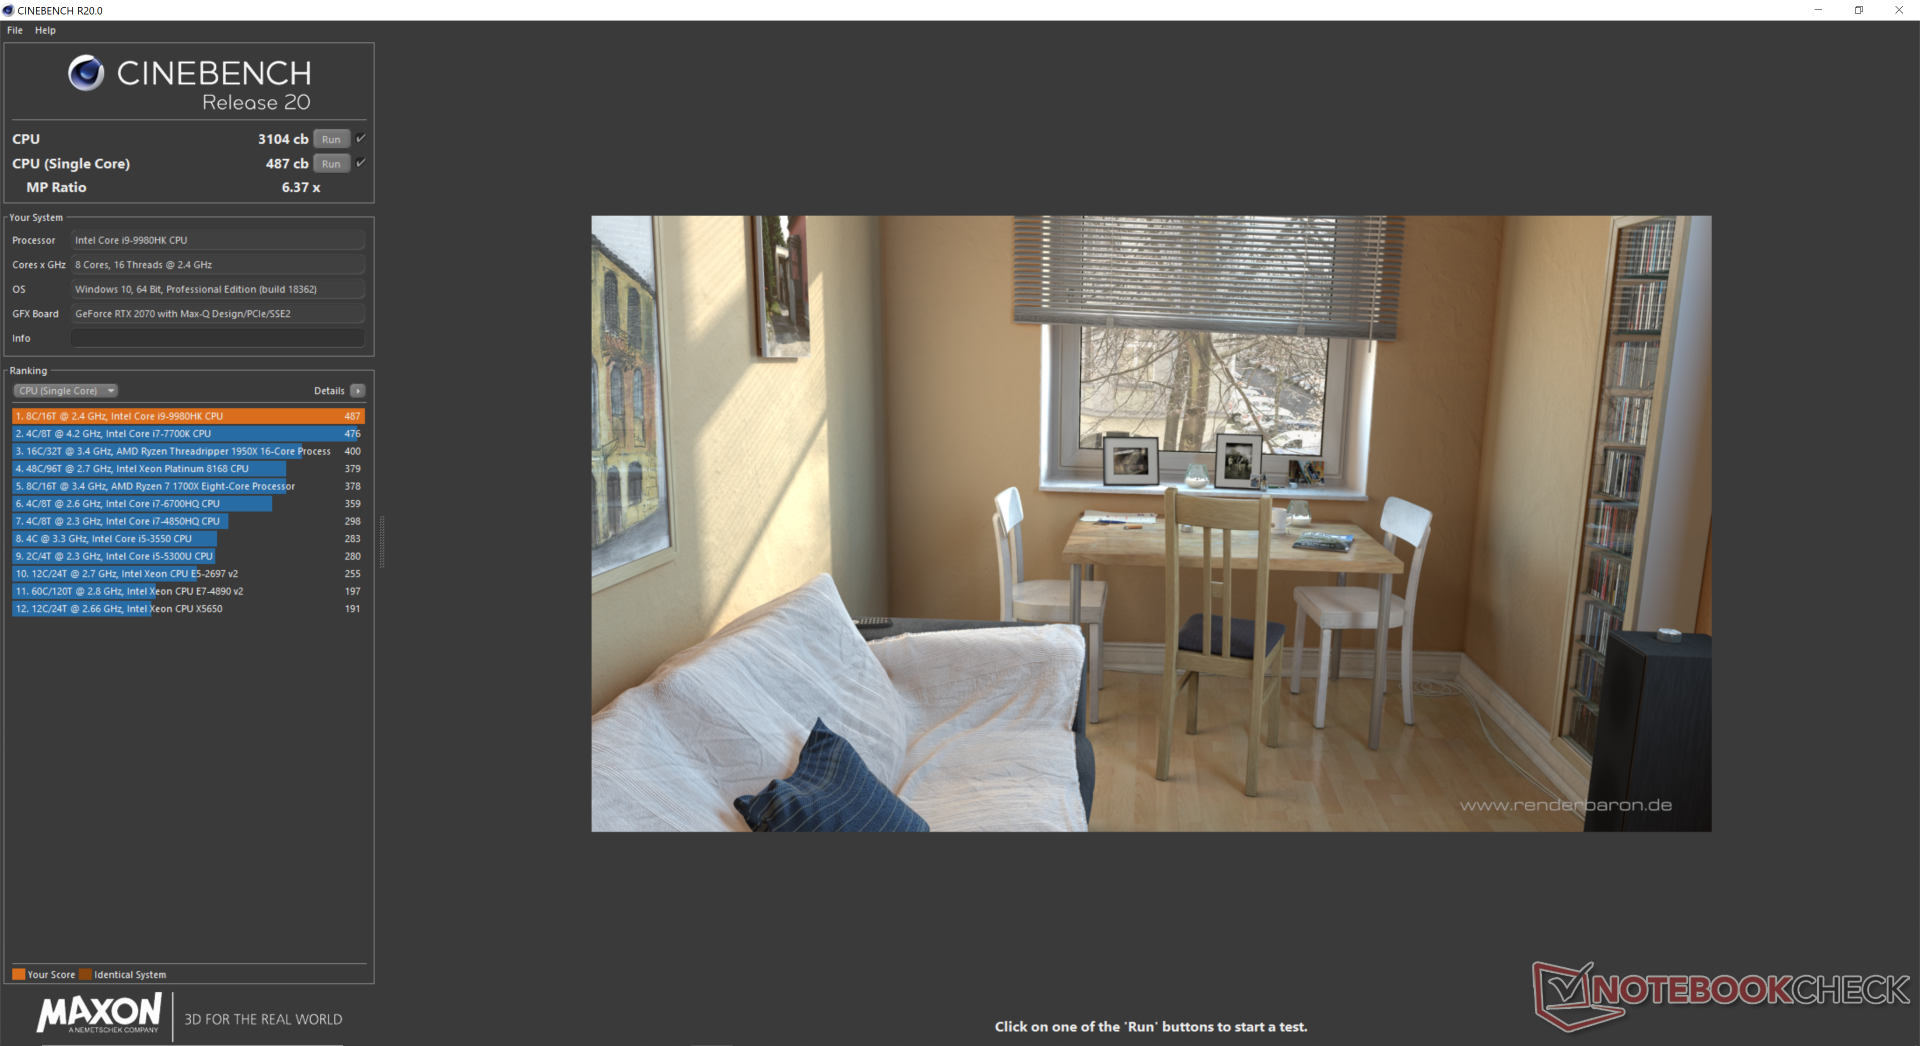
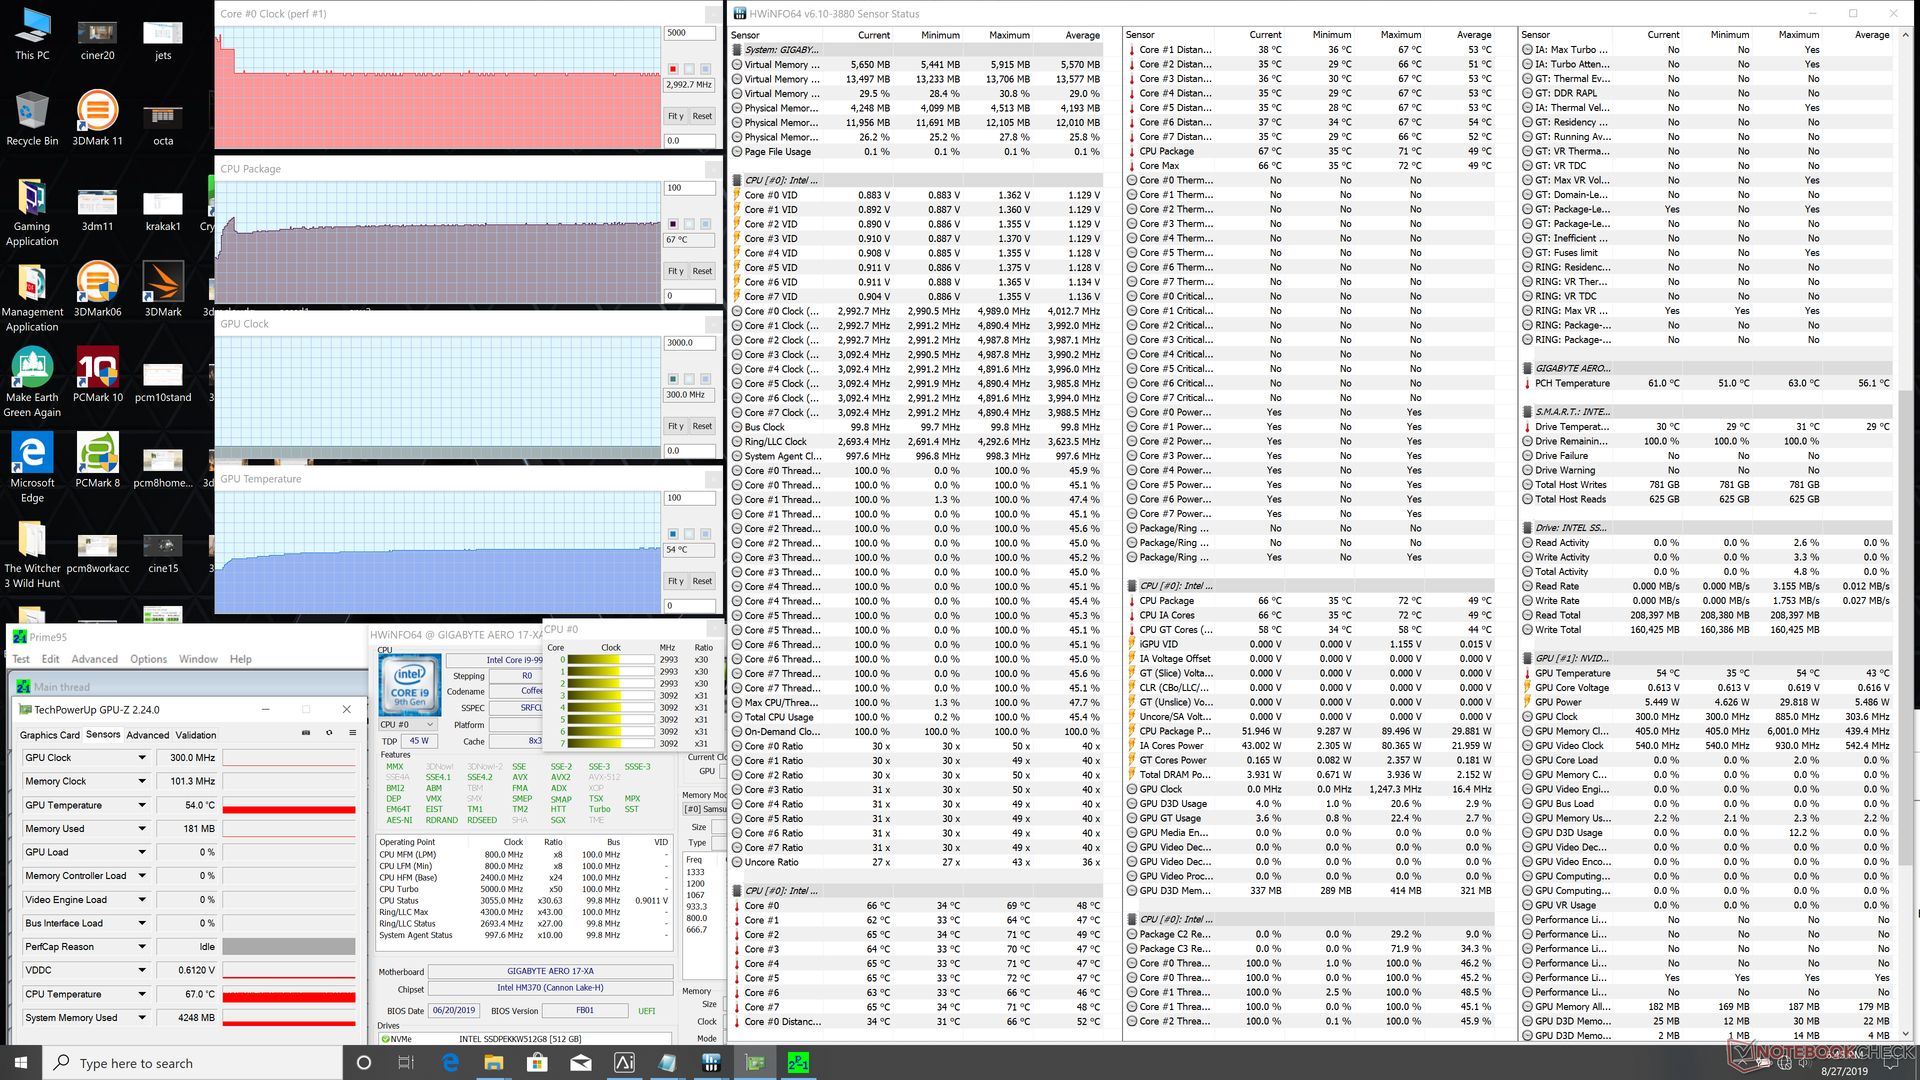
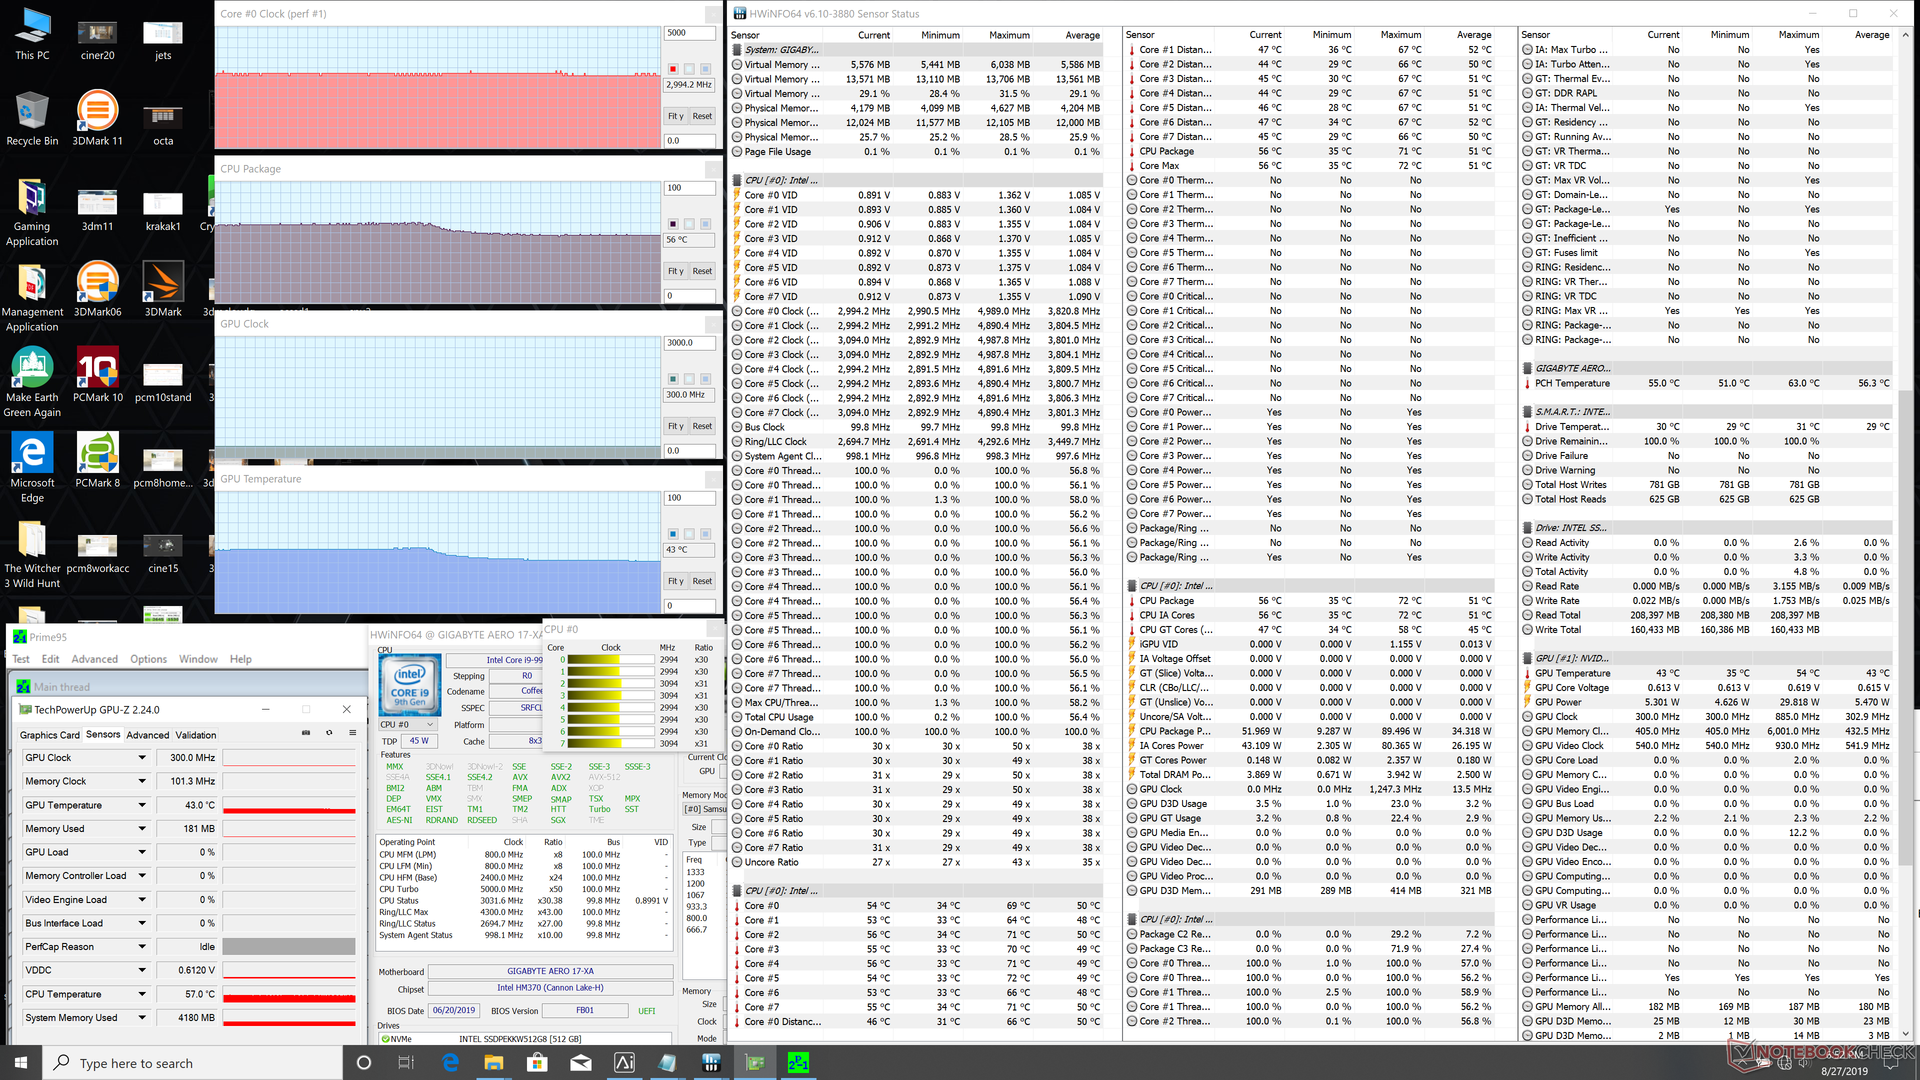
Unlocked CPUs are a mixed bag on laptops because they are generally unable to maintain their super-fast clock rates for extended periods and this continues to be the case on the Aero 17. When running CineBench R15 Multi-Thread in a loop, the initial score of 1594 points drops to 1333 points by the second loop to represent a performance dip of about 16 percent. Even so, this is still about 27 percent faster than the Core i7-9750H even after accounting for any performance throttling.
The Eurocom Nightsky RX15 ships with the same Core i9-9980HK CPU as our Aero 17 and yet it is able to consistently outperform our Gigabyte by about 10 percent because its processor able to maintain faster clock rates for longer as shown by our graph below. It may be minor, but the smallest of details become important when looking at these high-end configuration options.
See our dedicated page on the Core i9-9980HK for more technical information and benchmarks.
System Performance
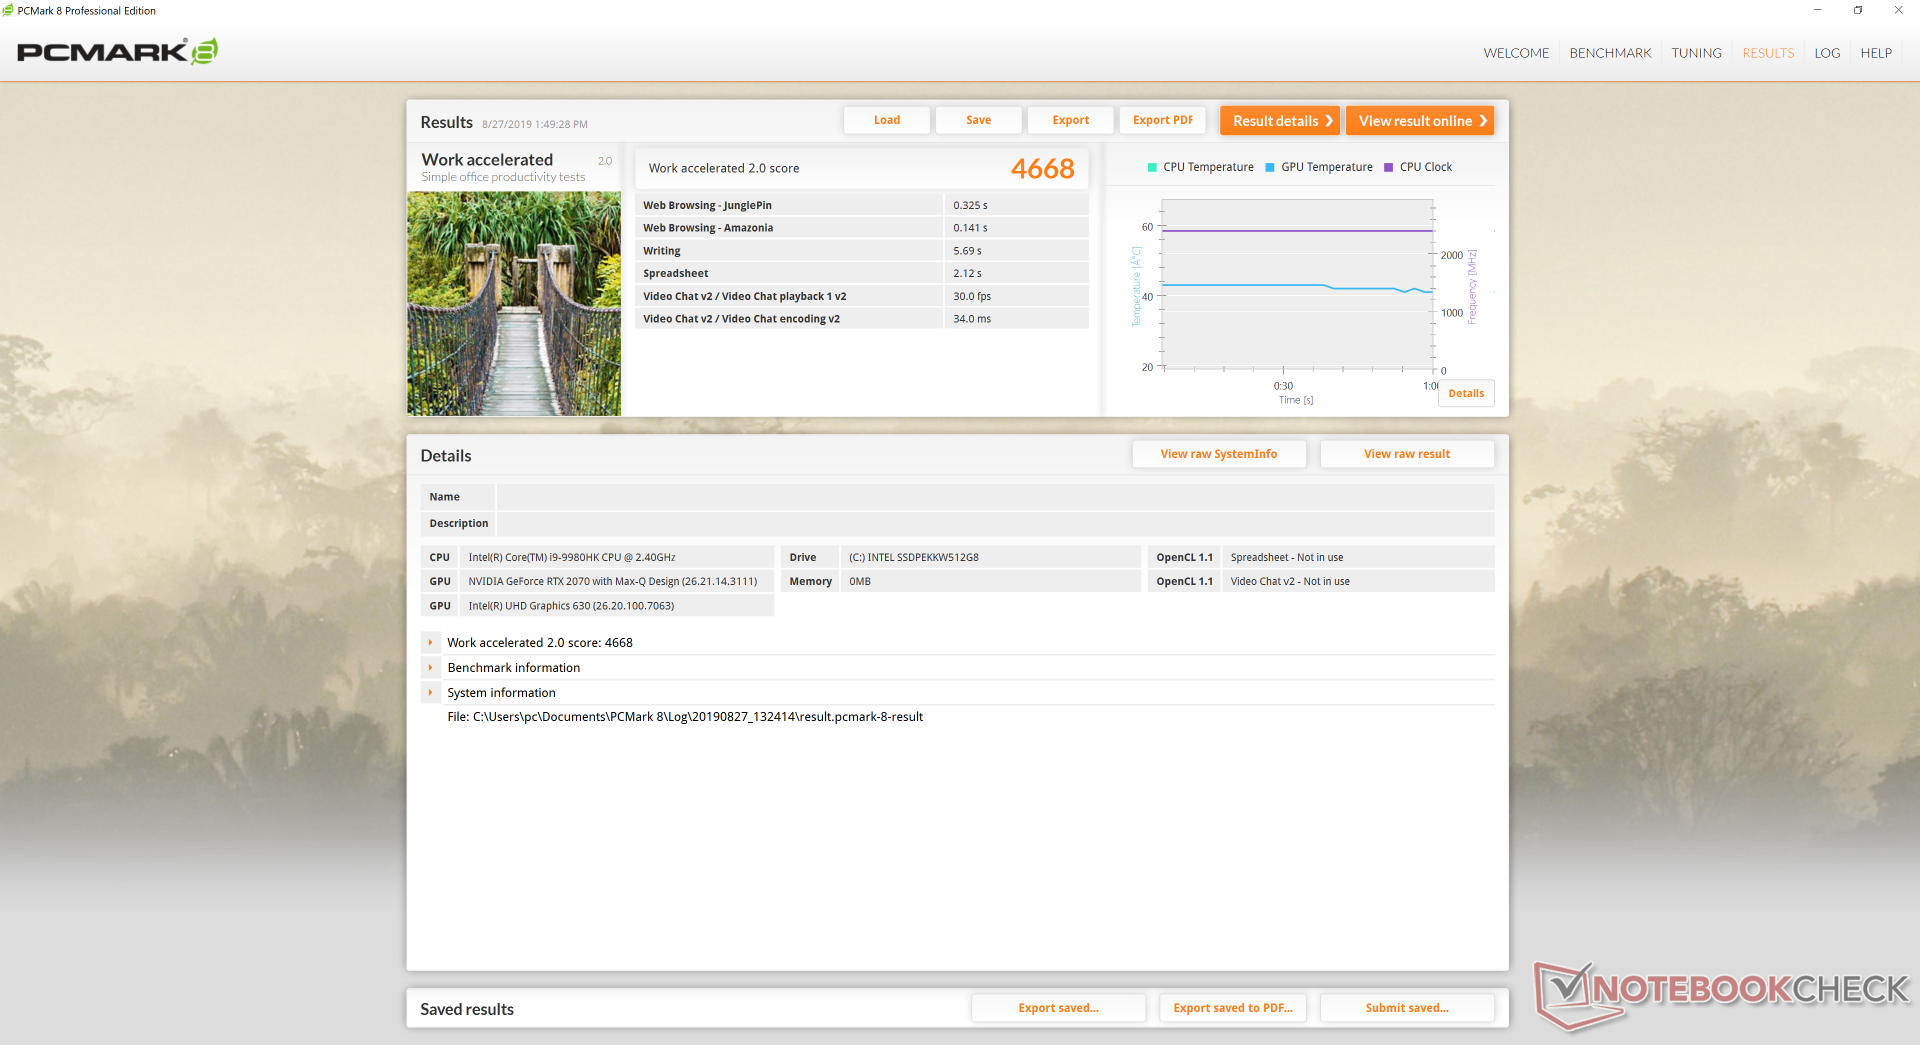
PCMark benchmarks rank our Gigabyte in the same ballpark as other gaming laptops with GeForce RTX graphics including the Alienware m17 and Asus G731. Overall scores are slightly higher than these alternatives likely due to the faster multi-thread performance of our octa-core Core i9 CPU.
We experienced no software or hardware issues during our time with the test unit. We did notice, however, that waking from sleep would be unusually slow each and every time. It takes about 6 seconds before the Windows login or lock screen appears when lifting the lid.
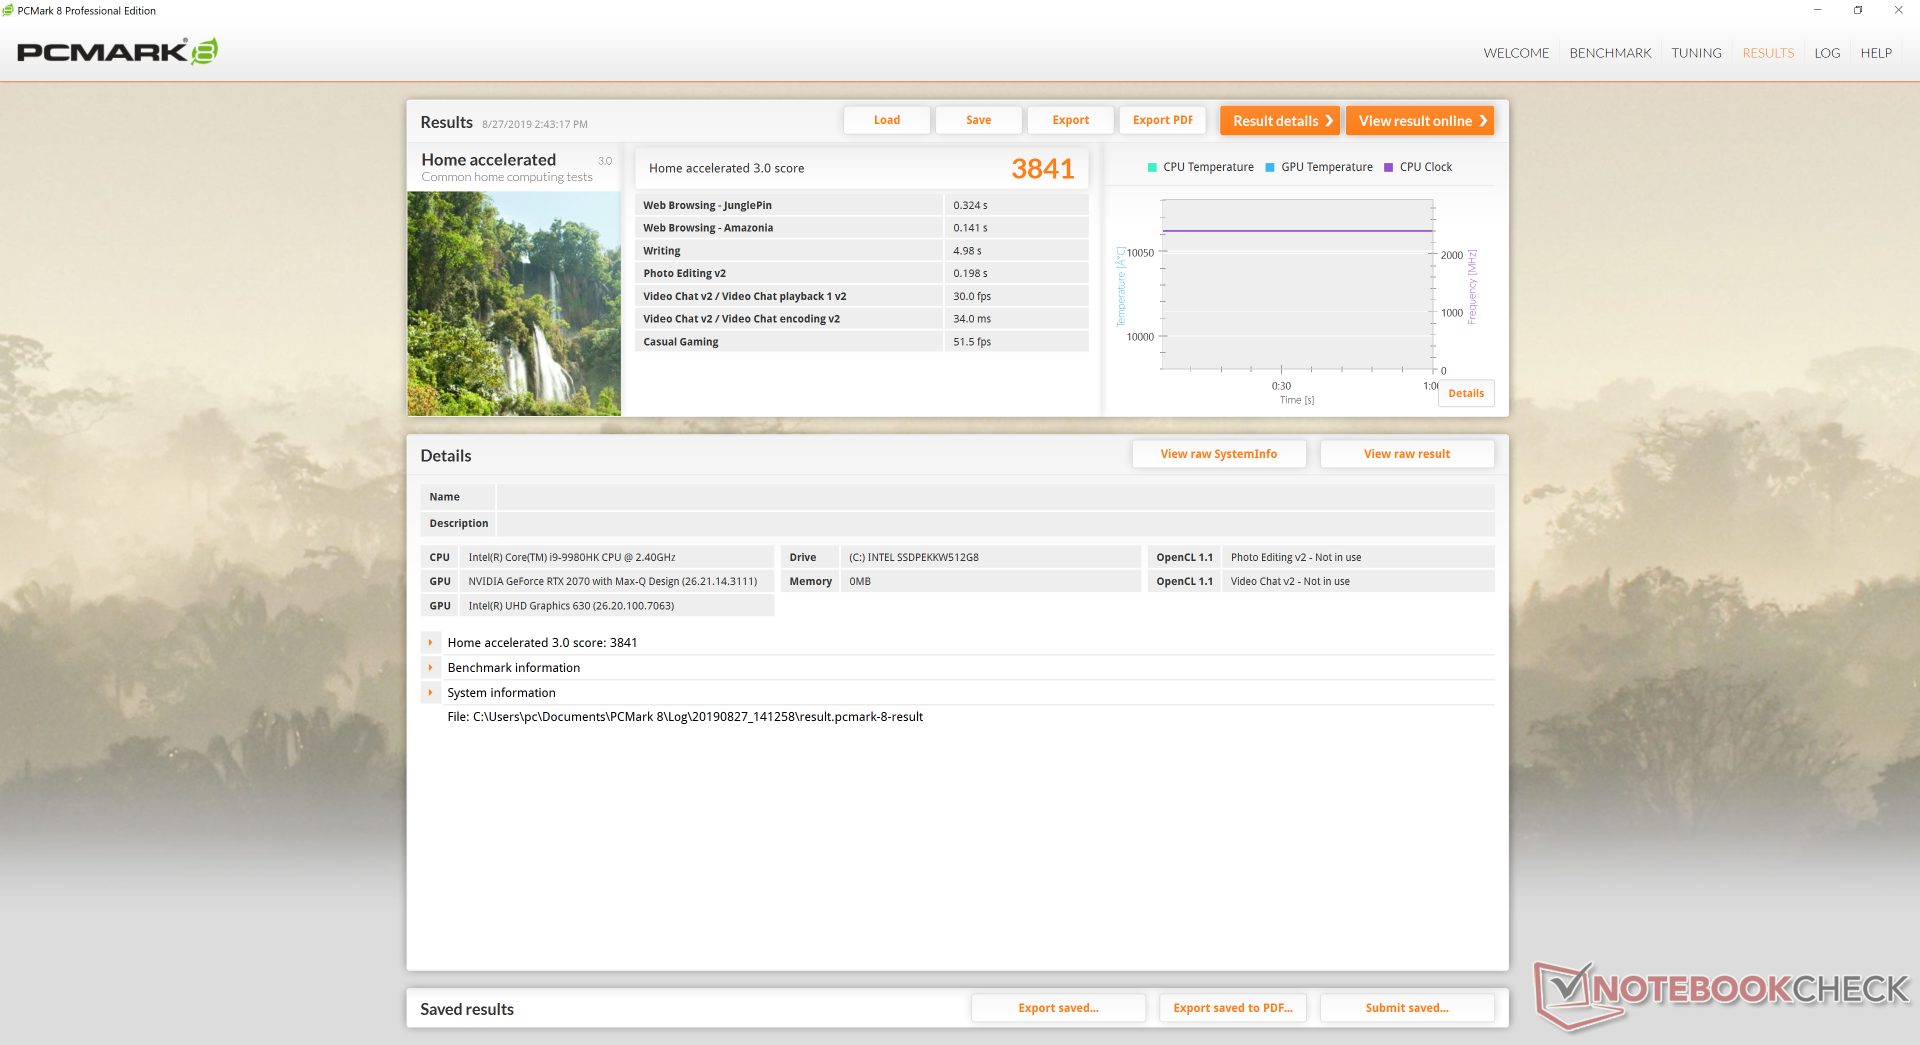
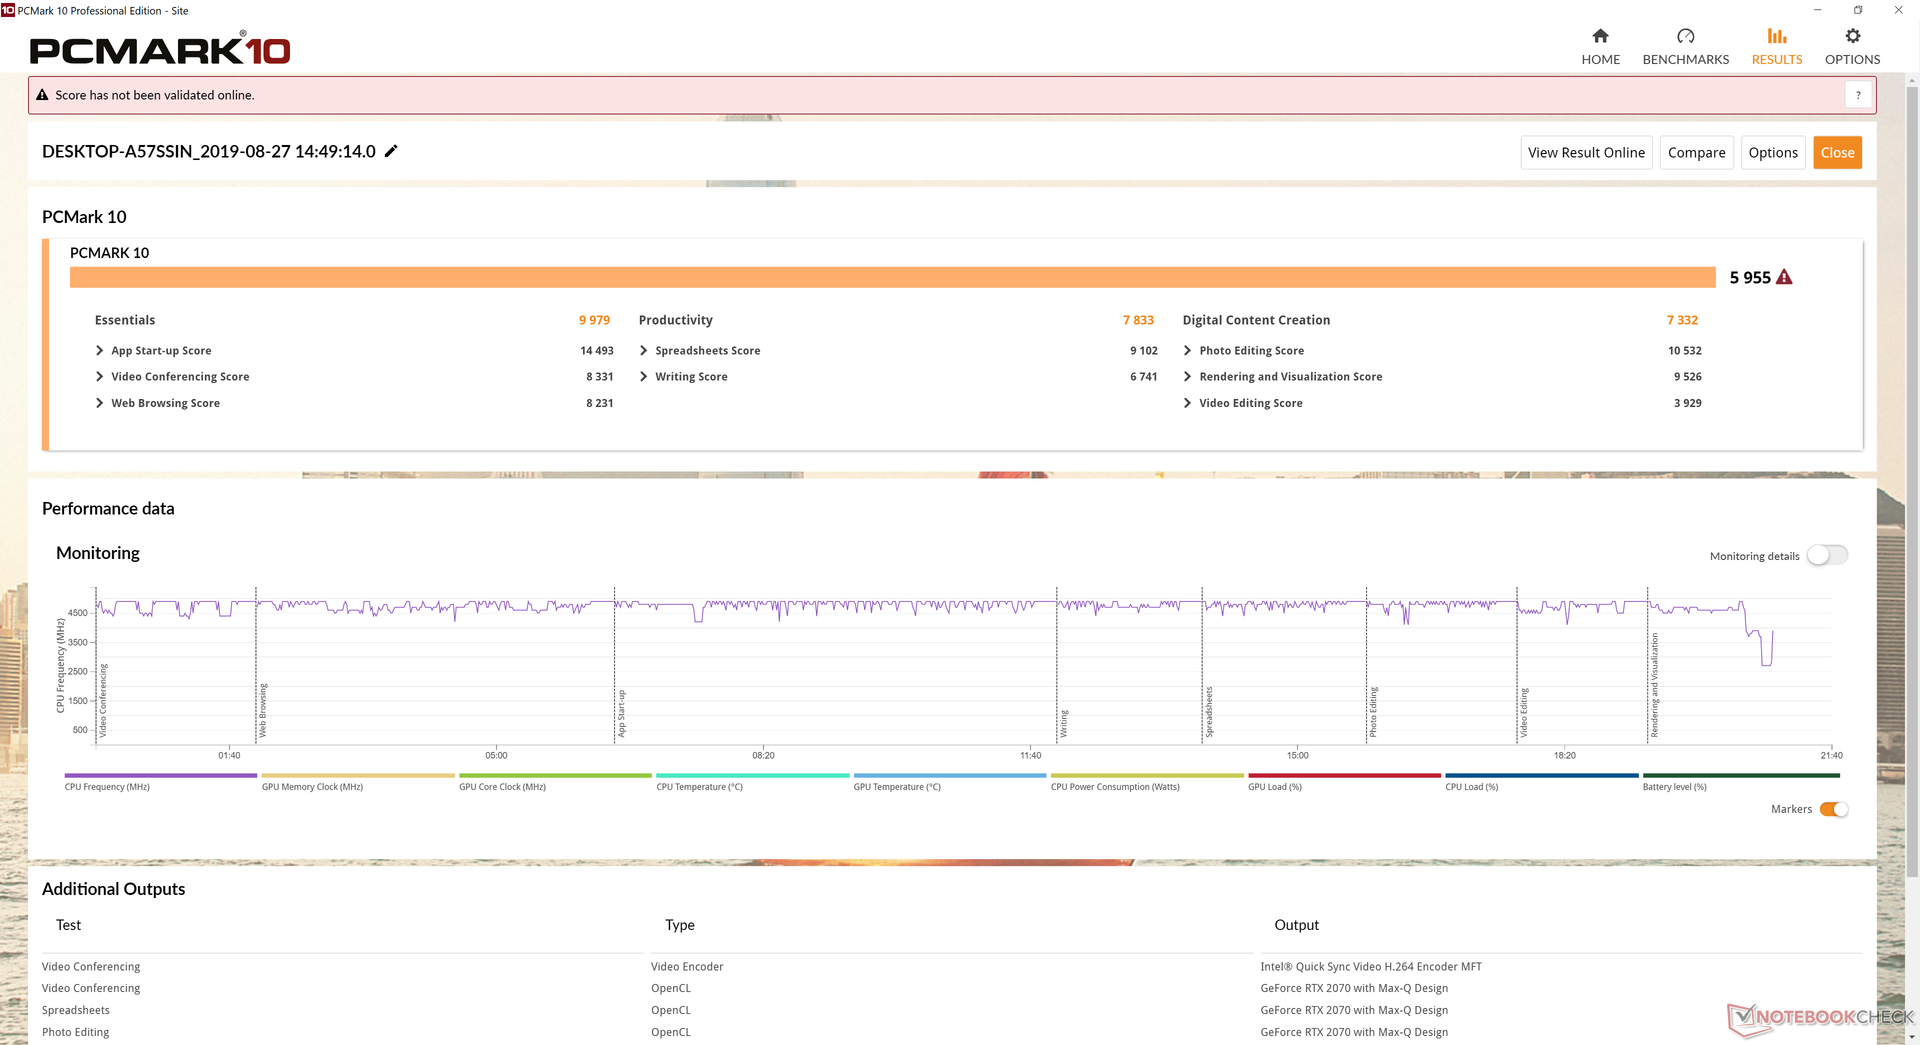
| PCMark 8 Home Score Accelerated v2 | 3841 points | |
| PCMark 8 Work Score Accelerated v2 | 4668 points | |
| PCMark 10 Score | 5955 points | |
Help | ||
Storage Devices
There are two M.2 2280 slots available whereas many other 17.3-inch laptops offer at least one seondary 2.5-inch SATA III bay. This makes the Aero 17 lighter albeit more costly to upgrade.
Our test unit comes with a single 512 GB Intel SSD 760p SSD. Gigabyte frequently advertises "Intel only" components and so it's unlikely that we'll see other configs sporting Samsung, Toshiba, or SK Hynix anytime soon. Sequential transfer rates are nearly 2x faster than the Intel SSD 660p as found on the Asus G731GV while being slower than the Samsung PM981 when it comes to reading and writing of smaller 4K blocks.
See our table of HDDs and SSDs for more benchmark comparisons.
| Gigabyte Aero 17 XA RP77 Intel SSD 760p SSDPEKKW512G8 | Razer Blade Pro 17 RTX 2080 Max-Q Samsung SSD PM981 MZVLB512HAJQ | Aorus X7 DT v8 Toshiba NVMe THNSN5512GPU7 | Alienware m17 P37E SK Hynix PC401 512GB M.2 (HFS512GD9TNG) | Asus Zephyrus S GX701GX Samsung SSD PM981 MZVLB1T0HALR | Asus Strix Hero III G731GV Intel SSD 660p SSDPEKNW512G8 | |
|---|---|---|---|---|---|---|
| AS SSD | 66% | 8% | 9% | 91% | 0% | |
| Seq Read | 1812 | 1831 1% | 2182 20% | 1835 1% | 911 -50% | 940 -48% |
| Seq Write | 1512 | 1744 15% | 1342 -11% | 1121 -26% | 2347 55% | 921 -39% |
| 4K Read | 32.68 | 45.16 38% | 23.28 -29% | 23.98 -27% | 53 62% | 48.05 47% |
| 4K Write | 107.7 | 107.1 -1% | 89.9 -17% | 100 -7% | 122.5 14% | 104.3 -3% |
| 4K-64 Read | 504 | 1240 146% | 817 62% | 687 36% | 1577 213% | 320.1 -36% |
| 4K-64 Write | 534 | 1695 217% | 757 42% | 776 45% | 1734 225% | 703 32% |
| Access Time Read * | 0.05 | 0.064 -28% | 0.136 -172% | 0.047 6% | 0.08 -60% | 0.079 -58% |
| Access Time Write * | 0.227 | 0.037 84% | 0.044 81% | 0.053 77% | 0.031 86% | 0.046 80% |
| Score Read | 718 | 1468 104% | 1058 47% | 895 25% | 1721 140% | 462 -36% |
| Score Write | 793 | 1977 149% | 981 24% | 988 25% | 2091 164% | 900 13% |
| Score Total | 1871 | 4197 124% | 2539 36% | 2306 23% | 4771 155% | 1616 -14% |
| Copy ISO MB/s | 946 | 2086 121% | 773 -18% | 1416 50% | ||
| Copy Program MB/s | 414.3 | 425.5 3% | 493 19% | 569 37% | ||
| Copy Game MB/s | 1263 | 555 -56% | 647 -49% | 971 -23% |
* ... smaller is better

GPU Performance
As the 15th laptop we've tested with RTX 2070 Max-Q graphics, the Aero 17 is performing exactly where we expect it to be in relation to other similarly equipped laptops. Performance is roughly 10 percent faster than the mobile RTX 2060 and 10 percent slower than the non-Max-Q mobile RTX 2070. Users upgrading from an older GTX 1070 laptop will only see about a 15 percent gain when playing DX12 titles according to 3DMark.
Note that there is almost no difference in gaming performance between the default Regular Fan mode and Maximum Fan mode. Running Fire Strike in Regular Fan mode returns Physics and Graphics scores of 20584 and 16369 points, respectively, compared to 20349 and 16658 points when on Maximum Fan mode. Thus, the biggest benefit for toggling Maximum Fan mode would be for its cooler core temperatures.
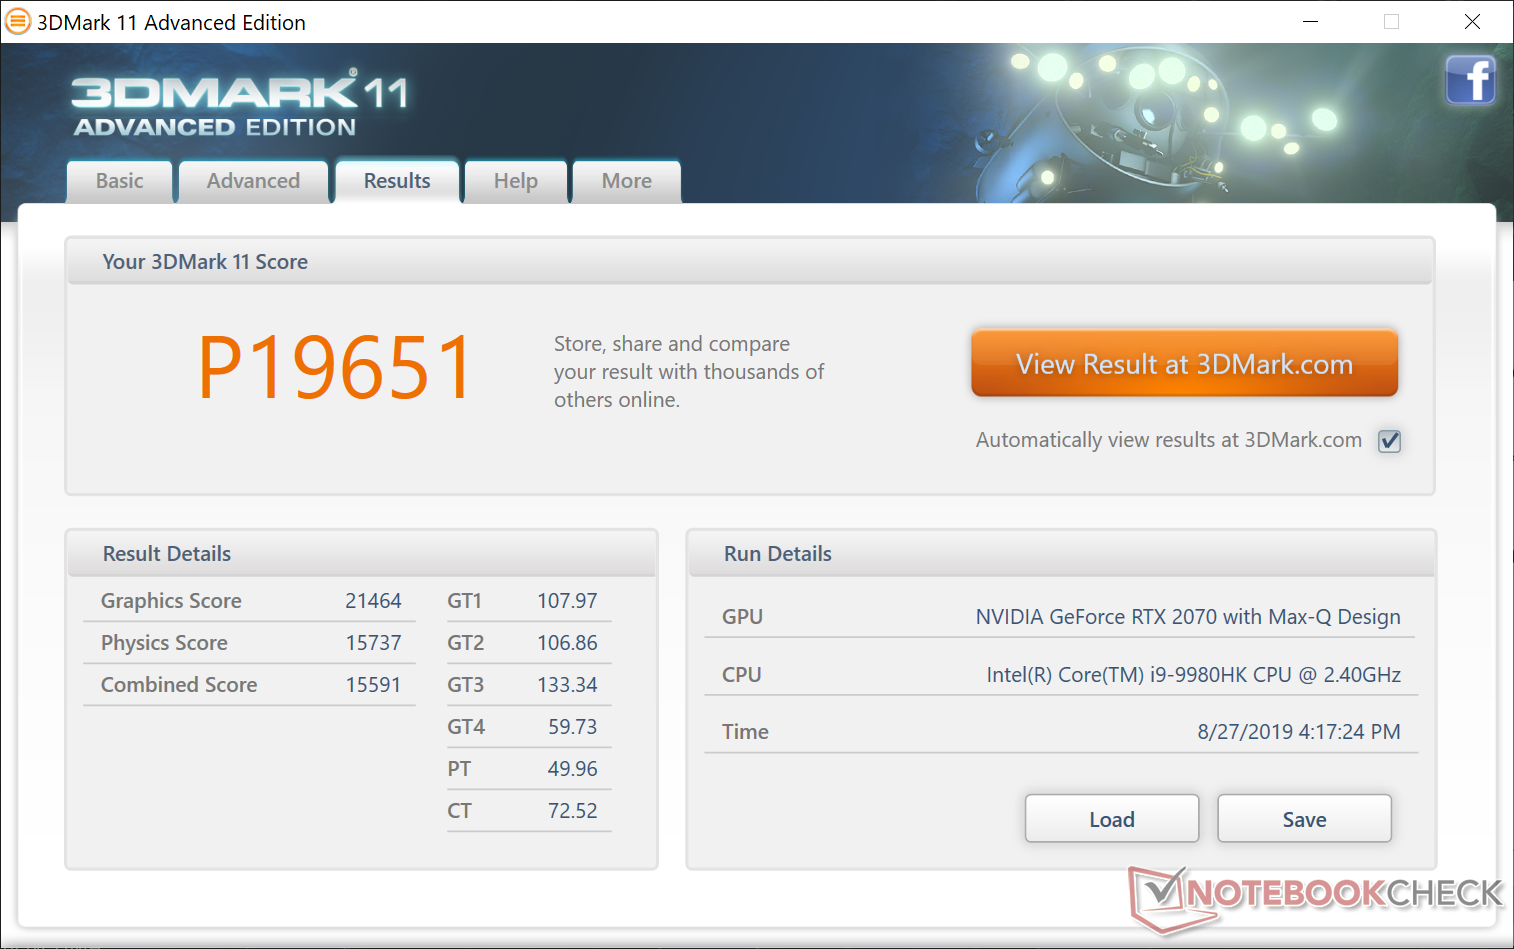
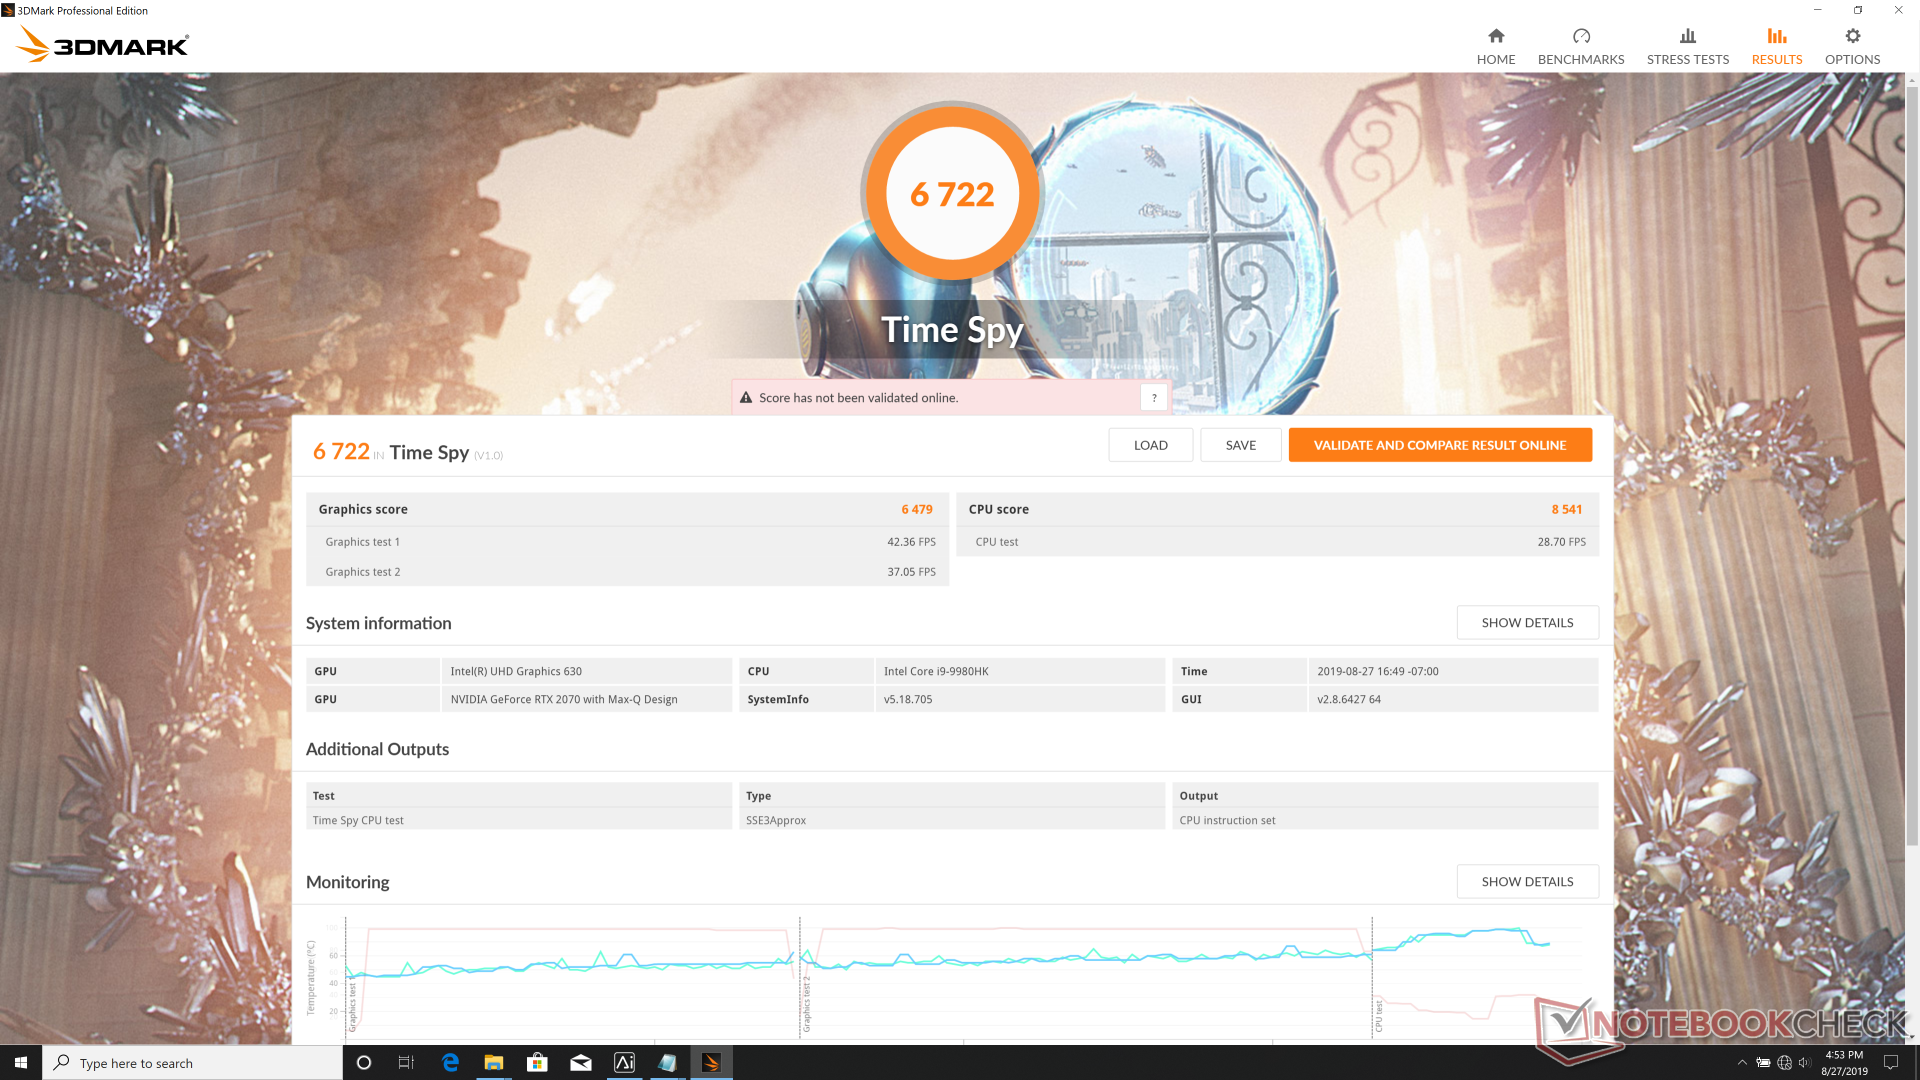
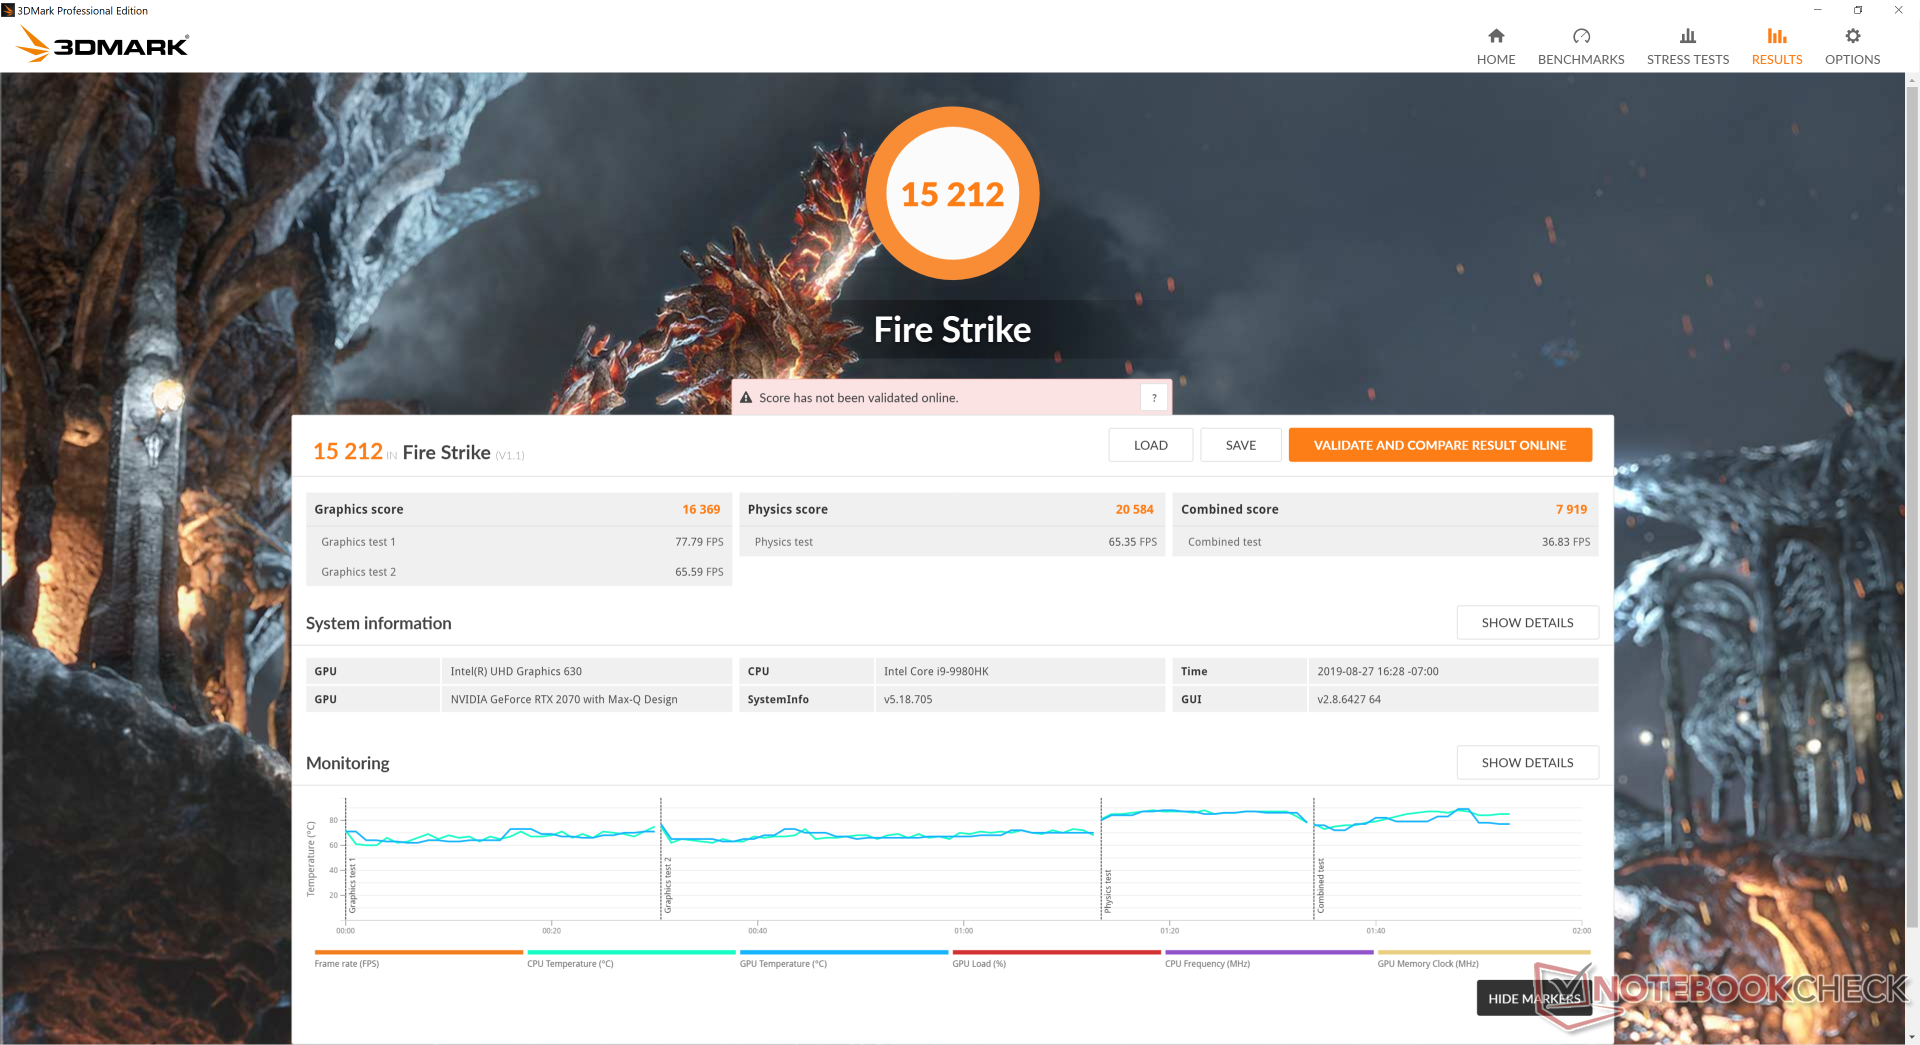
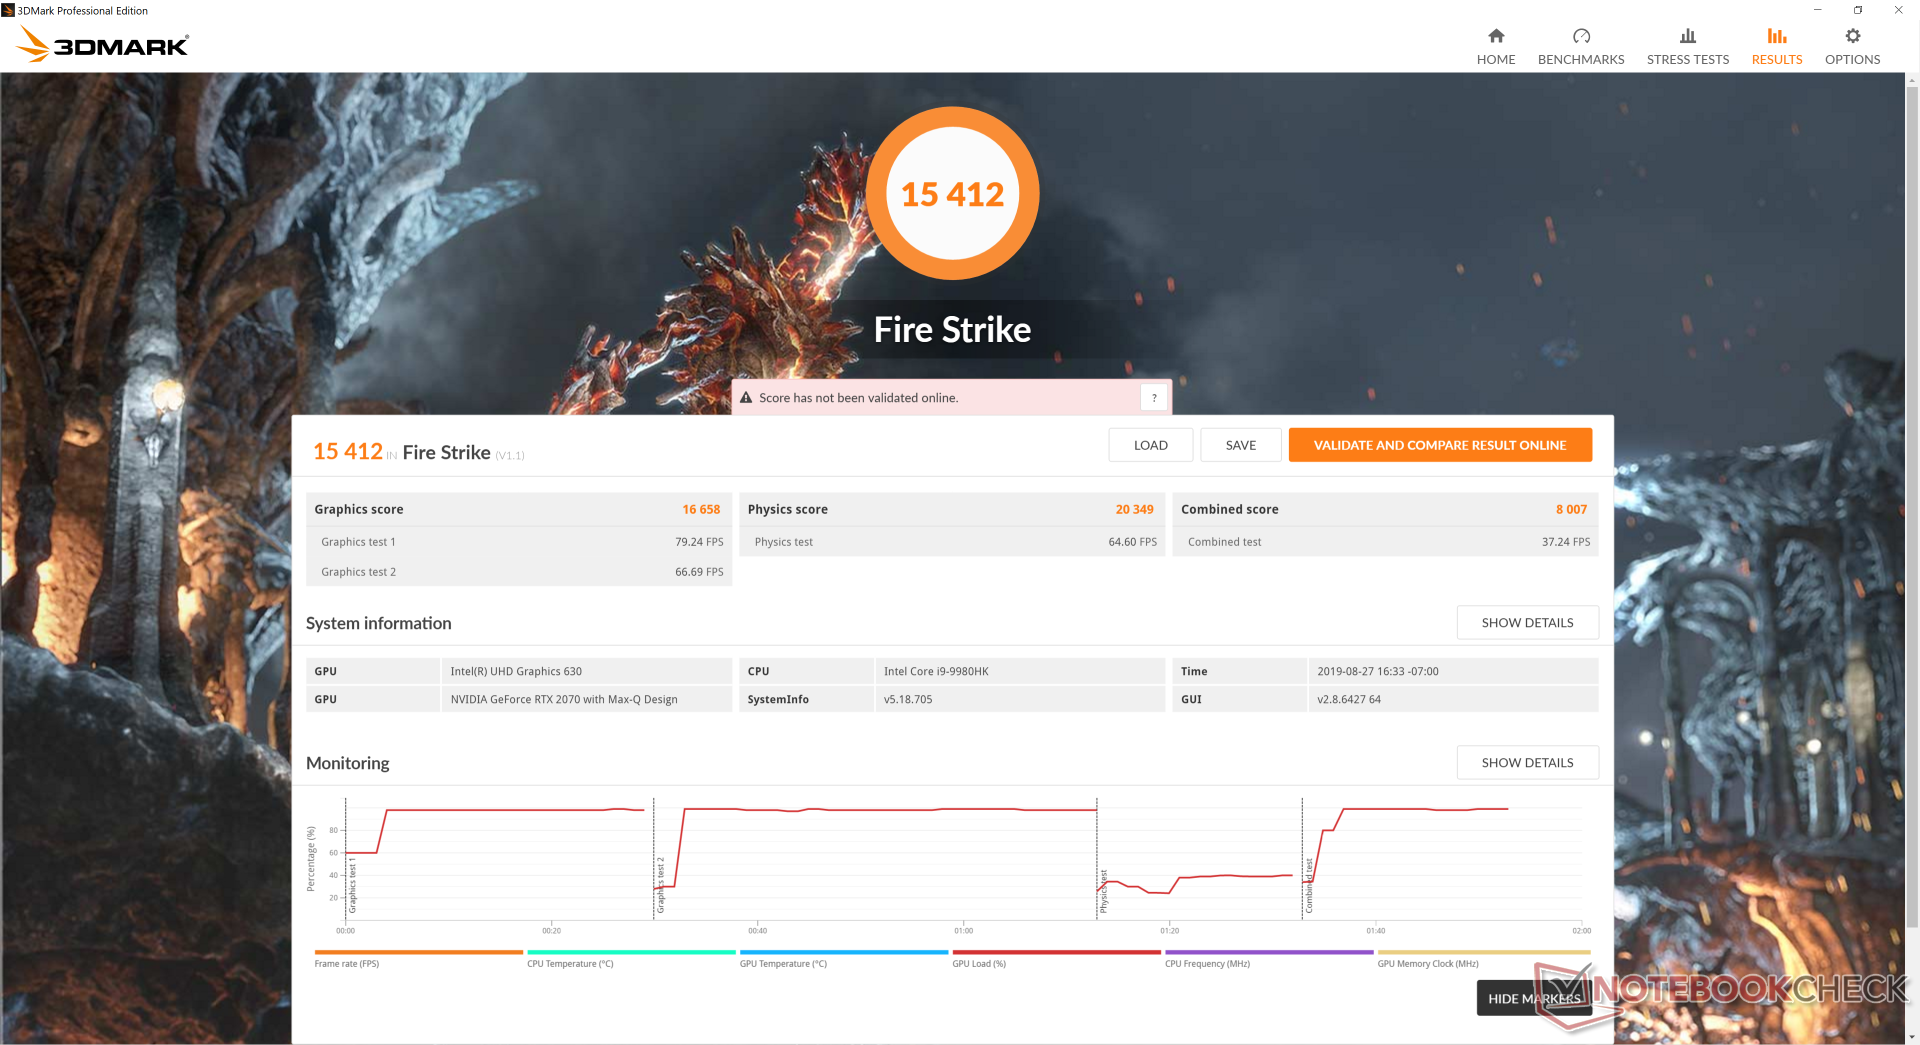
| 3DMark 11 Performance | 19651 points | |
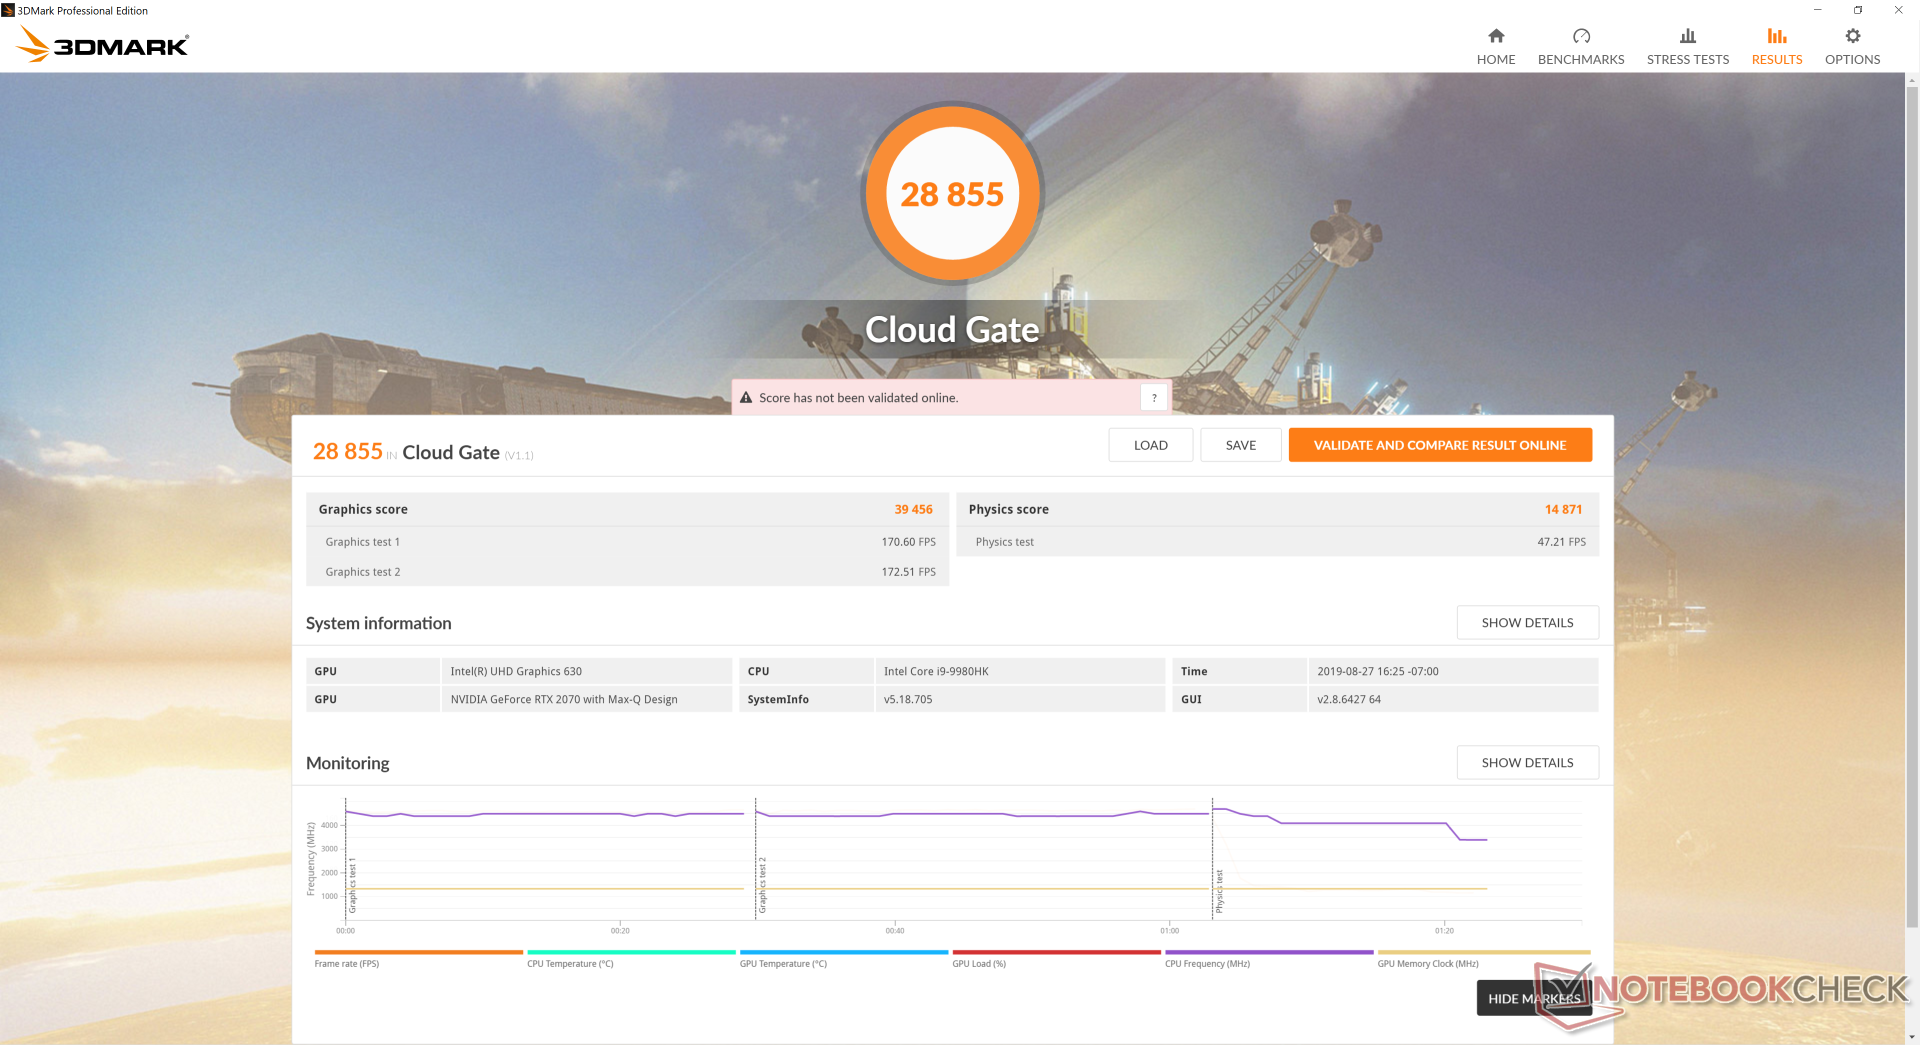
| 3DMark Cloud Gate Standard Score | 28855 points | |
| 3DMark Fire Strike Score | 15412 points | |
| 3DMark Time Spy Score | 6722 points | |
Help | ||
Gaming Performance
You can always count on a respectable level of gaming performance whenever a GeForce RTX GPU is involved. The RTX 2070 Max-Q is powerful enough to play any current title at 1080p60 with most or all settings at maximum. Results aren't really that much better than the RTX 2060 or even the GTX 1660 Ti at 1080p and so the lesser AERO 17 SA SKU may be preferable if gaming is not your primary concern.
See our dedicated page on the GeForce RTX 2070 Max-Q for more technical information and benchmarks.
| Shadow of the Tomb Raider - 1920x1080 Highest Preset AA:T | |
| MSI RTX 2080 Gaming X Trio | |
| MSI RTX 2070 Gaming Z 8G | |
| Origin PC EVO16-S i7-9750H RTX 2080 Max-Q | |
| Average NVIDIA GeForce RTX 2070 Max-Q (57 - 89, n=12) | |
| Gigabyte Aero 17 XA RP77 | |
| Eurocom Nightsky Ti15 | |
| Asus Strix Hero III G731GV | |
| Asus Zephyrus S GX531GS | |
| MSI GF75 Thin 9SC | |
| Asus G752VY | |
| The Witcher 3 - 1920x1080 Ultra Graphics & Postprocessing (HBAO+) | |
| MSI RTX 2080 Gaming X Trio | |
| MSI RTX 2070 Gaming Z 8G | |
| Origin PC EVO16-S i7-9750H RTX 2080 Max-Q | |
| Gigabyte Aero 17 XA RP77 | |
| Average NVIDIA GeForce RTX 2070 Max-Q (56 - 83.8, n=31) | |
| Eurocom Nightsky Ti15 | |
| Asus Strix Hero III G731GV | |
| Asus Zephyrus S GX531GS | |
| MSI GF75 Thin 9SC | |
| low | med. | high | ultra | 4K | |
| BioShock Infinite (2013) | 353.5 | 315.2 | 290.2 | 155.7 | |
| The Witcher 3 (2015) | 285.7 | 212.1 | 131.6 | 66.5 | 46.9 |
| Shadow of the Tomb Raider (2018) | 137 | 99 | 89 | 79 | 28 |
Emissions
System Noise
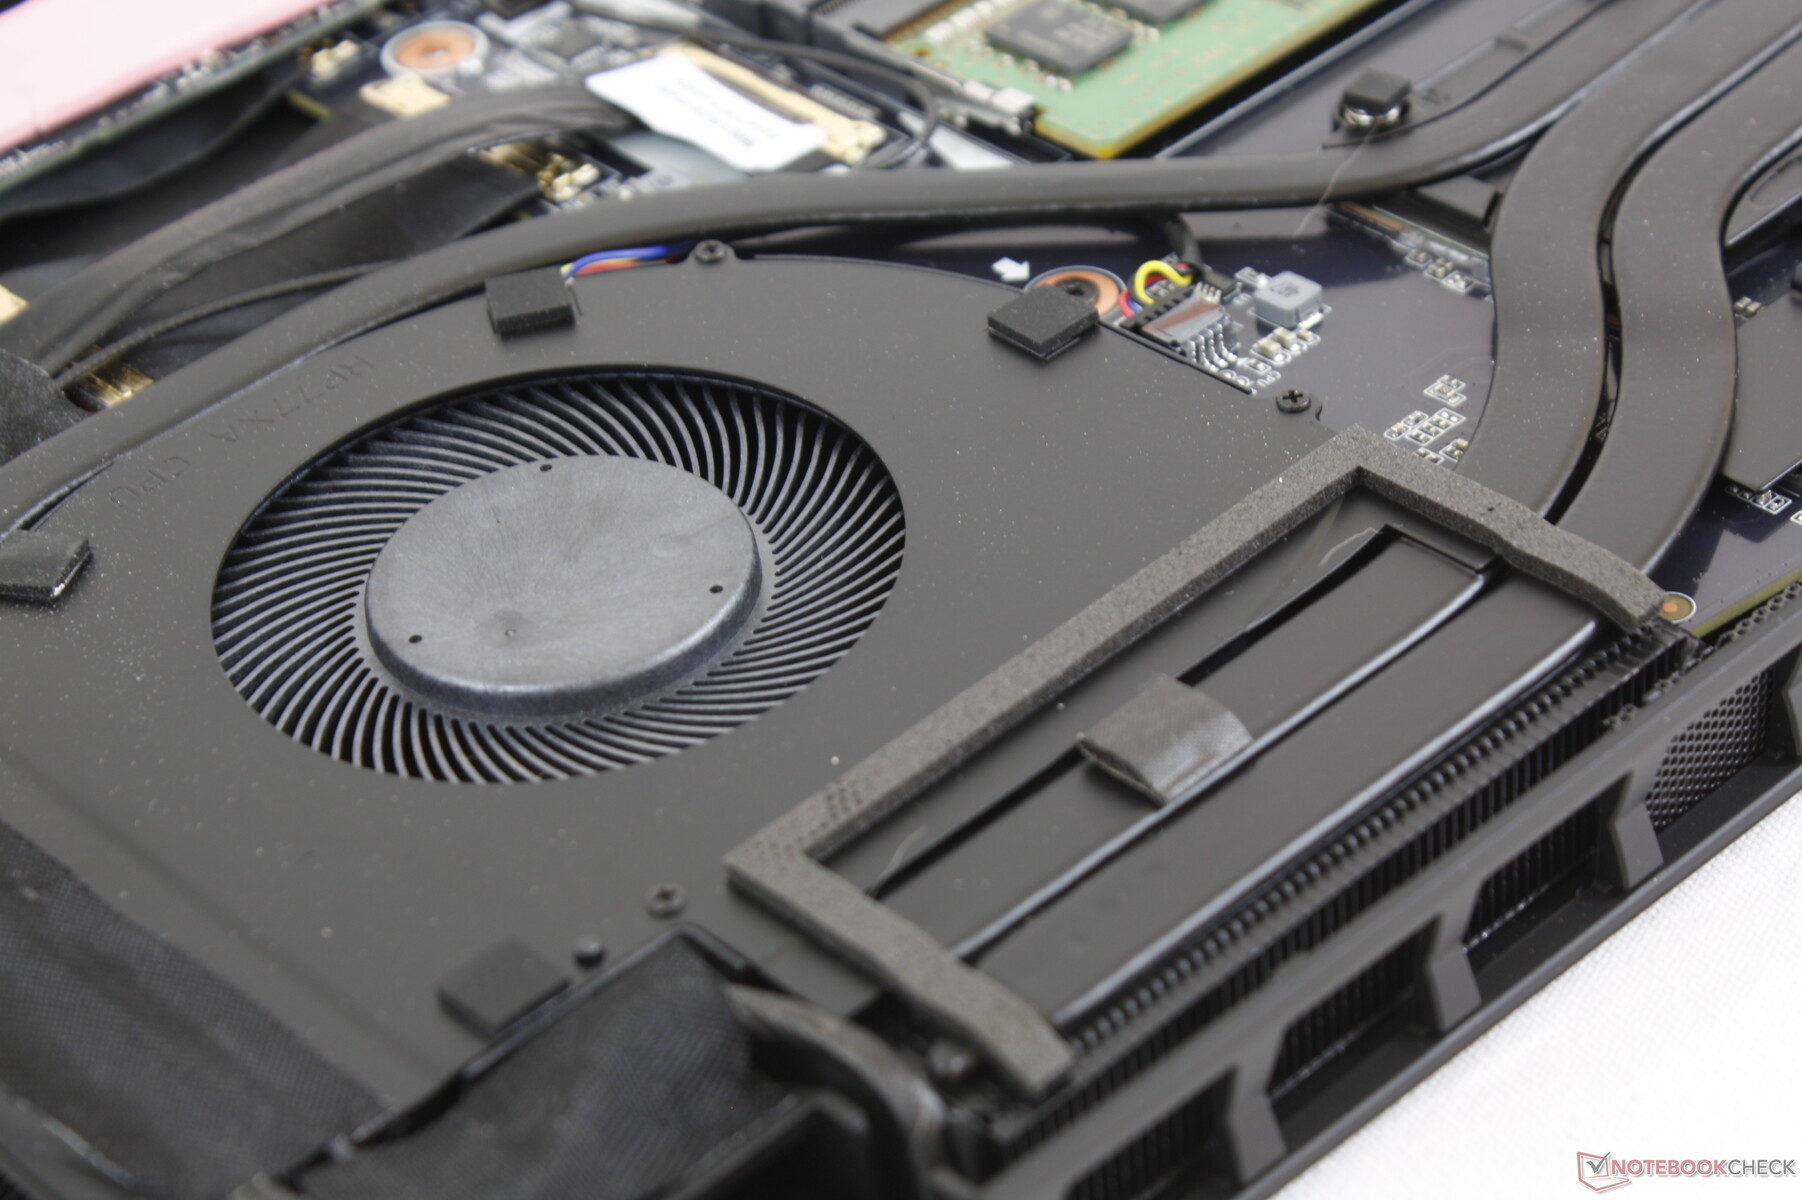
The cooling solution consists of two large diameter fans and four major heat pipes between the CPU and GPU. The fans are always active no matter the onscreen load at about 33 dB(A). Be sure to manually set the system to Power Saver or Quiet mode or else the fan will pulse more frequently during low loads like web browsing or streaming.
When gaming on the default Normal Fan mode, fan noise becomes decent for a thin gaming laptop at 42 to 45 dB(A). When gaming in Maximum Fan mode, this jumps to a steady 59.6 dB(A) to be one of the loudest gaming laptops we've recorded. As shown by our 3DMark results above, however, Maximum Fan mode provides no major performance benefits meaning users can game in the default Normal Fan mode without any tangible FPS losses.
Our test unit exhibits very slight electronic noise that is only audible when placing an ear near the keyboard keys. This never becomes an issue since the system fans will always overwhelm the presence of any minor electronic noise.
| Gigabyte Aero 17 XA RP77 GeForce RTX 2070 Max-Q, i9-9980HK, Intel SSD 760p SSDPEKKW512G8 | Razer Blade Pro 17 RTX 2080 Max-Q GeForce RTX 2080 Max-Q, i7-9750H, Samsung SSD PM981 MZVLB512HAJQ | Aorus X7 DT v8 GeForce GTX 1080 Mobile, i7-8850H, Toshiba NVMe THNSN5512GPU7 | Alienware m17 P37E GeForce RTX 2080 Max-Q, i9-8950HK, SK Hynix PC401 512GB M.2 (HFS512GD9TNG) | Asus Zephyrus S GX701GX GeForce RTX 2080 Max-Q, i7-8750H, Samsung SSD PM981 MZVLB1T0HALR | Asus Strix Hero III G731GV GeForce RTX 2060 Mobile, i7-9750H, Intel SSD 660p SSDPEKNW512G8 | |
|---|---|---|---|---|---|---|
| Noise | 5% | -8% | 2% | 0% | 1% | |
| off / environment * | 29.3 | 28.2 4% | 29 1% | 28.2 4% | 29 1% | 28.2 4% |
| Idle Minimum * | 33 | 28.2 15% | 35 -6% | 28.2 15% | 29 12% | 29.5 11% |
| Idle Average * | 33 | 28.2 15% | 36 -9% | 28.2 15% | 32 3% | 30.3 8% |
| Idle Maximum * | 33 | 30.8 7% | 41 -24% | 31 6% | 33 -0% | 31.9 3% |
| Load Average * | 42.5 | 42 1% | 43 -1% | 50.8 -20% | 47 -11% | 50.4 -19% |
| Witcher 3 ultra * | 42 | 51 -21% | 53 -26% | 50.8 -21% | 49 -17% | 50.1 -19% |
| Load Maximum * | 59.6 | 53 11% | 54 9% | 50.8 15% | 51 14% | 50.1 16% |
* ... smaller is better
Noise Level
| Idle |
| 33 / 33 / 33 dB(A) |
| Load |
| 42.5 / 59.6 dB(A) |
 | ||
30 dB silent 40 dB(A) audible 50 dB(A) loud |
||
min: | ||
Temperature
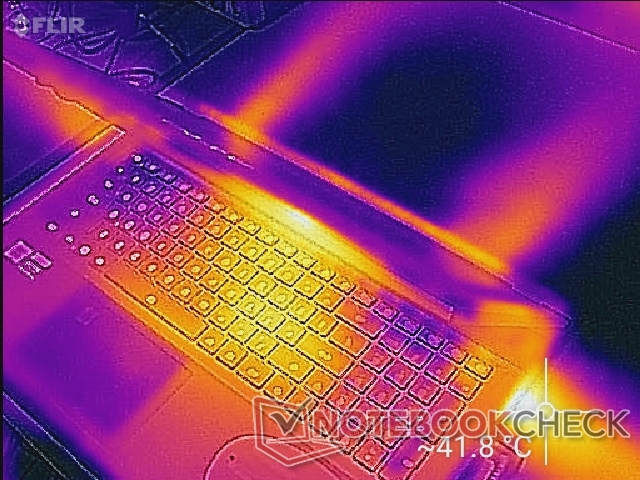
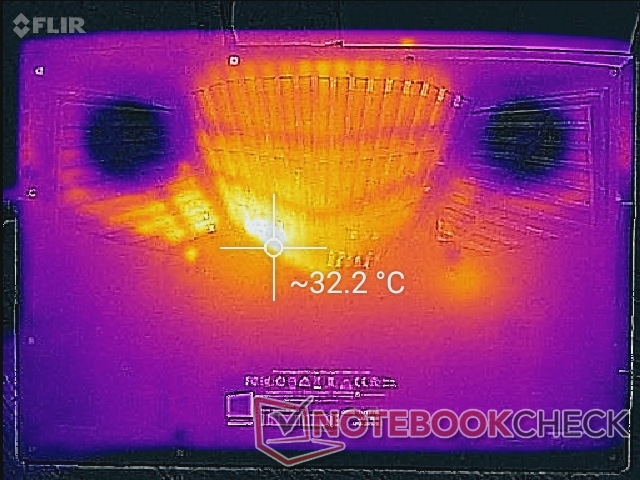
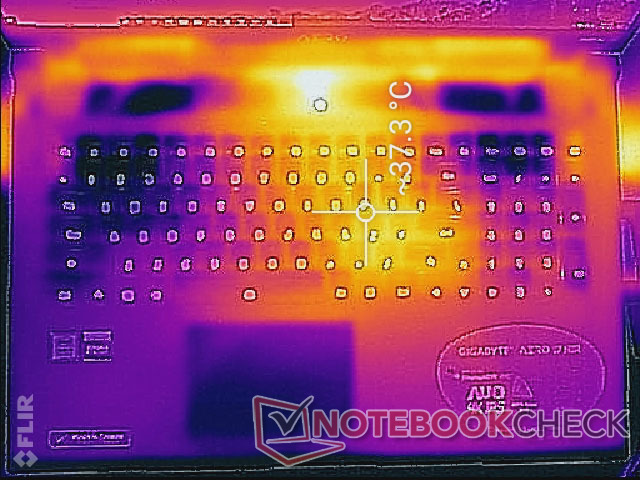
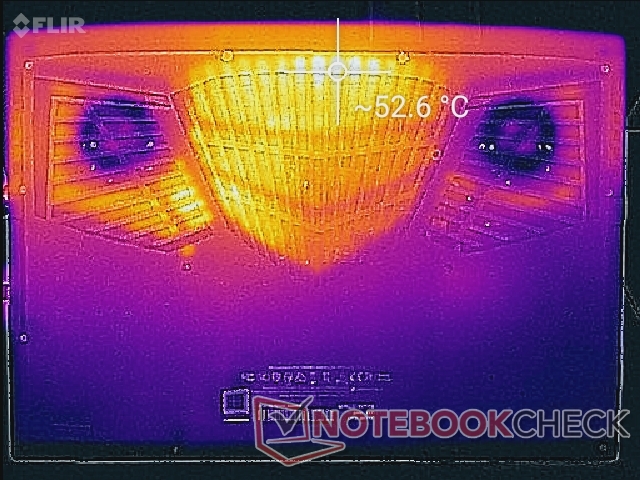
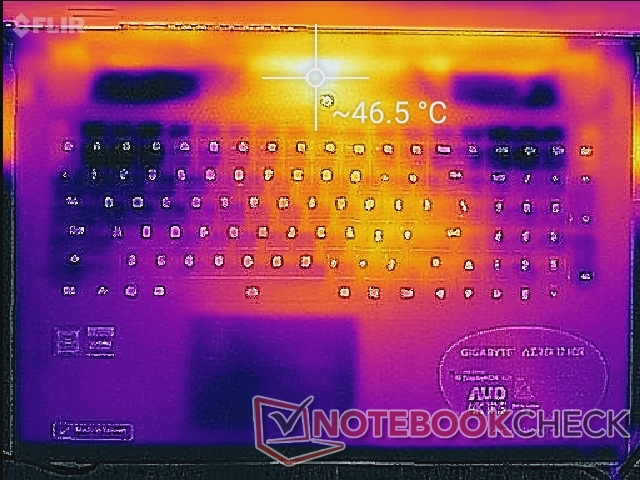
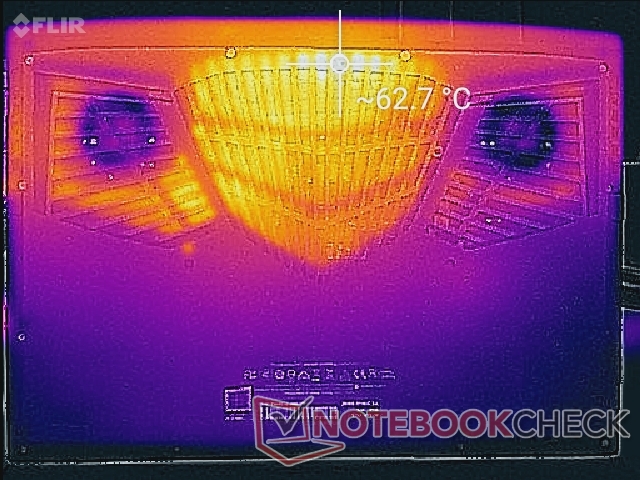
Surface temperatures when idling are generally flat with the hot spot towards the center of the keyboard as shown by our temperature maps below. When gaming, this spot can become as warm as 38 C not unlike what we discovered on the Razer Blade Pro 17. The power button area can actually become even warmer at 47 C, but users are unlikely to touch this area frequently.
The system pulls in fresh air near the corners of the keyboard which help keep the WASD keys cool no matter the onscreen load. Gamers in particular will appreciate this approach.
Keep in mind that the ventilation grilles on the bottom side of the chassis are larger than on most other laptops and are thus easier to block. Be sure to allow for adequate airflow through many of the exit grilles along the edges of the system as well.
(-) The maximum temperature on the upper side is 46.8 °C / 116 F, compared to the average of 40.4 °C / 105 F, ranging from 21.2 to 68.8 °C for the class Gaming.
(-) The bottom heats up to a maximum of 62.2 °C / 144 F, compared to the average of 43.2 °C / 110 F
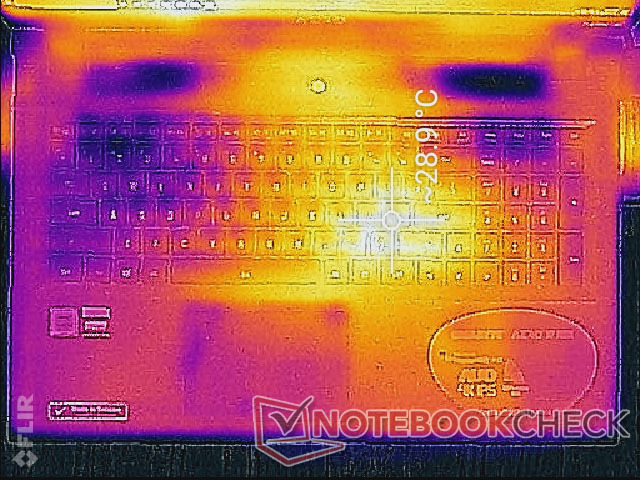
(+) In idle usage, the average temperature for the upper side is 26.5 °C / 80 F, compared to the device average of 33.8 °C / 93 F.
(±) Playing The Witcher 3, the average temperature for the upper side is 32.6 °C / 91 F, compared to the device average of 33.8 °C / 93 F.
(+) The palmrests and touchpad are cooler than skin temperature with a maximum of 30.2 °C / 86.4 F and are therefore cool to the touch.
(±) The average temperature of the palmrest area of similar devices was 28.9 °C / 84 F (-1.3 °C / -2.4 F).
Stress Test
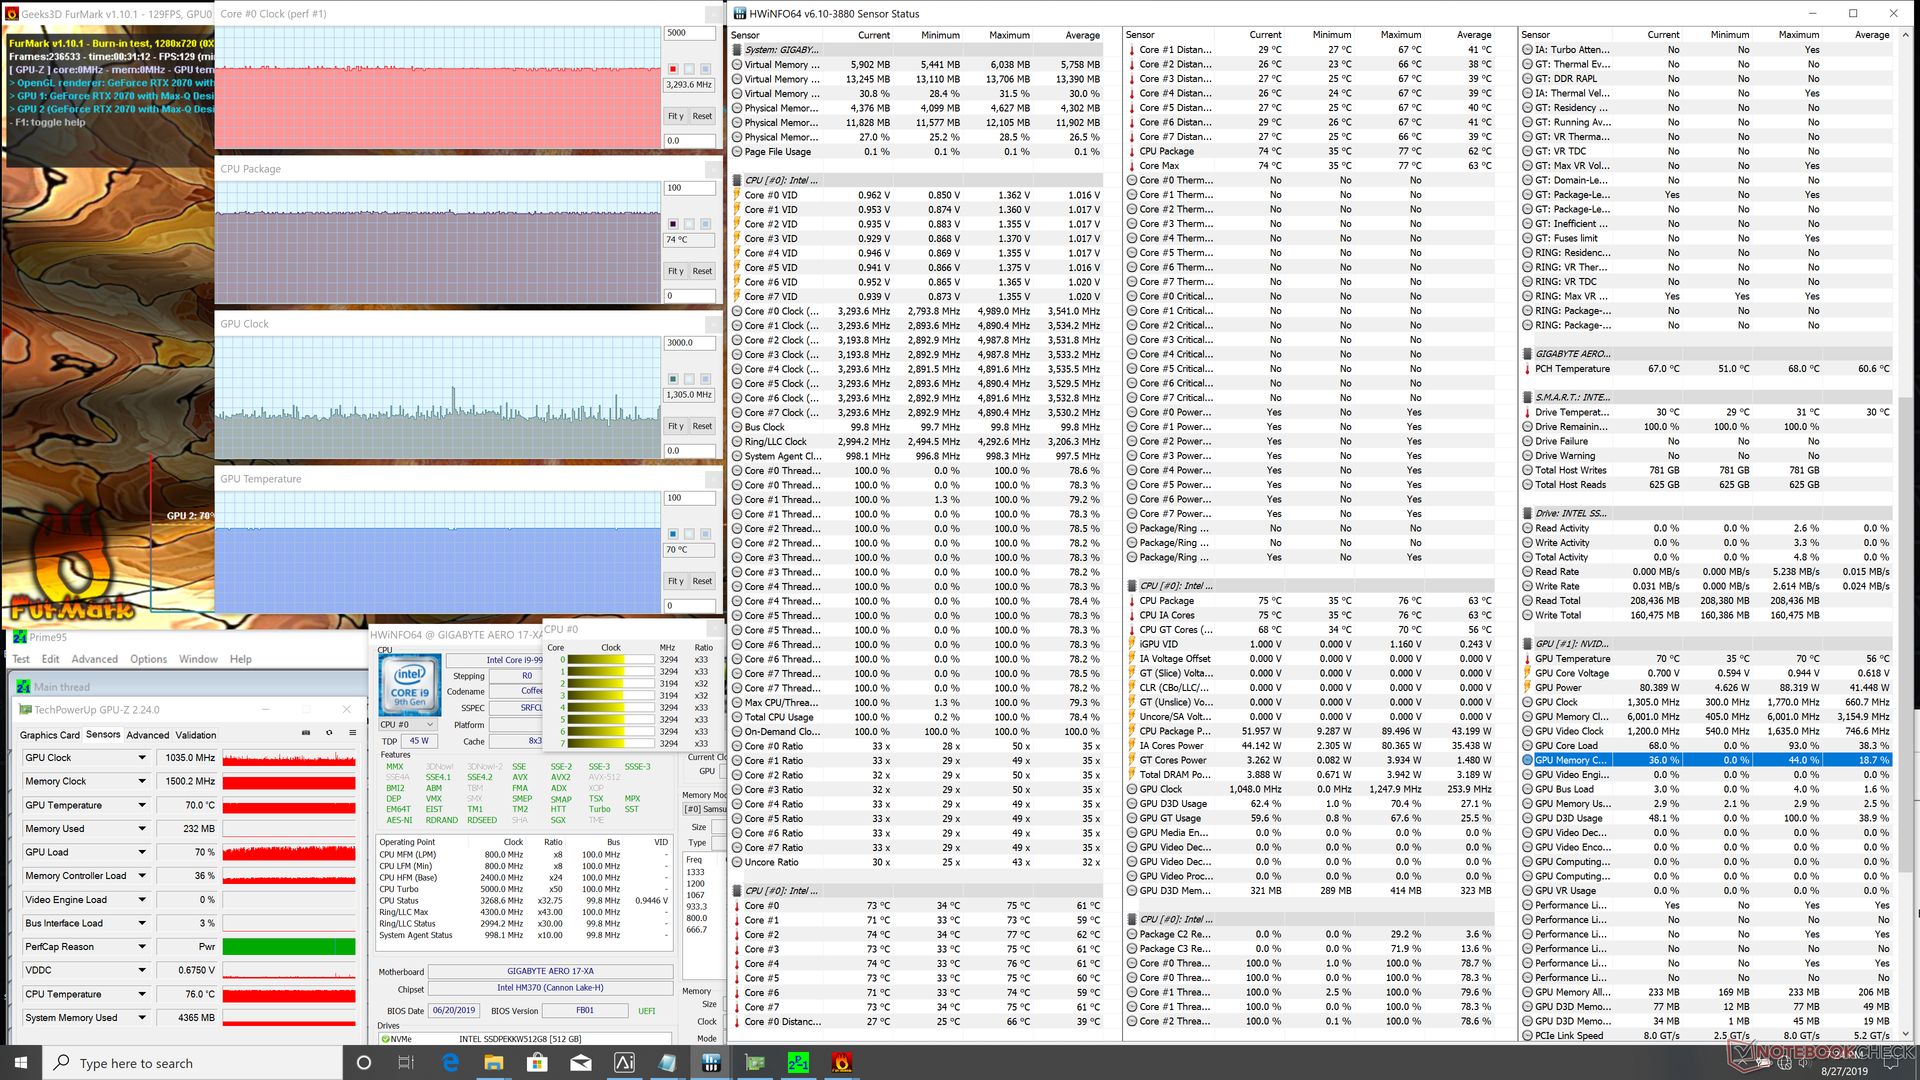
We stress the Aero 17 with synthetic loads to identify for any potential throttling or stability issues. When running Prime95 on the default Normal Fan mode, the CPU will boost to 4.1 GHz for the first few seconds until hitting 71 C. Thereafter, clock rates stabilize at 3.0 GHz for a cooler core temperature of 63 C. If running on Maximum Fan mode, CPU temperature drops to 56 C but clock rates do not improve. Maximum Fan mode is therefore more useful if you desire cooler running temperatures as any performance benefits would be minimal.
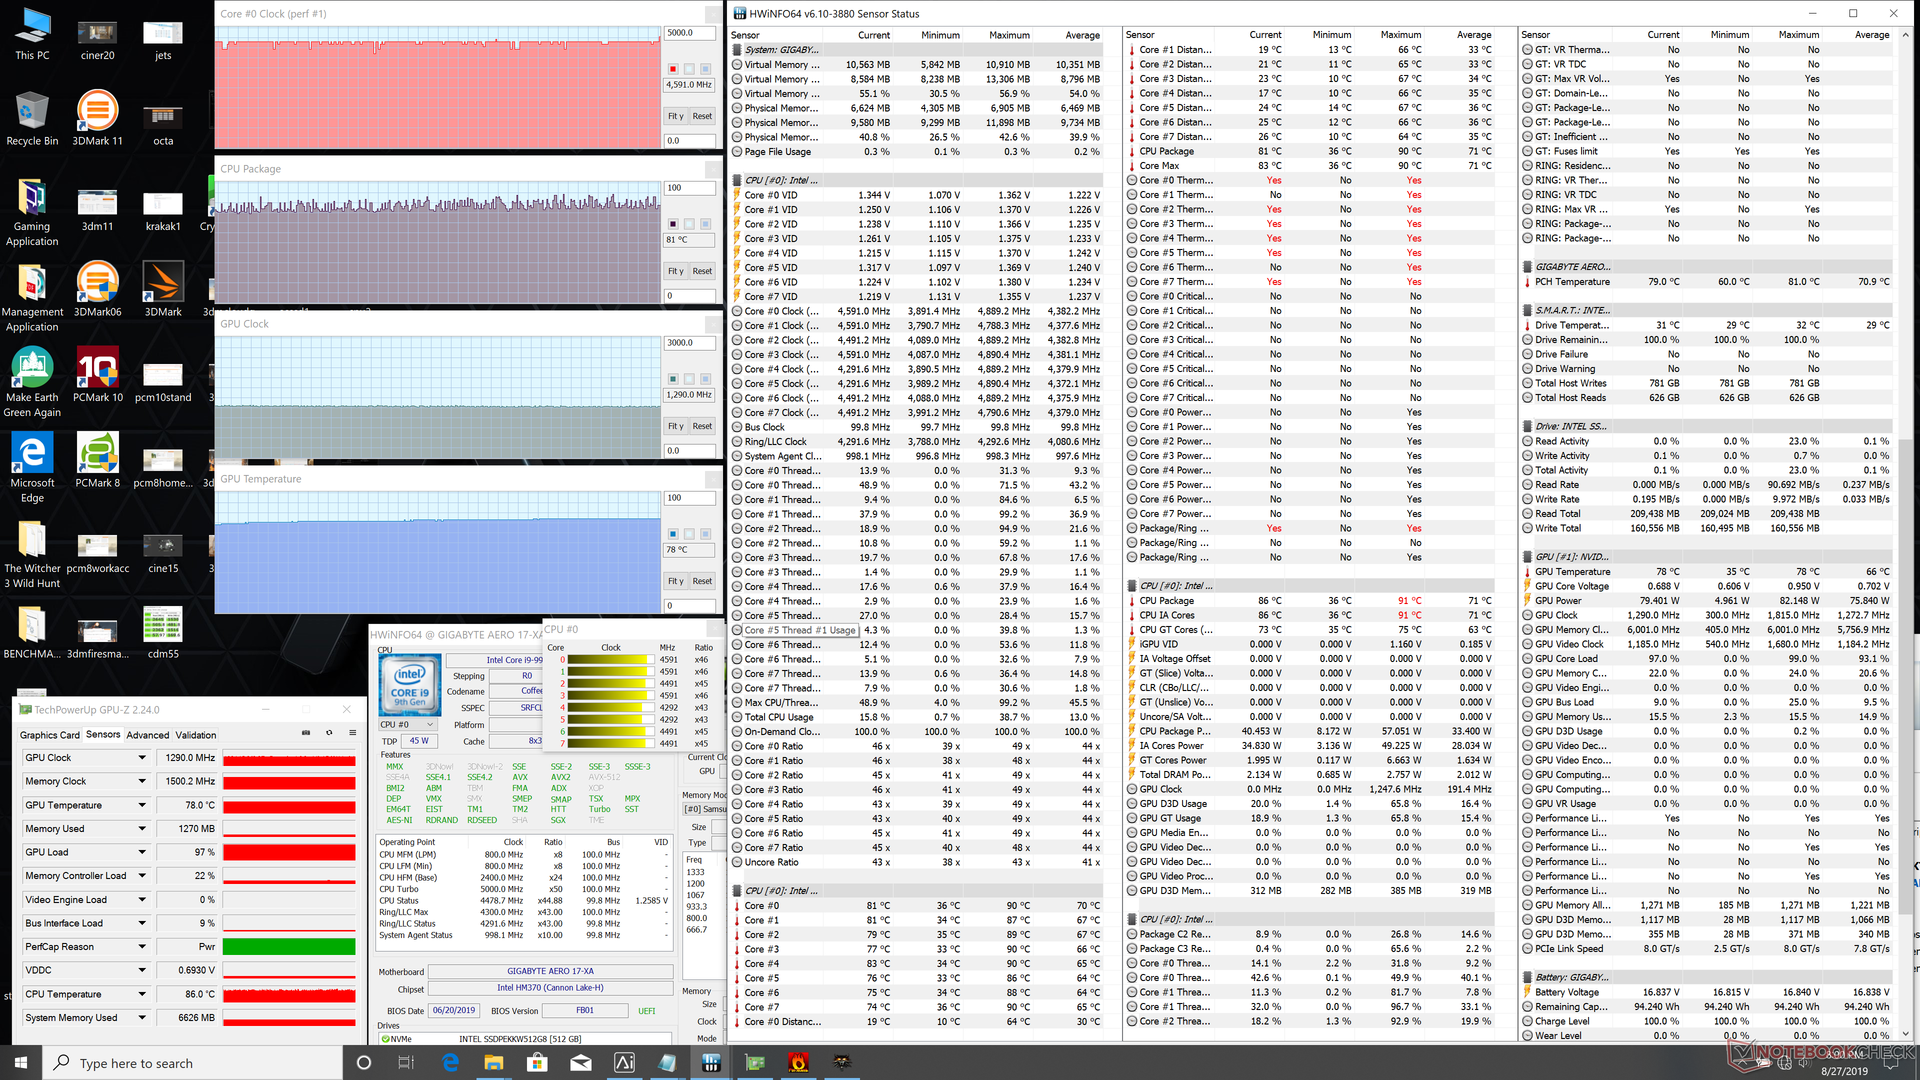
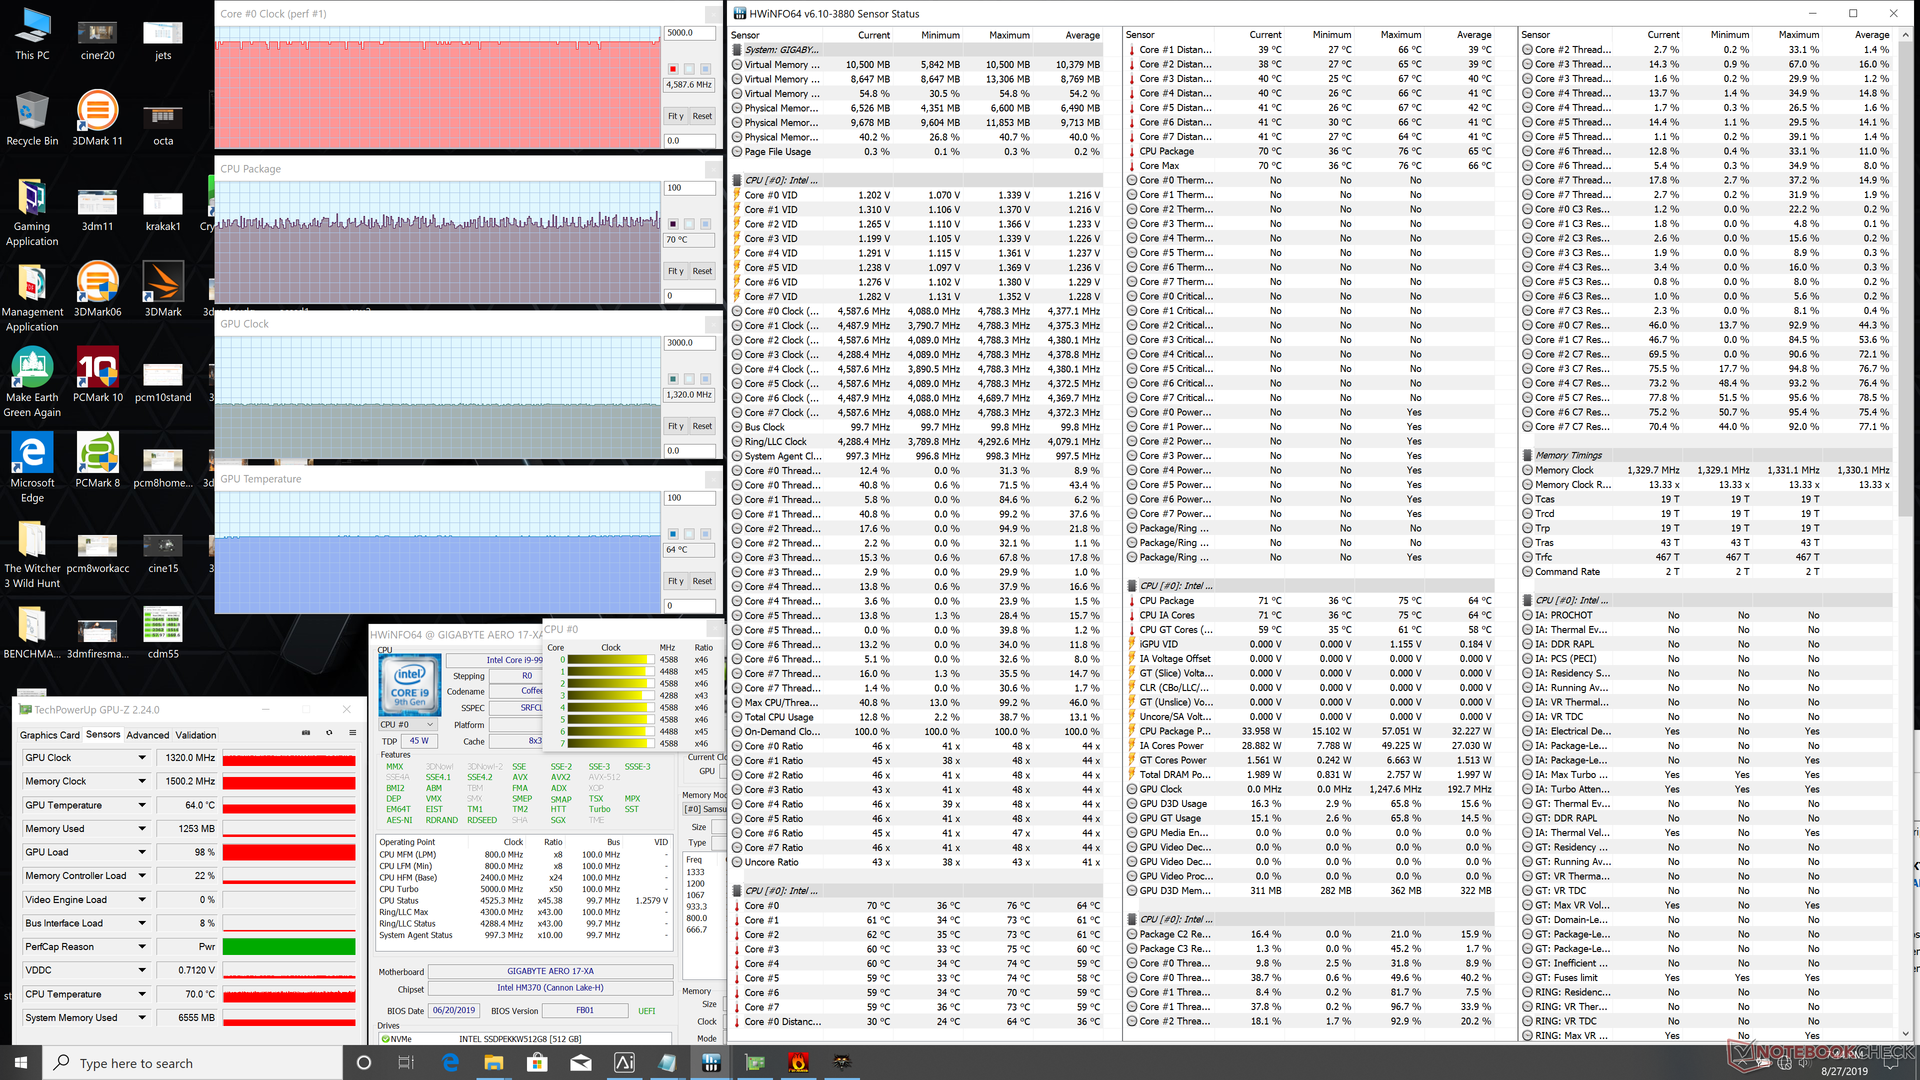
Running both Prime95 and FurMark simultaneously at Maximum Fan mode will cause the CPU and GPU to stabilize at 74 C and 70 C, respectively. Running Witcher 3 at the default Normal Fan mode results in relatively high CPU and GPU temperatures of 81 C and 78 C, respectively, compared to only 77 C and 67 C on the Razer Blade Pro 17. You'd have to activate Maximum Fan mode for significantly cooler temperatures as shown by our table below.
Running on batteries will limit performance. A Fire Strike run on battery power returns Physics and Graphics scores of 9745 and 11093 points, respectively, compared to 20584 and 16369 points when on mains.
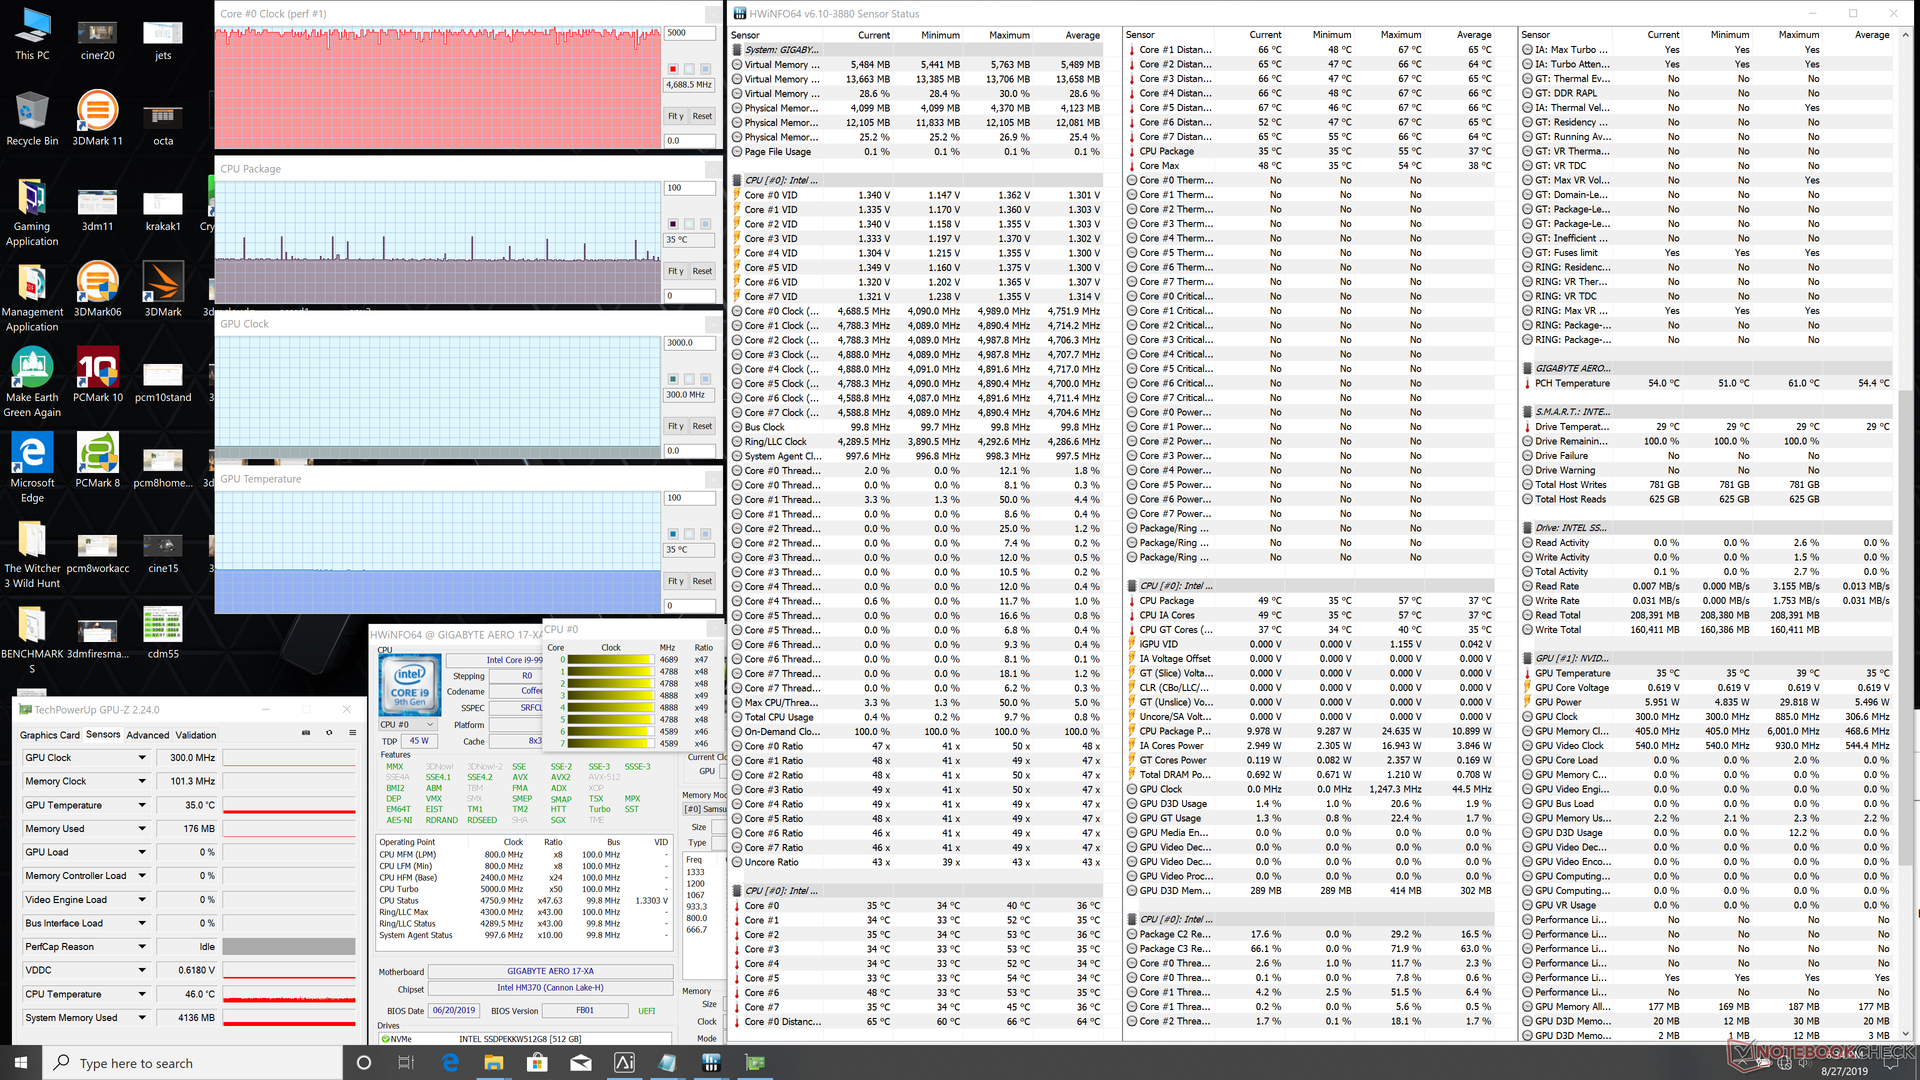
| CPU Clock (GHz) | GPU Clock (MHz) | Average CPU Temperature (°C) | Average GPU Temperature (°C) | |
| System Idle | -- | -- | 35 | 35 |
| Prime95 Stress (Default fan) | 3.0 | -- | 68 | 54 |
| Prime95 Stress (Maximum fan) | 3.0 | -- | 56 | 43 |
| Prime95 + FurMark Stress (Maximum fan) | 3.3 | 1035 | 74 | 70 |
| Witcher 3 Stress (Default fan) | 4.5 | 1290 | 81 | 78 |
| Witcher 3 Stress (Maximum fan) | 4.5 | 1320 | 70 | 64 |
Speakers
Audio quality is relatively balanced even if bass is lacking. Maximum volume, while still loud, is quieter than many other 17.3-inch laptops including the Razer Blade Pro 17 (76 dB(A) vs. 83 dB(A)). The palm rests will vibrate slightly when audio is at a high volume setting since the speakers are positioned near the front corners.


Gigabyte Aero 17 XA RP77 audio analysis
(±) | speaker loudness is average but good (75.9 dB)
Bass 100 - 315 Hz
(±) | reduced bass - on average 12.6% lower than median
(±) | linearity of bass is average (11.8% delta to prev. frequency)
Mids 400 - 2000 Hz
(+) | balanced mids - only 3.7% away from median
(±) | linearity of mids is average (8.6% delta to prev. frequency)
Highs 2 - 16 kHz
(+) | balanced highs - only 1.9% away from median
(+) | highs are linear (6.9% delta to prev. frequency)
Overall 100 - 16.000 Hz
(±) | linearity of overall sound is average (19.9% difference to median)
Compared to same class
» 67% of all tested devices in this class were better, 6% similar, 27% worse
» The best had a delta of 6%, average was 18%, worst was 132%
Compared to all devices tested
» 46% of all tested devices were better, 7% similar, 47% worse
» The best had a delta of 4%, average was 25%, worst was 134%
Apple MacBook 12 (Early 2016) 1.1 GHz audio analysis
(+) | speakers can play relatively loud (83.6 dB)
Bass 100 - 315 Hz
(±) | reduced bass - on average 11.3% lower than median
(±) | linearity of bass is average (14.2% delta to prev. frequency)
Mids 400 - 2000 Hz
(+) | balanced mids - only 2.4% away from median
(+) | mids are linear (5.5% delta to prev. frequency)
Highs 2 - 16 kHz
(+) | balanced highs - only 2% away from median
(+) | highs are linear (4.5% delta to prev. frequency)
Overall 100 - 16.000 Hz
(+) | overall sound is linear (10.2% difference to median)
Compared to same class
» 5% of all tested devices in this class were better, 2% similar, 93% worse
» The best had a delta of 5%, average was 19%, worst was 53%
Compared to all devices tested
» 3% of all tested devices were better, 1% similar, 96% worse
» The best had a delta of 4%, average was 25%, worst was 134%
Energy Management
Power Consumption
Idling demands anywhere between 19 W and 36 W depending on the brightness setting and power profile. Since the display can be so bright, the difference between minimum and maximum brightness settings is about 9 W.
When running Witcher 3, consumption becomes constant at 158 W compared to 147 W and 181 W on the RTX 2060-powered Asus G731GV and RTX 2070-powered Asus G731GW, respectively. The RTX 2070 Max-Q consumes roughly 13 percent less power than the standard mobile RTX 2070 for 11 percent slower GPU performance. The performance and power consumption differences between the RTX 2070 Max-Q and mobile RTX 2060 are similarly linear.
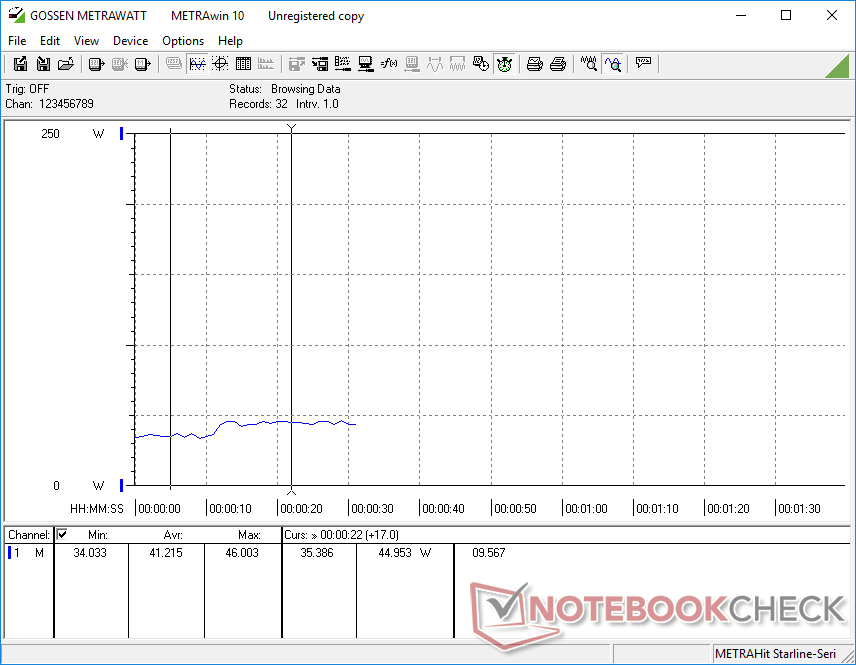
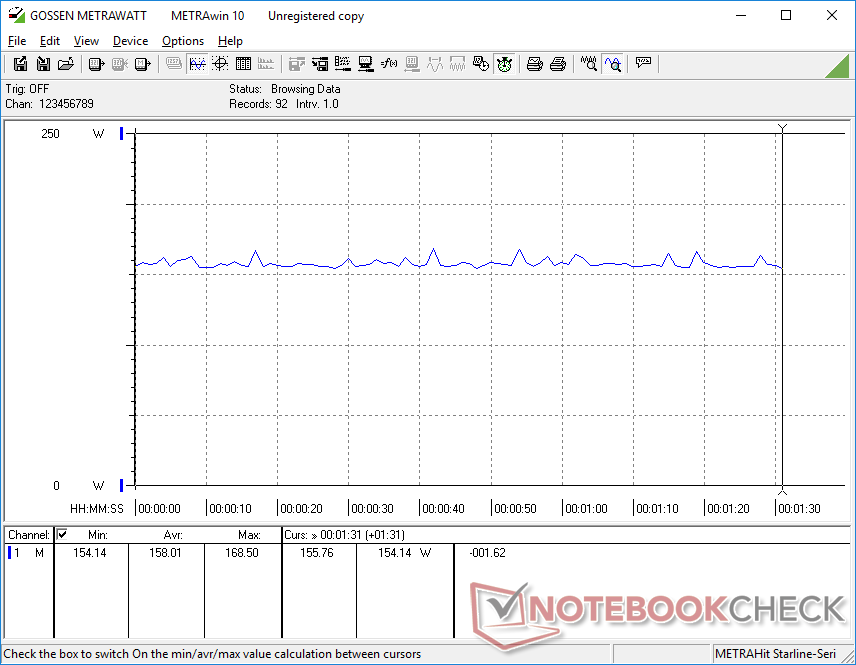
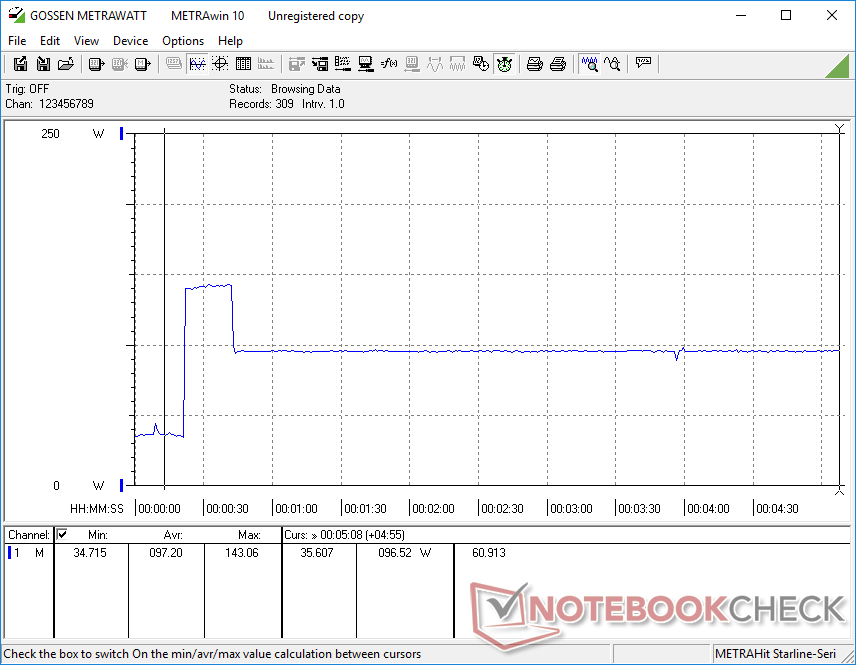
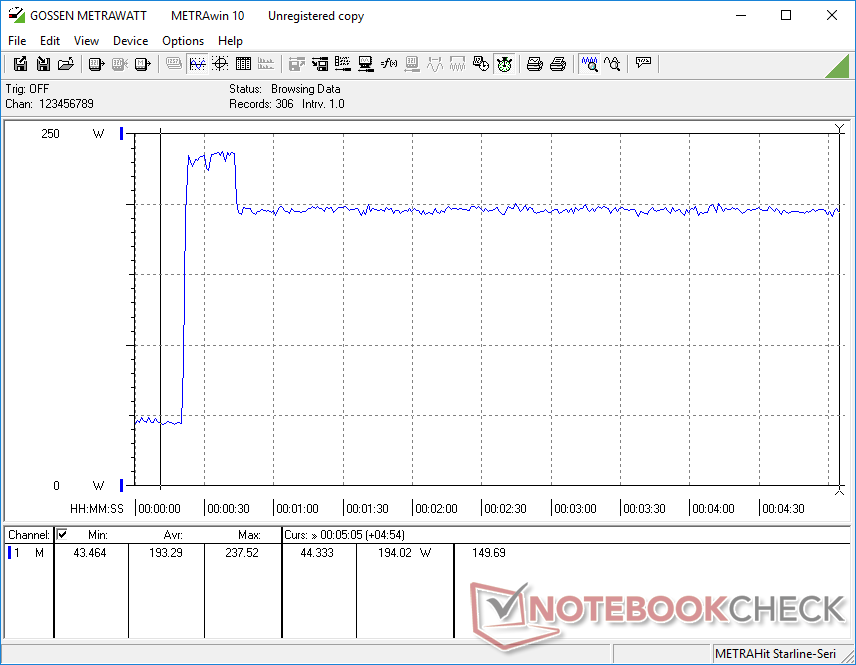
We're able to measure a maximum consumption of 238 W from the medium-sized (~15.5 x 7.5 x 3 cm) 230 W AC adapter when running both Prime95 and FurMark simultaneously. This high of a consumption is unsustainable due to thermal limitations and so it eventually falls and stabilizes at 194 W as shown by our graph below. Similarly, running Prime95 results in a ~20 second spike to 143 W before inevitably falling to match our CineBench R15 loop test and stress test observations above.
| Off / Standby | |
| Idle | |
| Load |
|
| Gigabyte Aero 17 XA RP77 i9-9980HK, GeForce RTX 2070 Max-Q, Intel SSD 760p SSDPEKKW512G8, IPS, 3840x2160, 17.30 | Razer Blade Pro 17 RTX 2080 Max-Q i7-9750H, GeForce RTX 2080 Max-Q, Samsung SSD PM981 MZVLB512HAJQ, IPS, 1920x1080, 17.30 | Aorus X7 DT v8 i7-8850H, GeForce GTX 1080 Mobile, Toshiba NVMe THNSN5512GPU7, IPS, 1920x1080, 17.30 | Asus Zephyrus S GX701GX i7-8750H, GeForce RTX 2080 Max-Q, Samsung SSD PM981 MZVLB1T0HALR, IPS, 1920x1080, 17.30 | Asus Strix Hero III G731GV i7-9750H, GeForce RTX 2060 Mobile, Intel SSD 660p SSDPEKNW512G8, IPS, 1920x1080, 17.30 | Asus ASUS ROG Strix SCAR III G731GW-XB74 i7-9750H, GeForce RTX 2070 Mobile, Intel SSD 660p 1TB SSDPEKNW010T8, IPS, 1920x1080, 17.30 | |
|---|---|---|---|---|---|---|
| Power Consumption | 7% | -26% | 2% | 3% | -7% | |
| Idle Minimum * | 13.9 | 16.2 -17% | 23 -65% | 19 -37% | 16.2 -17% | 18.2 -31% |
| Idle Average * | 24.3 | 20.4 16% | 33 -36% | 22 9% | 24.8 -2% | 23 5% |
| Idle Maximum * | 35.5 | 26.1 26% | 37 -4% | 30 15% | 28.6 19% | 33.1 7% |
| Load Average * | 127.6 | 96.5 24% | 115 10% | 104 18% | 127.6 -0% | 124.8 2% |
| Witcher 3 ultra * | 158 | 182.9 -16% | 225 -42% | 167 -6% | 147.1 7% | 180.8 -14% |
| Load Maximum * | 237.5 | 214.3 10% | 281 -18% | 203 15% | 212.7 10% | 263 -11% |
* ... smaller is better
Battery Life
The Aero 17 ships with the same high capacity 94.24 Wh battery as on the Aero 15 for similarly long runtimes. We're able to record just over 7 hours of real-world WLAN use when set to the Balanced profile with the integrated GPU active to be over two hours longer than the Razer Blade Pro 17, Aorus X7, and Alienware m17.
Recharging from empty to full capacity takes a full two hours to be half an hour longer than most Ultrabooks with smaller batteries. We attempted to recharge the system with a 130 W AC Dell XPS 9575 USB-C adapter to check four USB Type-C PD, but the Aero 17 can only charge through its proprietary AC port.
| Gigabyte Aero 17 XA RP77 i9-9980HK, GeForce RTX 2070 Max-Q, 94.24 Wh | Razer Blade Pro 17 RTX 2080 Max-Q i7-9750H, GeForce RTX 2080 Max-Q, 70 Wh | Aorus X7 DT v8 i7-8850H, GeForce GTX 1080 Mobile, 94.24 Wh | Alienware m17 P37E i9-8950HK, GeForce RTX 2080 Max-Q, 90 Wh | Asus Zephyrus S GX701GX i7-8750H, GeForce RTX 2080 Max-Q, 76 Wh | Asus Strix Hero III G731GV i7-9750H, GeForce RTX 2060 Mobile, 66 Wh | |
|---|---|---|---|---|---|---|
| Battery Runtime | -35% | -41% | -35% | -51% | -37% | |
| Reader / Idle | 711 | 295 -59% | 296 -58% | 543 -24% | 298 -58% | |
| WiFi v1.3 | 431 | 280 -35% | 228 -47% | 296 -31% | 230 -47% | 270 -37% |
| Load | 98 | 86 -12% | 80 -18% | 49 -50% | 52 -47% |
Pros
Cons
Verdict

The Aero 17 makes last year's Aorus X7 DT obsolete. It's noticeably lighter, stronger, brighter, quieter, faster, cooler, longer-lasting, and more efficient all at the same time. If you've been considering an Aorus X laptop, then there's almost no reason why you shouldn't go for the Aero 17 instead.
When compared to other high-performance ultra-thin laptops in its size category, the Aero 17 combines four noteworthy features not found elsewhere together: Thunderbolt 3, an SD card reader, full-size NumPad, and an extremely bright HDR400 pre-calibrated Pantone display. Competing models like the MSI GS75, MSI P75, Asus Zephyrus GX701, or even the Razer Blade Pro 17/Blade Studio are each missing at least one of these features. The Aero 17 feels more like a complete package for content creators and gamers instead of a laptop that was created primarily for gamers with professional features haphazardly thrown in.
There's still a lot that Gigabyte can do to make the Aero 17 a better machine. Keyboard and clickpad feedback in particular could have been firmer and the unlit key symbols are an oversight. Webcam positioning is poor and IR is not an option which is a shame for a laptop aimed at professionals. A spring-loaded SD reader is preferable and both 2.5 Gbit RJ-45 and USB Type-C PD would feel right at home on the Aero series. For a laptop this pricey, we expect everything and the kitchen sink for the next iteration.
The high-performance Aero 17 is quieter than its competitors while offering more hardware features designed for content creators, professionals, and gamers alike. It gives the Razer Blade Pro 17 a run for the money with its very bright HDR400 display and full-size integrated NumPad that aren't found on many other thin laptops.
Gigabyte Aero 17 XA RP77
-
09/02/2019 v7
Allen Ngo


Pricecompare
