 Deutsch
 English
 Español
 Français
 Italiano
 Nederlands
 Polski
 Português
 Русский
 Türkçe
 Svenska
 Chinese
 Magyar
Geekom GT13 Pro mini-PC review - Stylish NUC alternative with Intel Core i9-13900H, 32 GB DDR4 RAM and 2 TB SSD
With the Geekom GT13 Pro, the manufacturer has a very powerful mini-PC based on Intel processors in its portfolio. Unfortunately, Geekom only uses Raptor Lake H processors, although Intel has recently launched the newer Meteor Lake chips. In the best configuration, the Intel Core i9-13900H is used, which is paired with 32 GB RAM and a 2 TB SSD. In terms of price, you have to dig deep into your pockets, as the final bill comes to 930 euros. At just 721 euros, the Geekom GT13 Pro based on the Intel Core i7-13620H is significantly cheaper. With 32 GB RAM, the cheaper model has the same amount of working memory, although the mass storage is only half the size at 1 TB.
Let's take a closer look at how well the Geekom GT13 Pro holds its own against other high-performance mini-PCs. Due to the price, however, expectations are already very high. We have compiled an overview of the comparison devices that accompany Geekom in this review in the following table.
Possible competitors in comparison
Date | Version | Model | Memory | Weight | Height | price |
|---|---|---|---|---|---|---|
06/2024 | v8 (new) | Geekom GT13 Pro i9-13900H, Iris Xe G7 96EUs | 32768 MB | 440 g | 37 mm | 930 EUR |
06/2024 | v8 (new) | Aoostar GEM12 R7 8845HS, Radeon 780M | 32768 MB | 653 g | 60 mm | 649 US-Dollar |
05/2024 | v7 (old) | Minisforum AtomMan X7 Ti Ultra 9 185H, Arc 8-Core | 32768 MB | 863 g | 48.6 mm | 959 Euro |
05/2024 | v7 (old) | Geekom A8 R9 8945HS, Radeon 780M | 32768 MB | 432 g | 38 mm | 949 EUR |
04/2024 | v7 (old) | Geekom XT12 Pro i9-12900H, Iris Xe G7 96EUs | 32768 MB | 545 g | 37 mm | 899 EUR |
04/2024 | v7 (old) | Acemagic F2A Ultra 7 155H, Arc 8-Core | 32768 MB | 768 g | 57 mm | 1199 EUR |
11/2023 | v7 (old) | Minisforum EliteMini UM780 XTX R7 7840HS, Radeon 780M | 32768 MB | 750 g | 52.3 mm | 879 EUR |
08/2023 | v7 (old) | Khadas Mind i7-1360P, Iris Xe G7 96EUs | 32768 MB | 438 g | 20 mm |
Note: We have updated our rating system and the results of version 8 are not comparable with the results of version 7 available here.
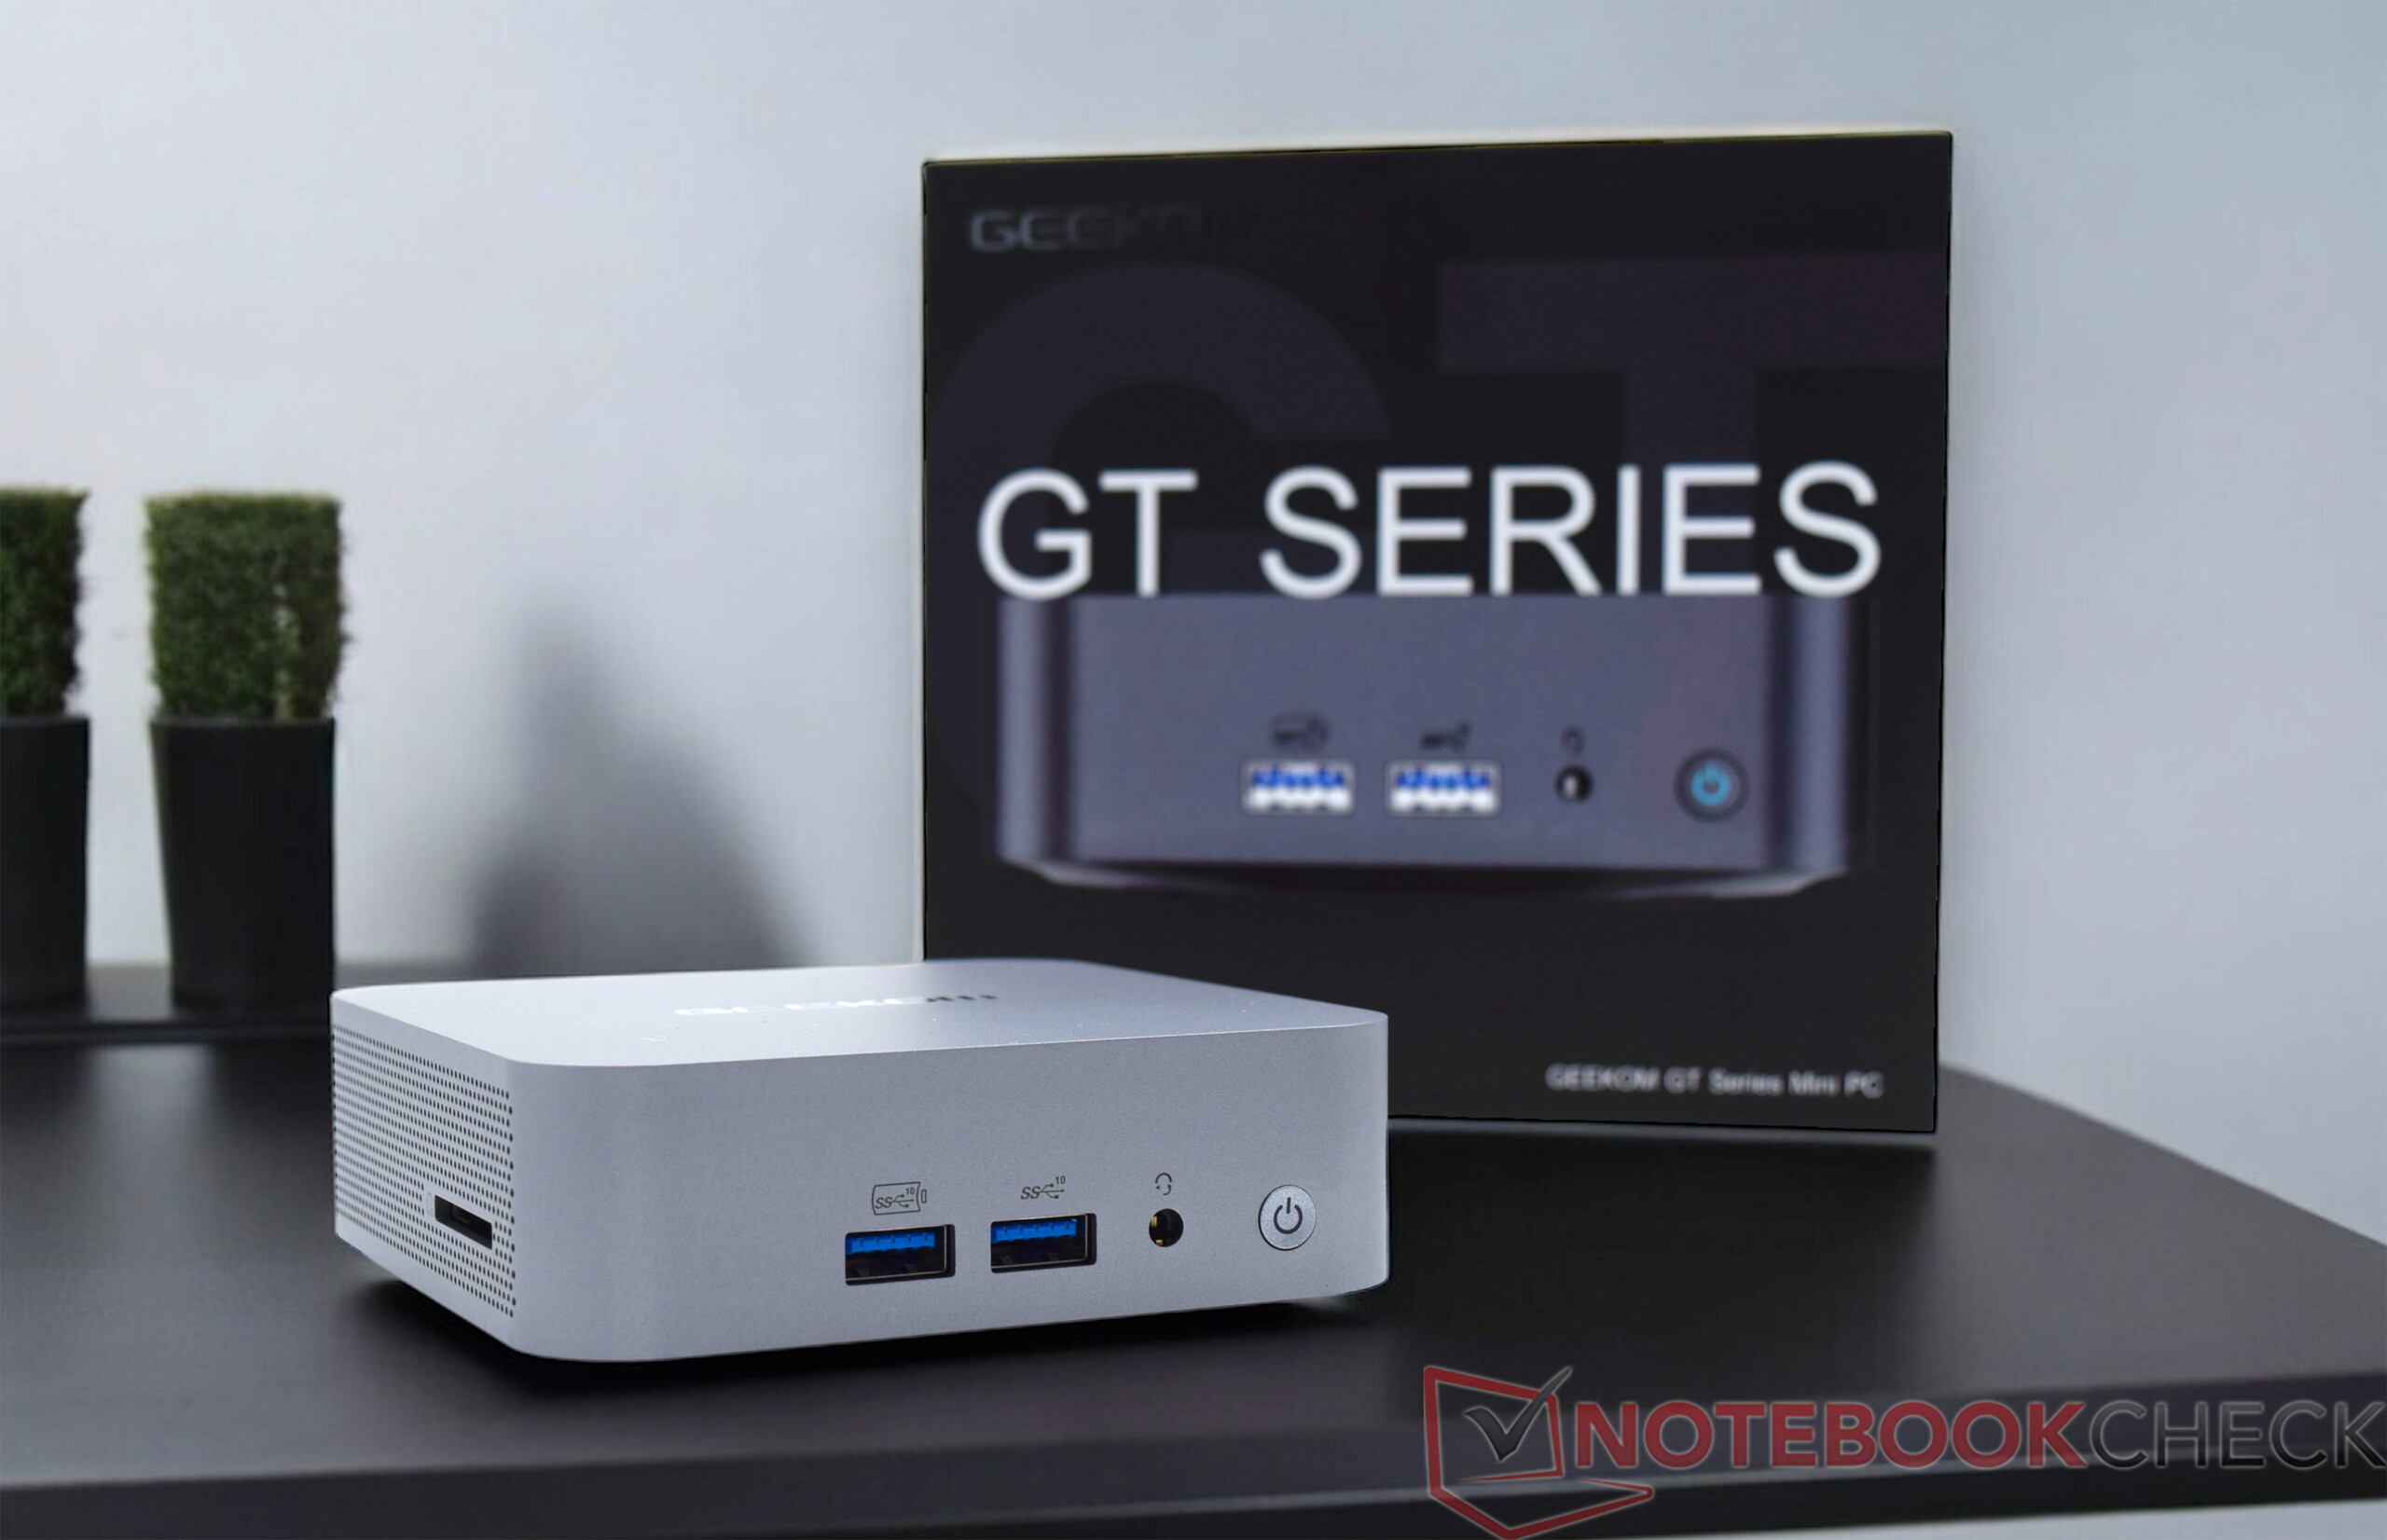
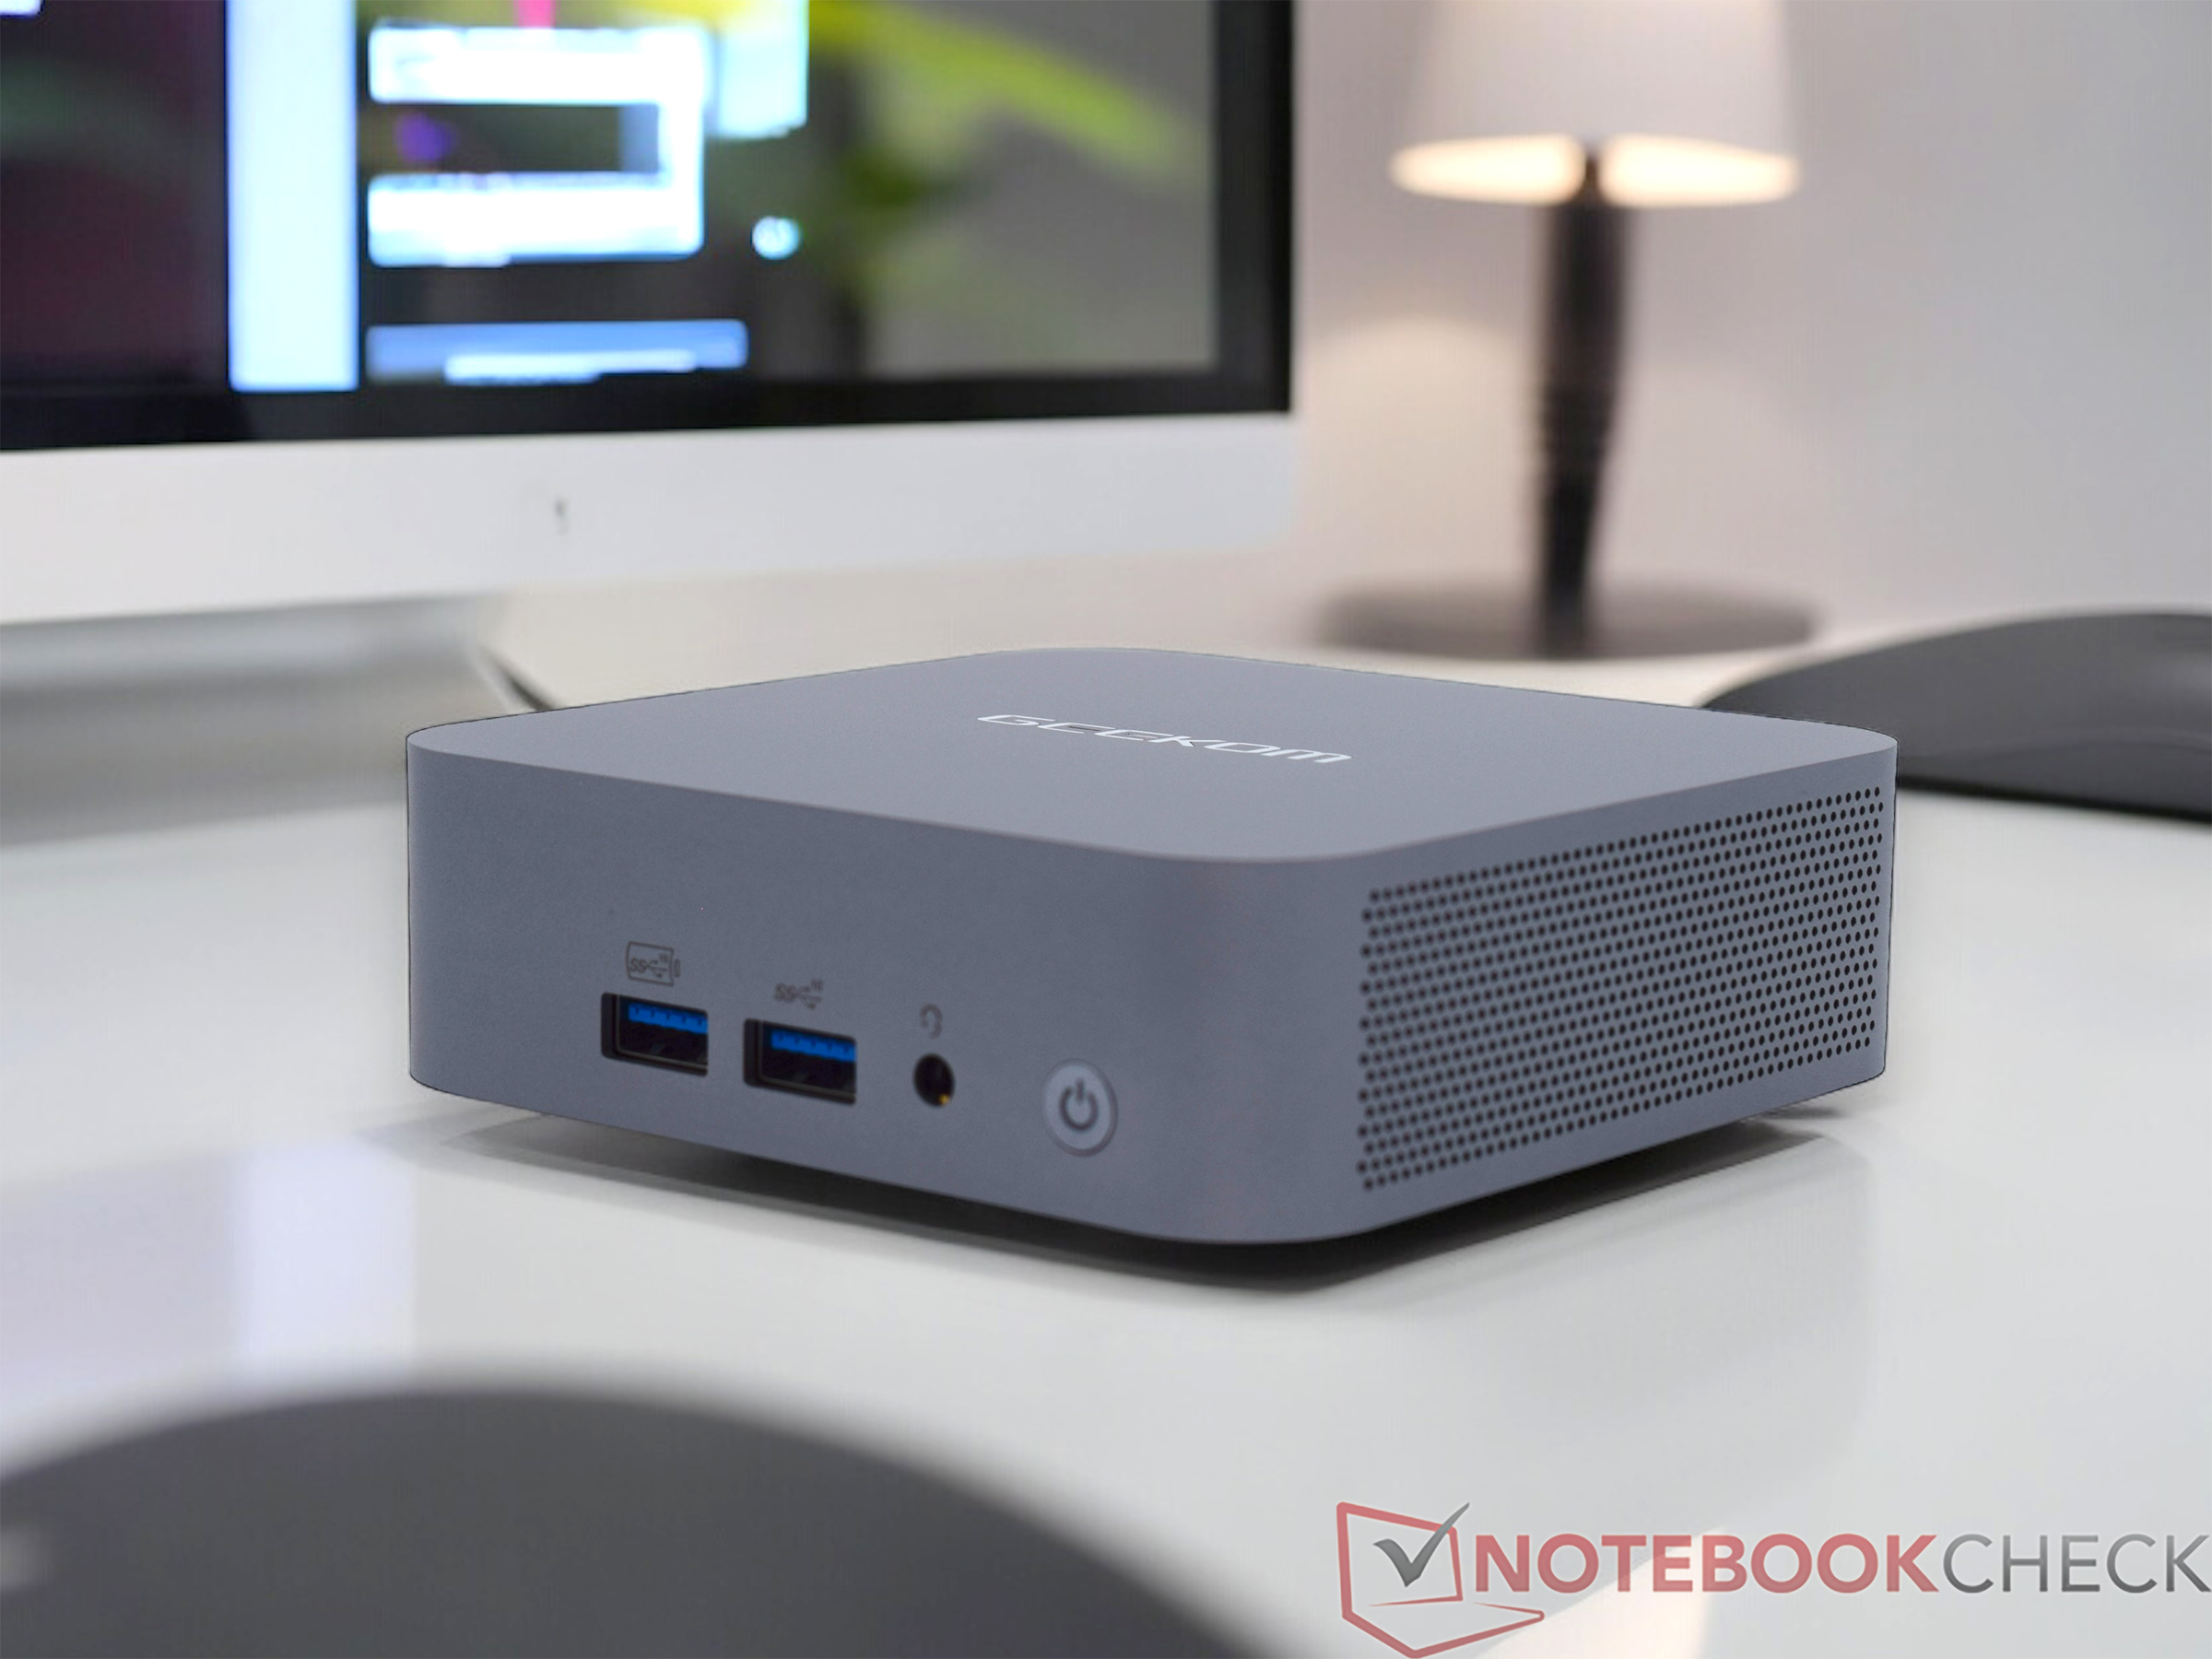
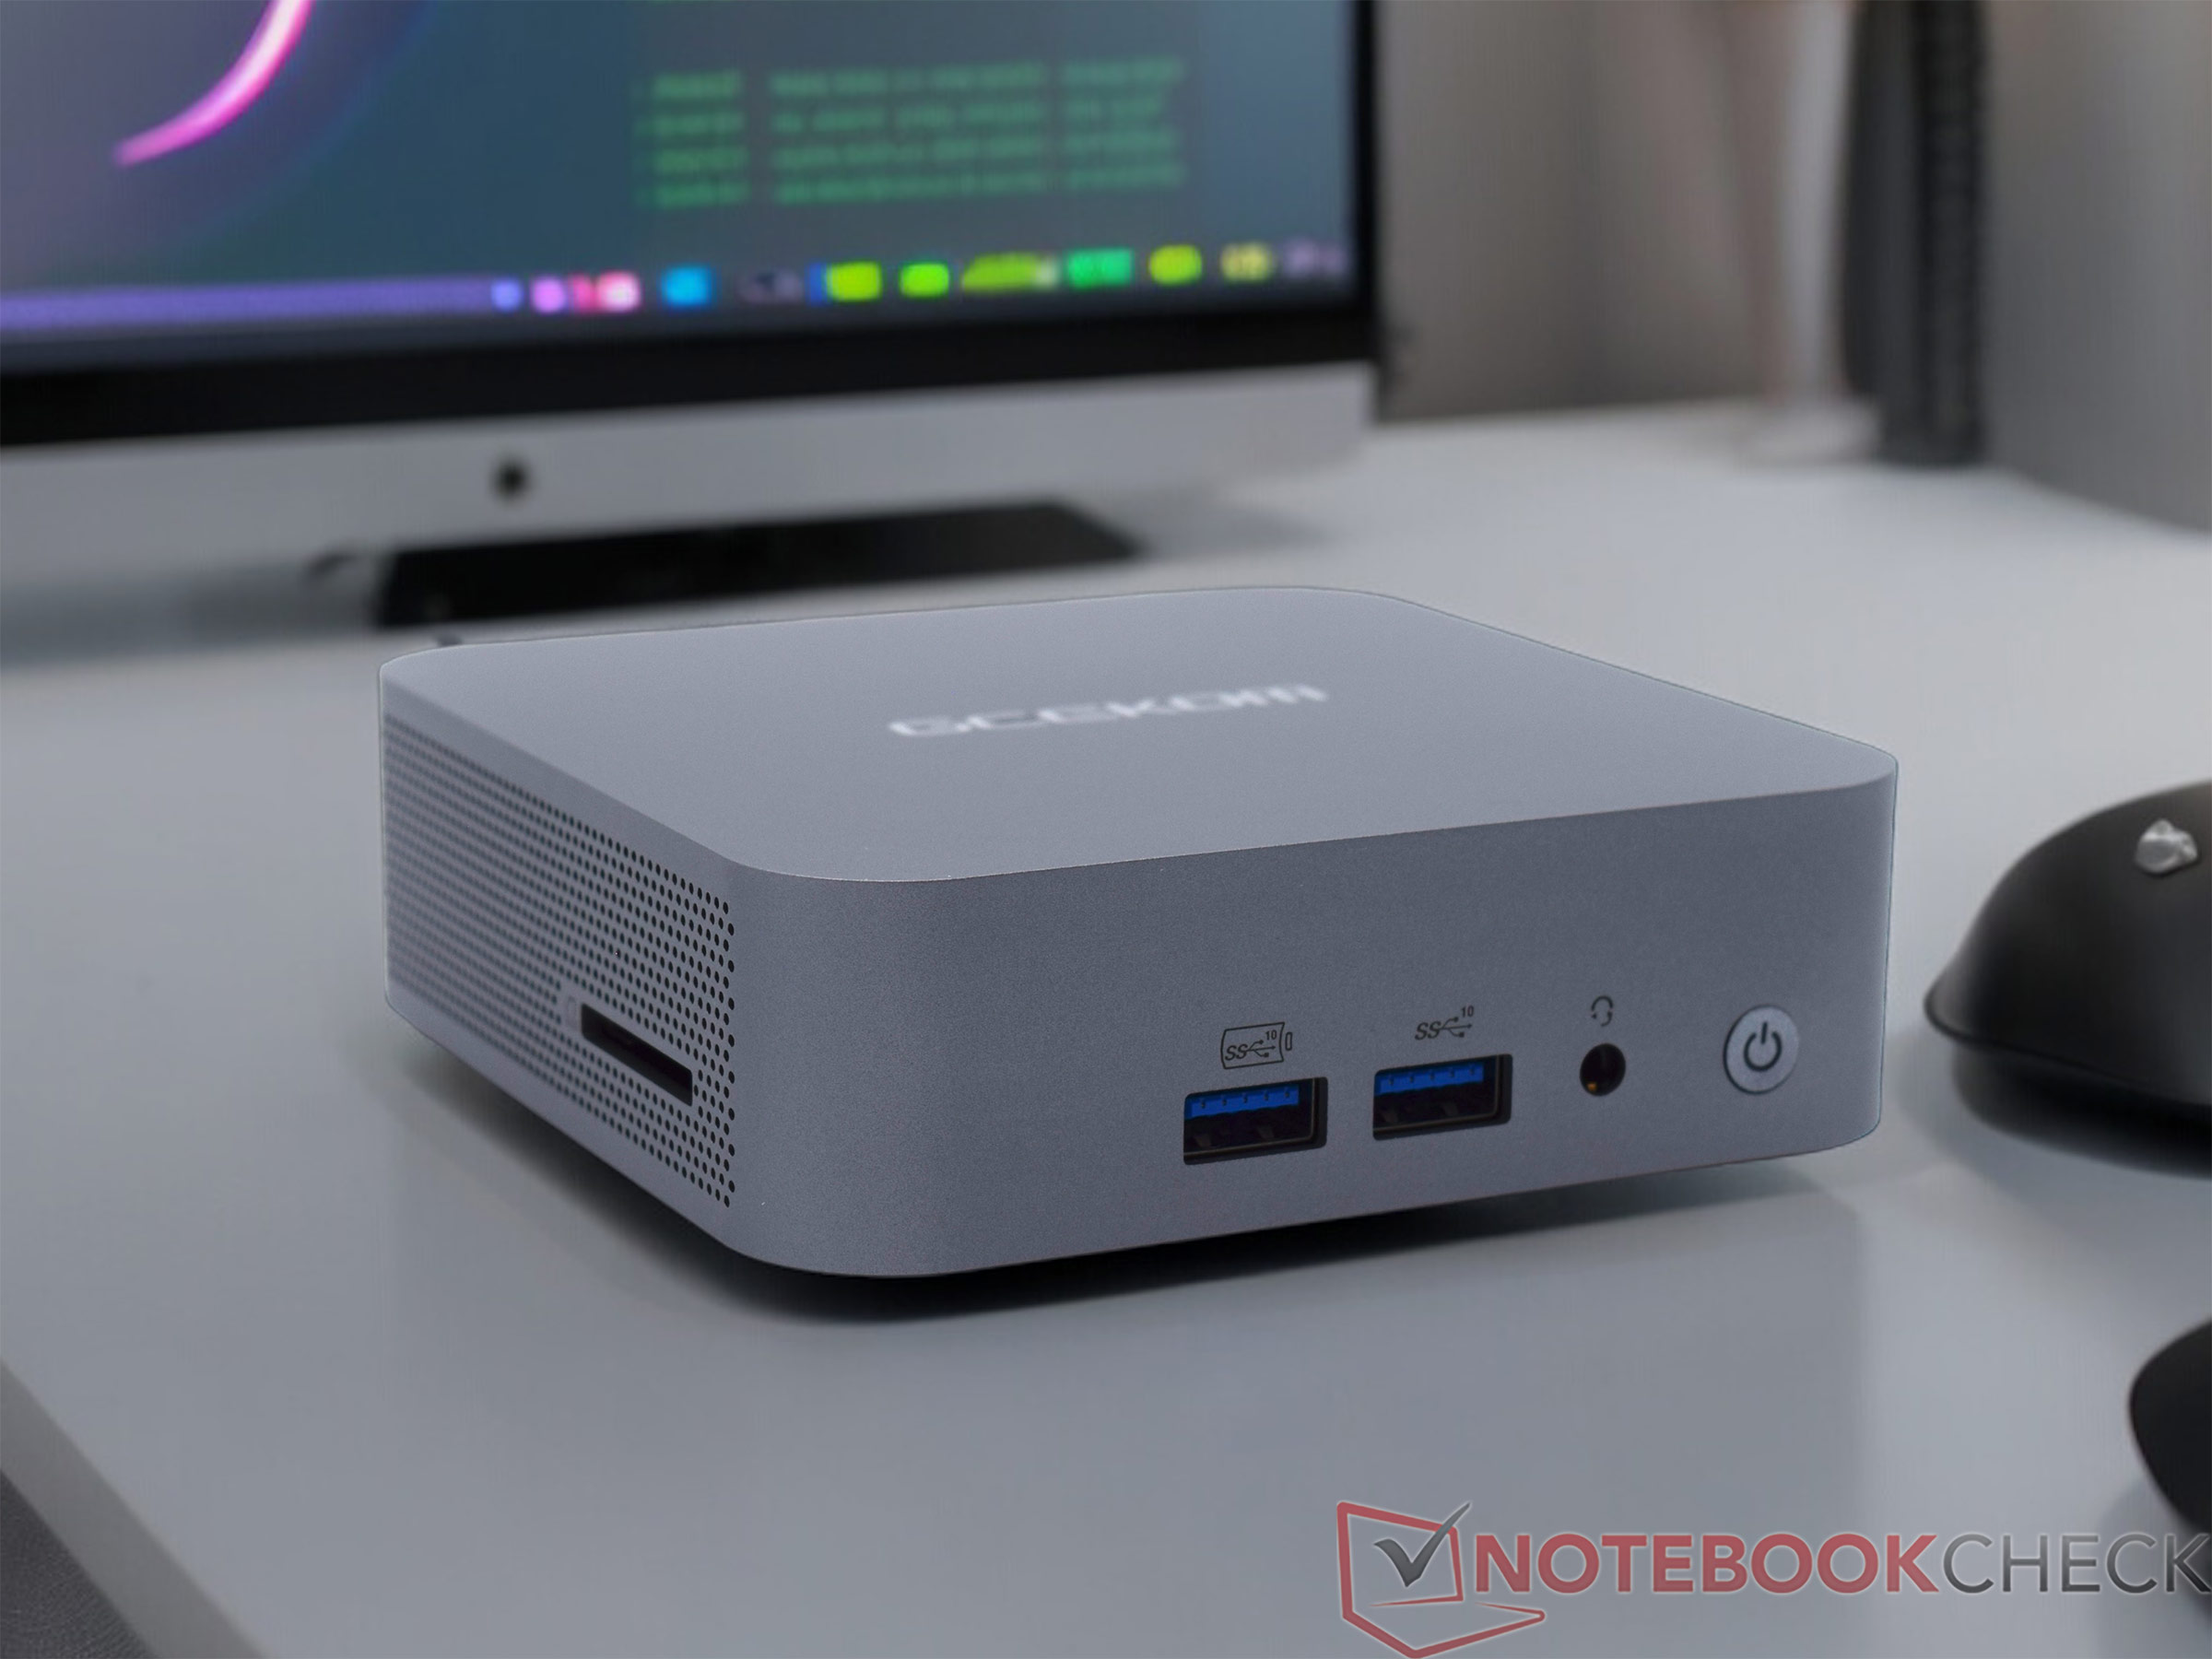
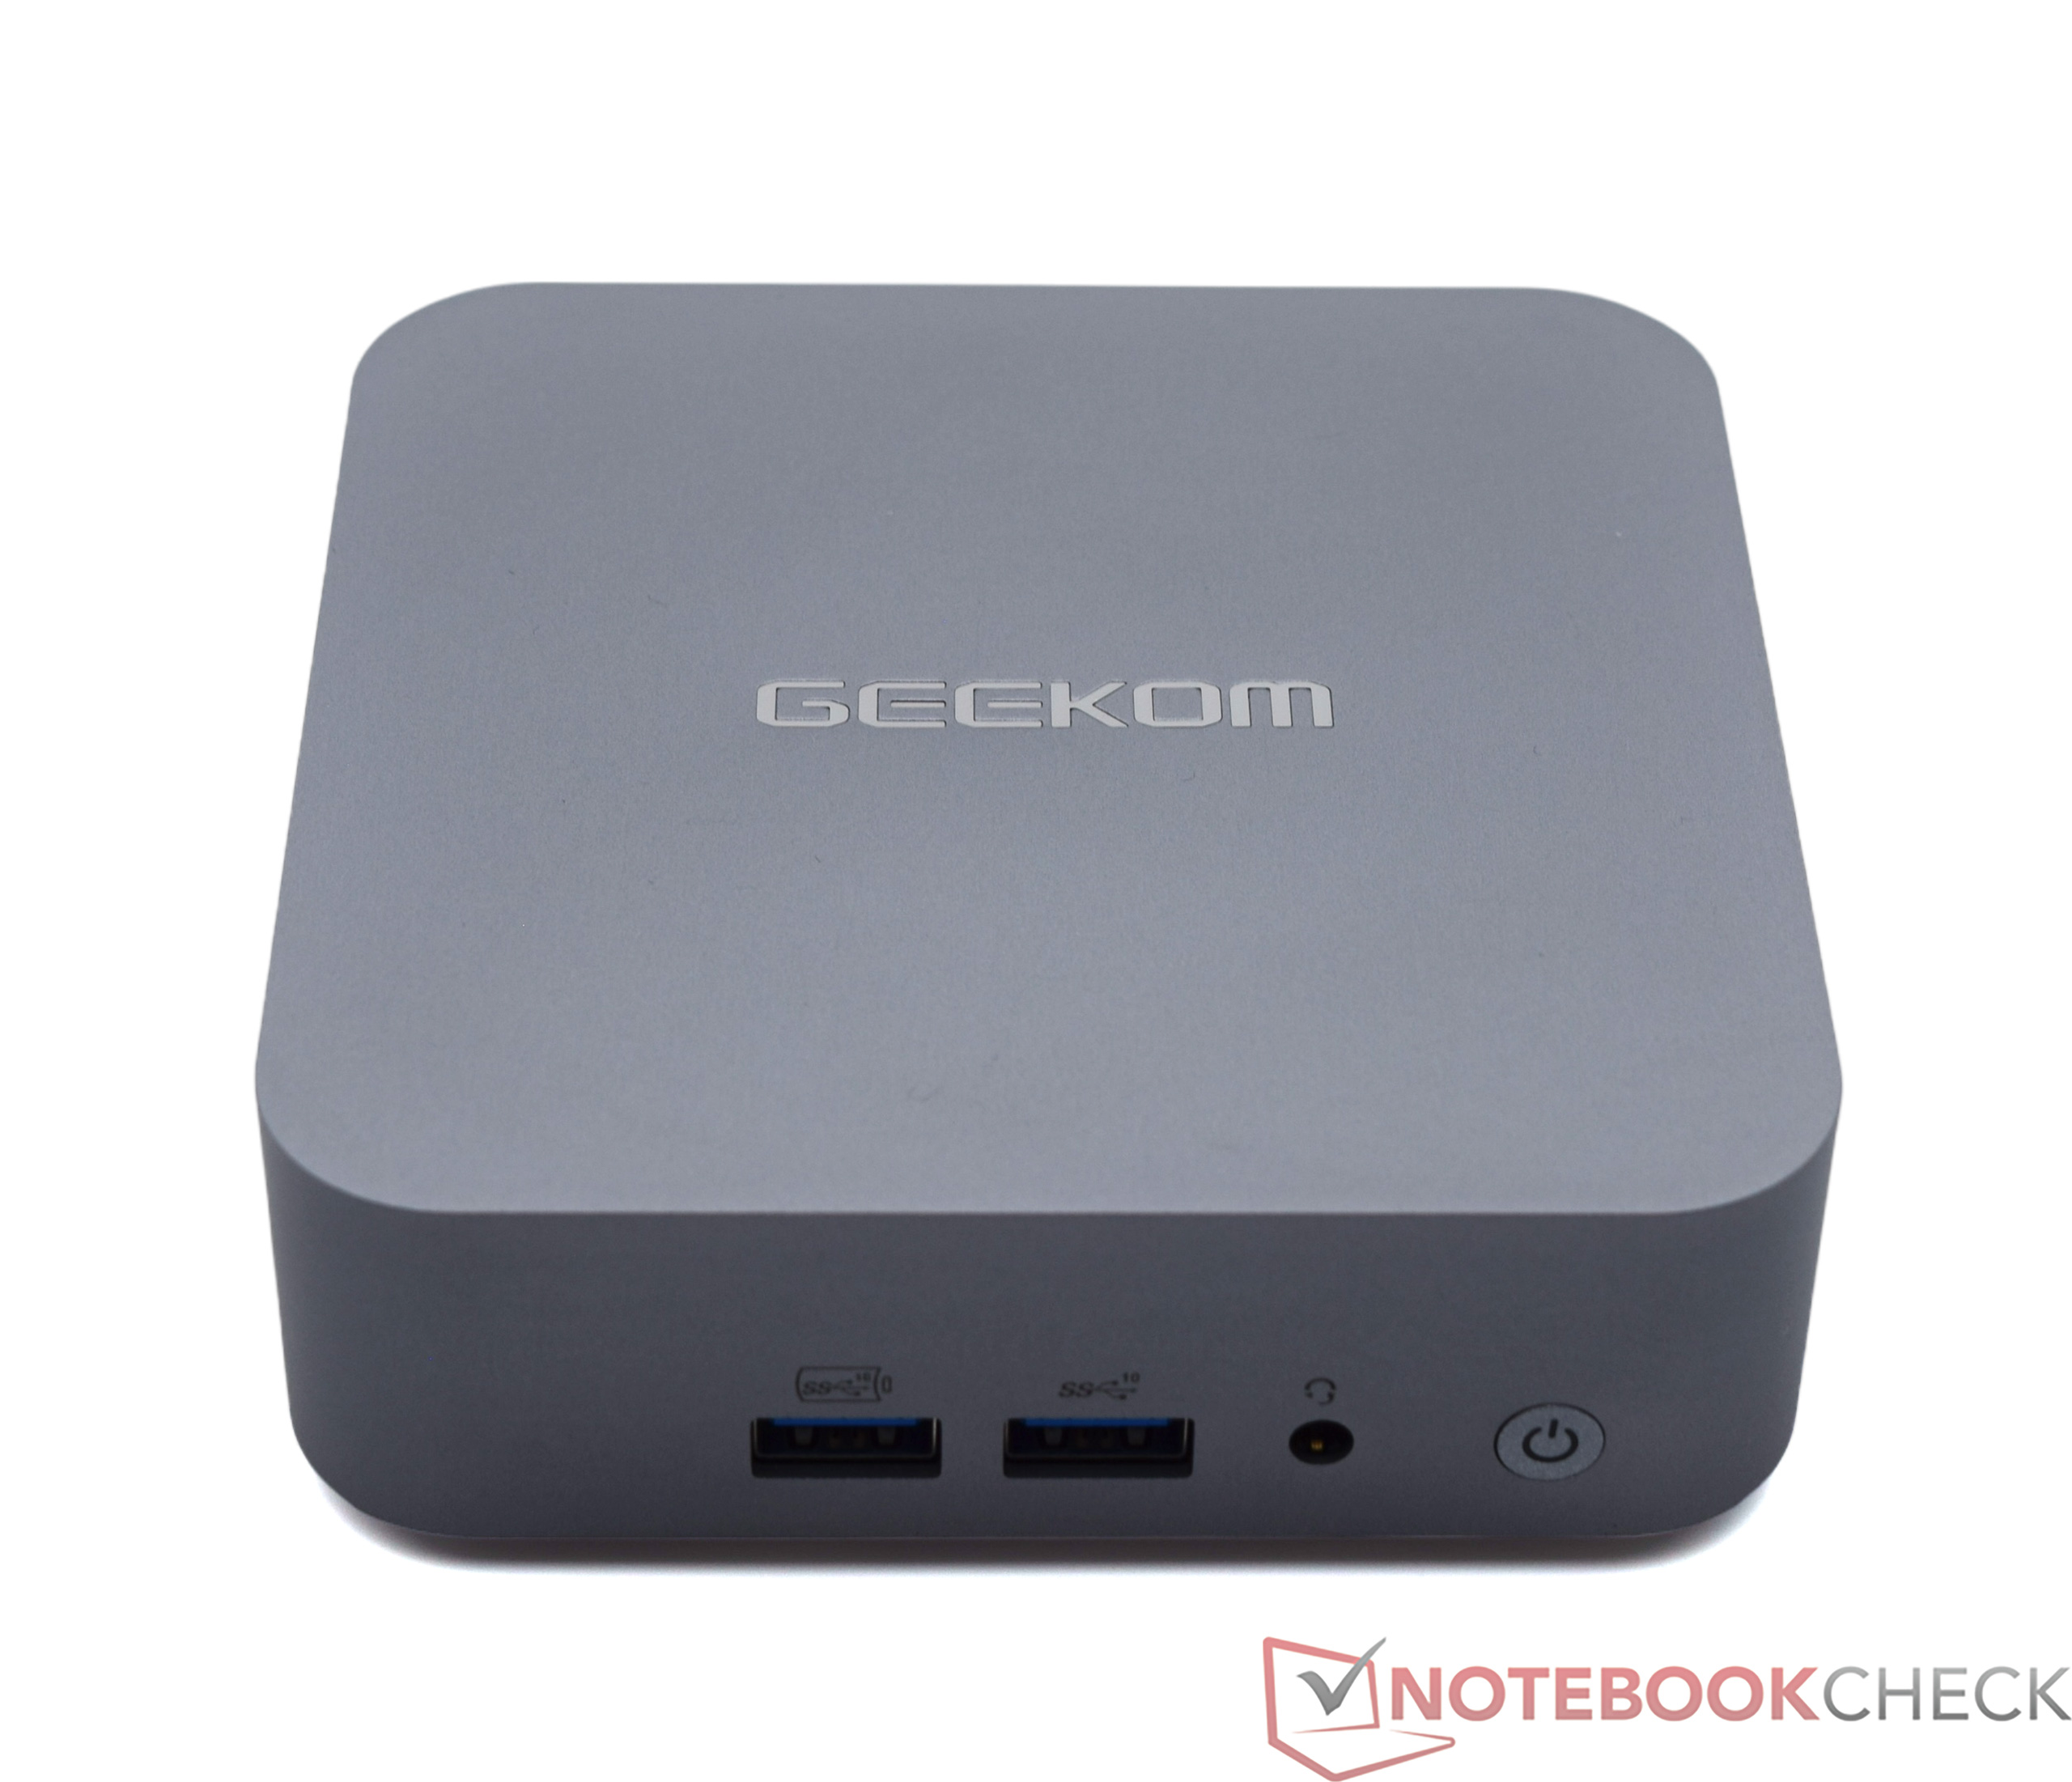
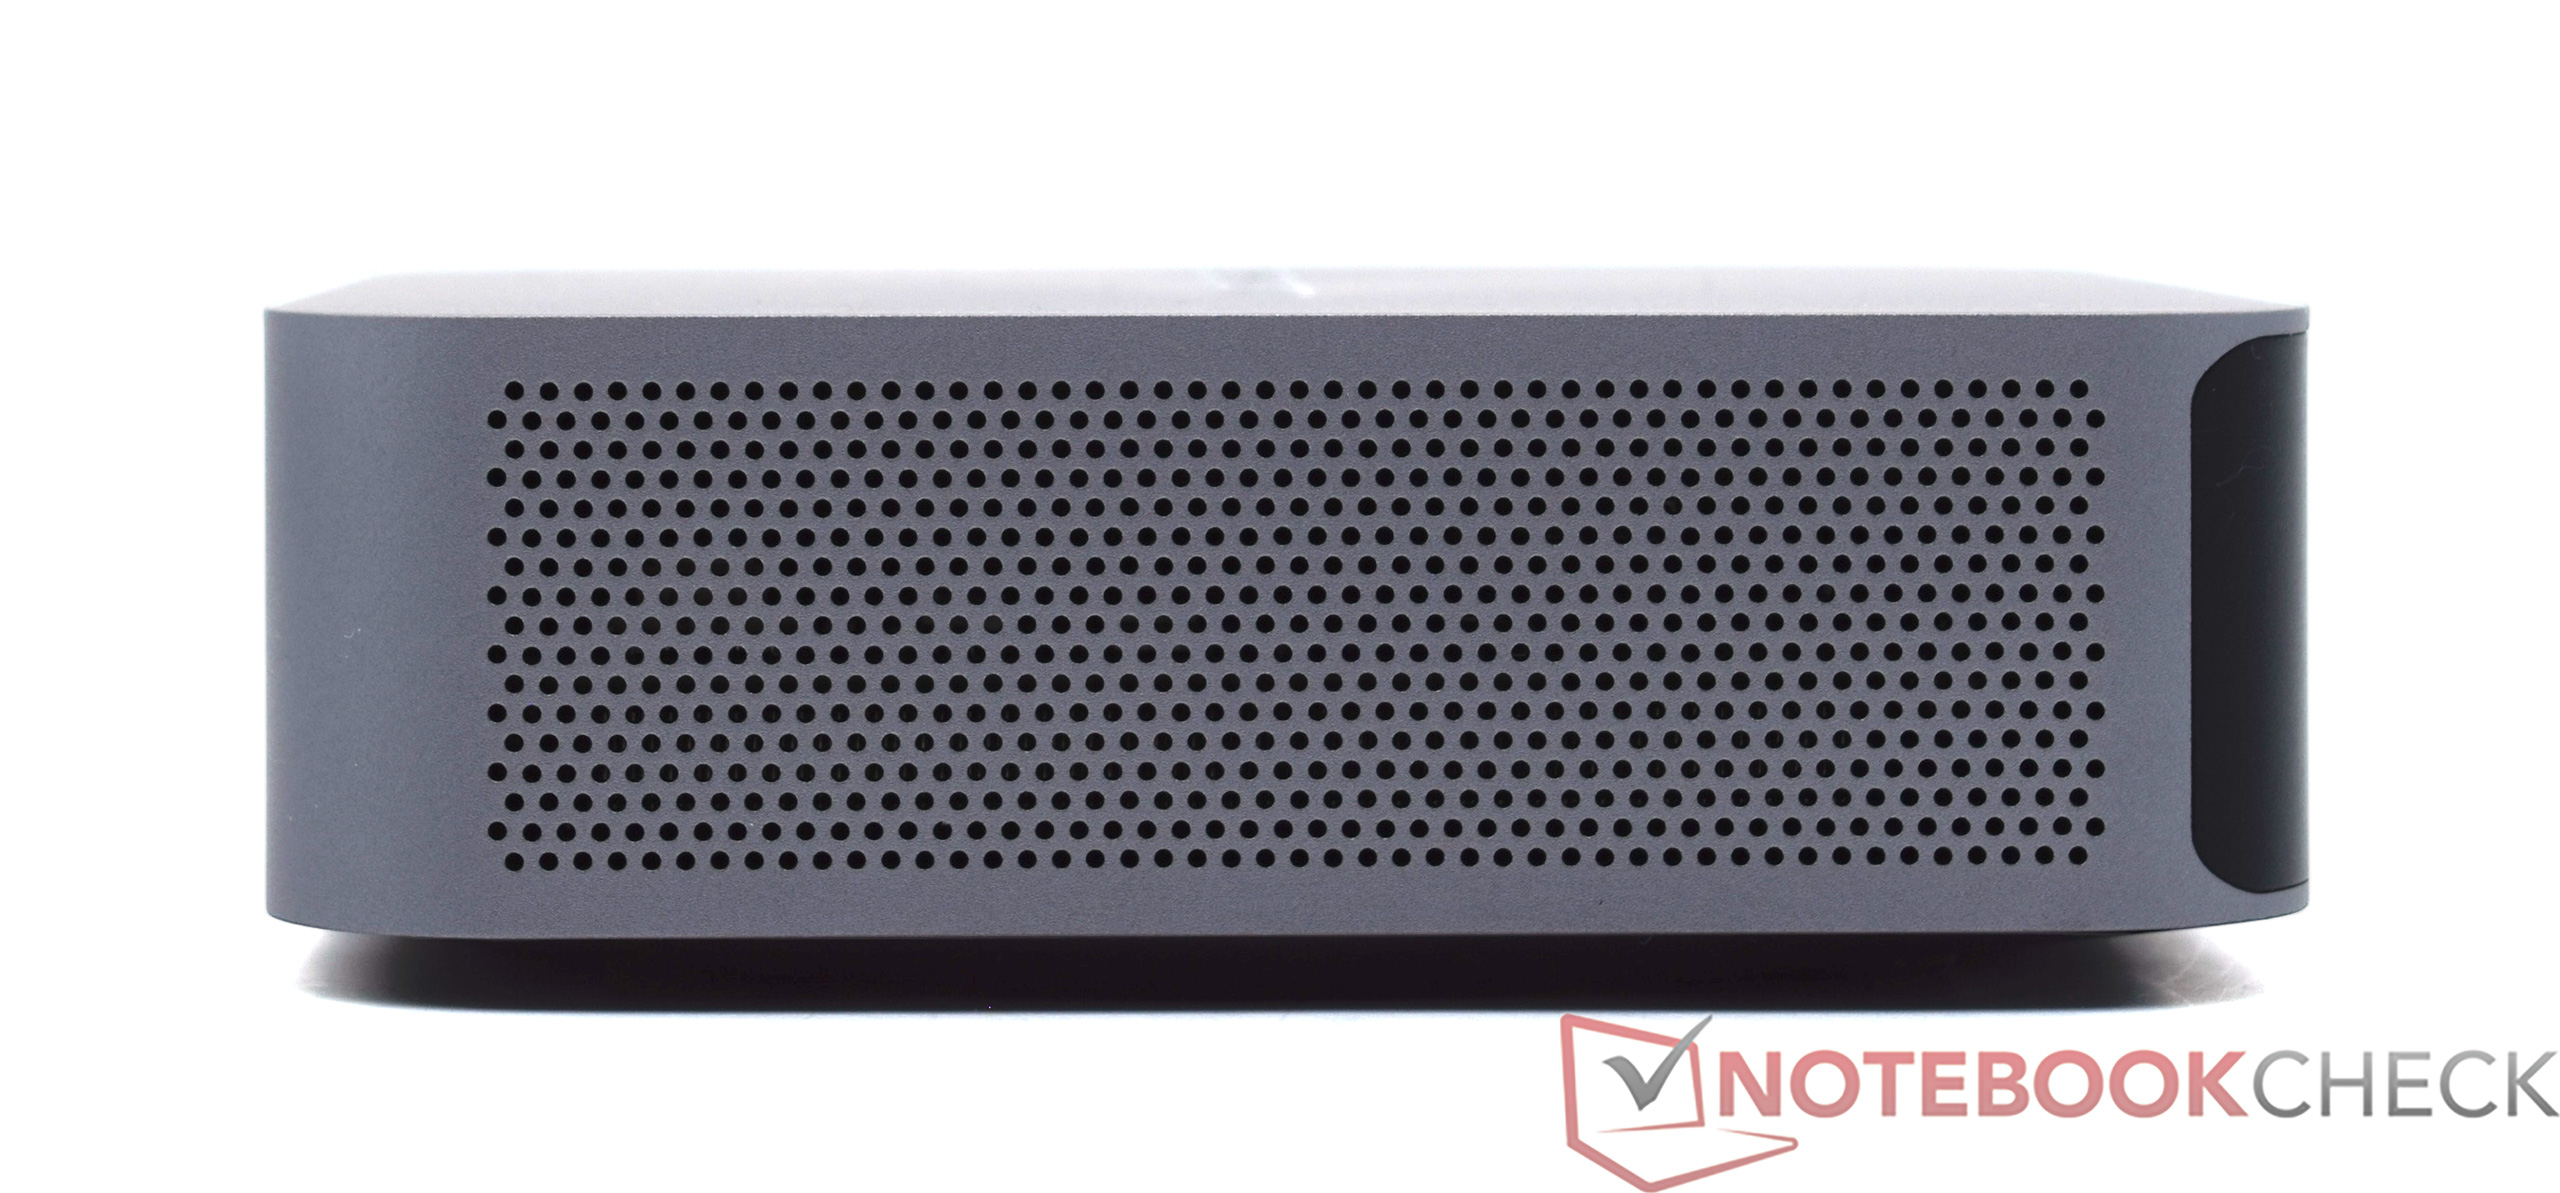
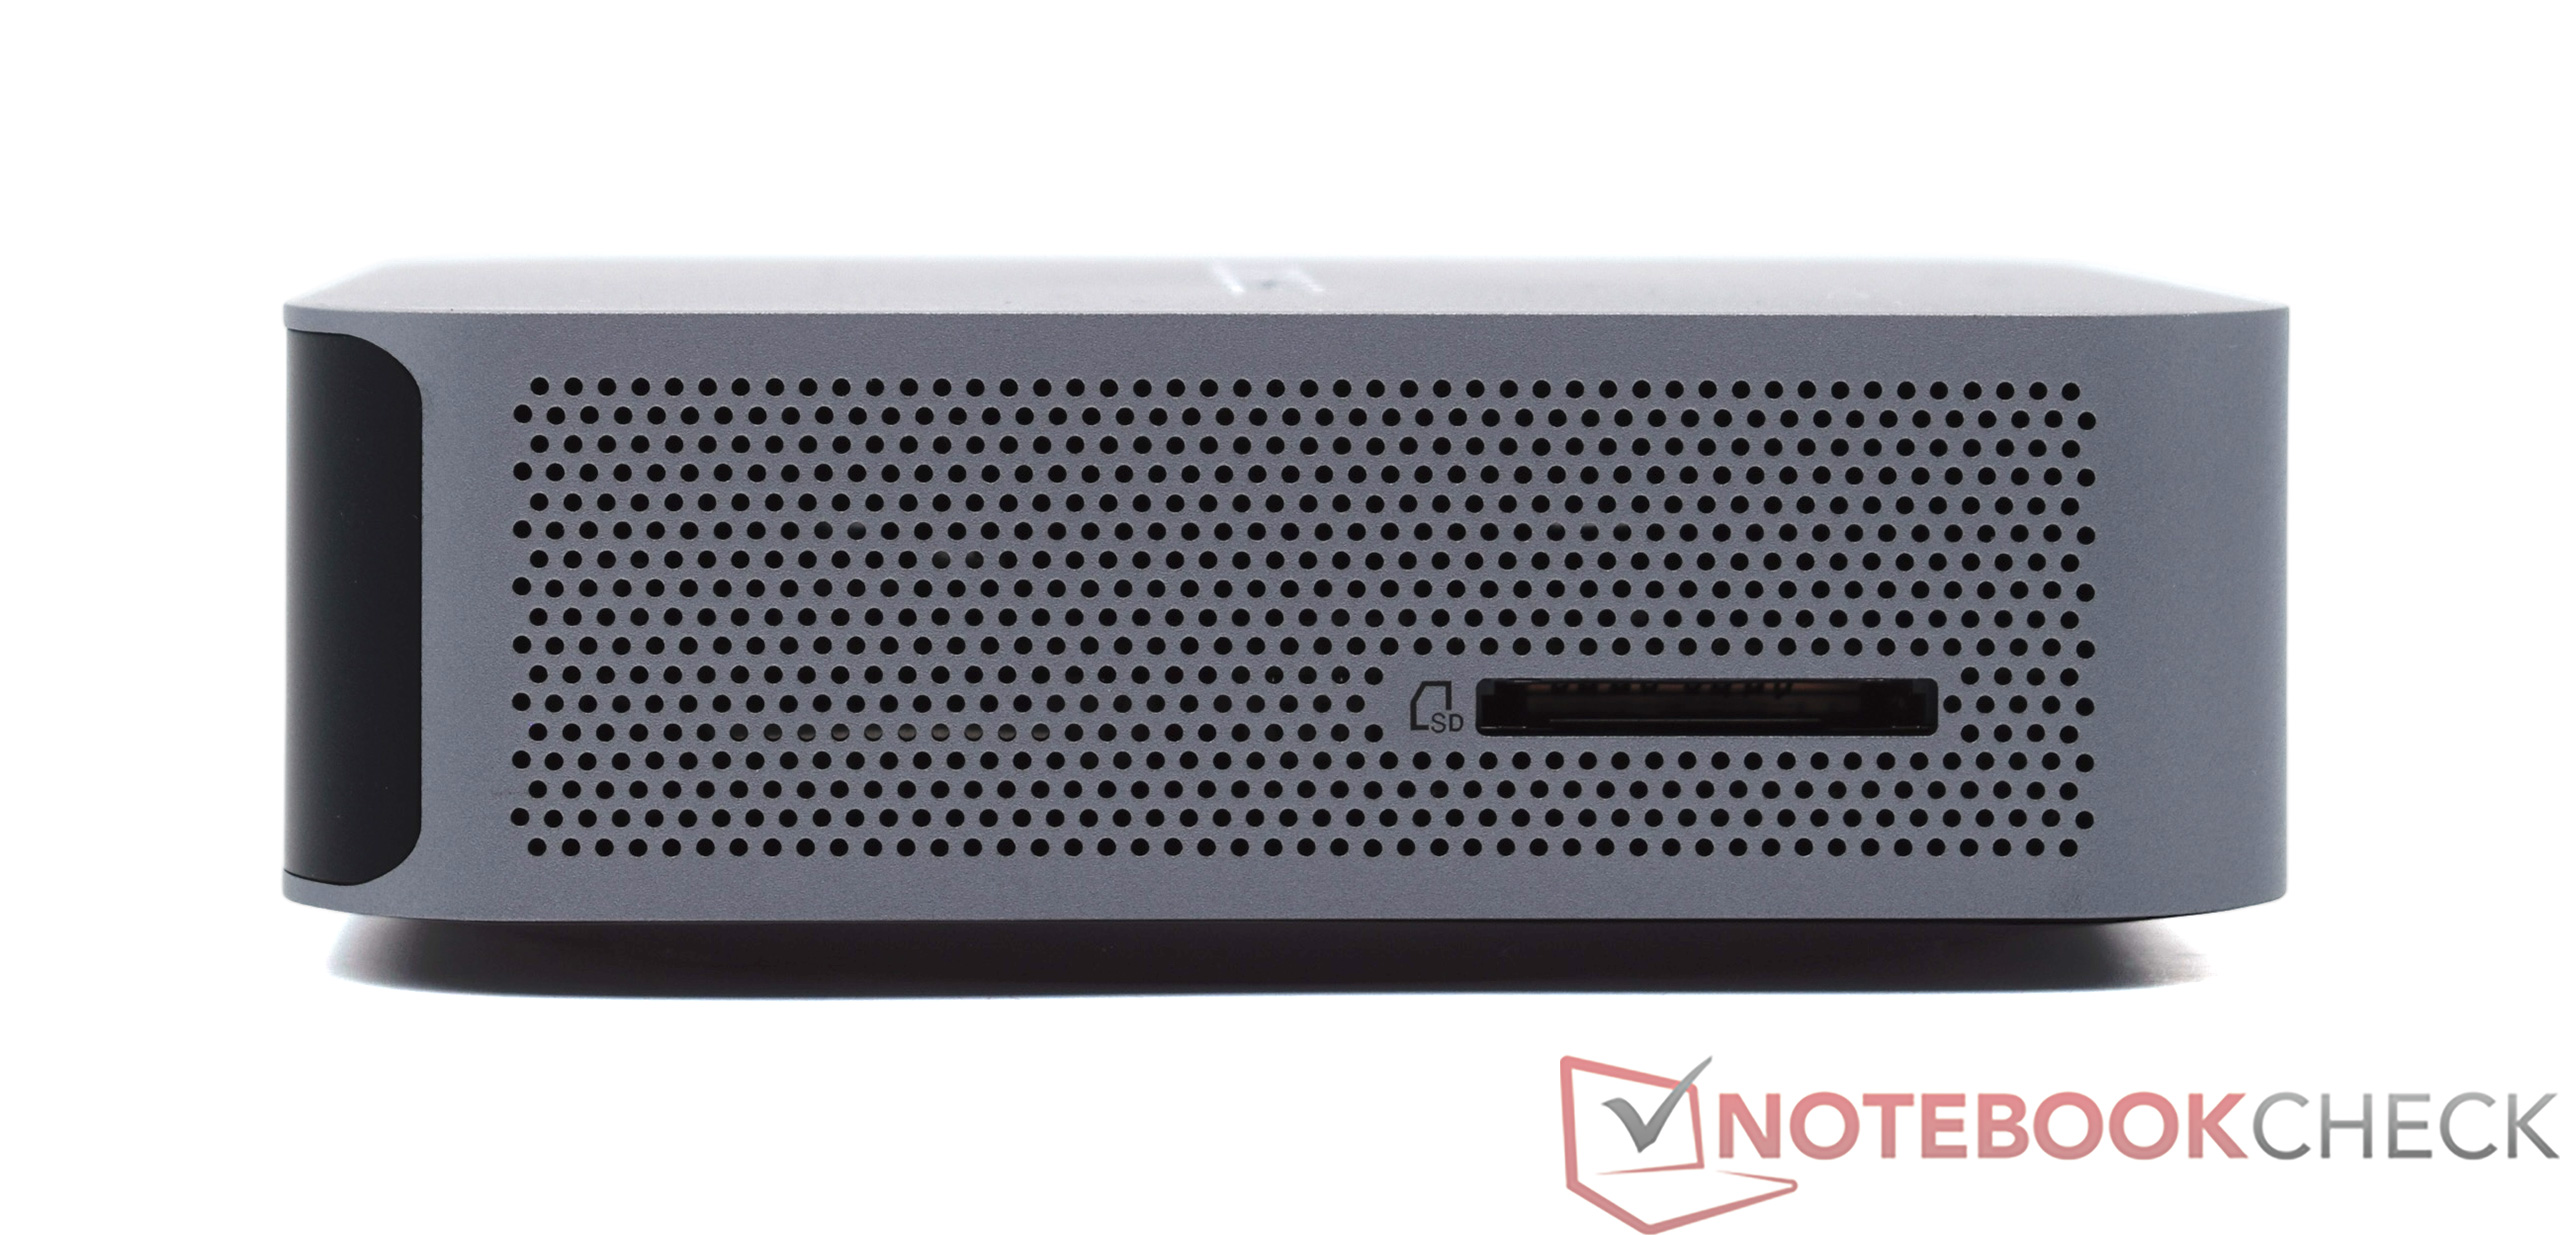
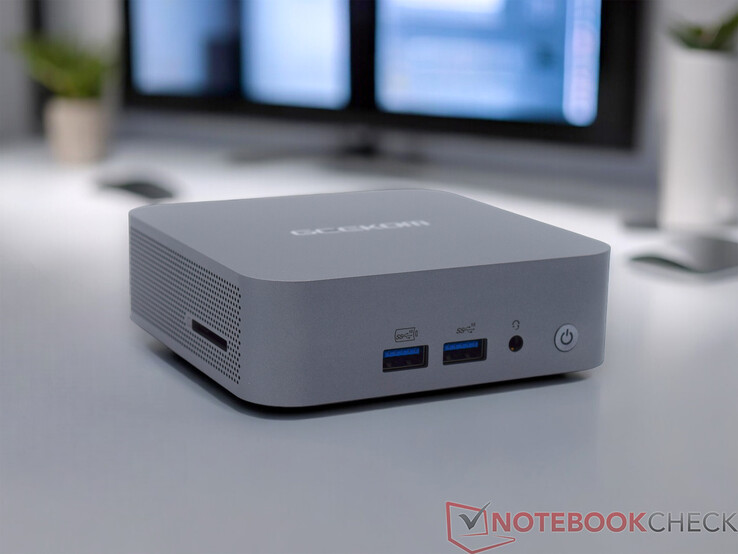
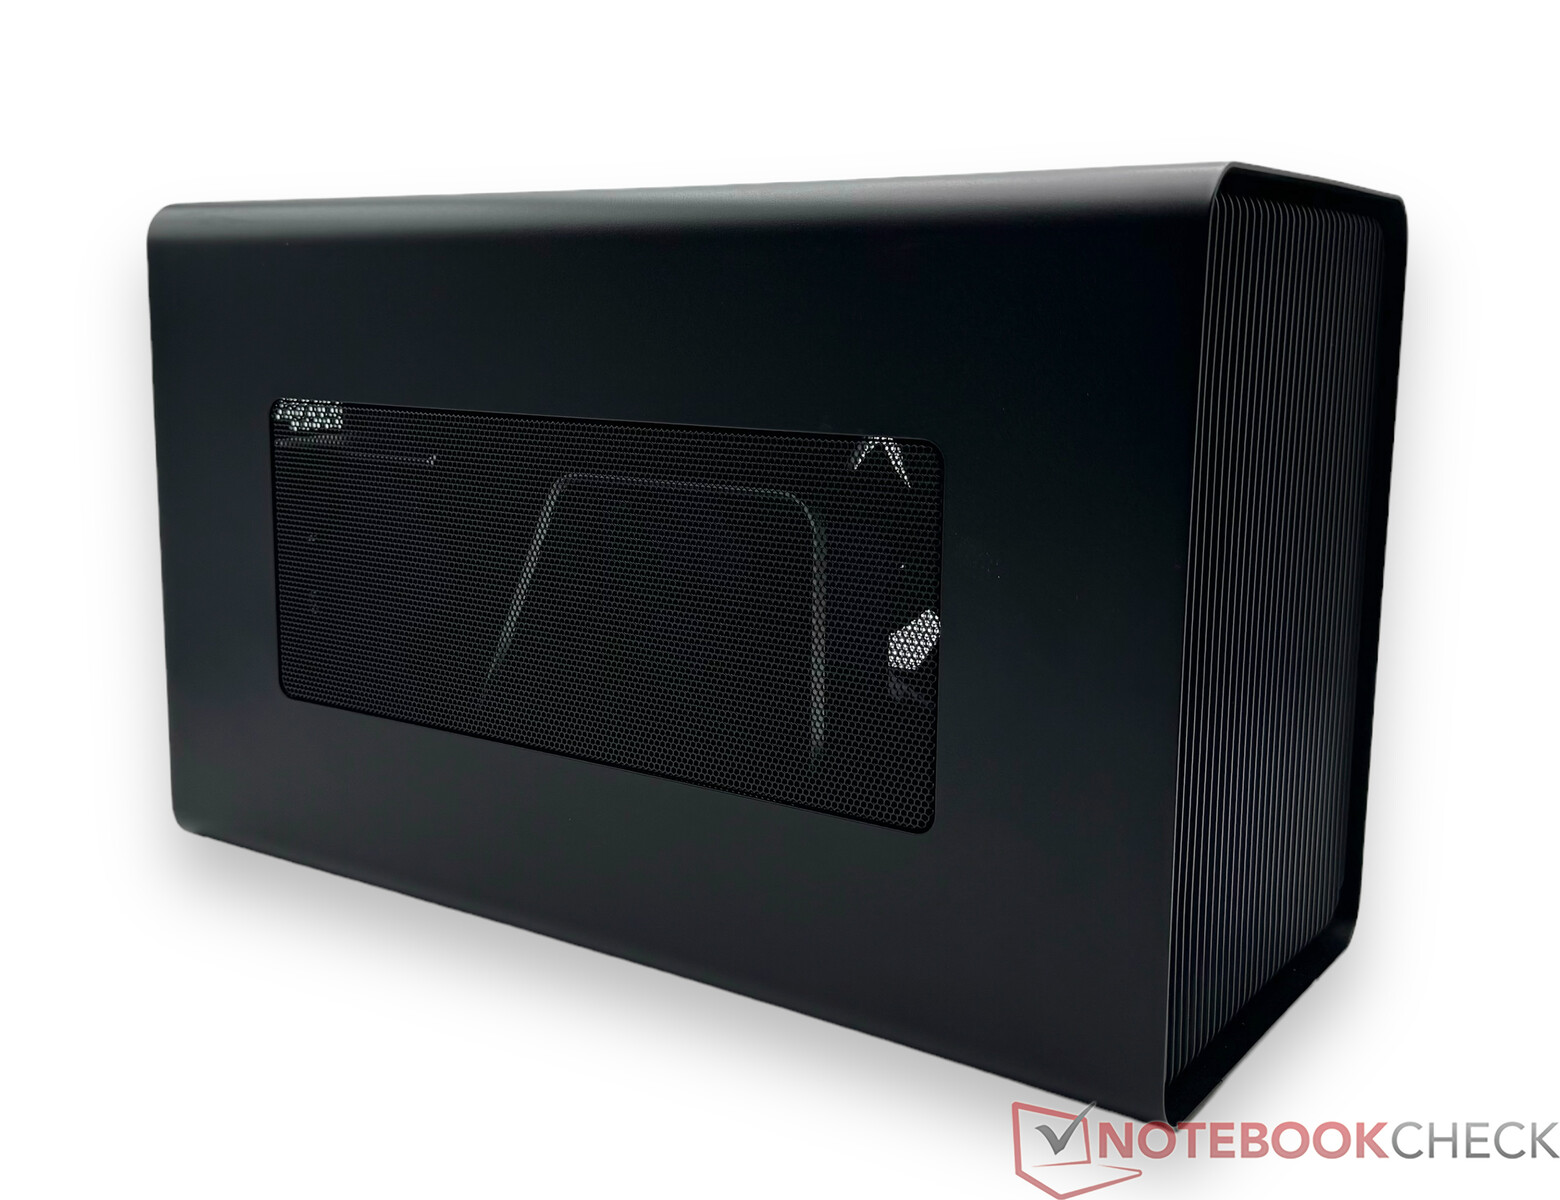
Case - 0.5L housing made of aluminum with a different color
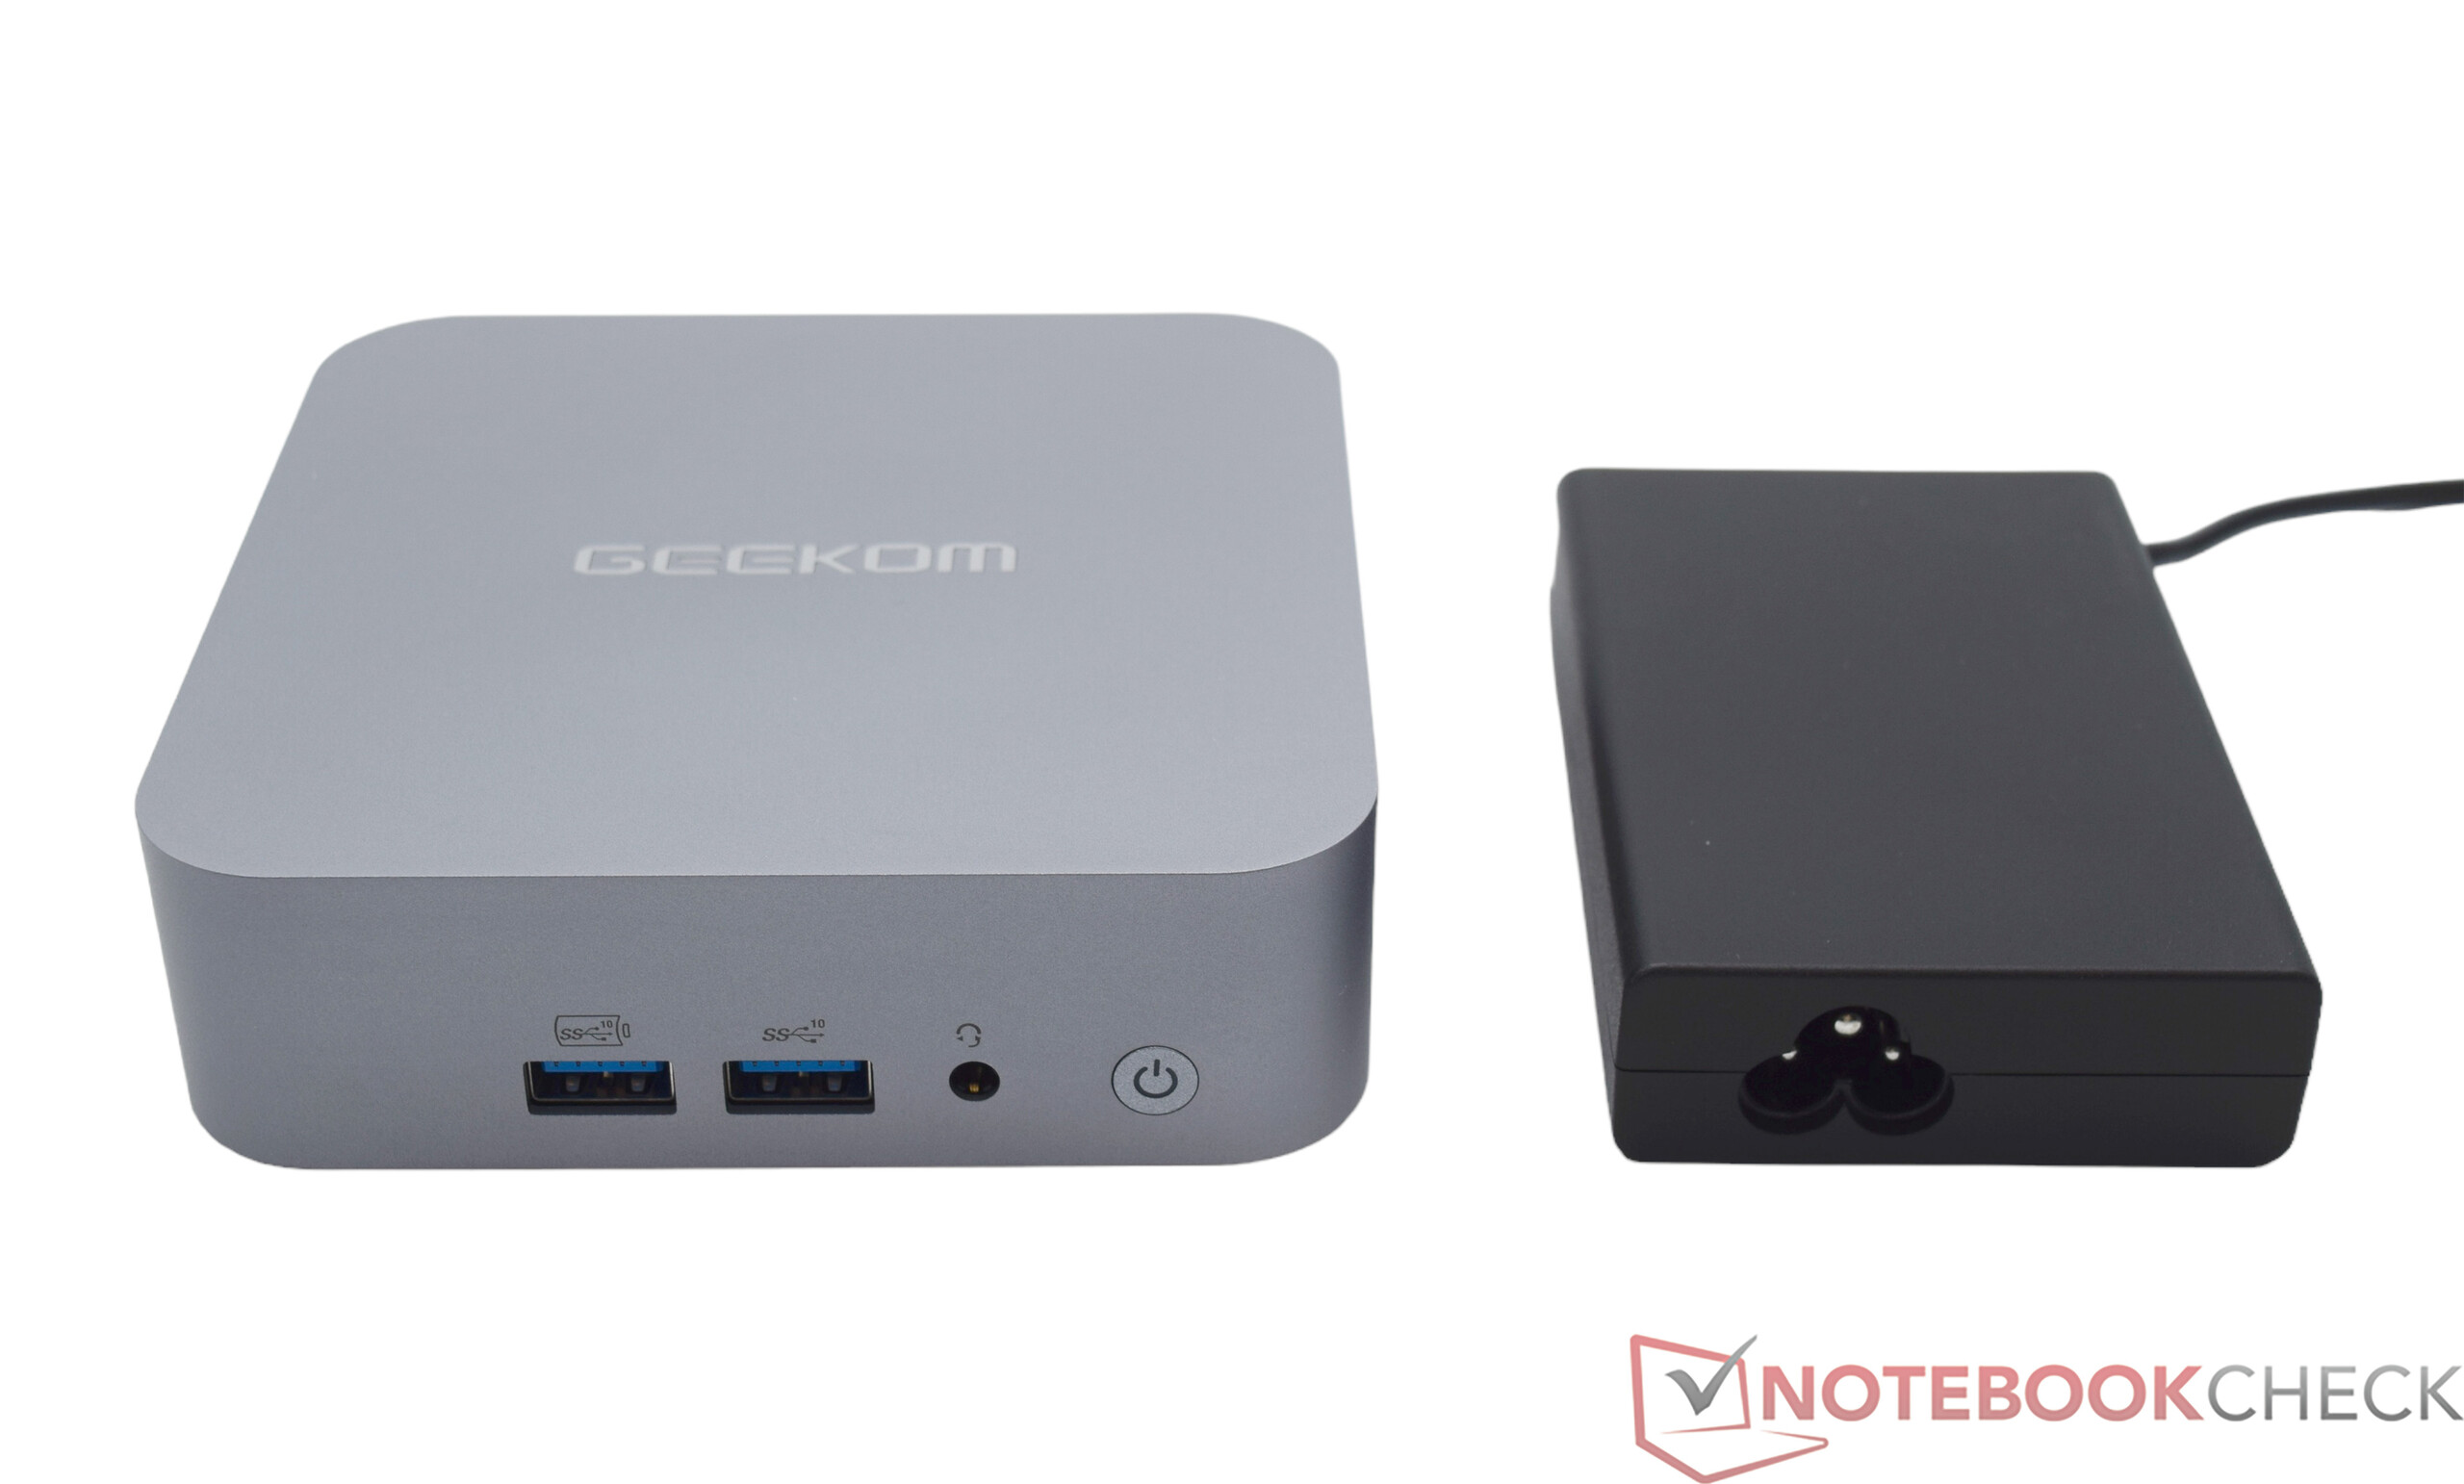
Those who have already read our tests of the Geekom A7 or the Geekom A8, will notice many similarities when looking at the Geekom GT13 Pro. And yes, the devices are similar on the outside. The Geekom GT13 Pro only stands out visually due to its different color scheme. In contrast to the two silver devices, the case of the copied Intel variant is dark gray. Geekom itself calls this color basalt grey. Subjectively, we like the design a little better. Ultimately, the Geekom GT13 Pro shares the same advantages and disadvantages. The excellent workmanship and the choice of materials are certainly arguments in favor of the Geekom device. The mini-PC is also extremely compact in design, which is not necessarily an advantage in terms of the built-in cooling unit. Our test sample weighs only 440 grams and is one of the lightest devices here. The power supply unit weighs a further 249 grams.
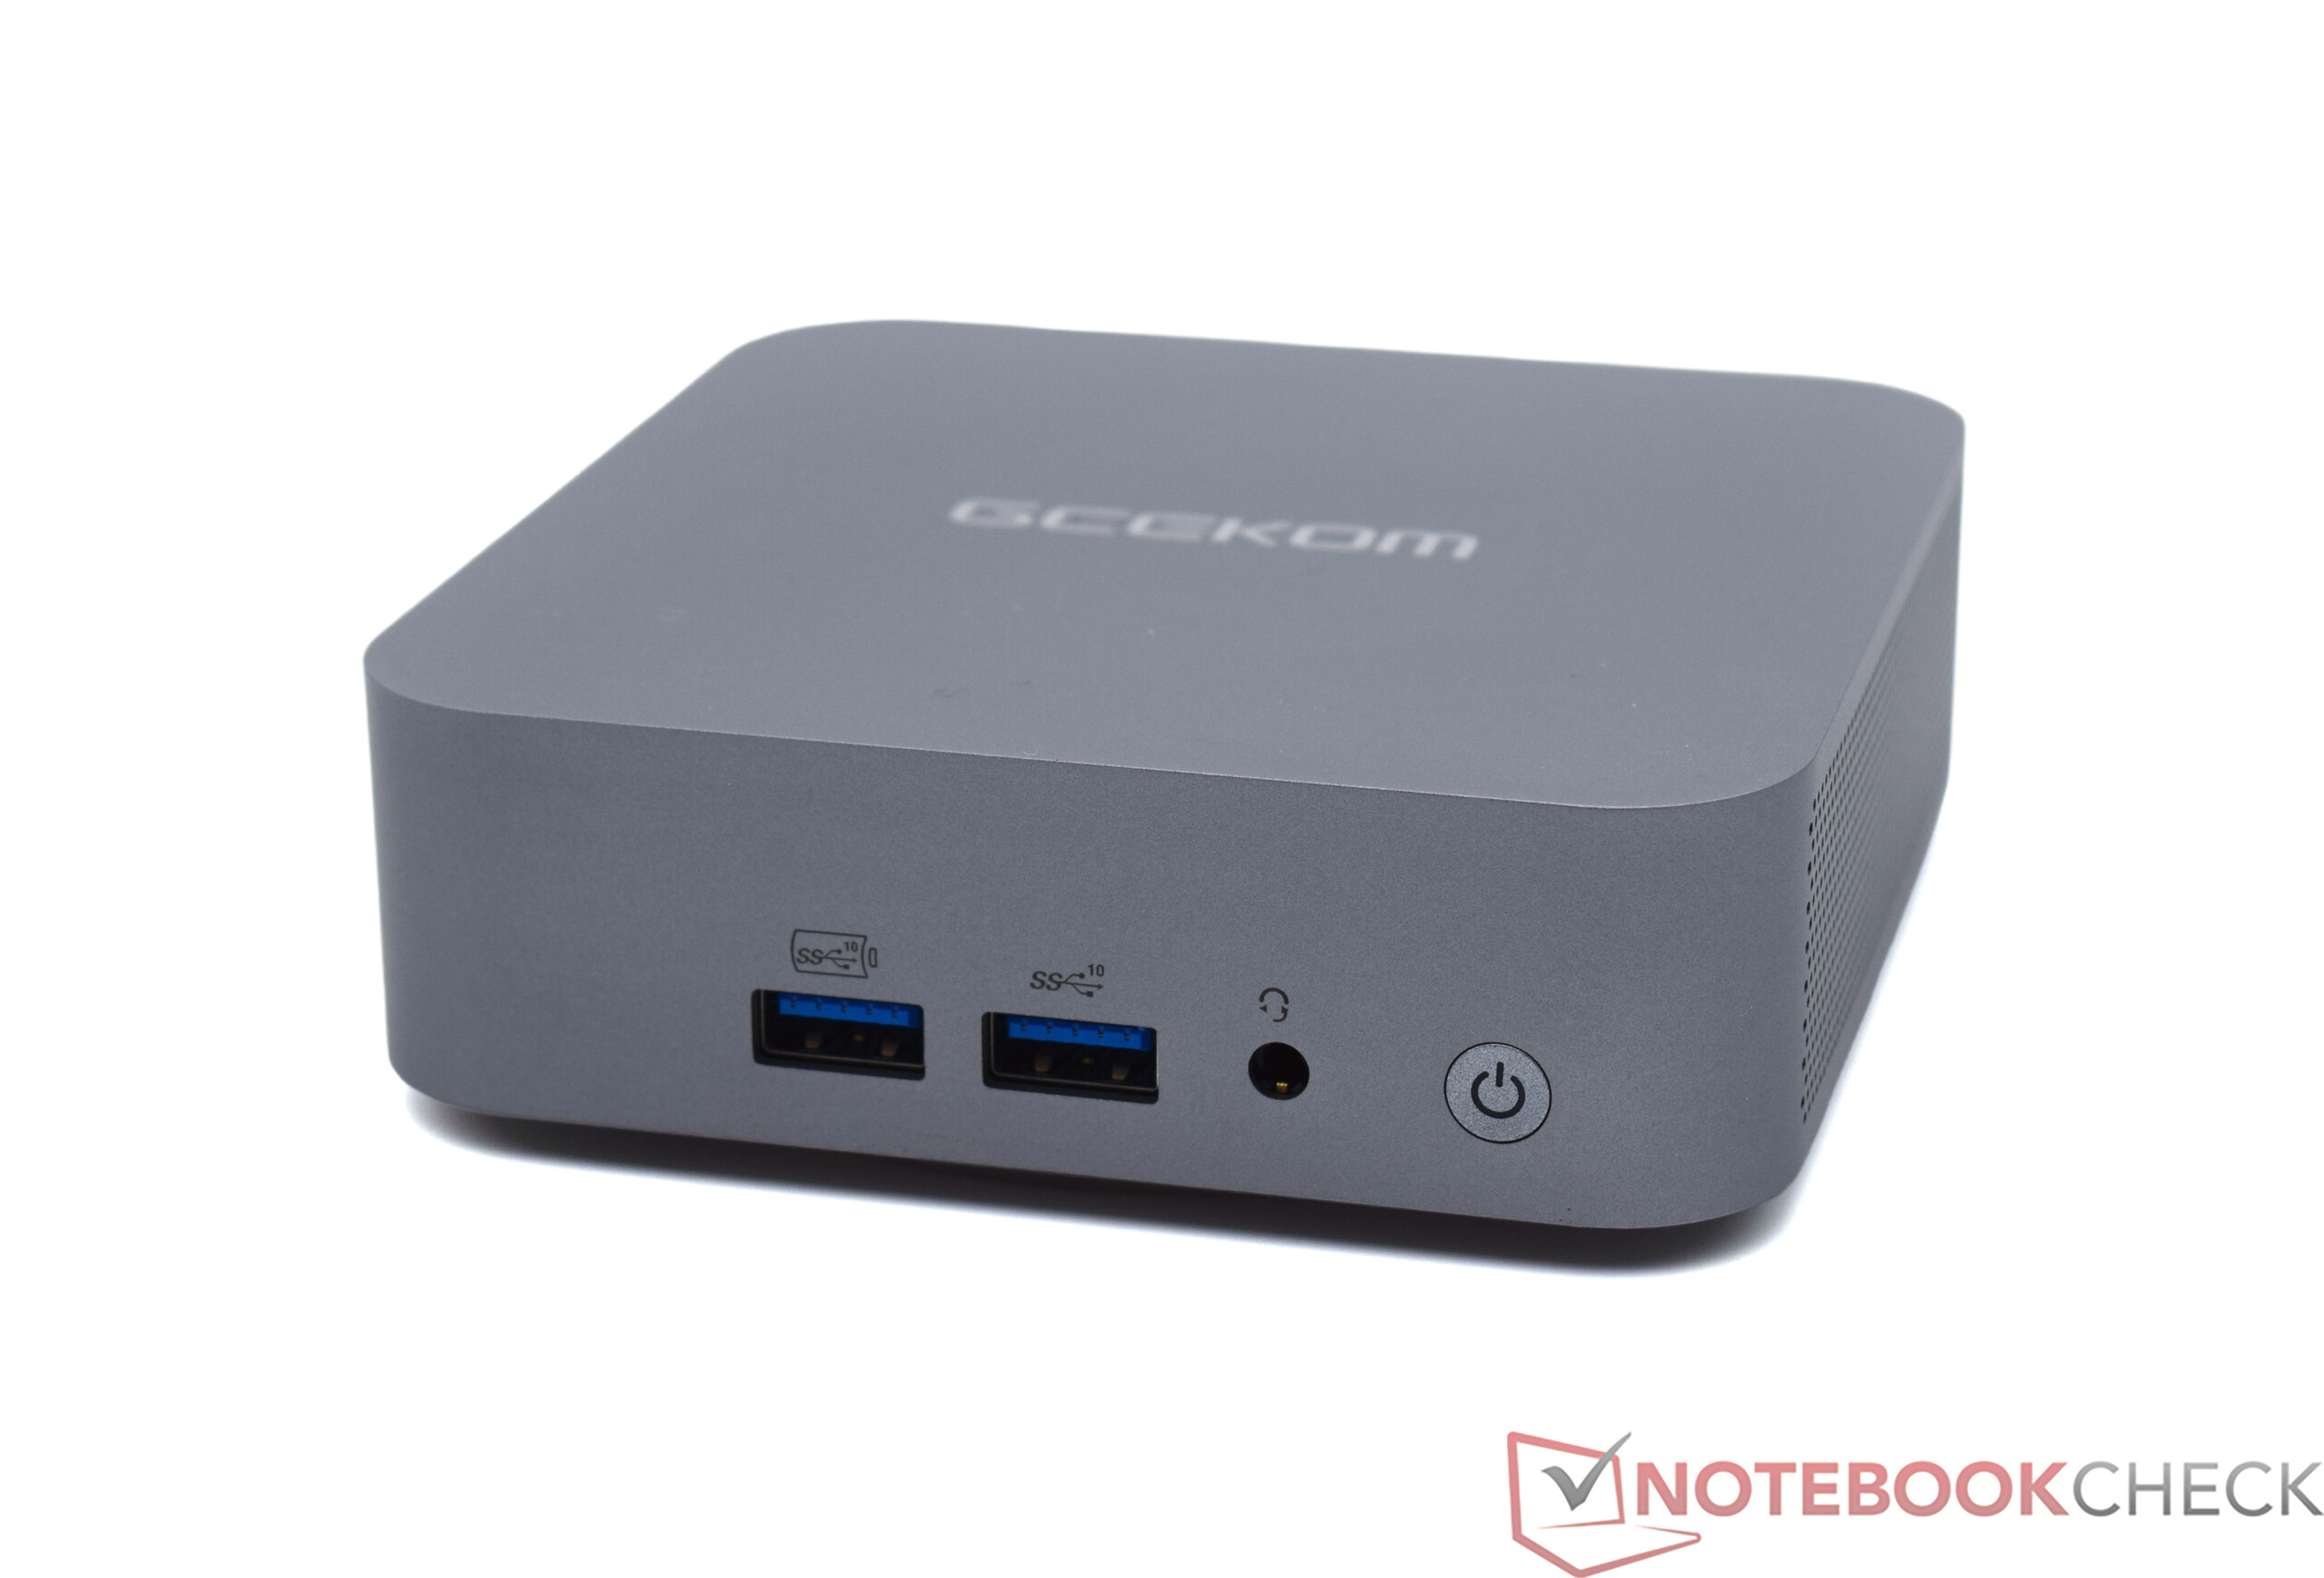
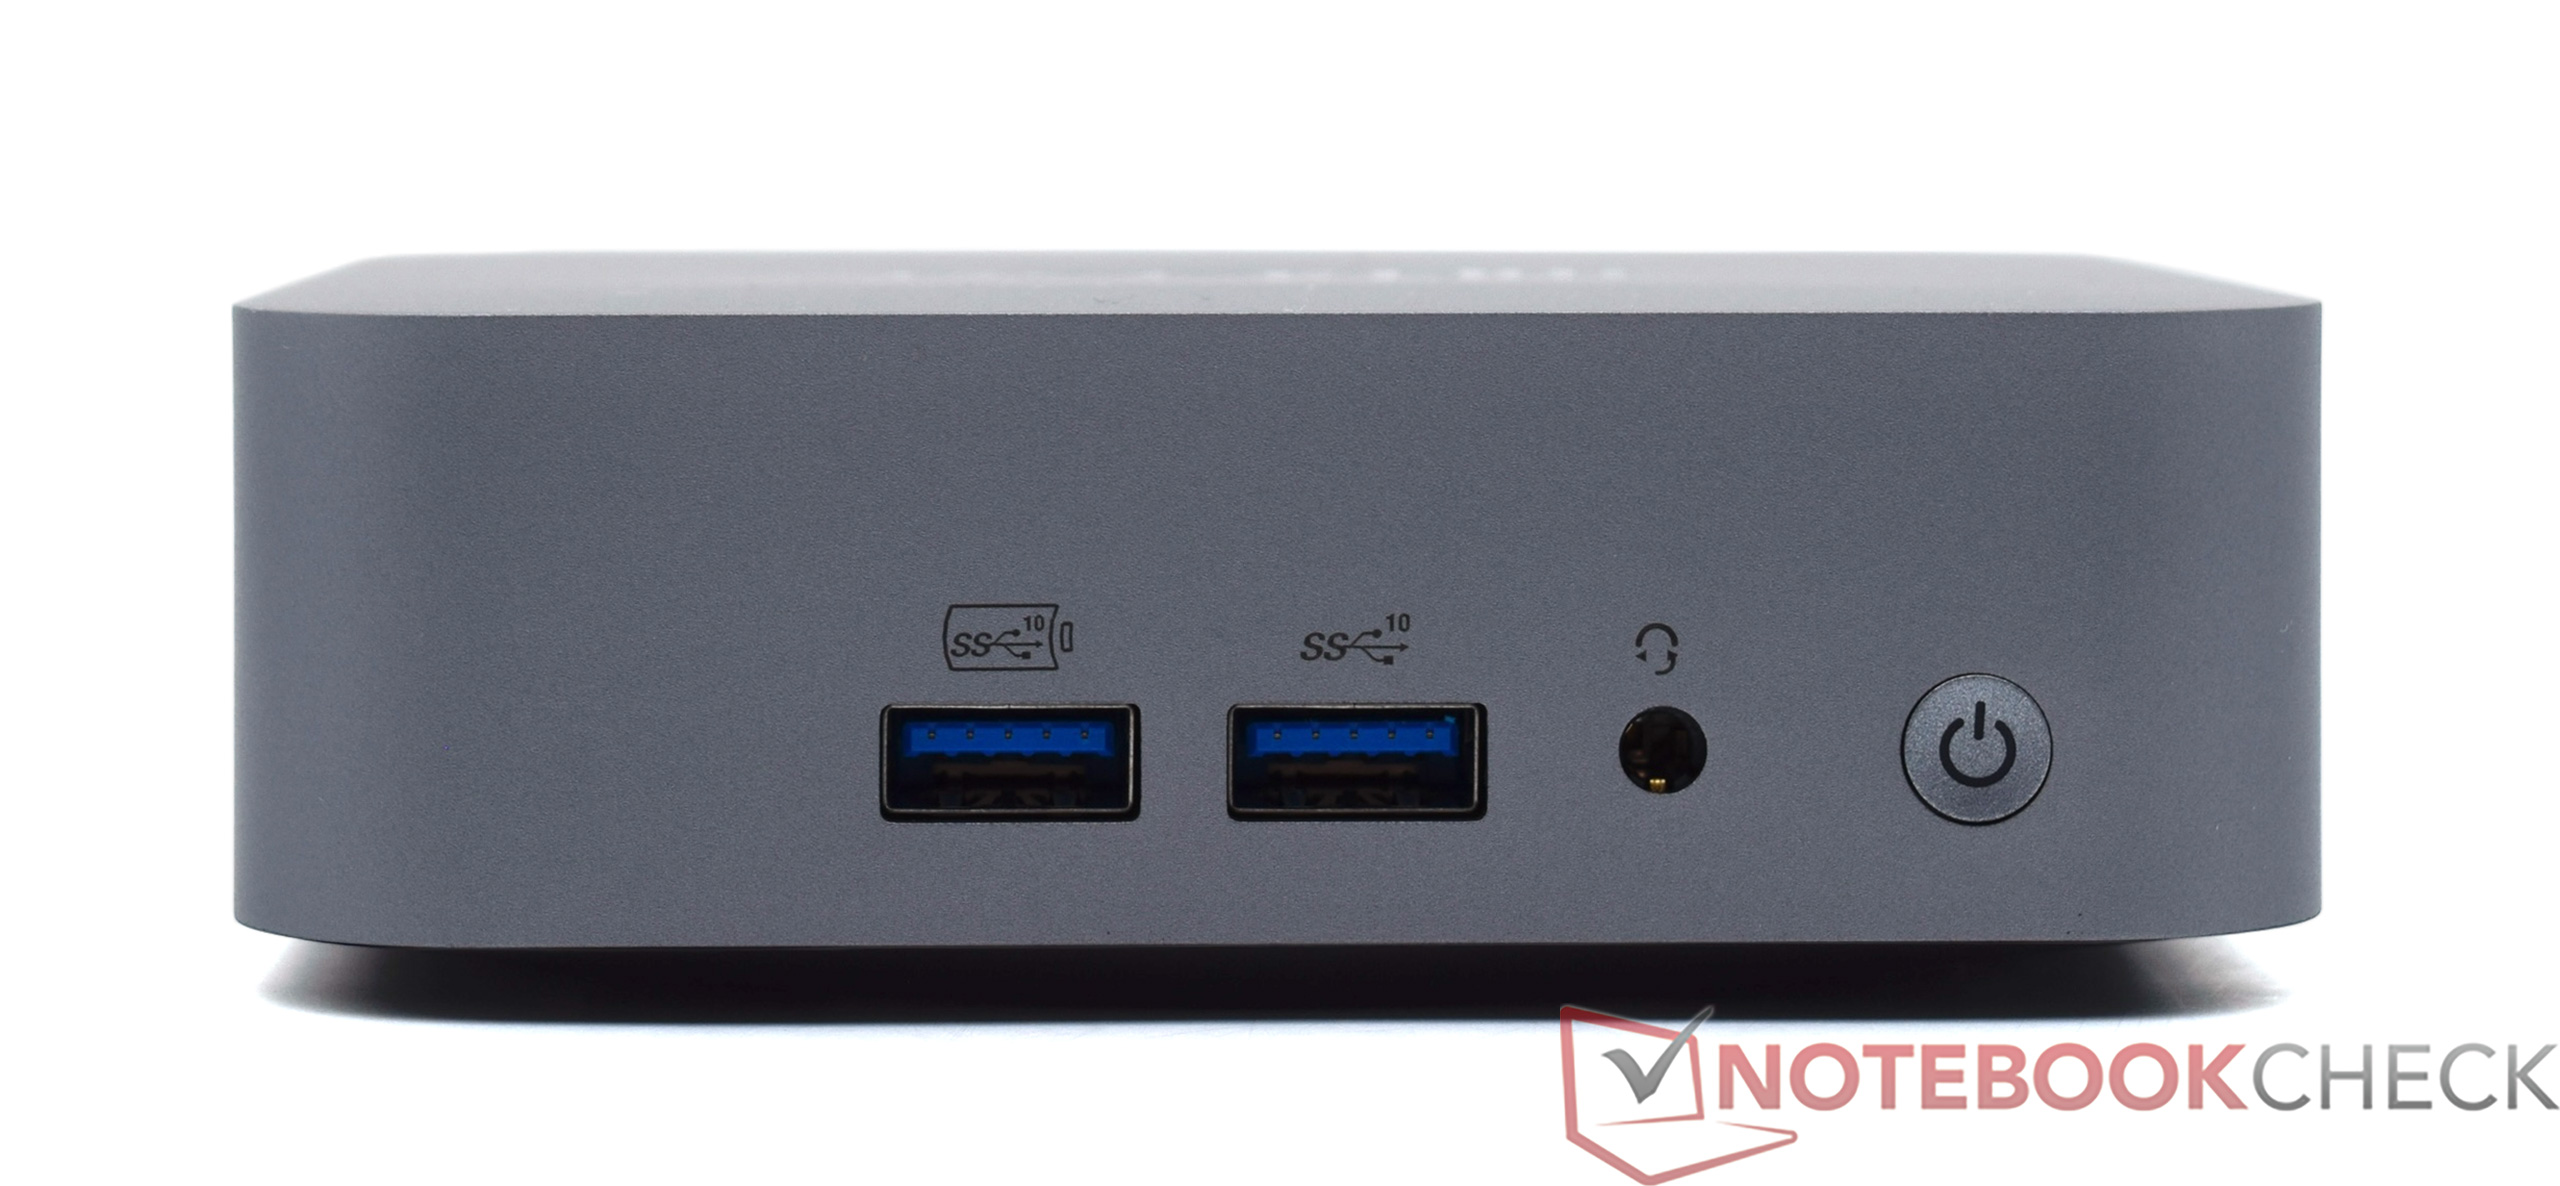
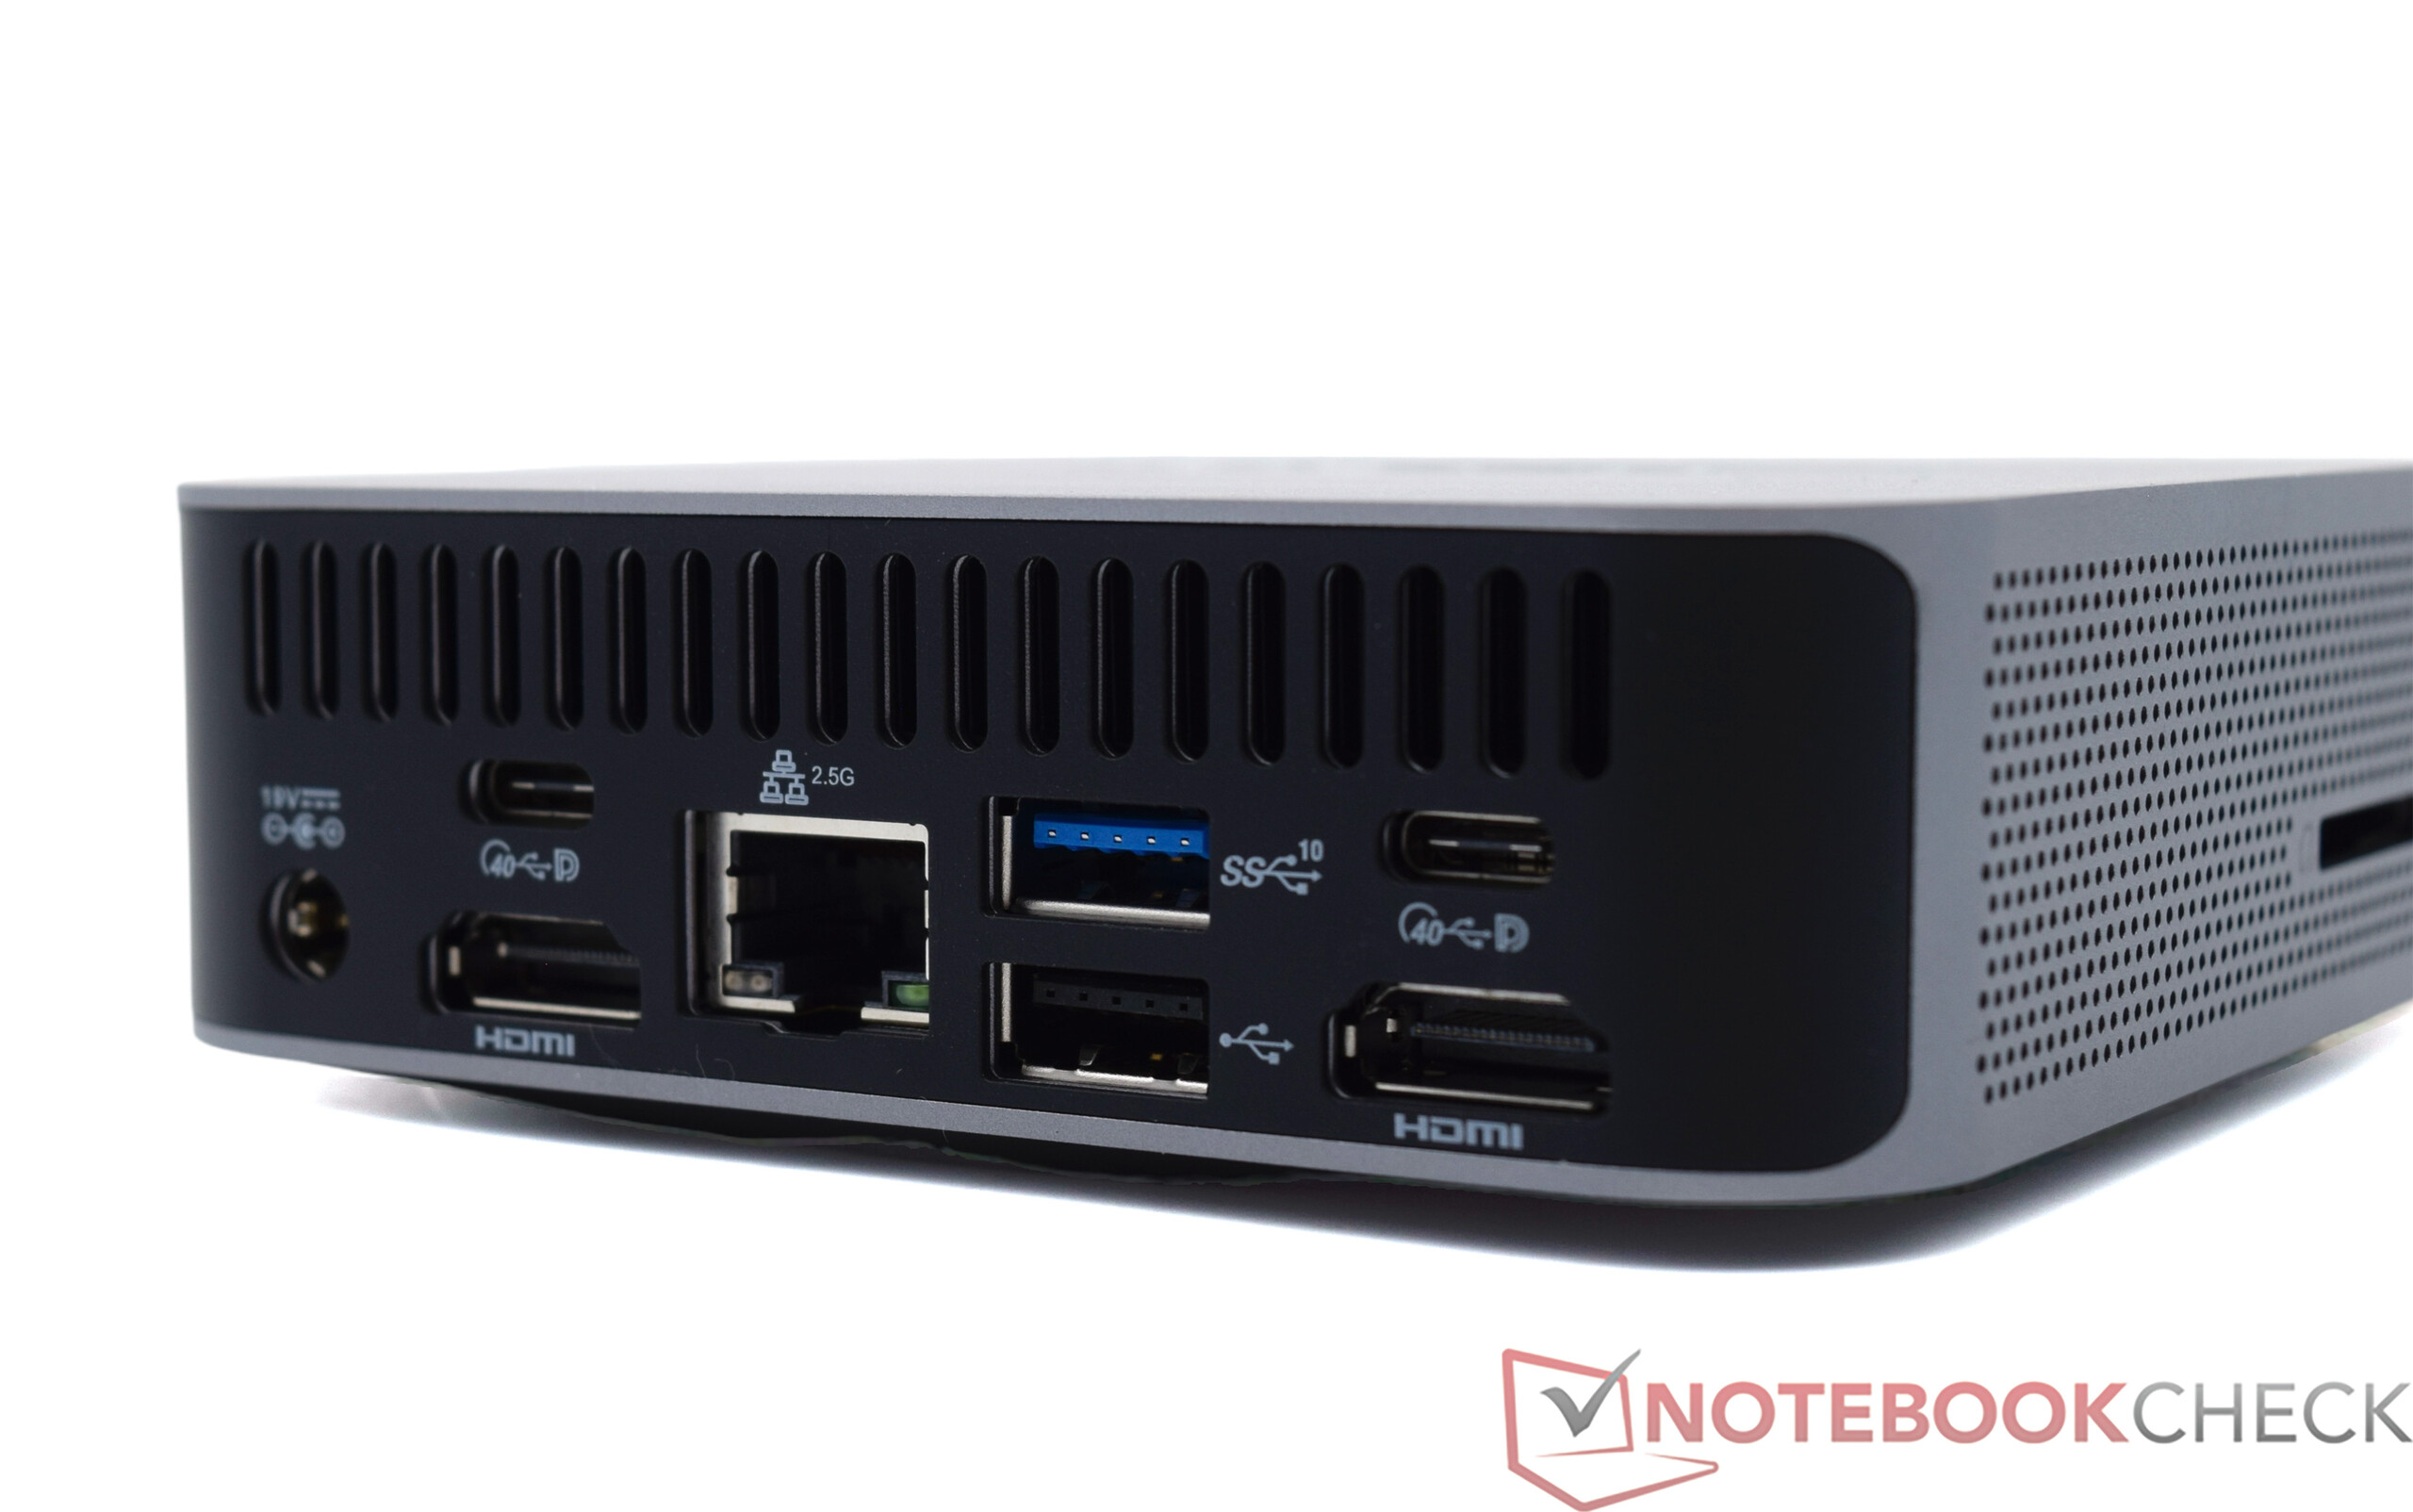
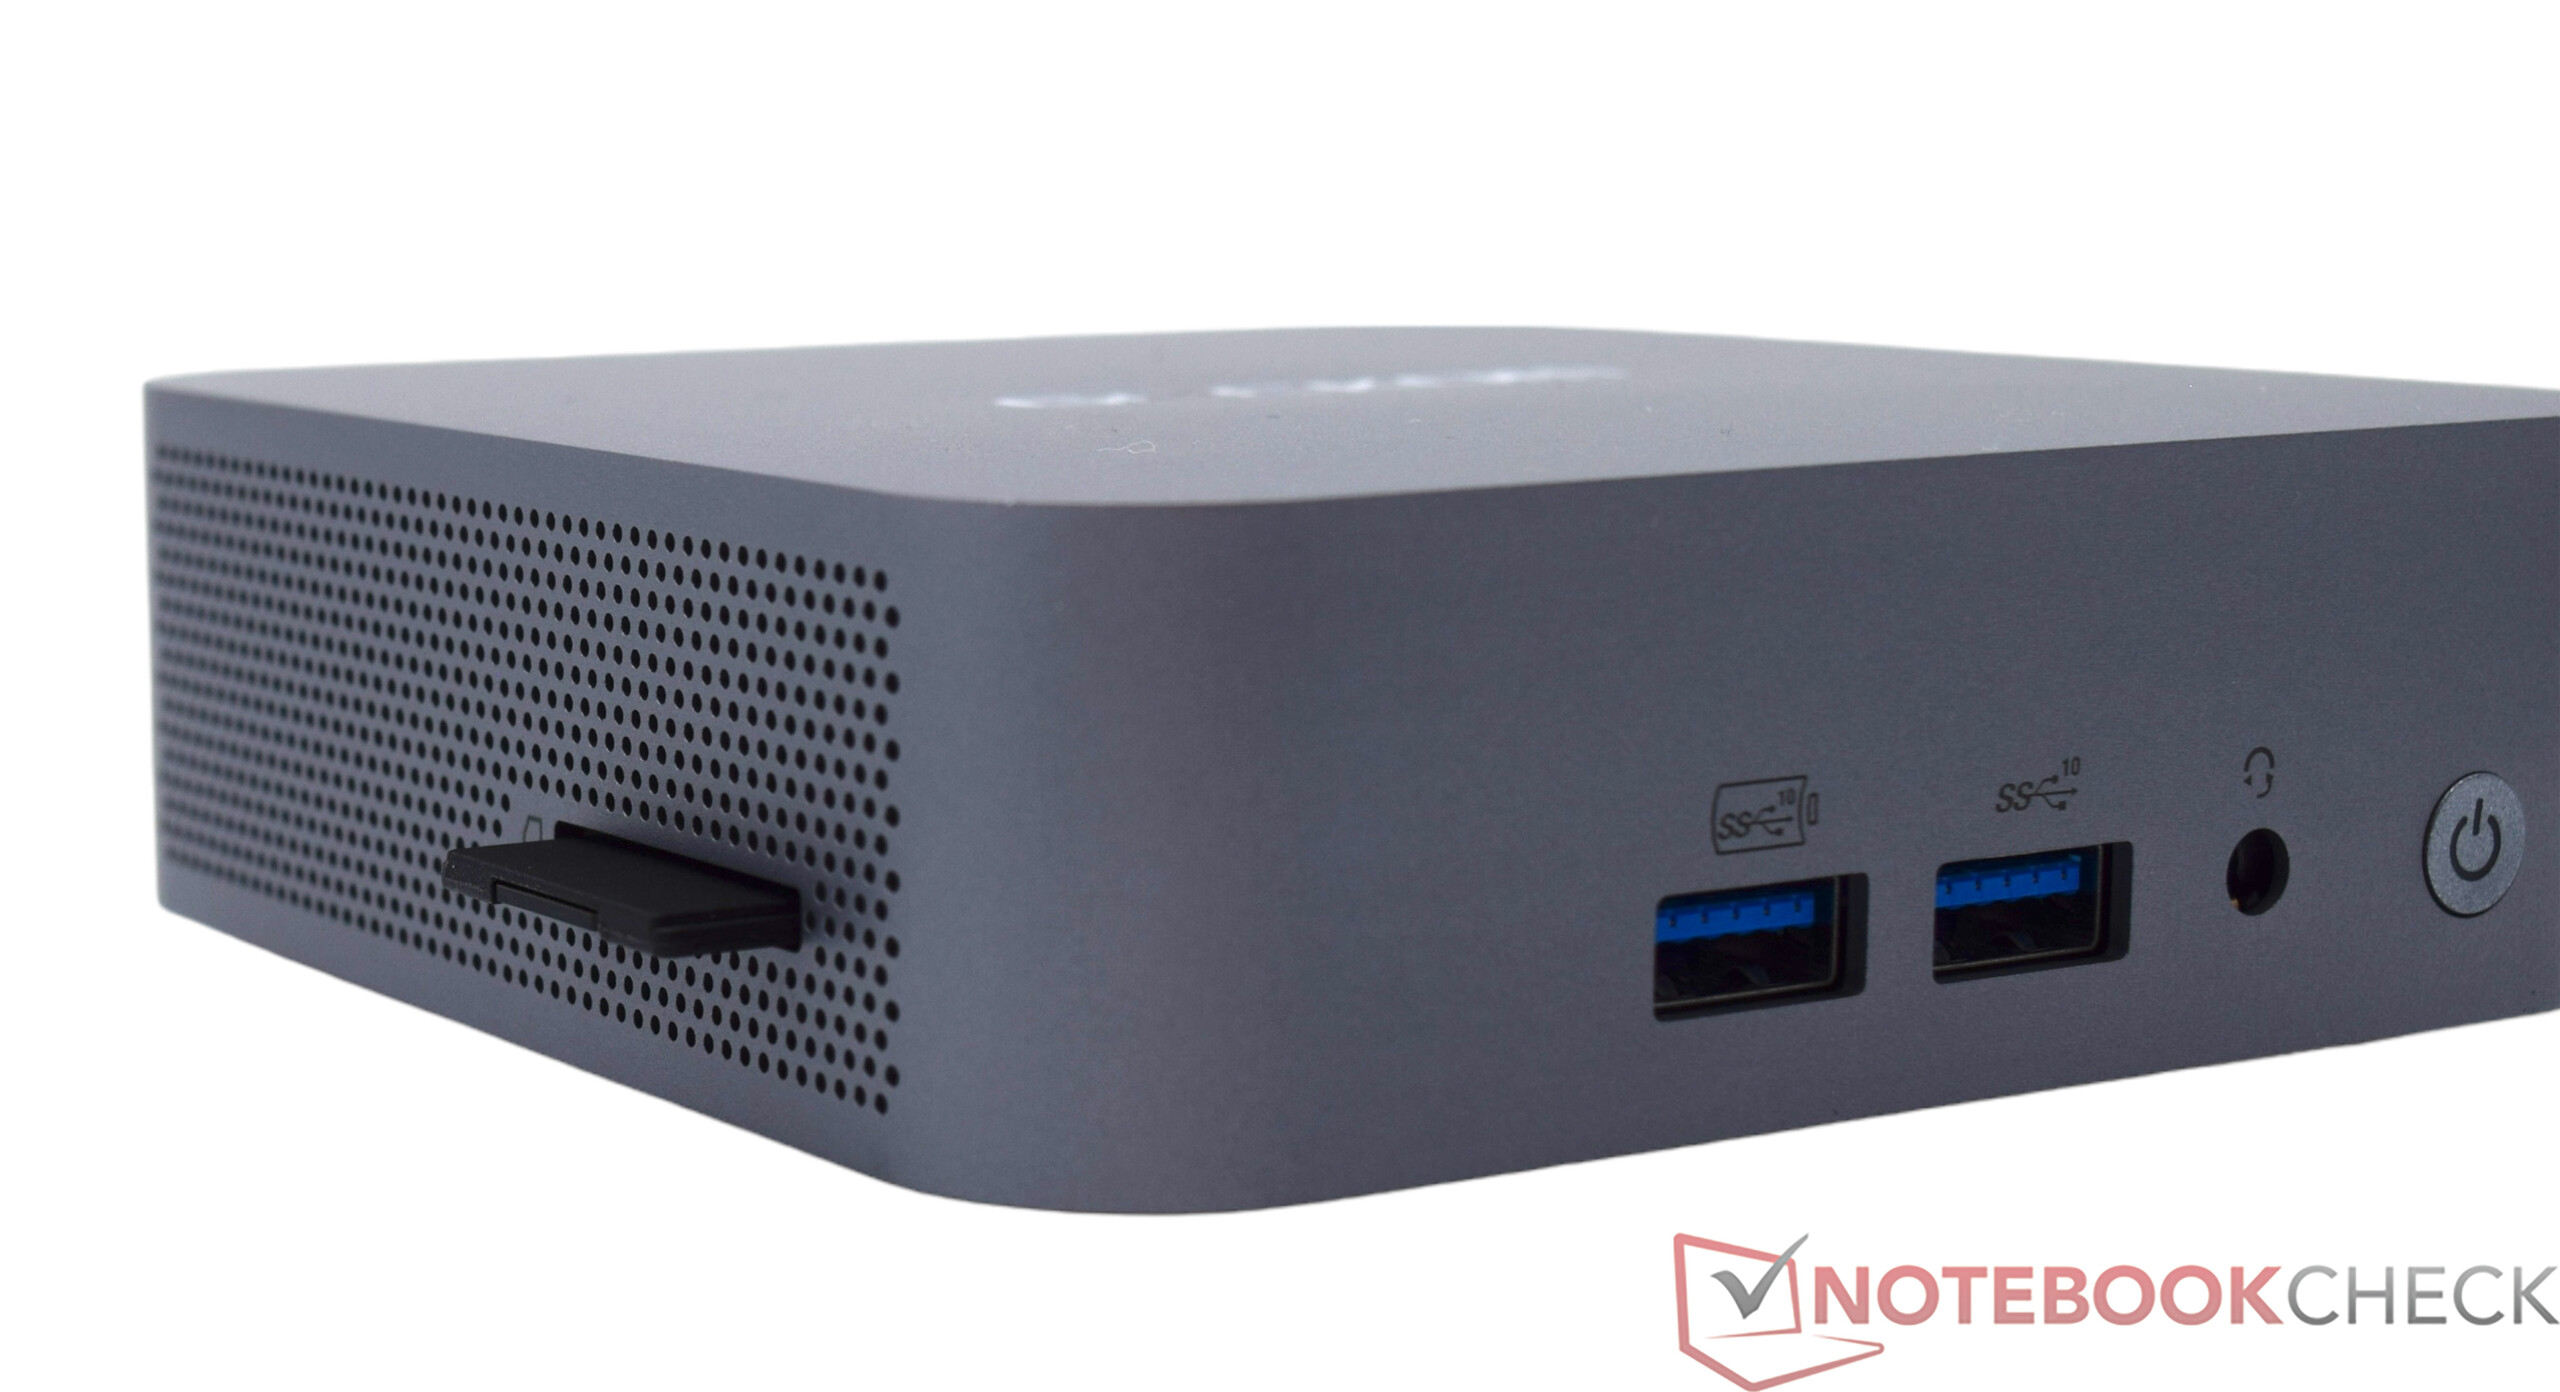
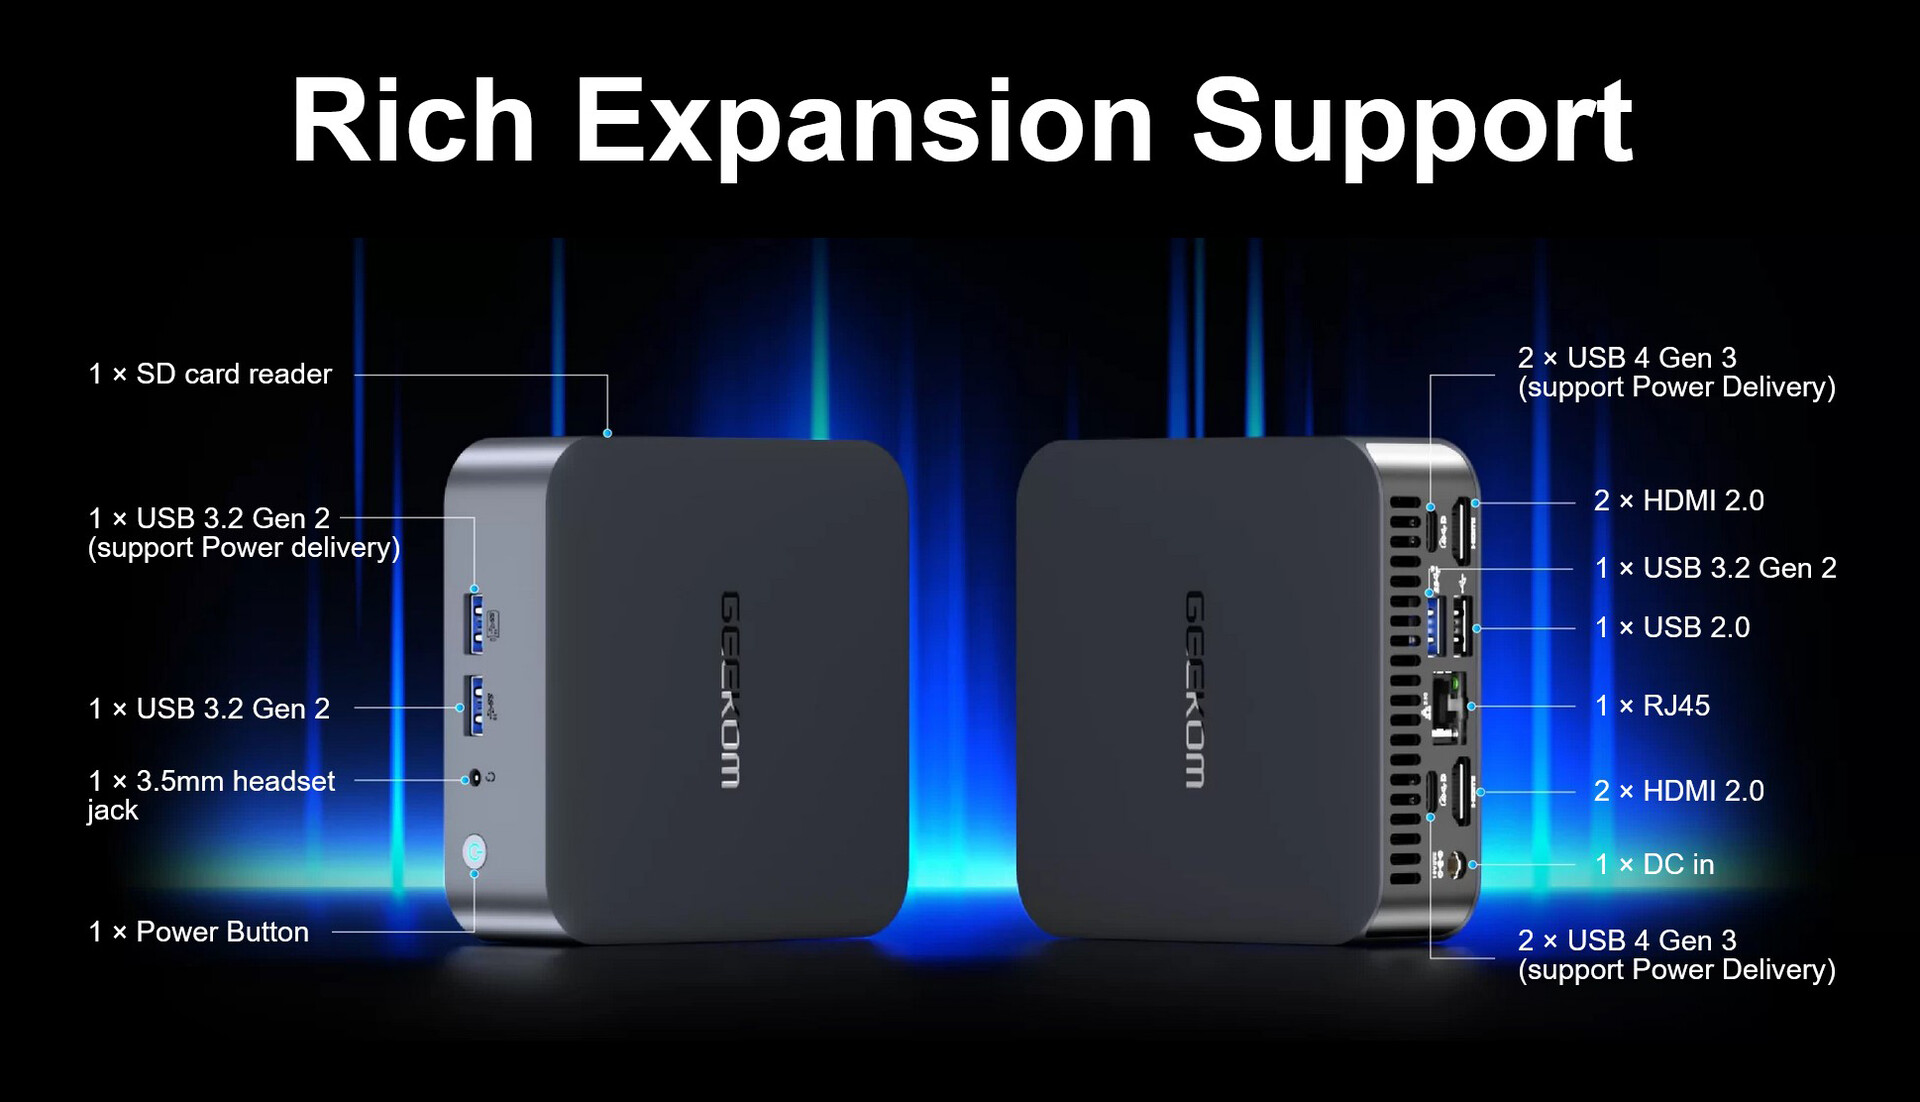
Equipment - Good selection including 2x USB4
We have already seen many times that Geekom offers many connectivity options despite its extremely compact design. The Geekom GT13 Pro is no exception and offers many external connectivity options. Four USB-A ports are sufficient in number, especially as there are two more modern interfaces with USB4, which can be used to expand the mini-PC's range of applications enormously. We will also take another look at the performance with an external graphics card. The Geekom GT13 Pro can handle up to four 4K displays at the same time. It is also possible to control an 8K display. The fast SD card reader, which is located on the left-hand side, should not be forgotten and should be highlighted positively.
| SD Card Reader | |
| average JPG Copy Test (av. of 3 runs) | |
| Khadas Mind (AV Pro SD microSD 128 GB V60) | |
| Geekom A5 (AV Pro SD microSD 128 GB V60) | |
| Geekom A8 (AV Pro SD microSD 128 GB V60) | |
| Geekom GT13 Pro (AV Pro SD microSD 128 GB V60) | |
| Geekom Mini IT13 | |
| Geekom Mini IT12 (AV Pro SD microSD 128 GB V60) | |
| Average of class Mini PC (15.1 - 181.8, n=21, last 2 years) | |
| Zotac ZBOX Magnus EN173070C (AV Pro SD microSD 128 GB V60) | |
| maximum AS SSD Seq Read Test (1GB) | |
| Khadas Mind (AV Pro SD microSD 128 GB V60) | |
| Geekom A8 (AV Pro SD microSD 128 GB V60) | |
| Geekom A5 (AV Pro SD microSD 128 GB V60) | |
| Geekom Mini IT13 | |
| Geekom GT13 Pro (AV Pro SD microSD 128 GB V60) | |
| Geekom Mini IT12 (AV Pro SD microSD 128 GB V60) | |
| Average of class Mini PC (18.2 - 200, n=21, last 2 years) | |
| Zotac ZBOX Magnus EN173070C (AV Pro SD microSD 128 GB V60) | |
Communication
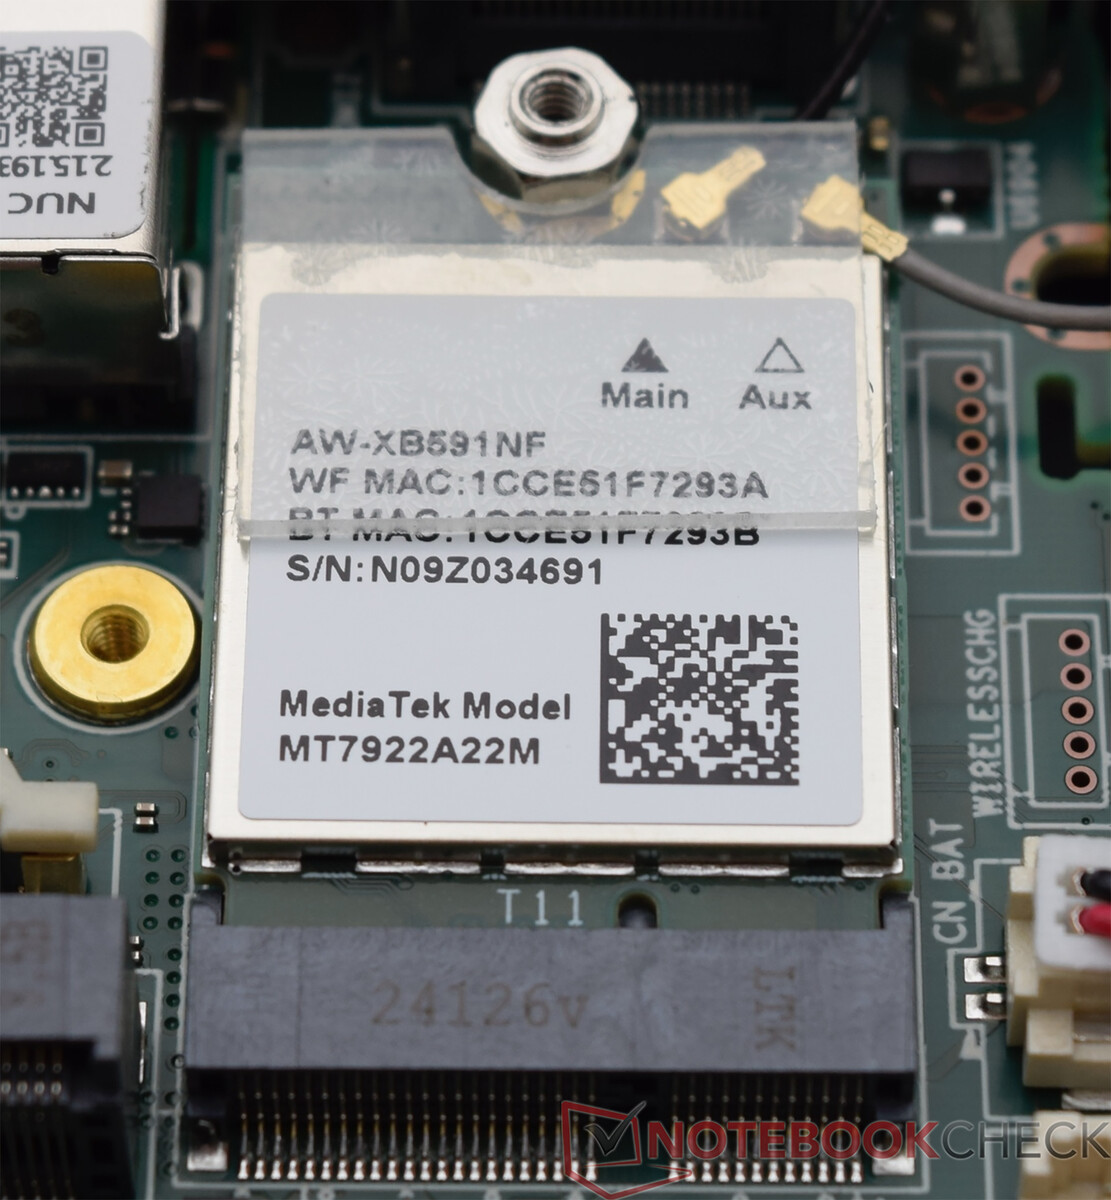
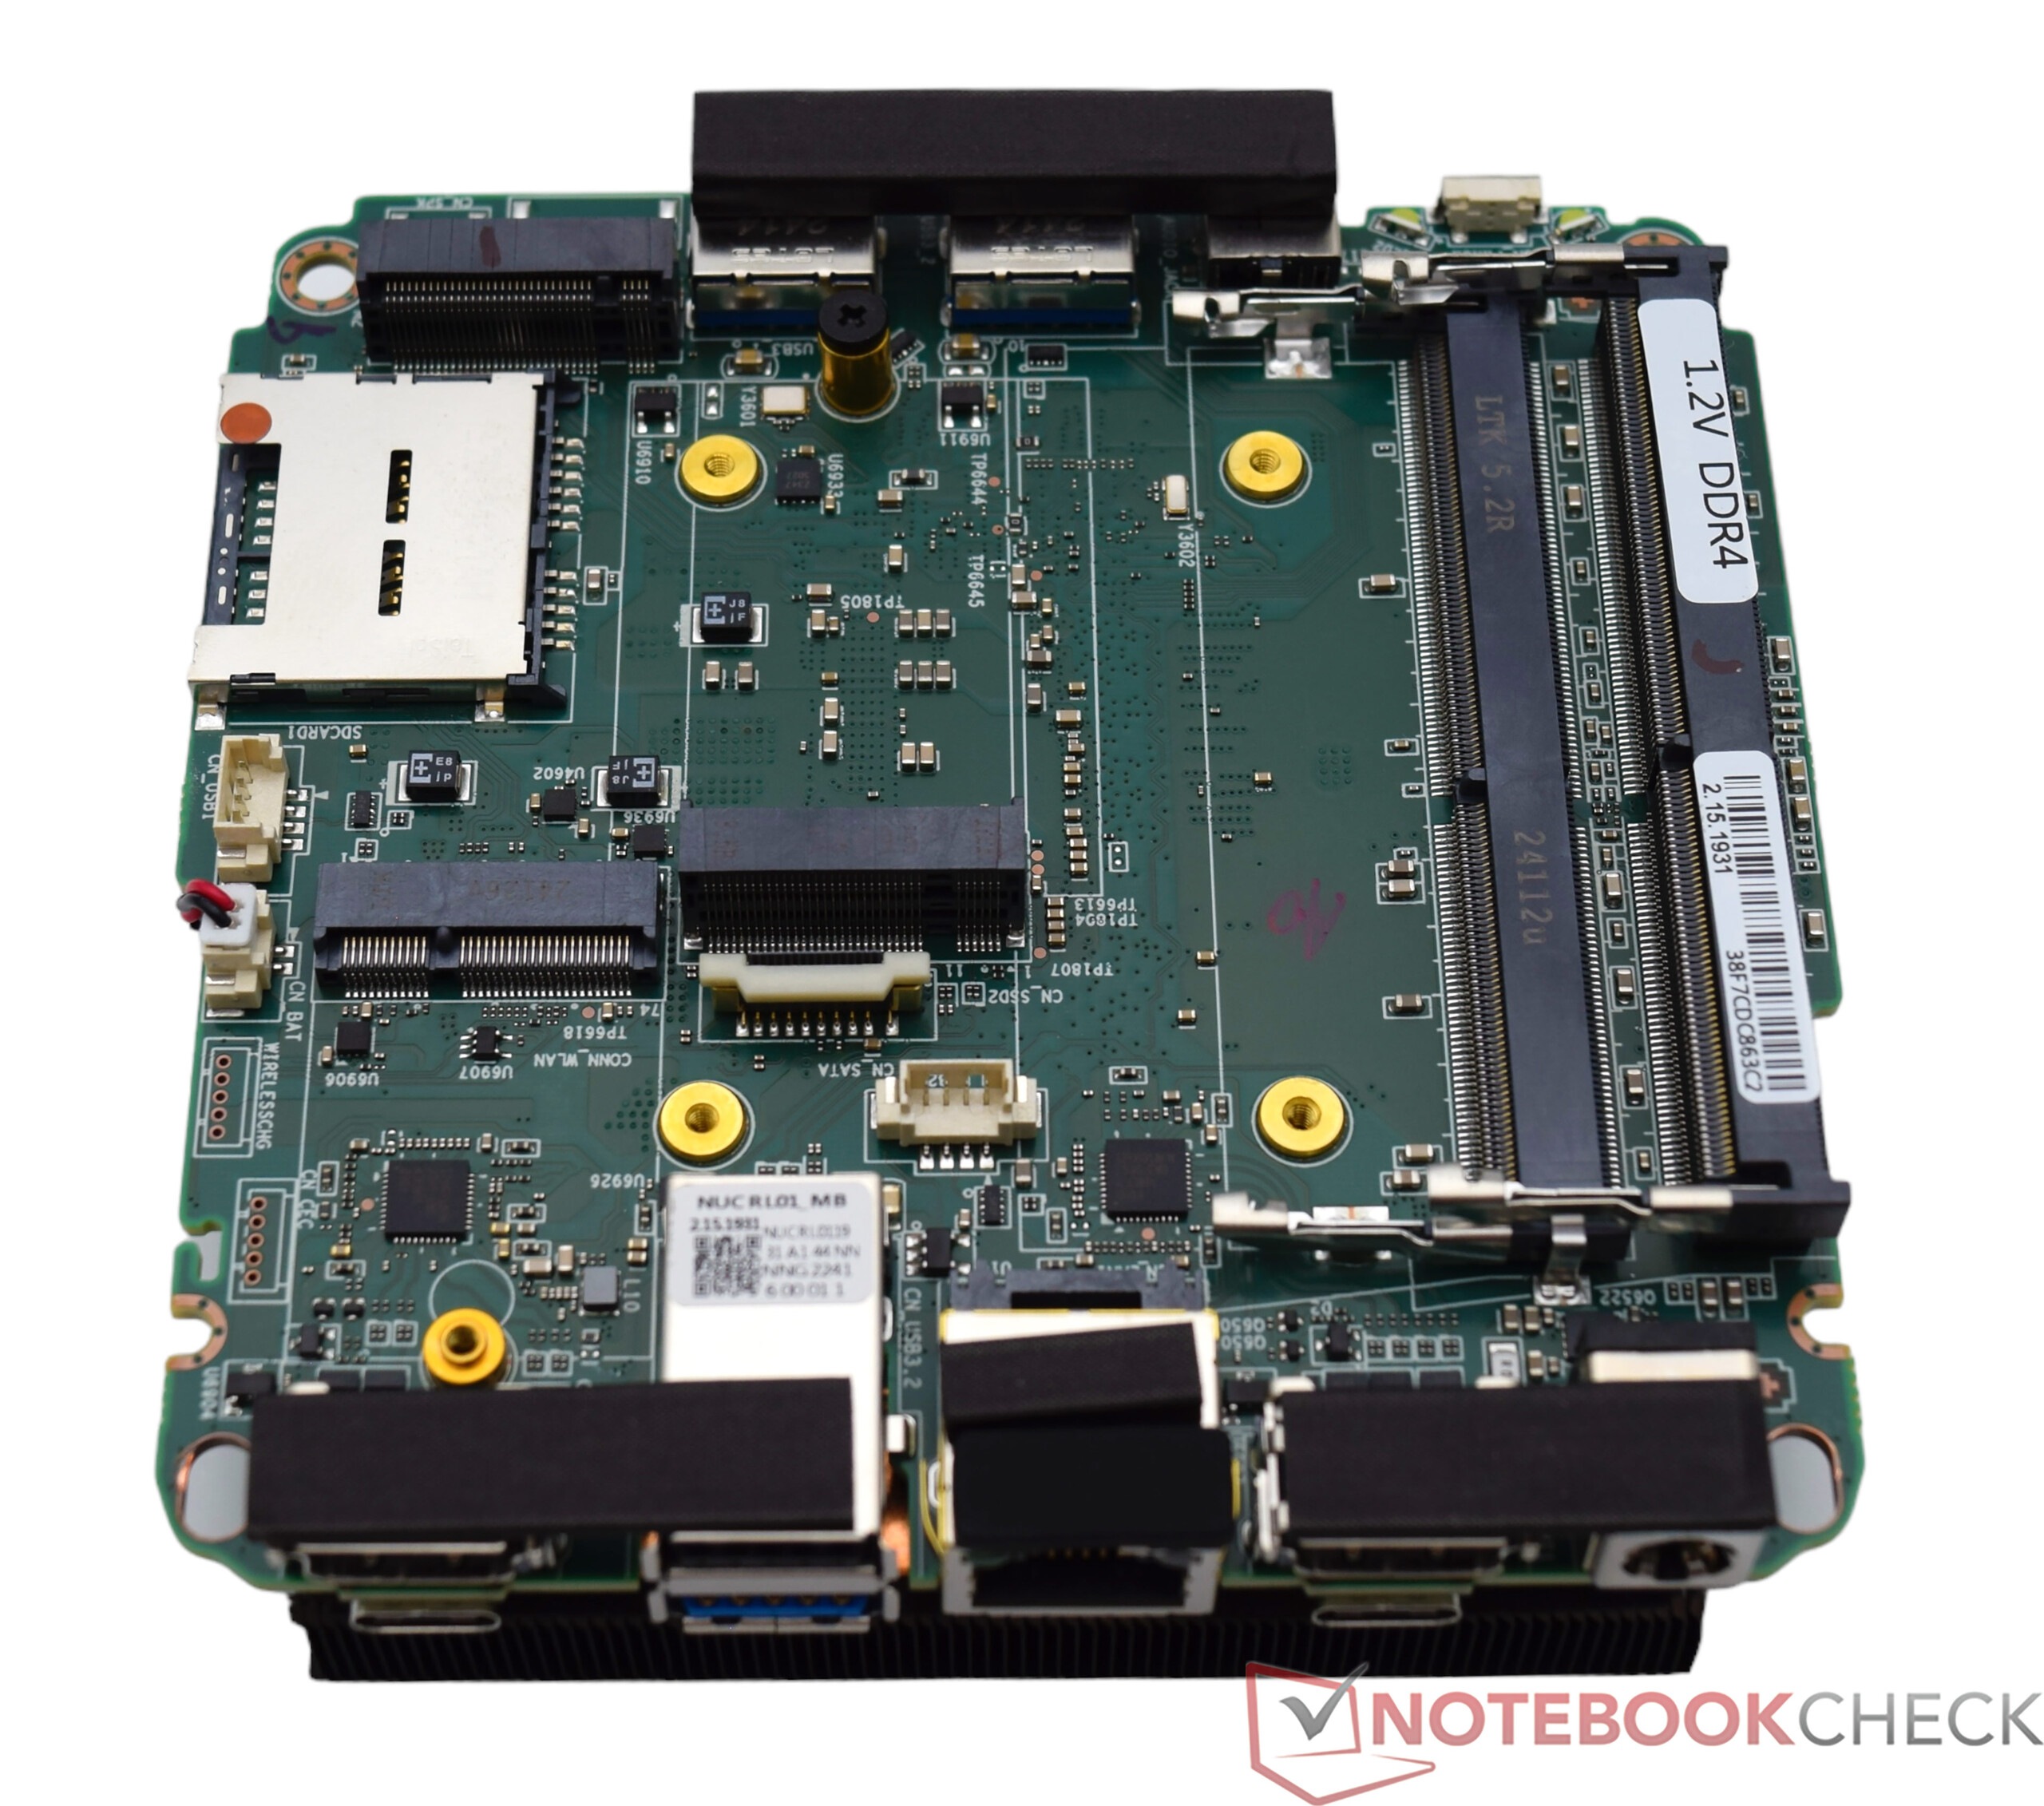
In the Geekom GT13 Pro we come across the same radio module, which is also used in the Geekom A8. The MediaTek Wi-Fi 6E MT7922 WLAN module makes it possible to work with the 2.4 GHz, as well as the 5 GHz and 6 GHz frequency ranges. Our measurements are limited to the 5 and 6 GHz frequency bands. We only documented slight differences in performance in conjunction with our Asus ROG Rapture GT-AXE11000 test router. Unfortunately, Geekom does not include a modern Wi-Fi module. Both the Acemagic F2A as well as the Minisforum AtomMan X7 Ti can consistently deliver slightly better results with the Intel Wi-Fi 7 BE200. The Geekom GT13 Pro also has an RJ45 socket. Data transfer rates of up to 2.5 GBit/s are possible here.
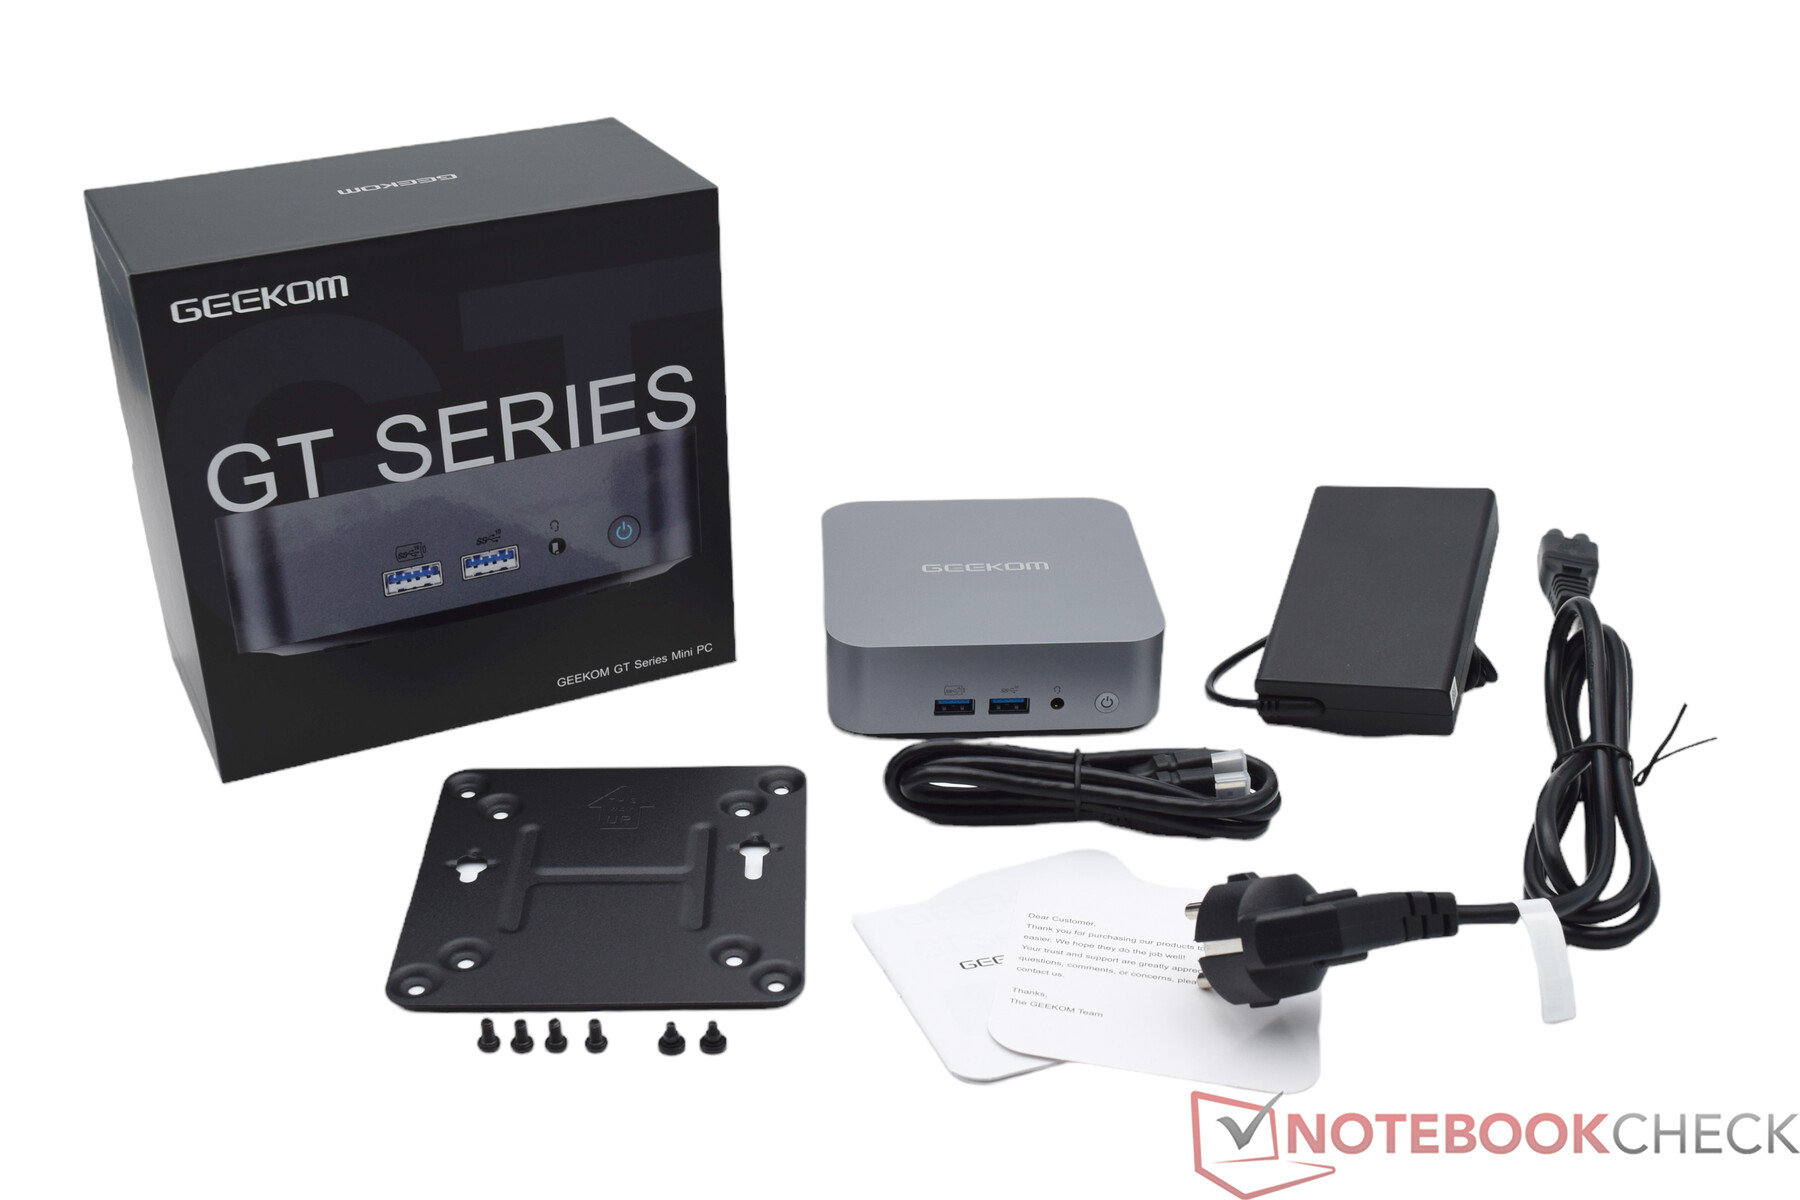
Accessories
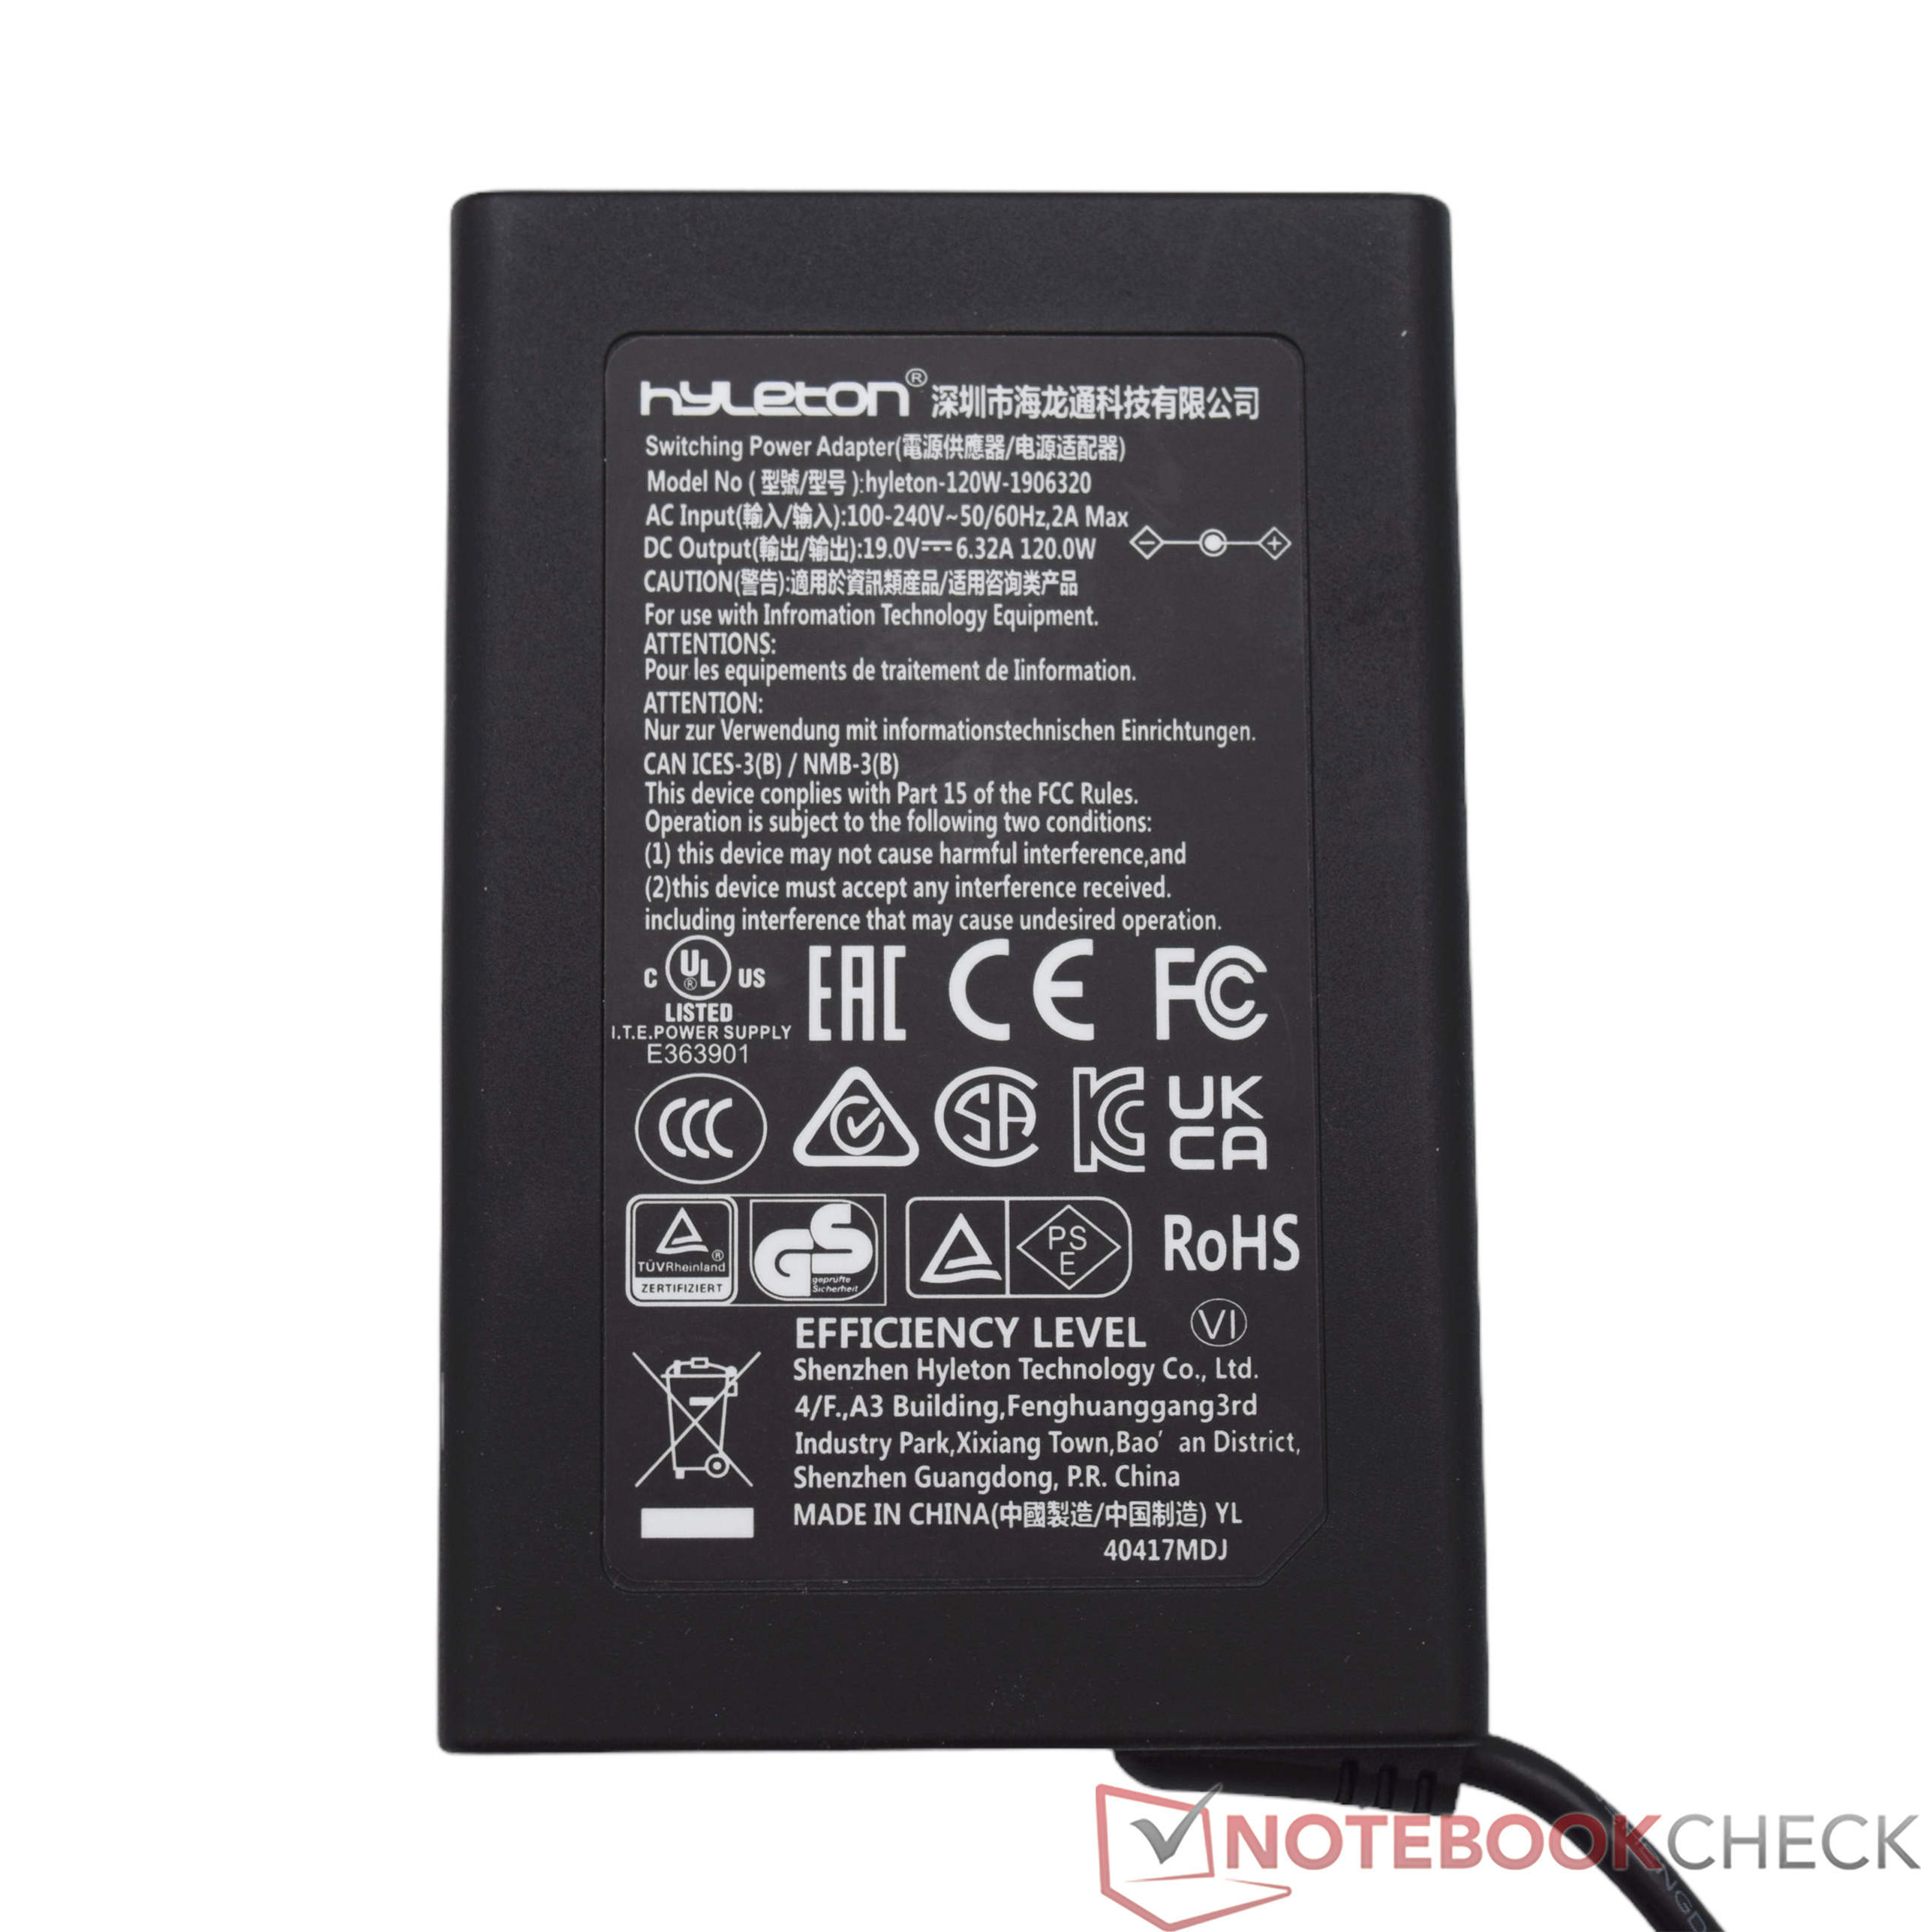
The Geekom GT13 Pro comes with a 120-watt power supply unit. There is also an HDMI cable and a VESA mounting plate in the box. The manufacturer also includes a small user manual, which describes the connection options and the installation of RAM and SSD, among other things. Geekom delivers the product in a small cardboard box. The amount of plastic could still be minimized, as the HDMI cable and the VESA mounting plate are packaged separately.
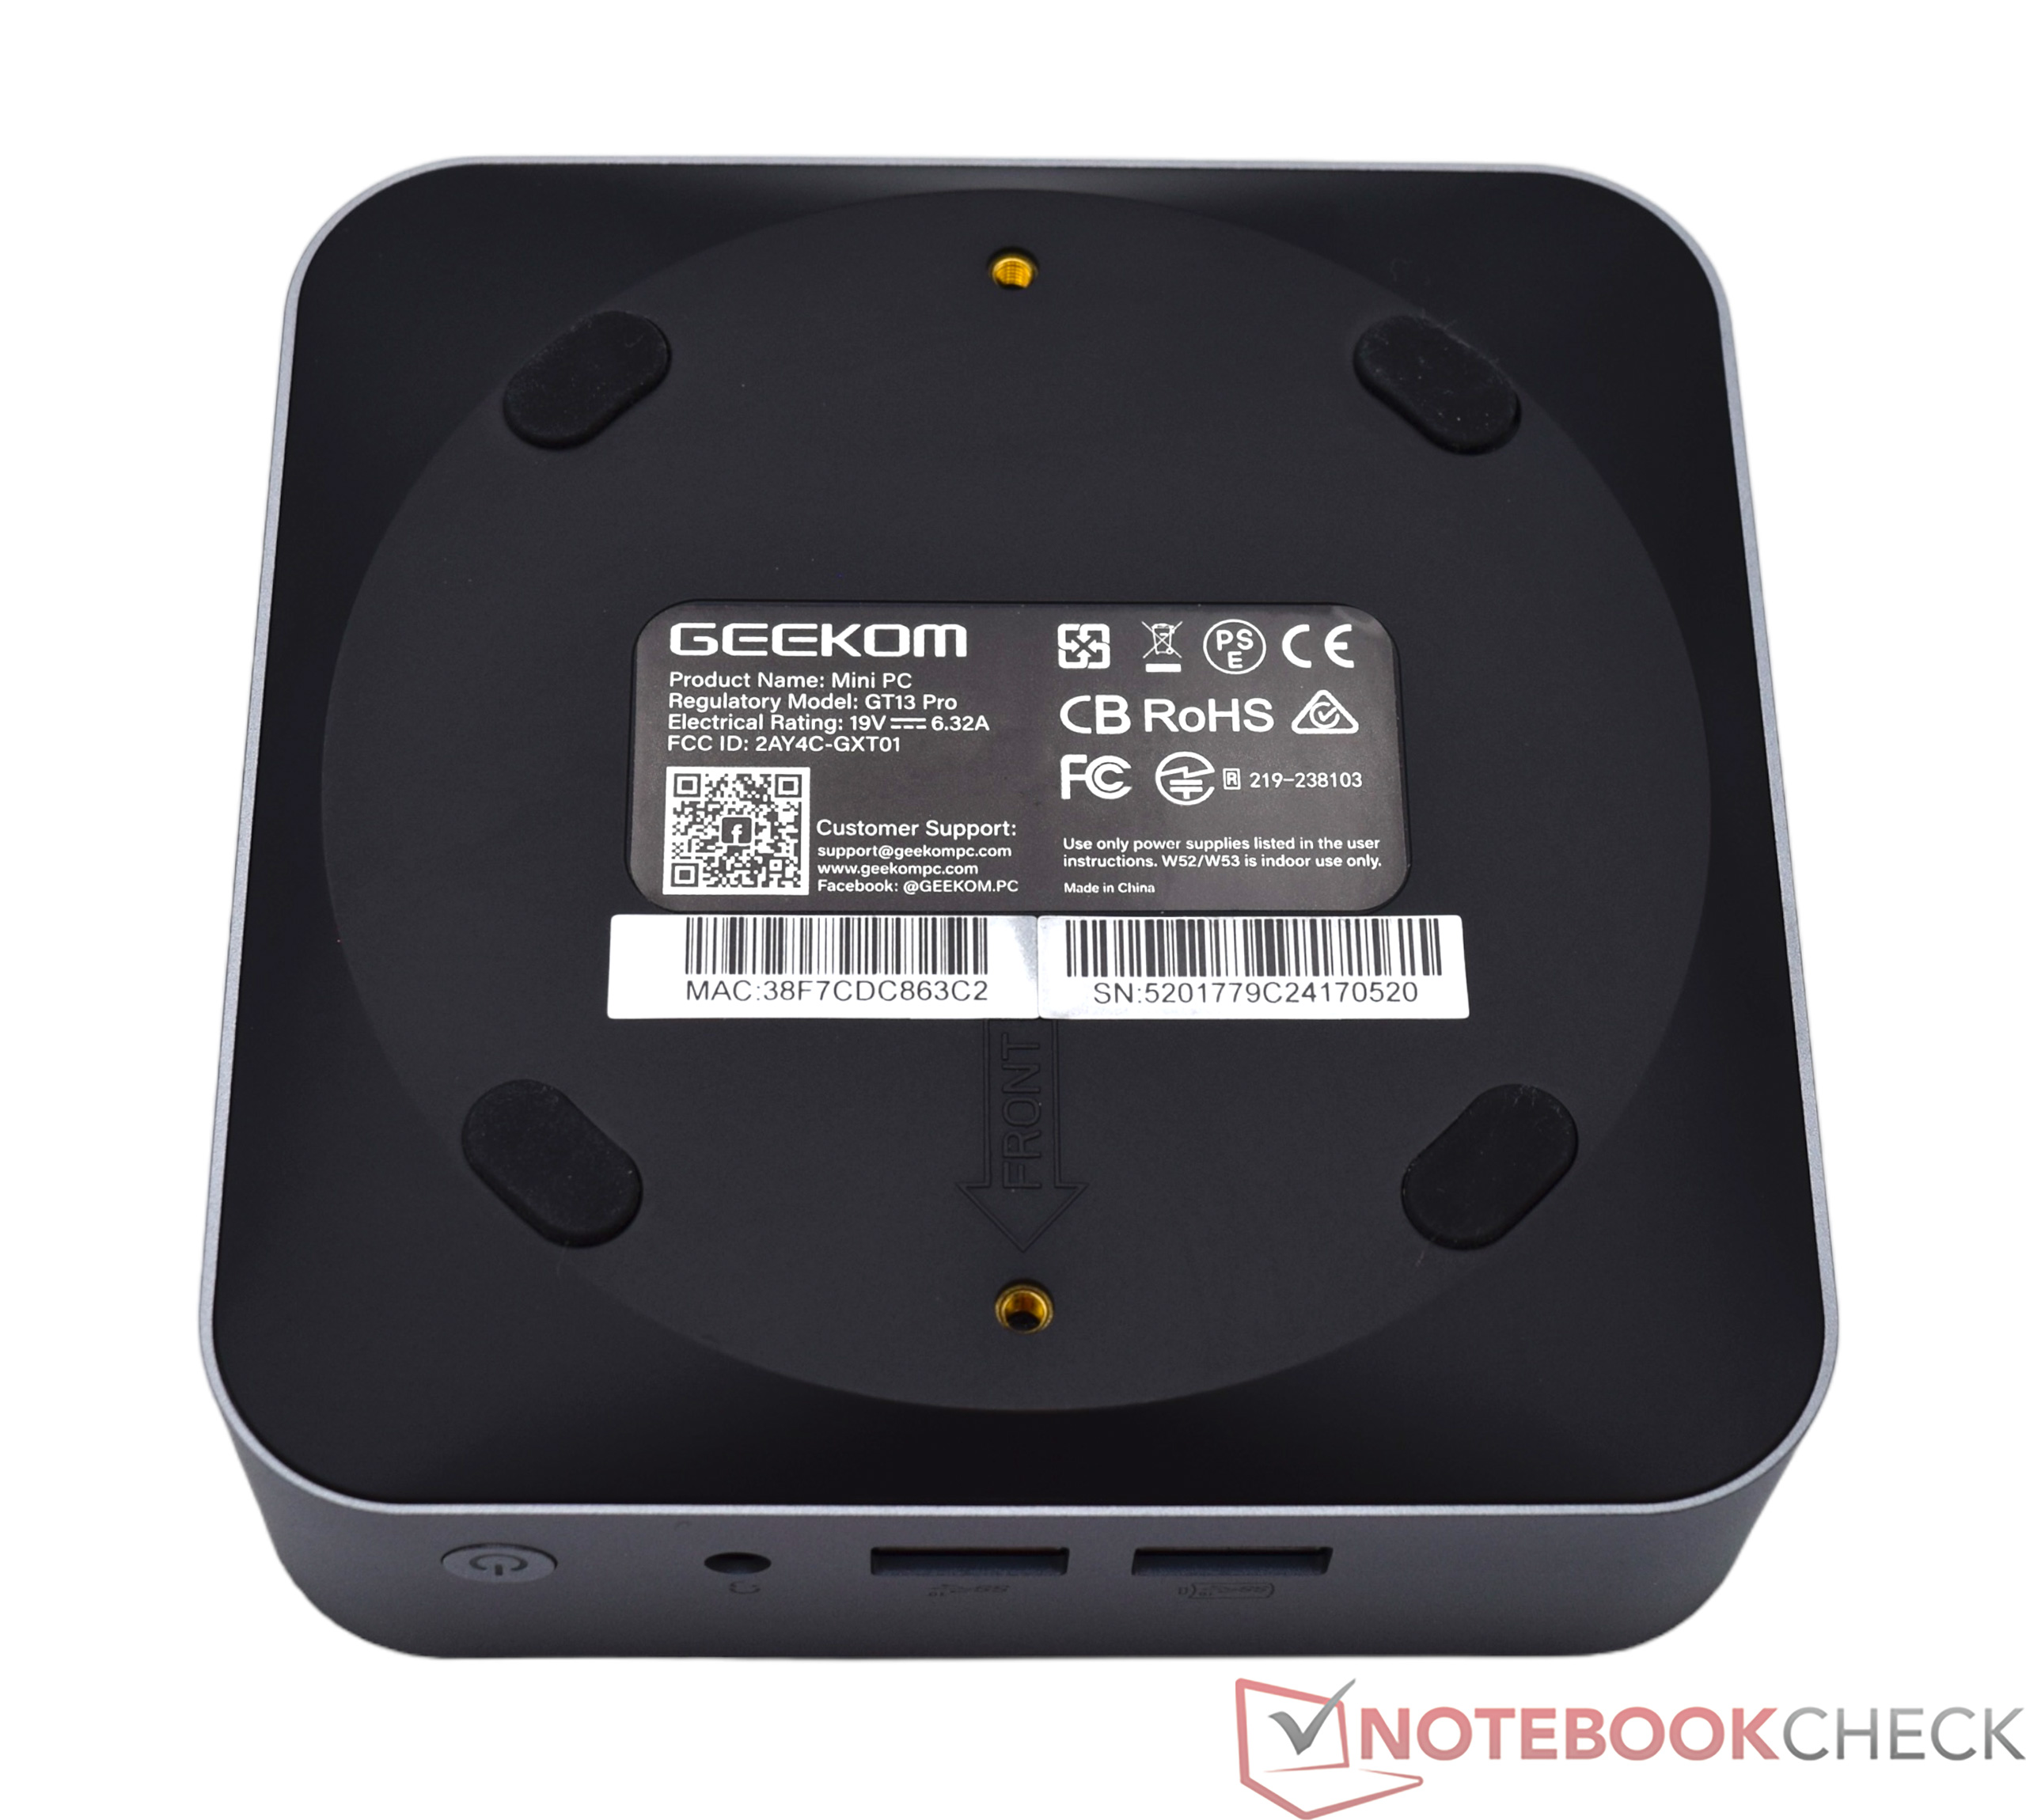
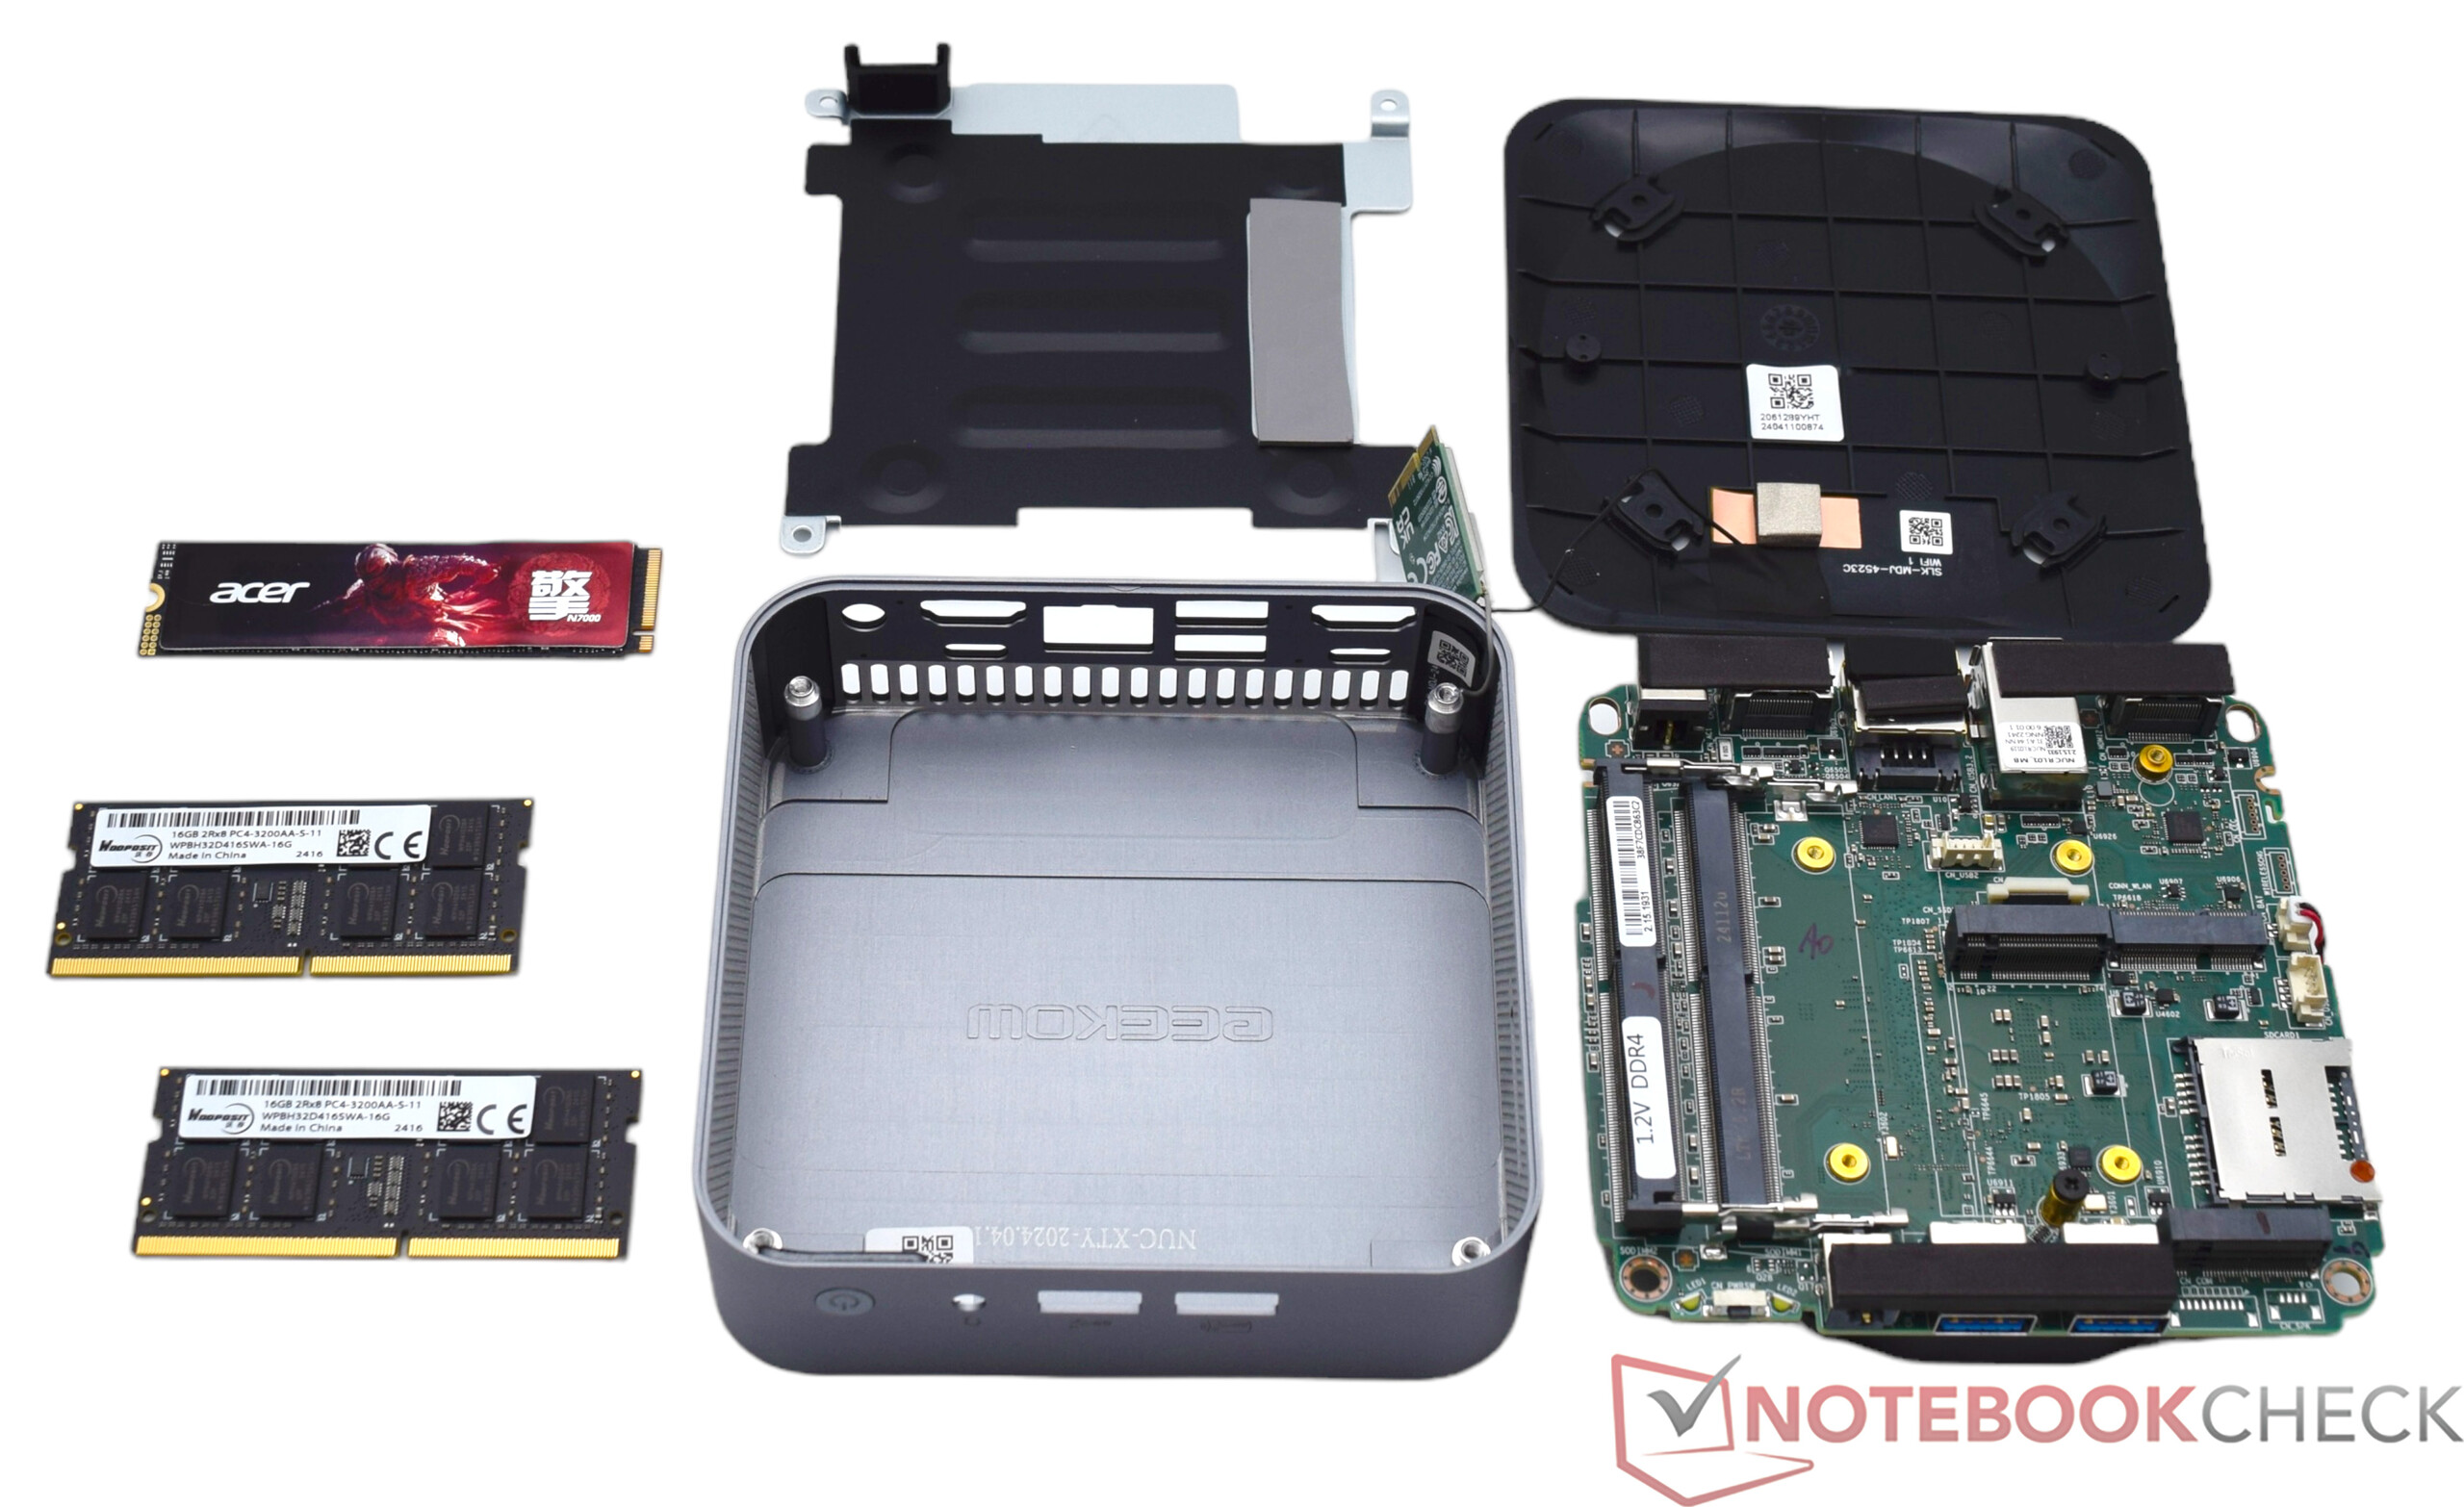
Maintenance
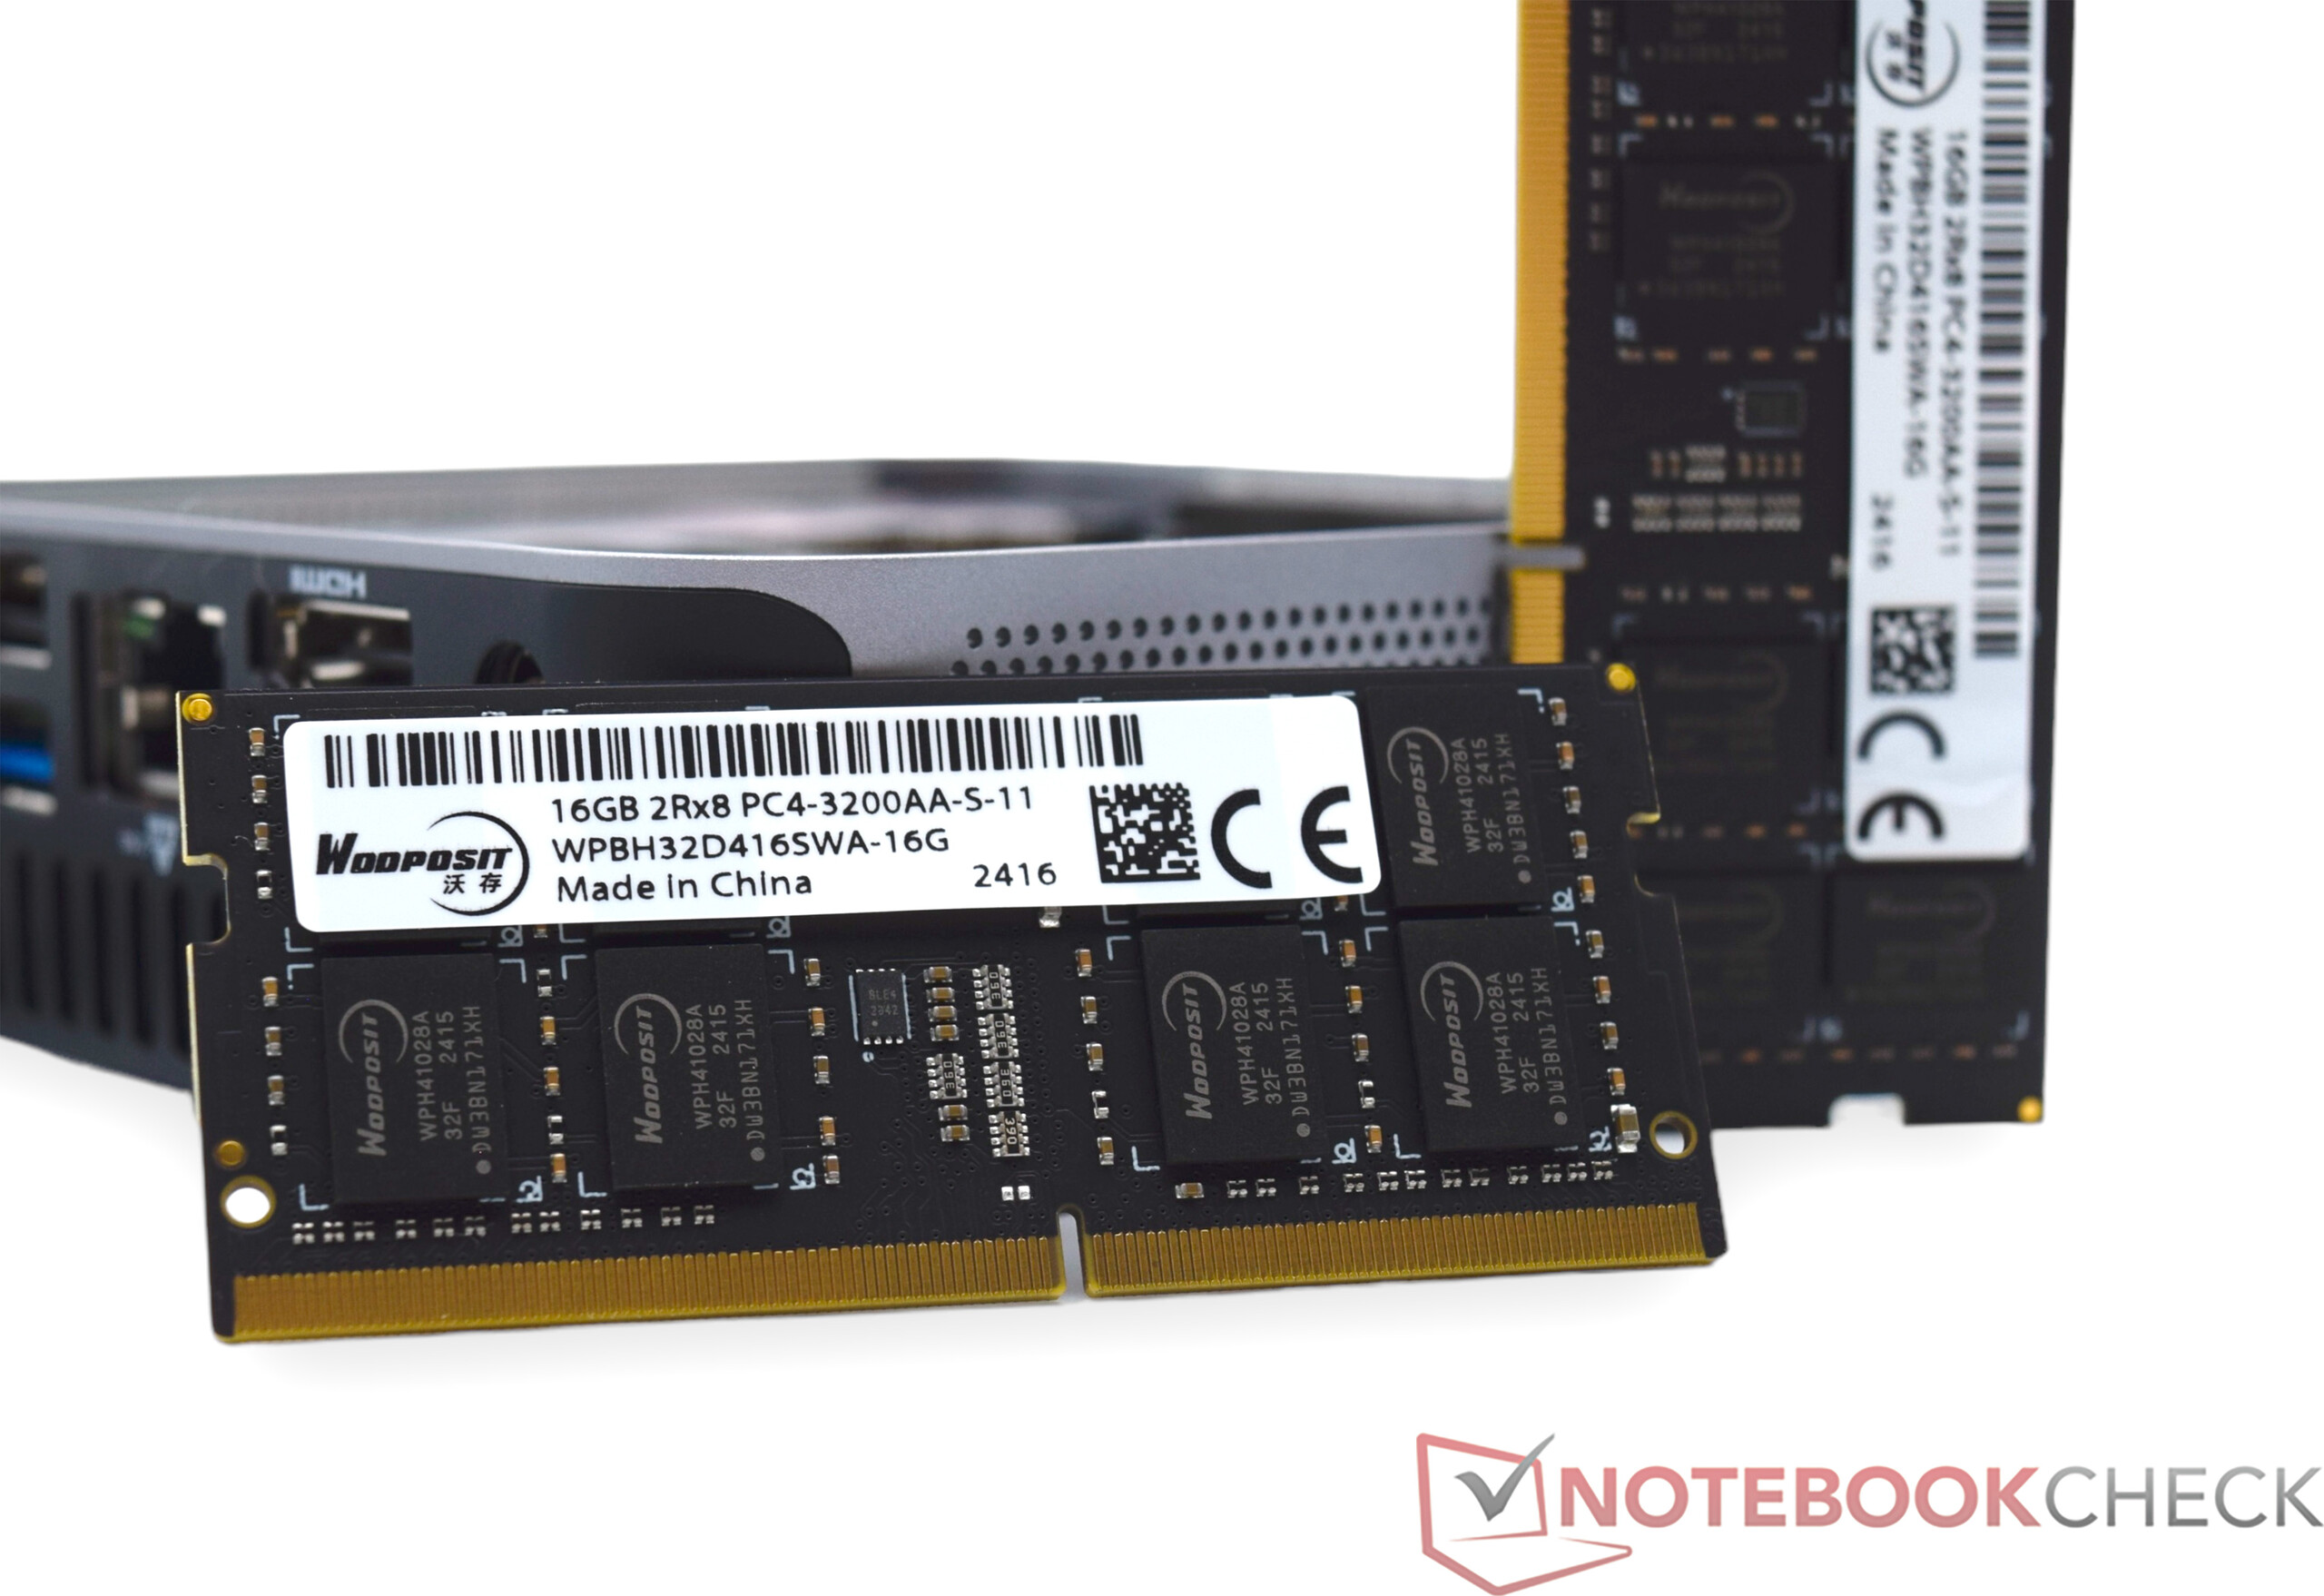
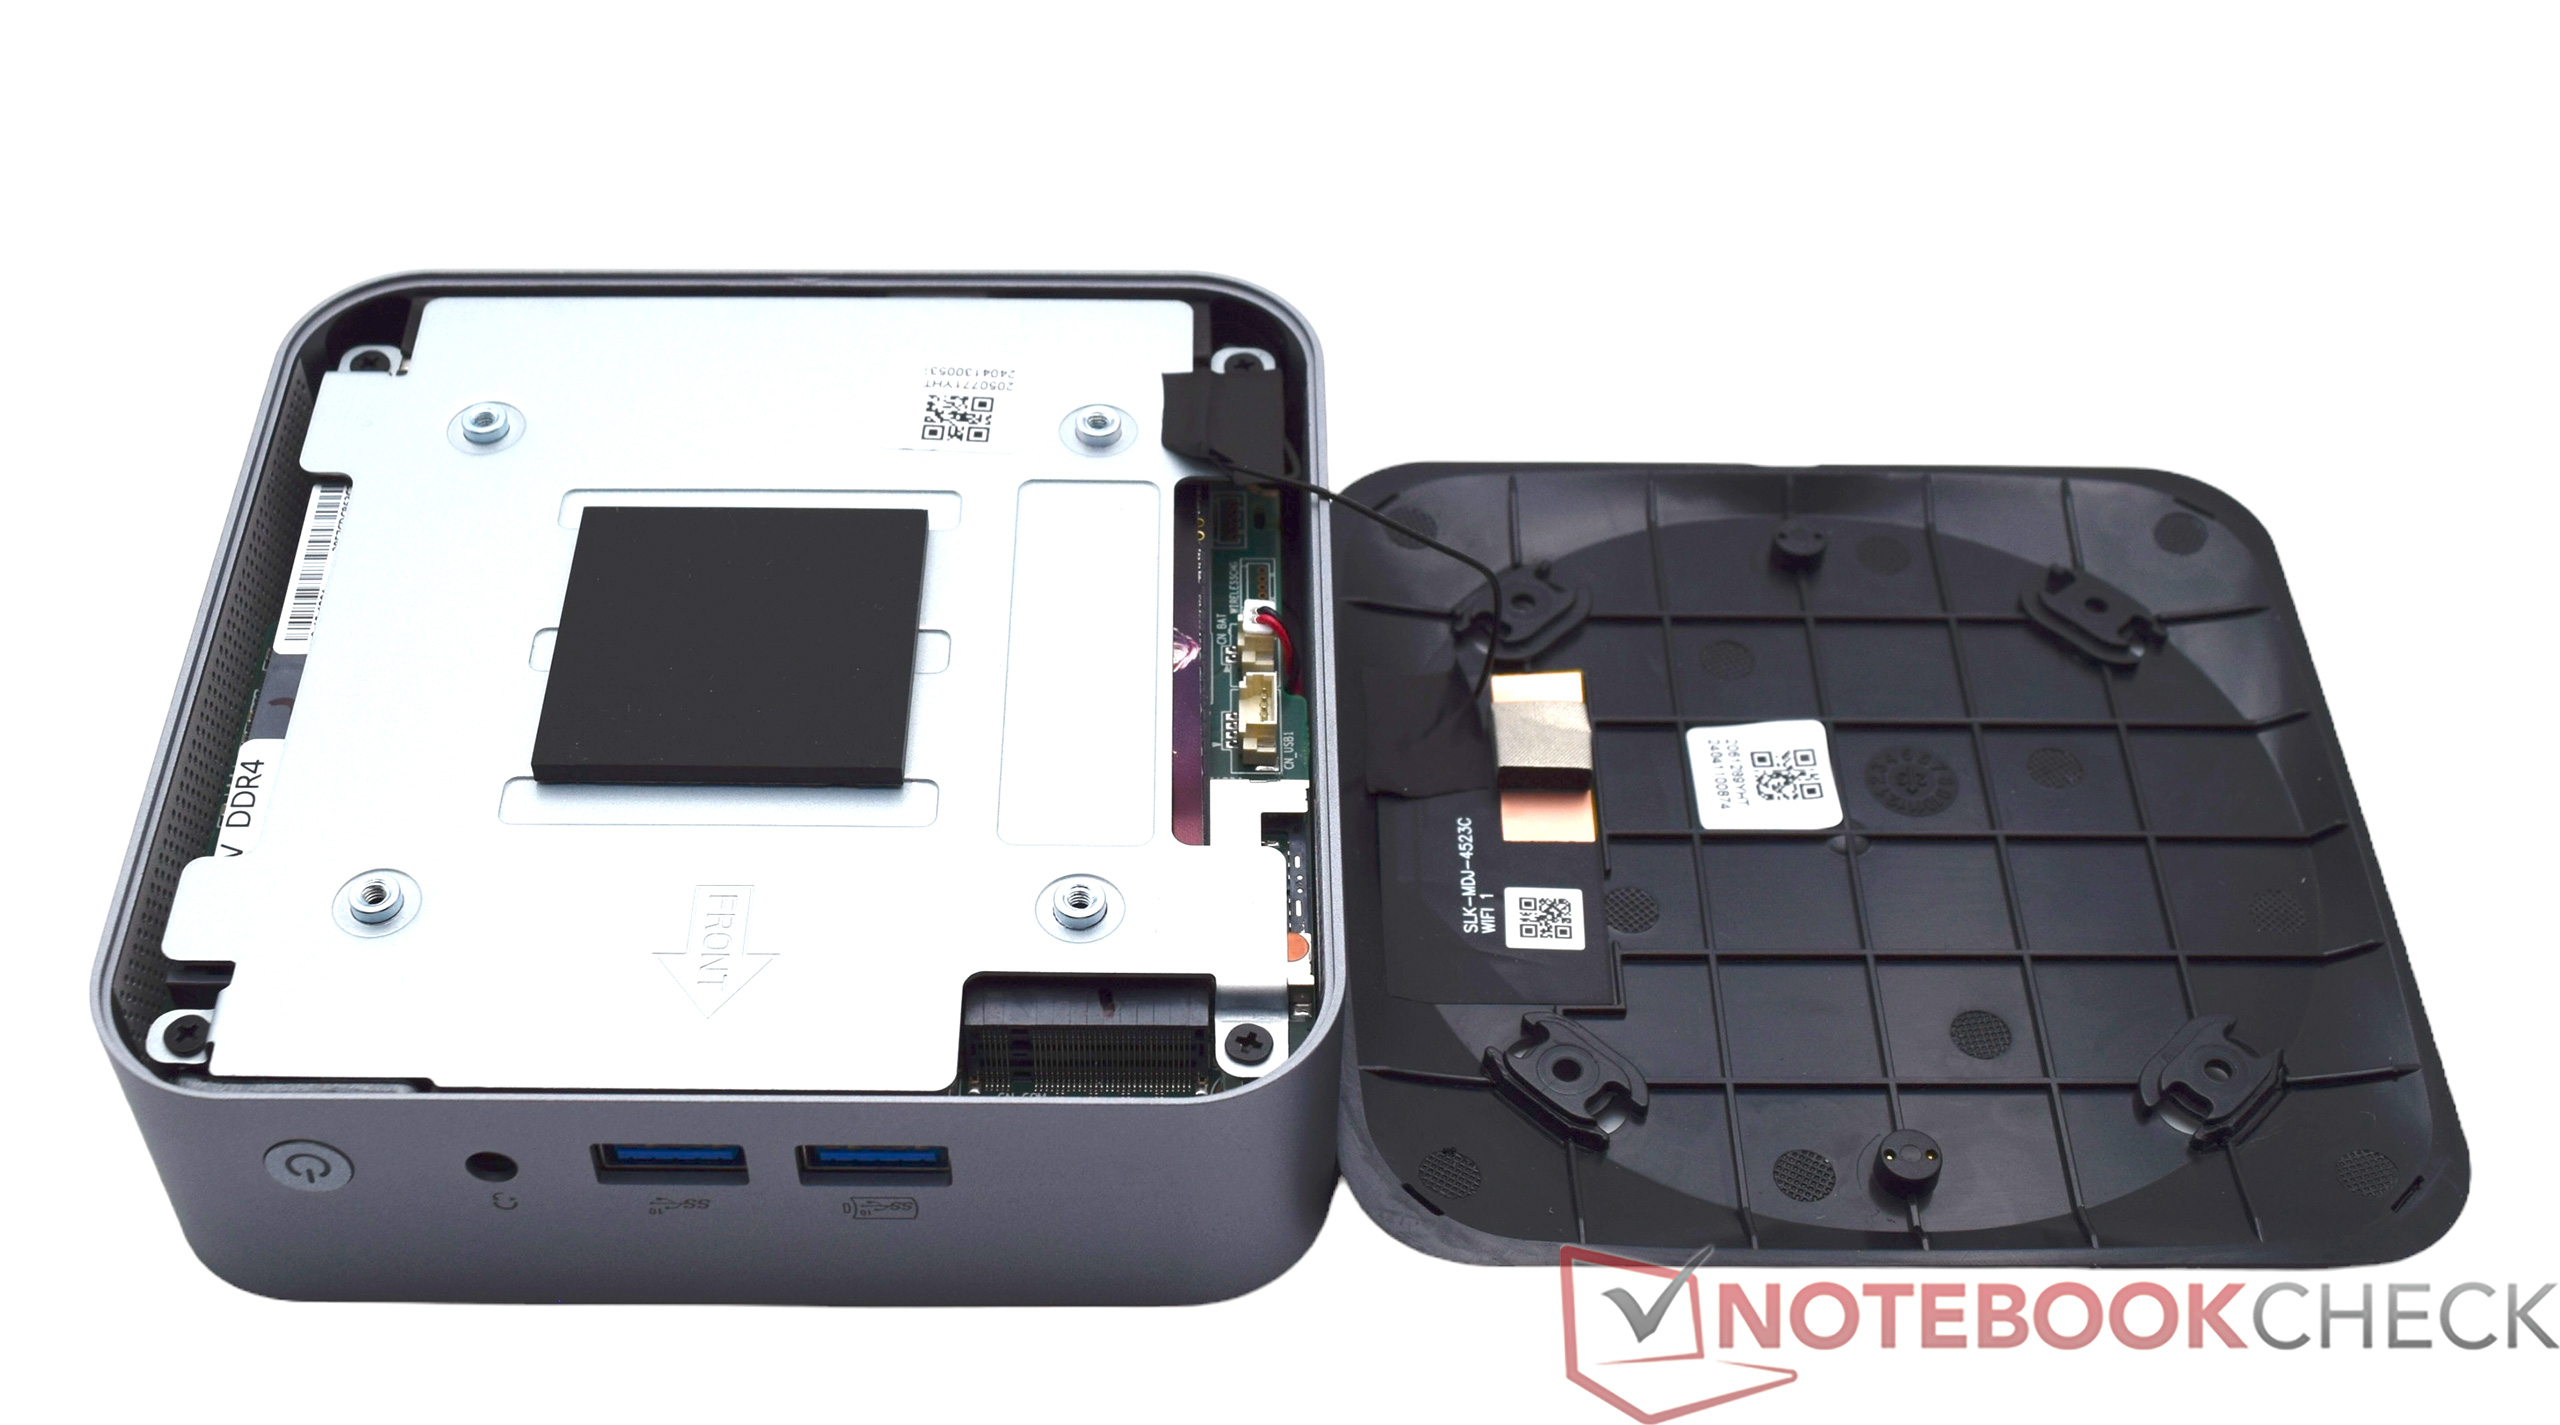
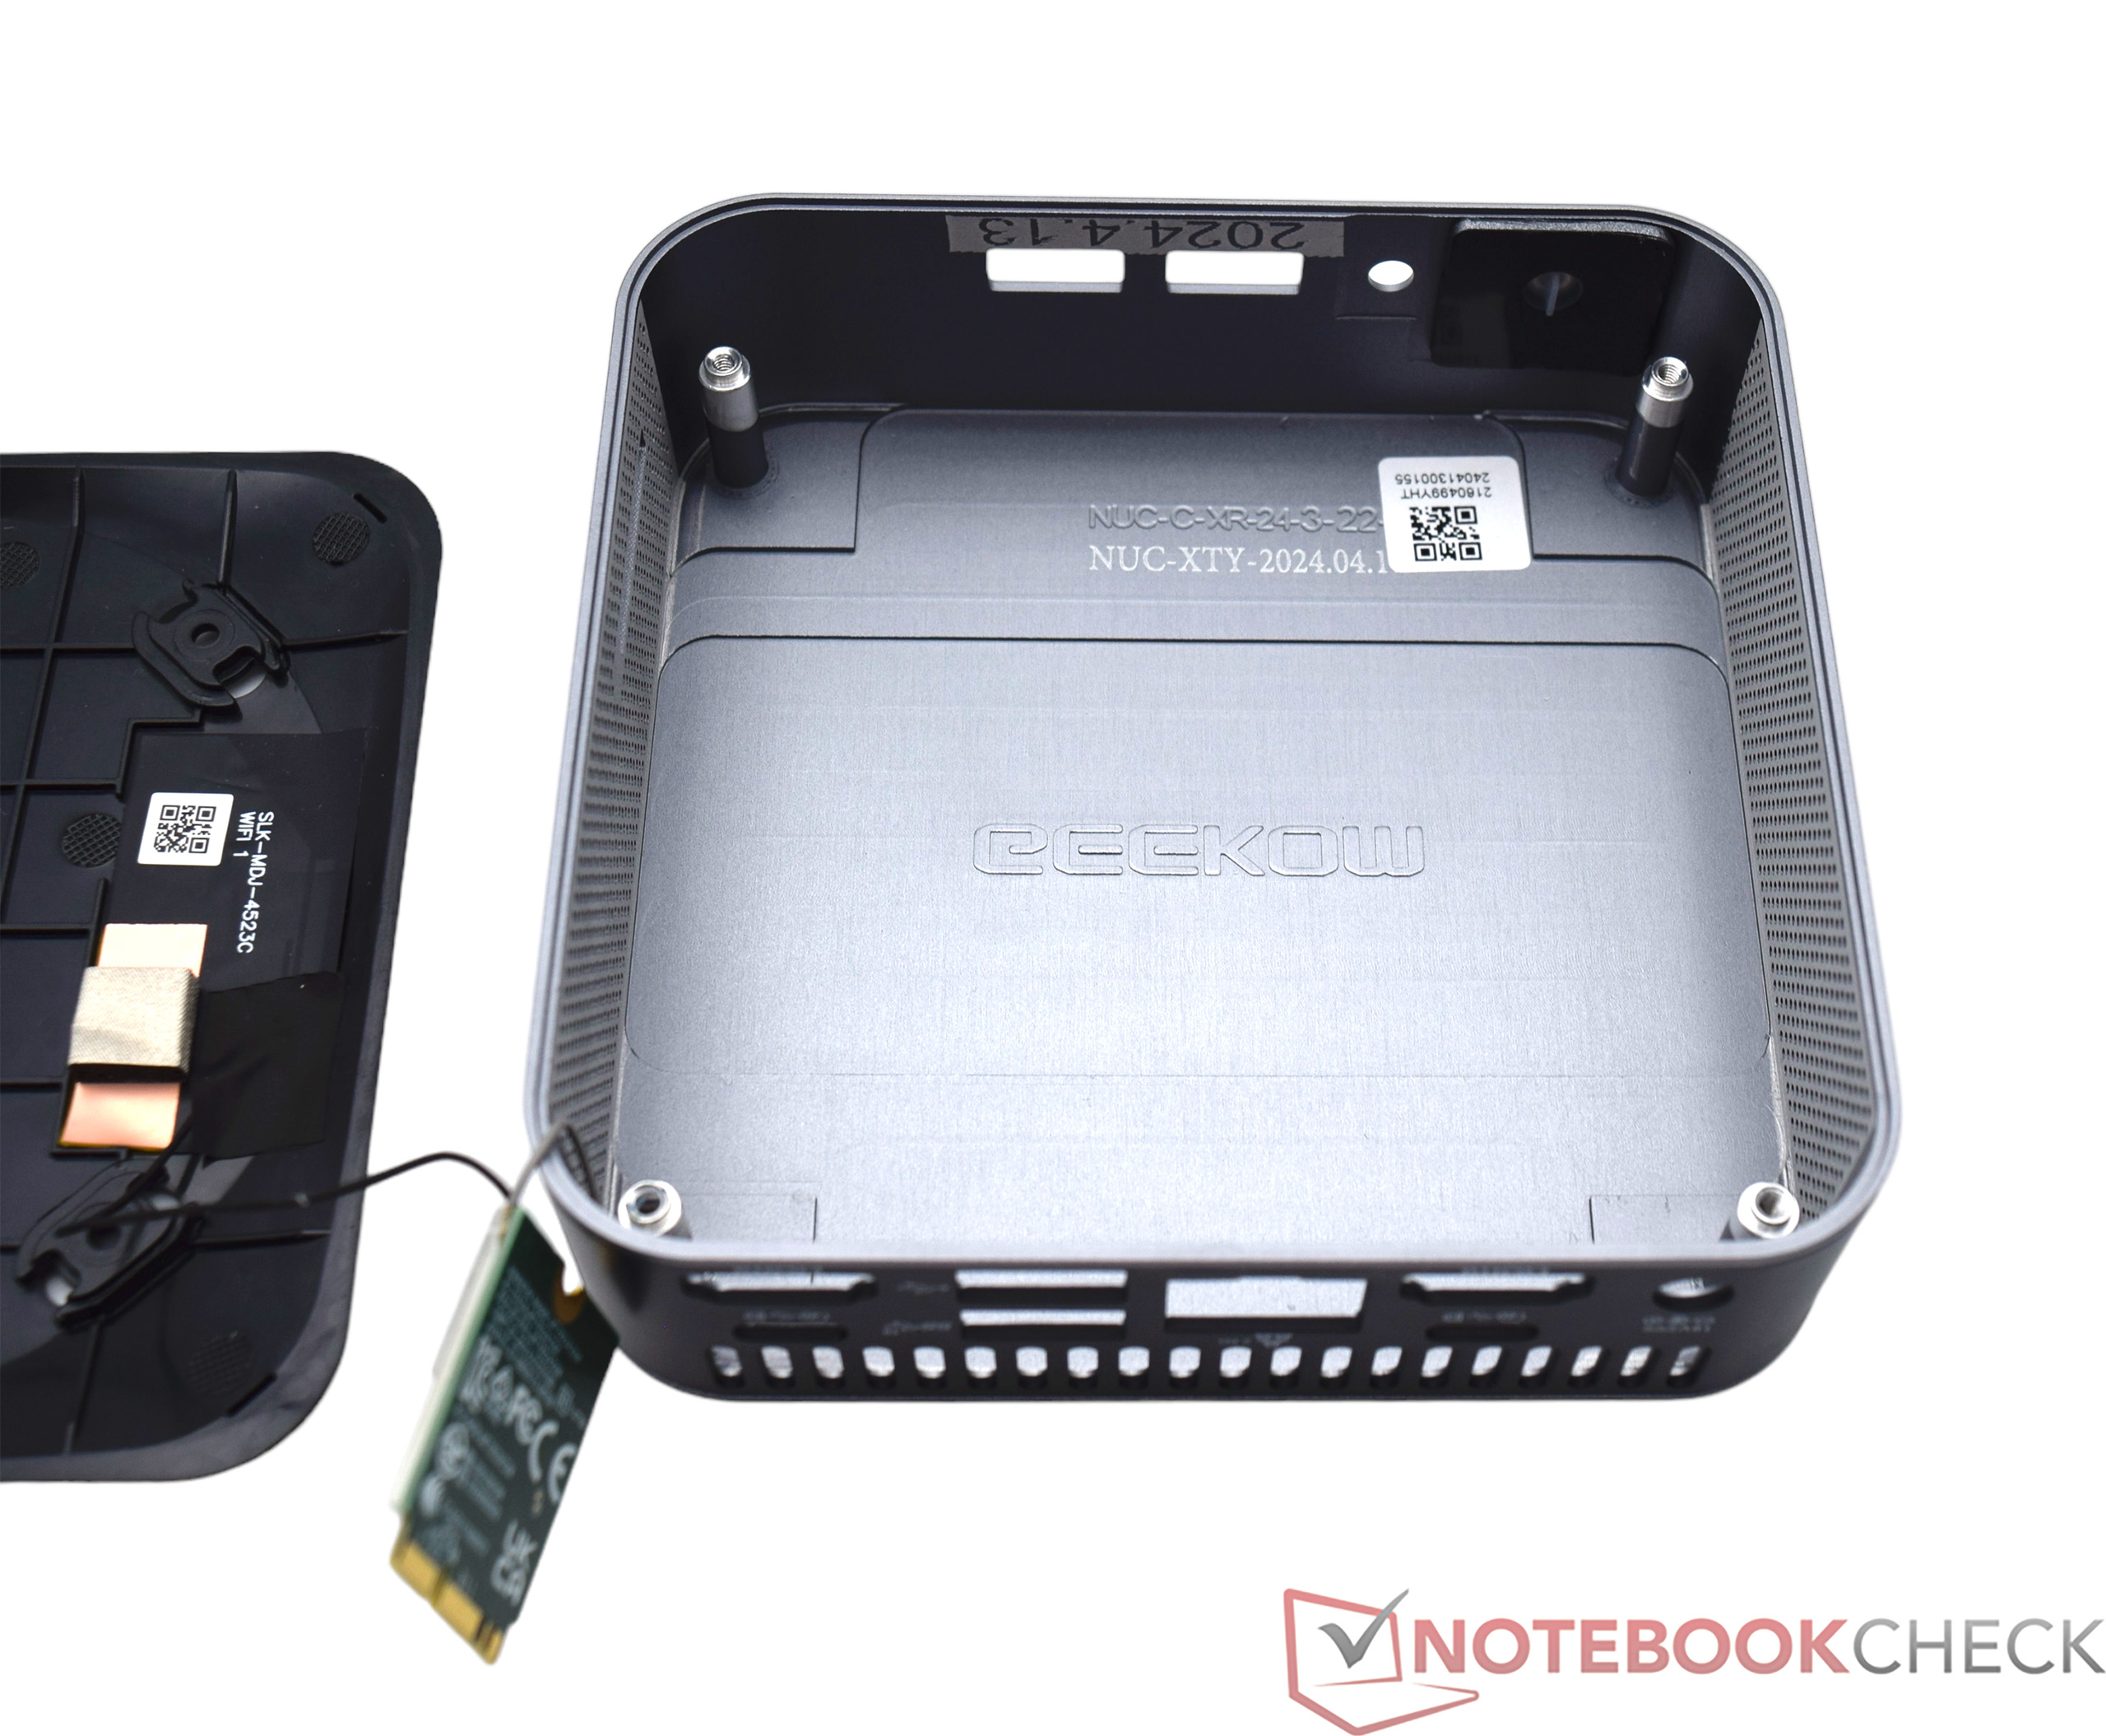
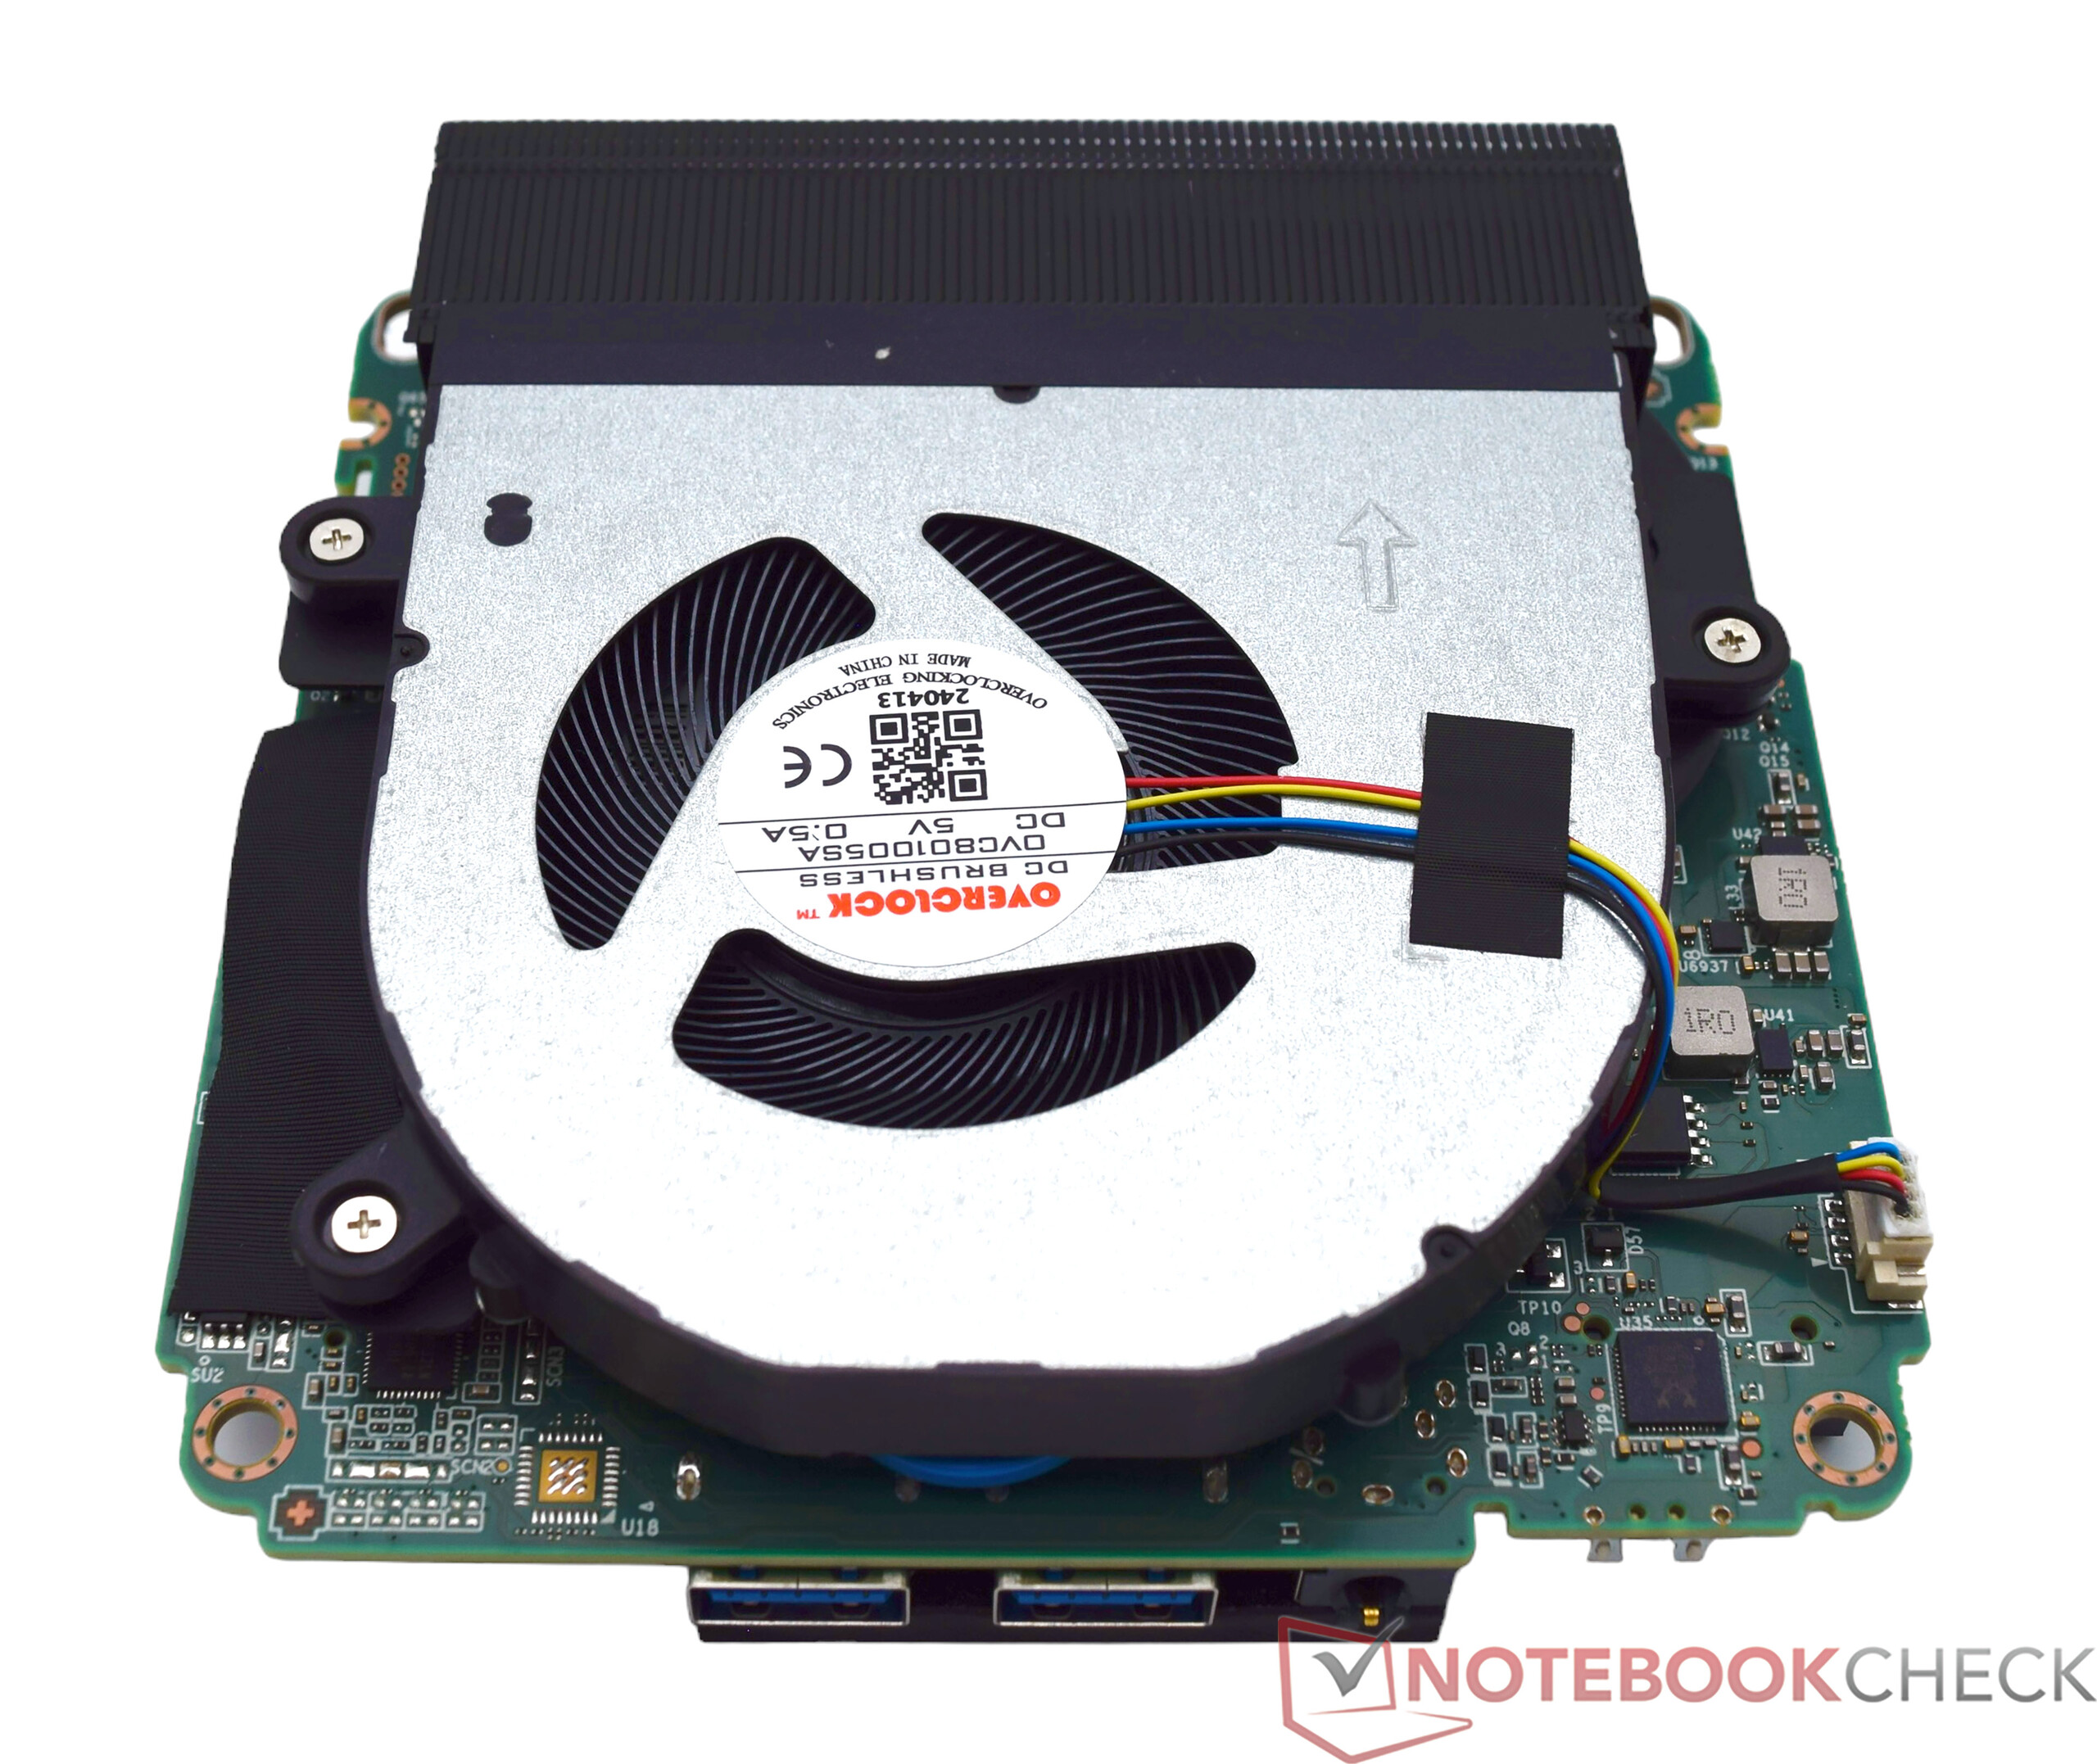
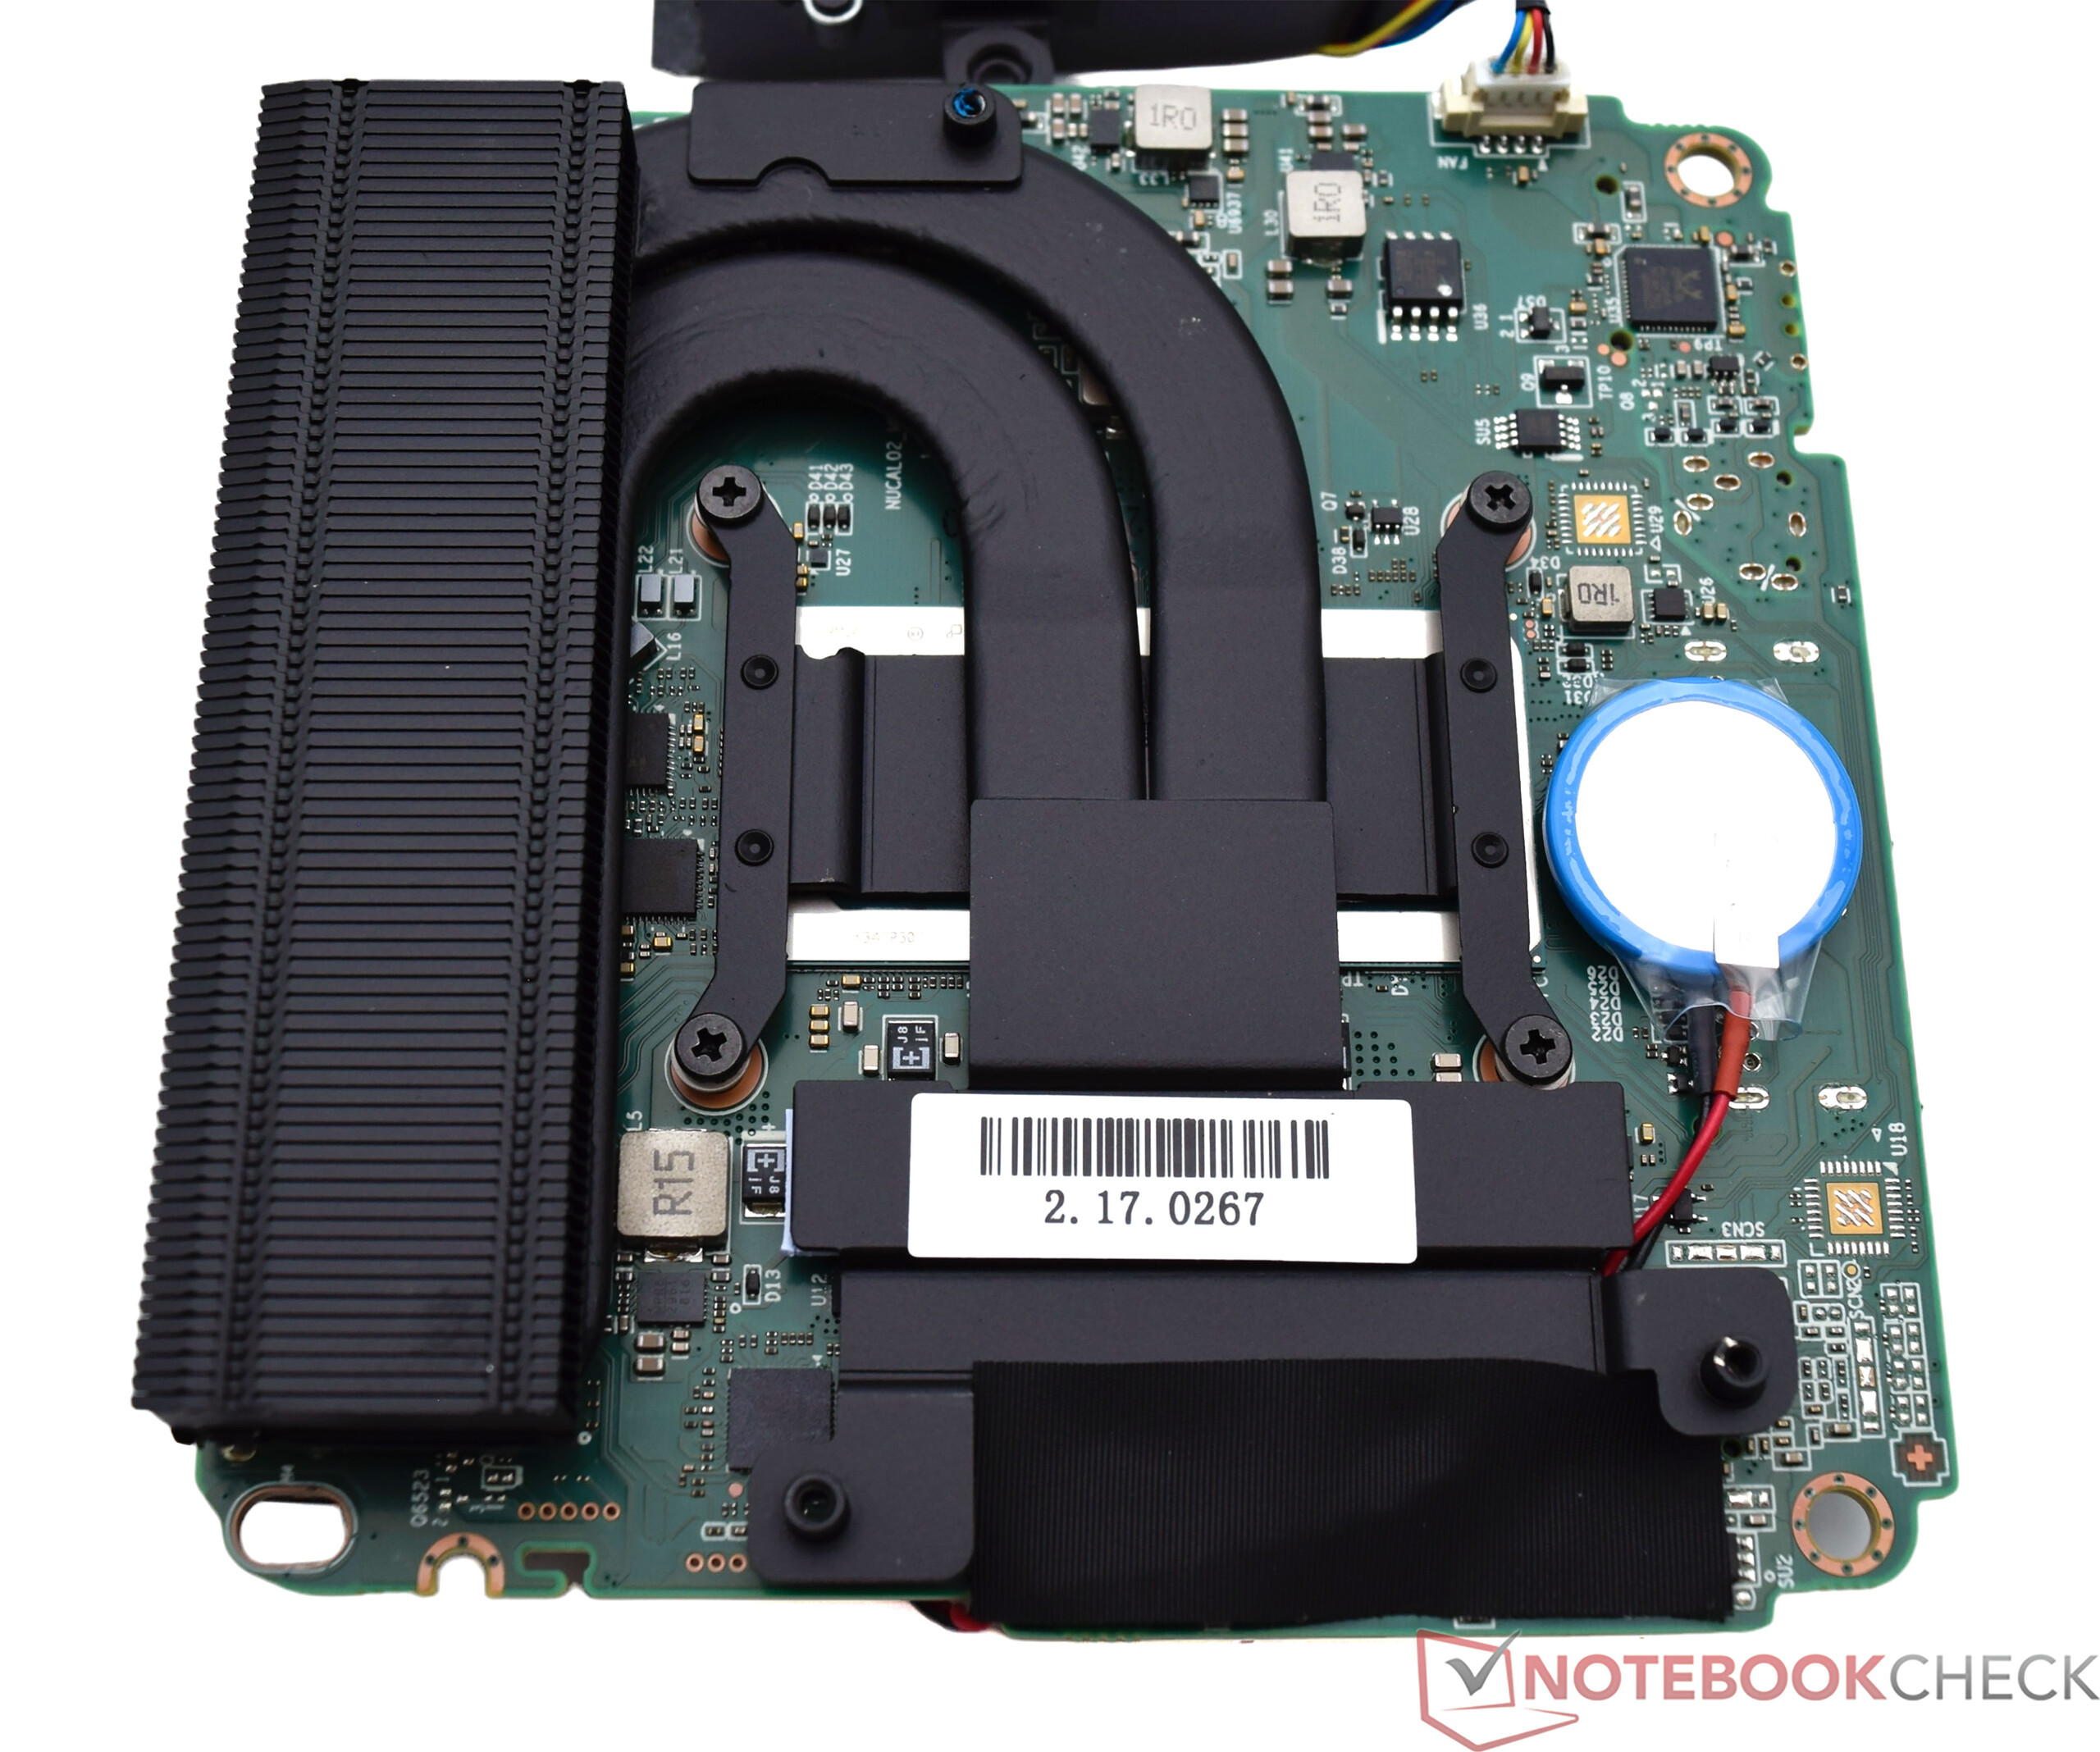
The Geekom GT13 Pro is always sold together with RAM and SSD. This means that the device does not necessarily have to be opened to install missing hardware components, as is the case with barebone variants. If you still need to get to the inside, you can open the Geekom GT13 Pro from the underside. Four screws are hidden under the glued-on rubber feet, which secure the plastic cover. Care should be taken here to avoid damaging the WLAN antenna cable. There is another metal plate under the plastic cover, which also needs to be removed if you want to access the SSD or RAM. The WLAN module can also be replaced. To access the cooling unit, which the manufacturer advertises as IceBlast 1.5, the board must be completely removed from the housing, which is not a major challenge in practice.
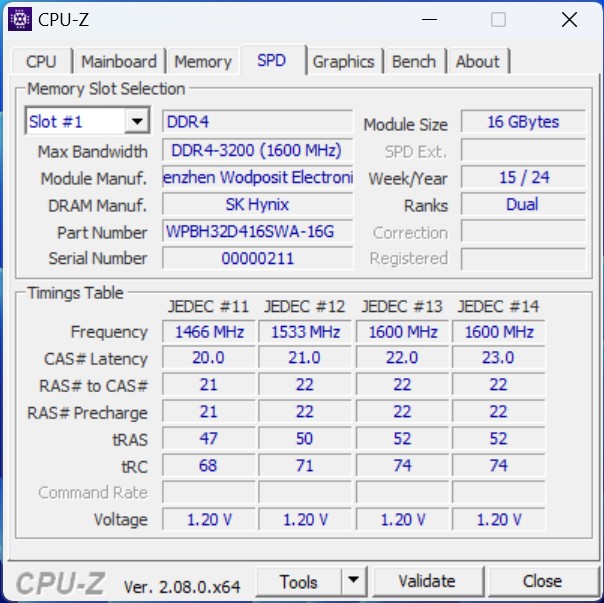
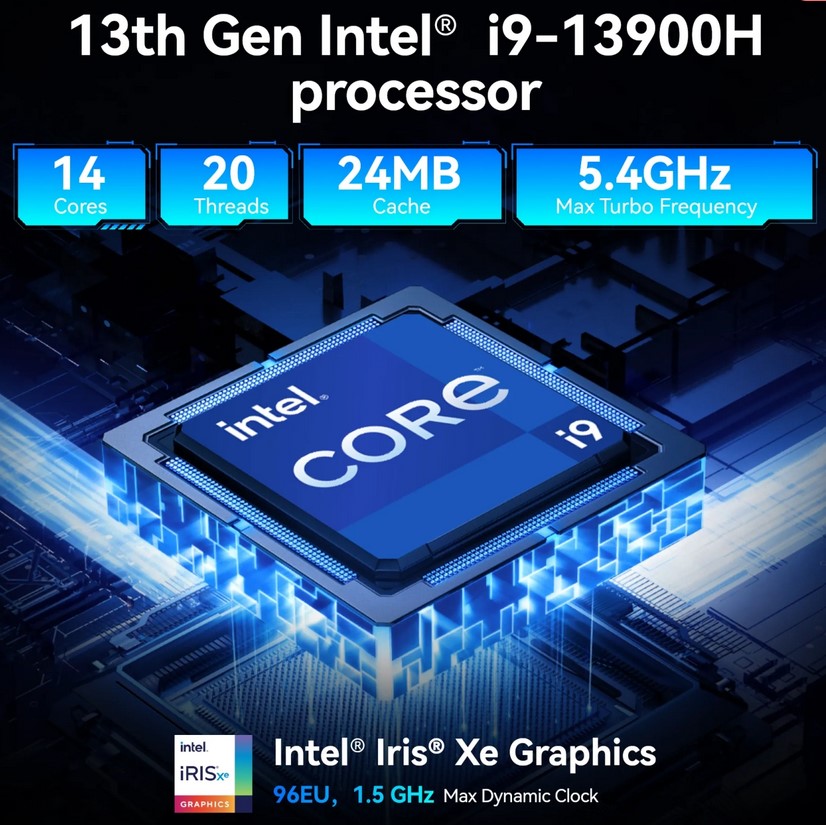
Performance - Intel Raptor Lake processor with up to 14 cores
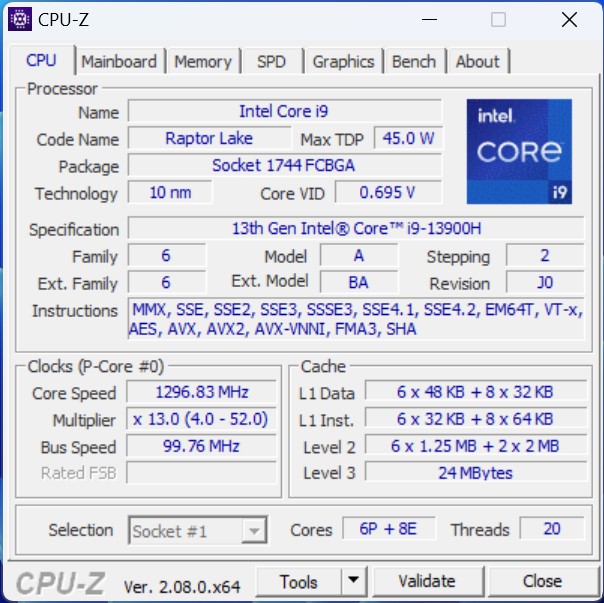
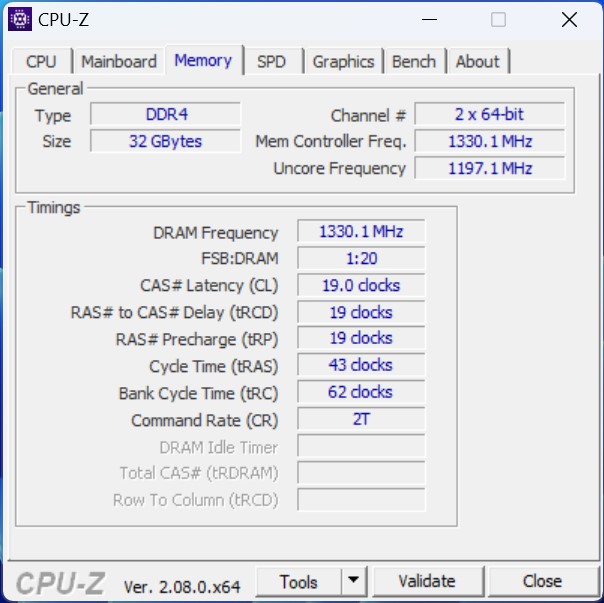
The Geekom GT13 Pro is available in two versions. The top model with Intel Core i9-13900H equipped with 14 cores ensures good multi-thread performance. If you want to go a little easier on your wallet, you can also buy the stylish mini-PC with an Intel Core i7-13620H. With 10 cores and 16 threads, this processor should also cope well with everyday use. 32 GB of DDR4 RAM is always included and, therefore, serves as a solid basis for coping with memory-hungry tasks.
Test conditions
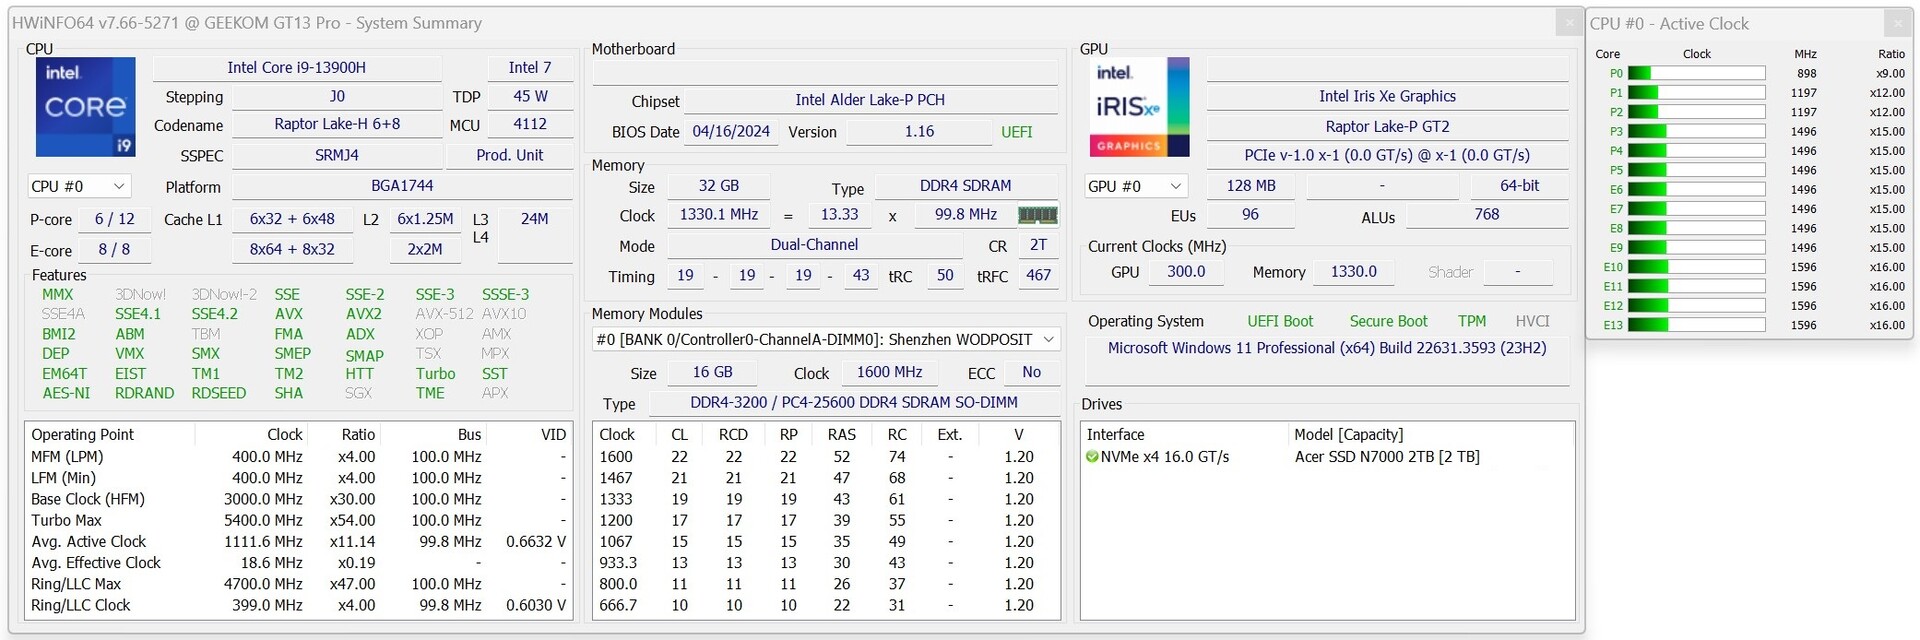
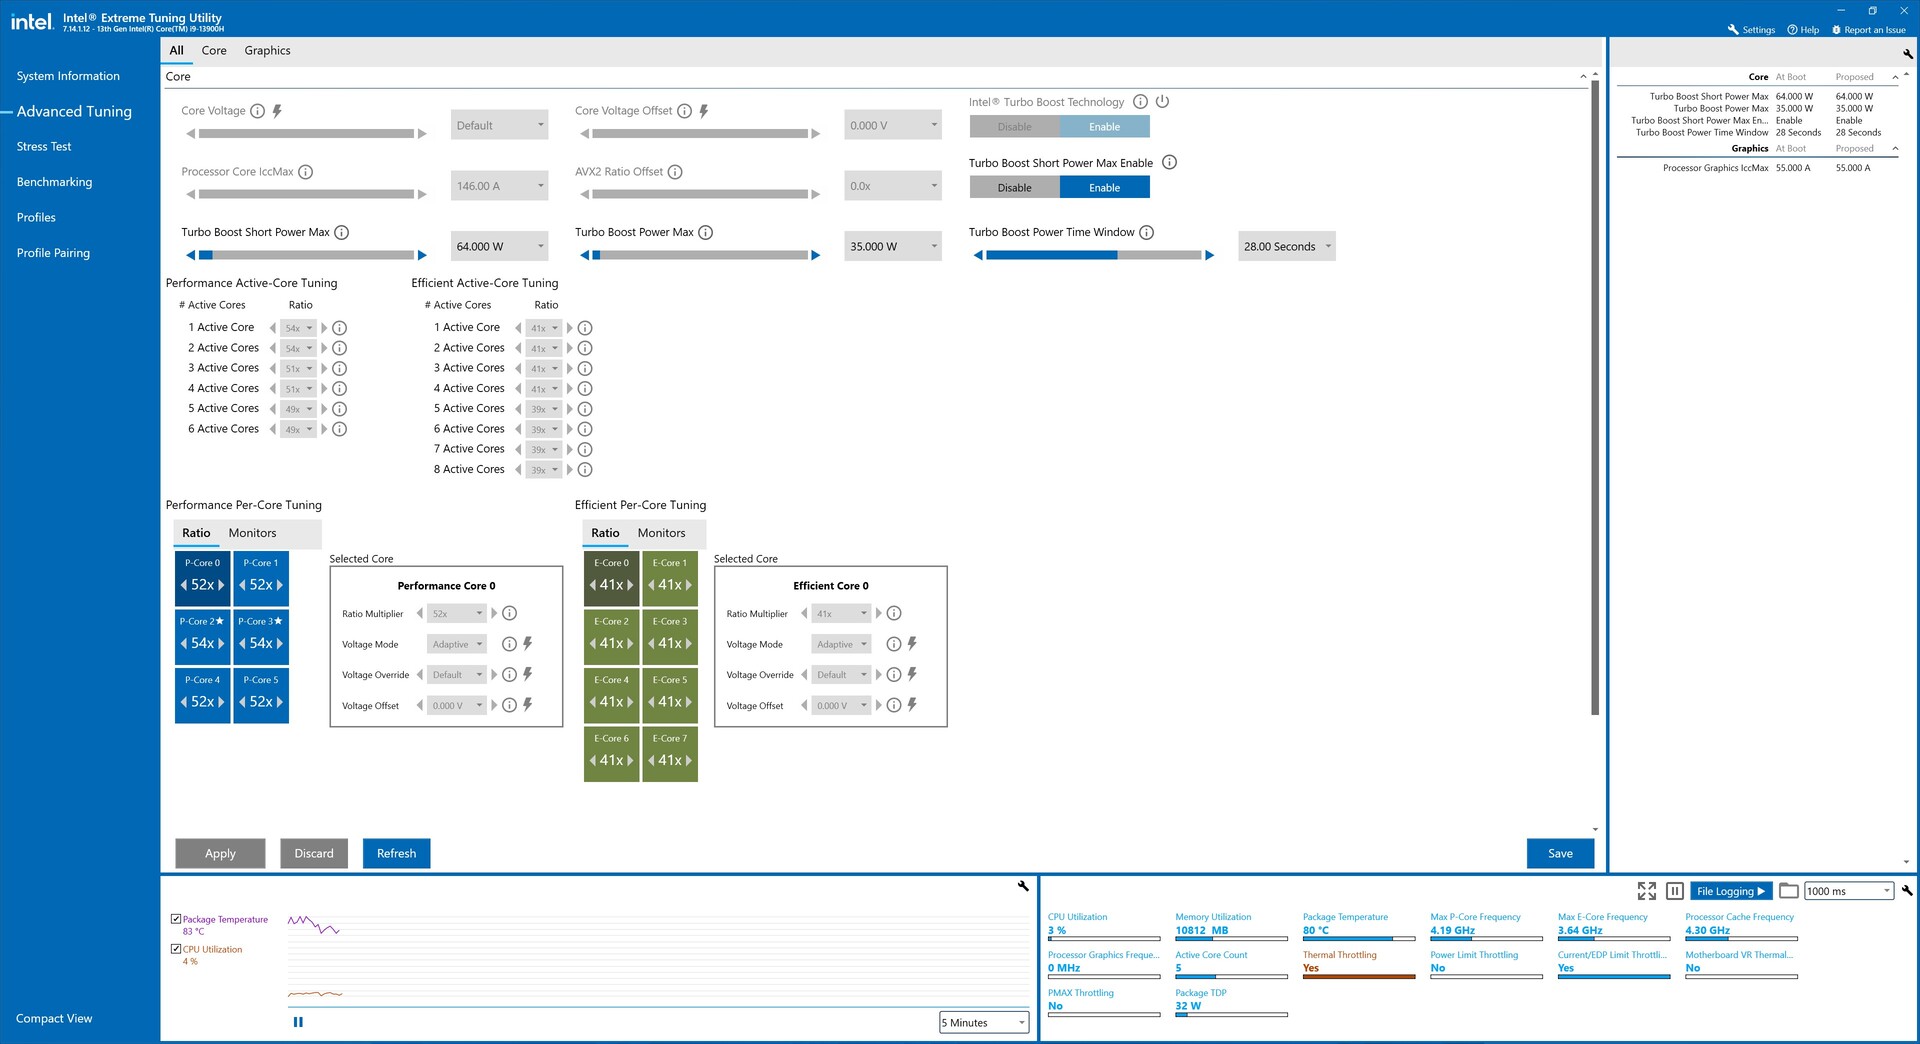
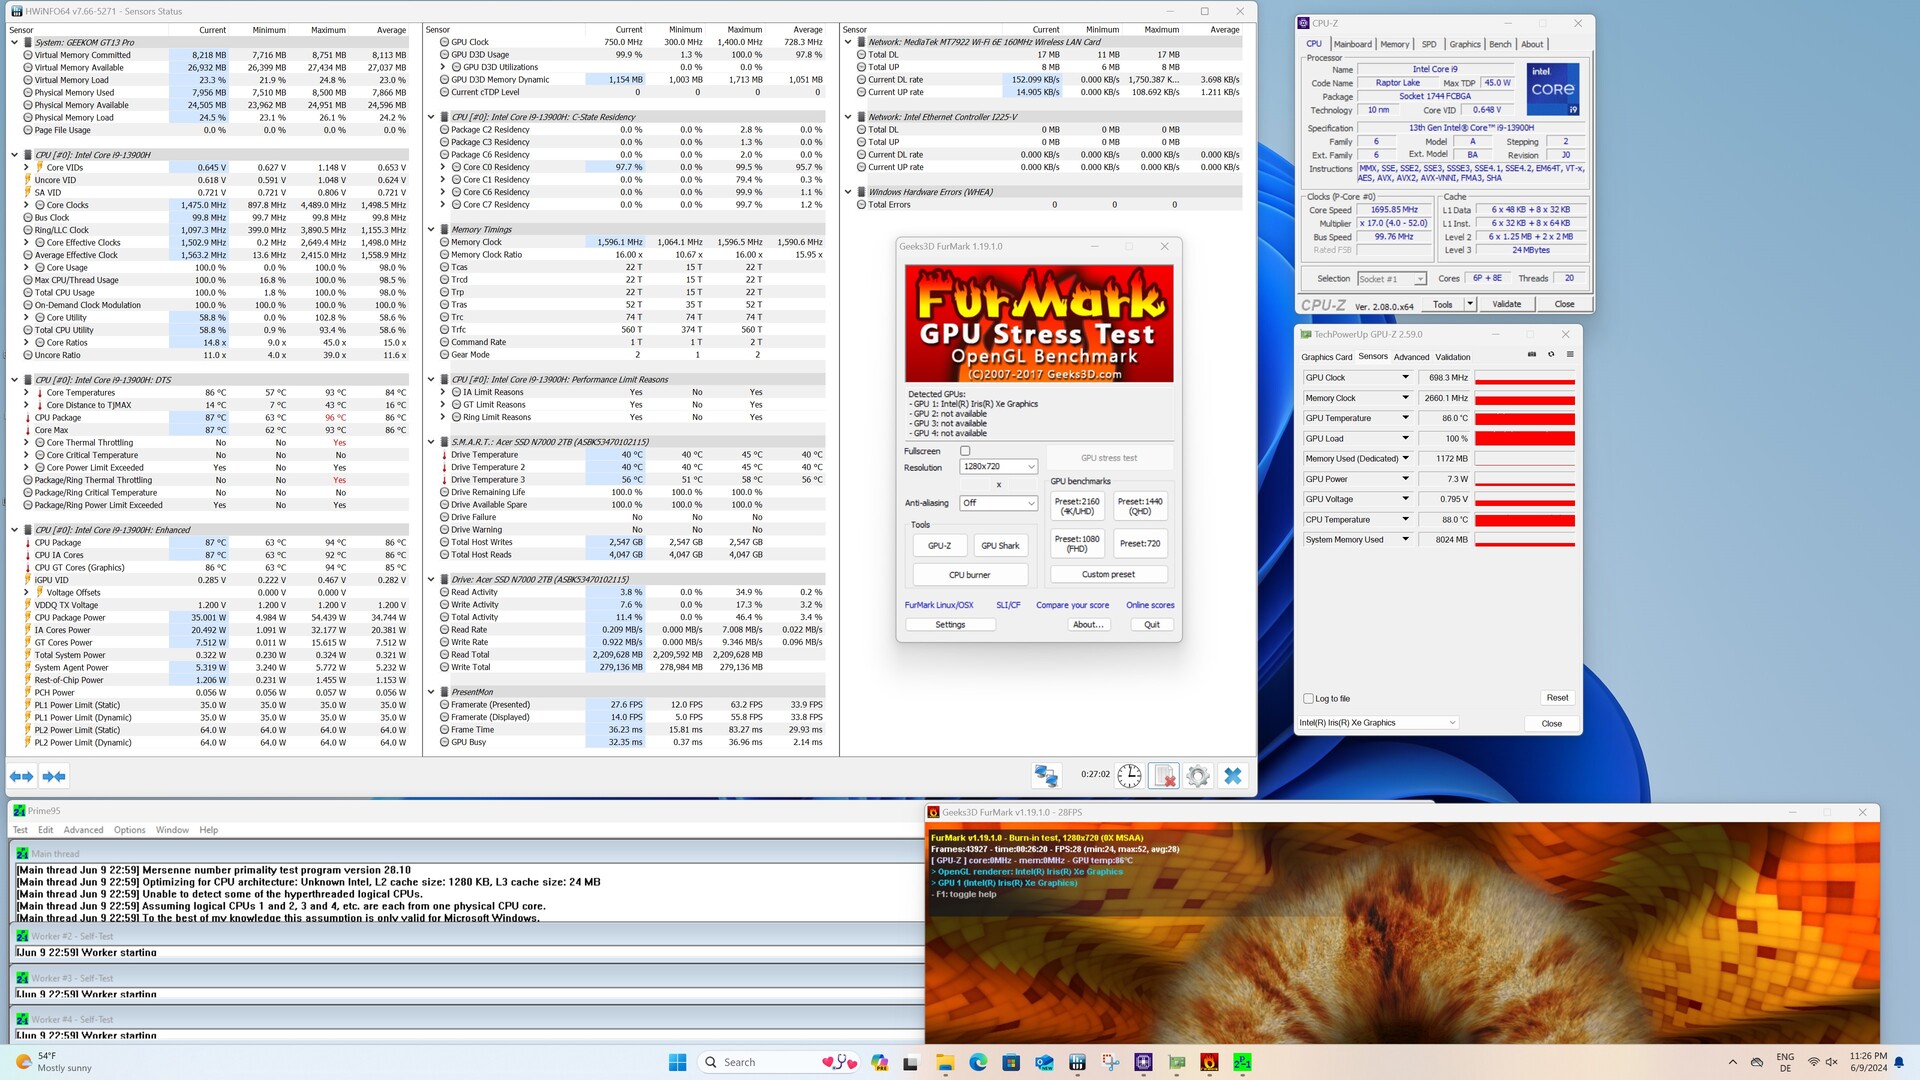
For all performance tests with the Geekom GT13 Pro, we use the "maximum performance" power plan. There were only deviations from this in the power consumption and noise measurements according to our Test criteria. The manufacturer's power limits for the Intel Core i9-13900H are defined as 64 watts (PL2) and 35 watts (PL1).
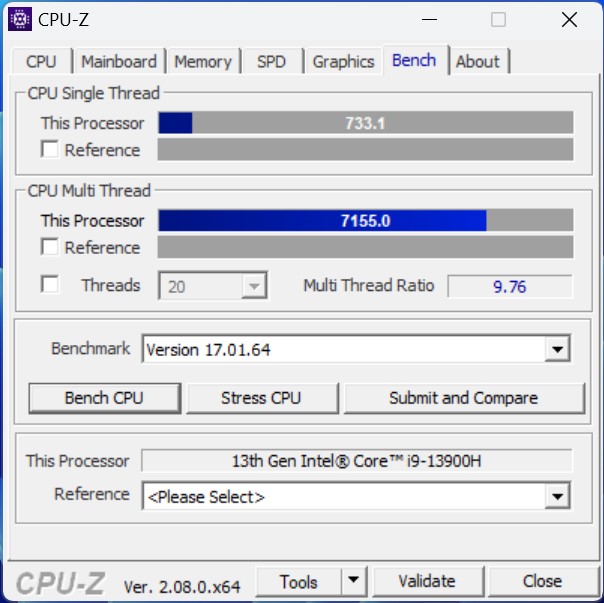
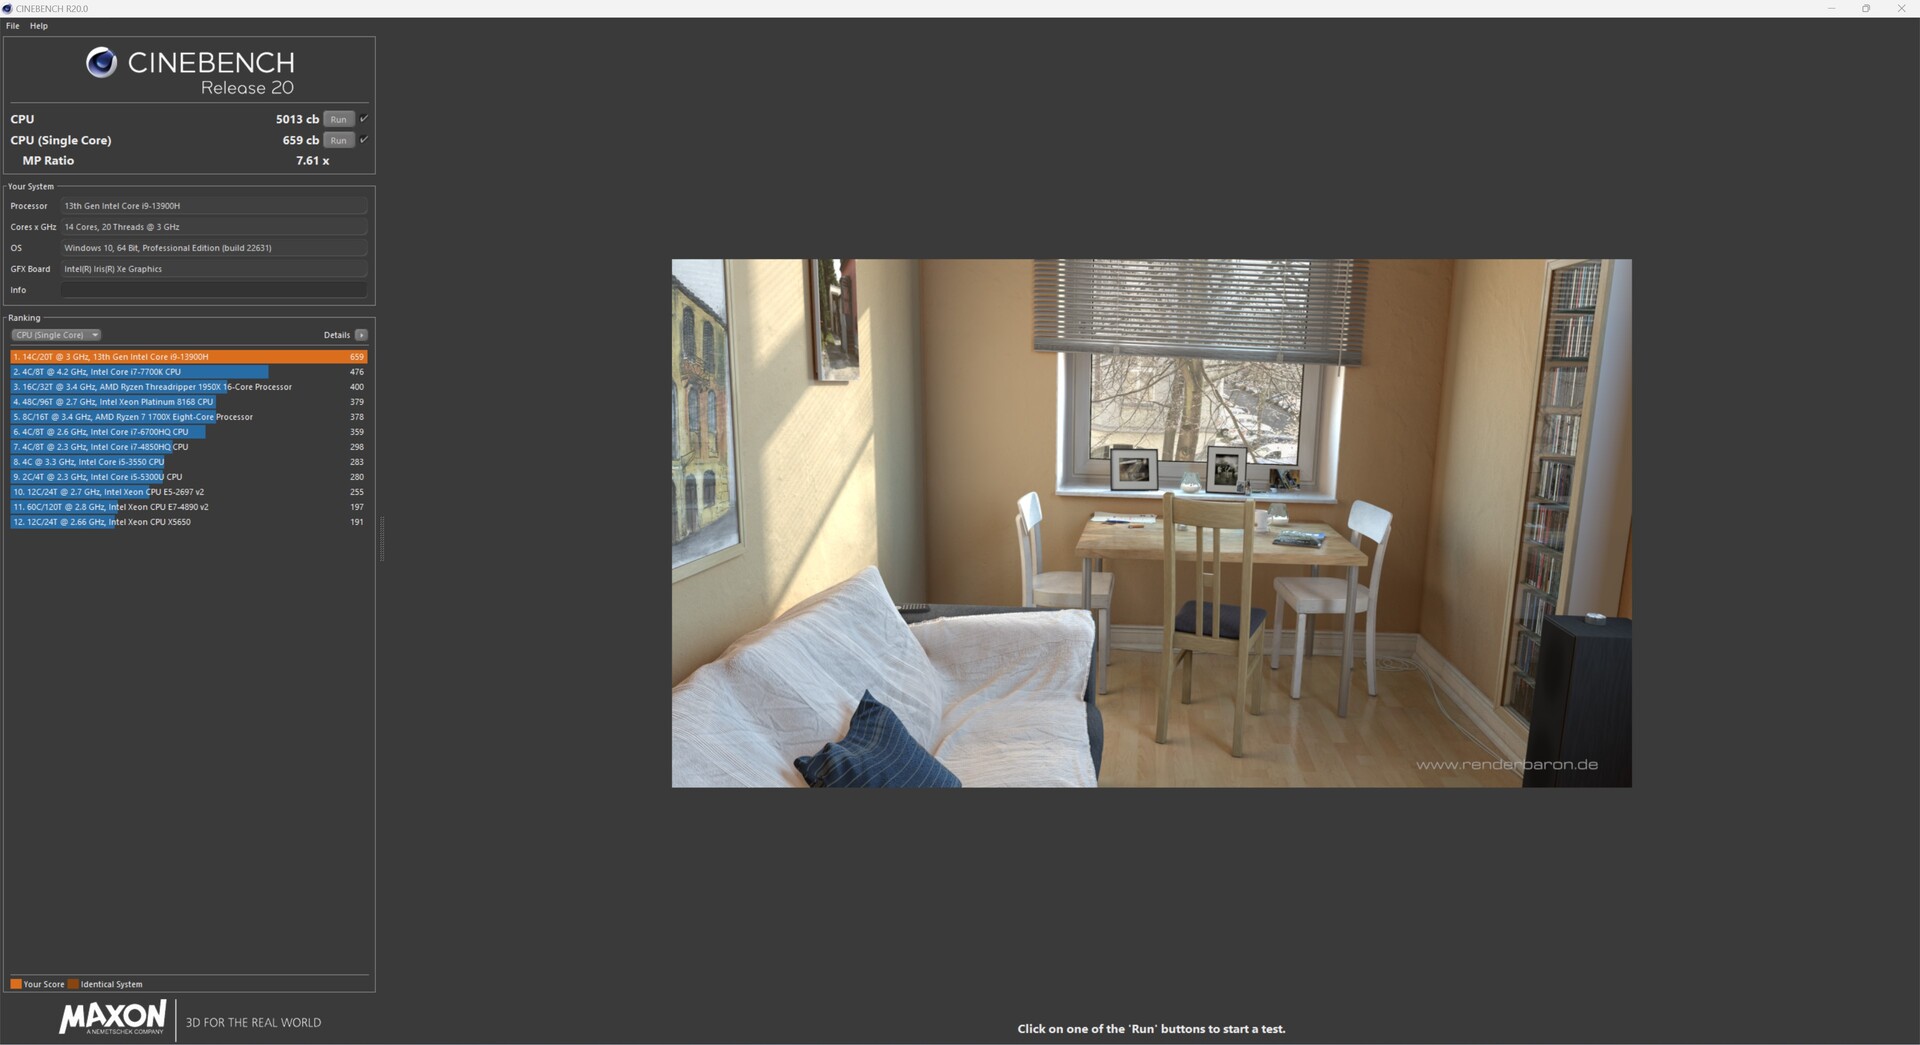
Processor
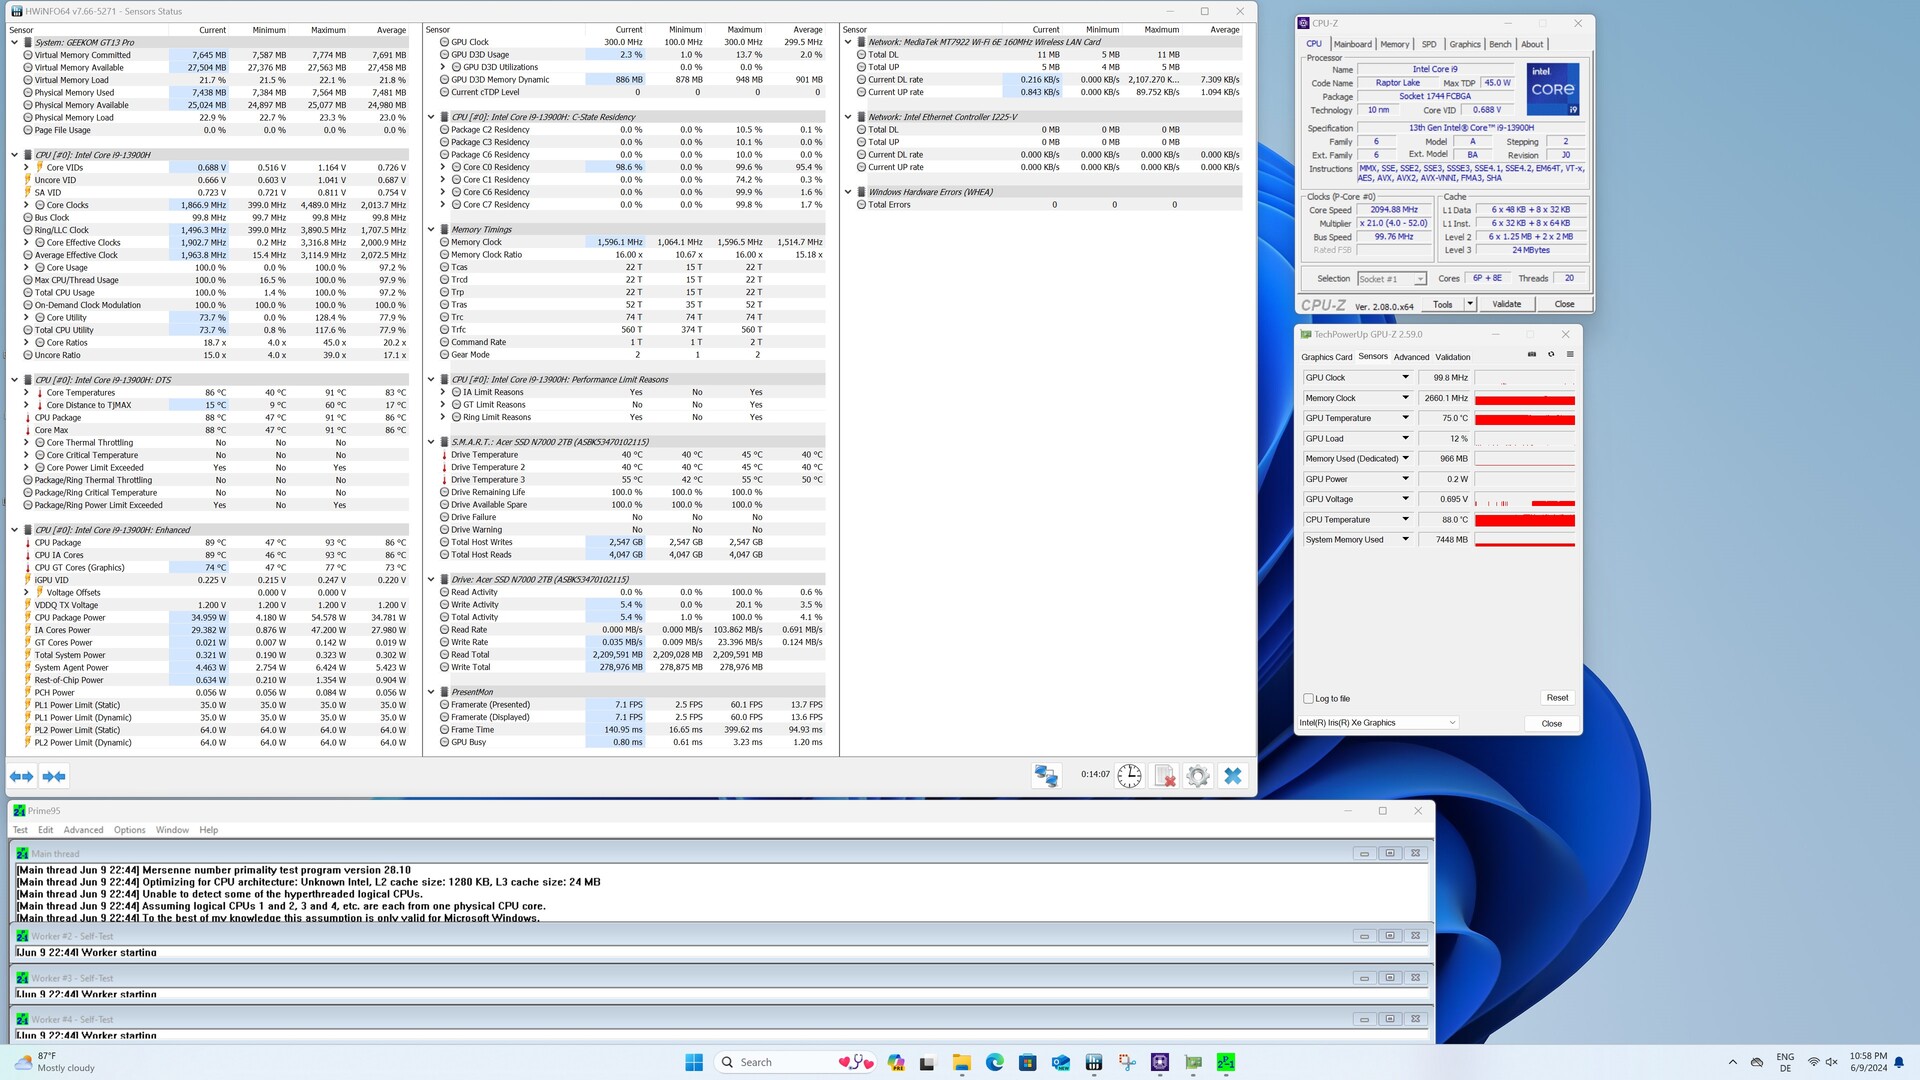
The top-of-the-range Geekom GT13 Pro comes with an Intel Core i9-13900H. In the performance rating, however, we can see that our test sample only ranks in the midfield. Due to the low cooling capacity, which goes hand in hand with the extremely compact design, the SoC can only be operated with a minimum TDP of just 35 watts under continuous load. This has the most serious effects in the multi-thread benchmarks, in which the Intel Core i9-13900H sometimes delivers 20 to 30 percent less performance than what we have documented on average for this processor to date.
For further comparisons and benchmarks, please refer to our CPU comparison table.
| Performance Rating - Percent | |
| Geekom A8 | |
| Minisforum EliteMini UM780 XTX | |
| Minisforum AtomMan X7 Ti | |
| Aoostar GEM12 | |
| Average Intel Core i9-13900H | |
| Acemagic F2A | |
| Geekom GT13 Pro | |
| Geekom XT12 Pro | |
| Khadas Mind | |
| WinRAR - Result | |
| Average Intel Core i9-13900H (6800 - 9303, n=2) | |
| Geekom XT12 Pro | |
| Minisforum AtomMan X7 Ti | |
| Geekom A8 | |
| Acemagic F2A | |
| Minisforum EliteMini UM780 XTX | |
| Aoostar GEM12 | |
| Geekom GT13 Pro | |
| Khadas Mind | |
| WebXPRT 3 - Overall | |
| Minisforum EliteMini UM780 XTX | |
| Khadas Mind | |
| Geekom A8 | |
| Geekom GT13 Pro | |
| Average Intel Core i9-13900H (171.4 - 340, n=19) | |
| Aoostar GEM12 | |
| Geekom XT12 Pro | |
| Acemagic F2A | |
| Minisforum AtomMan X7 Ti | |
* ... smaller is better
AIDA64: FP32 Ray-Trace | FPU Julia | CPU SHA3 | CPU Queen | FPU SinJulia | FPU Mandel | CPU AES | CPU ZLib | FP64 Ray-Trace | CPU PhotoWorxx
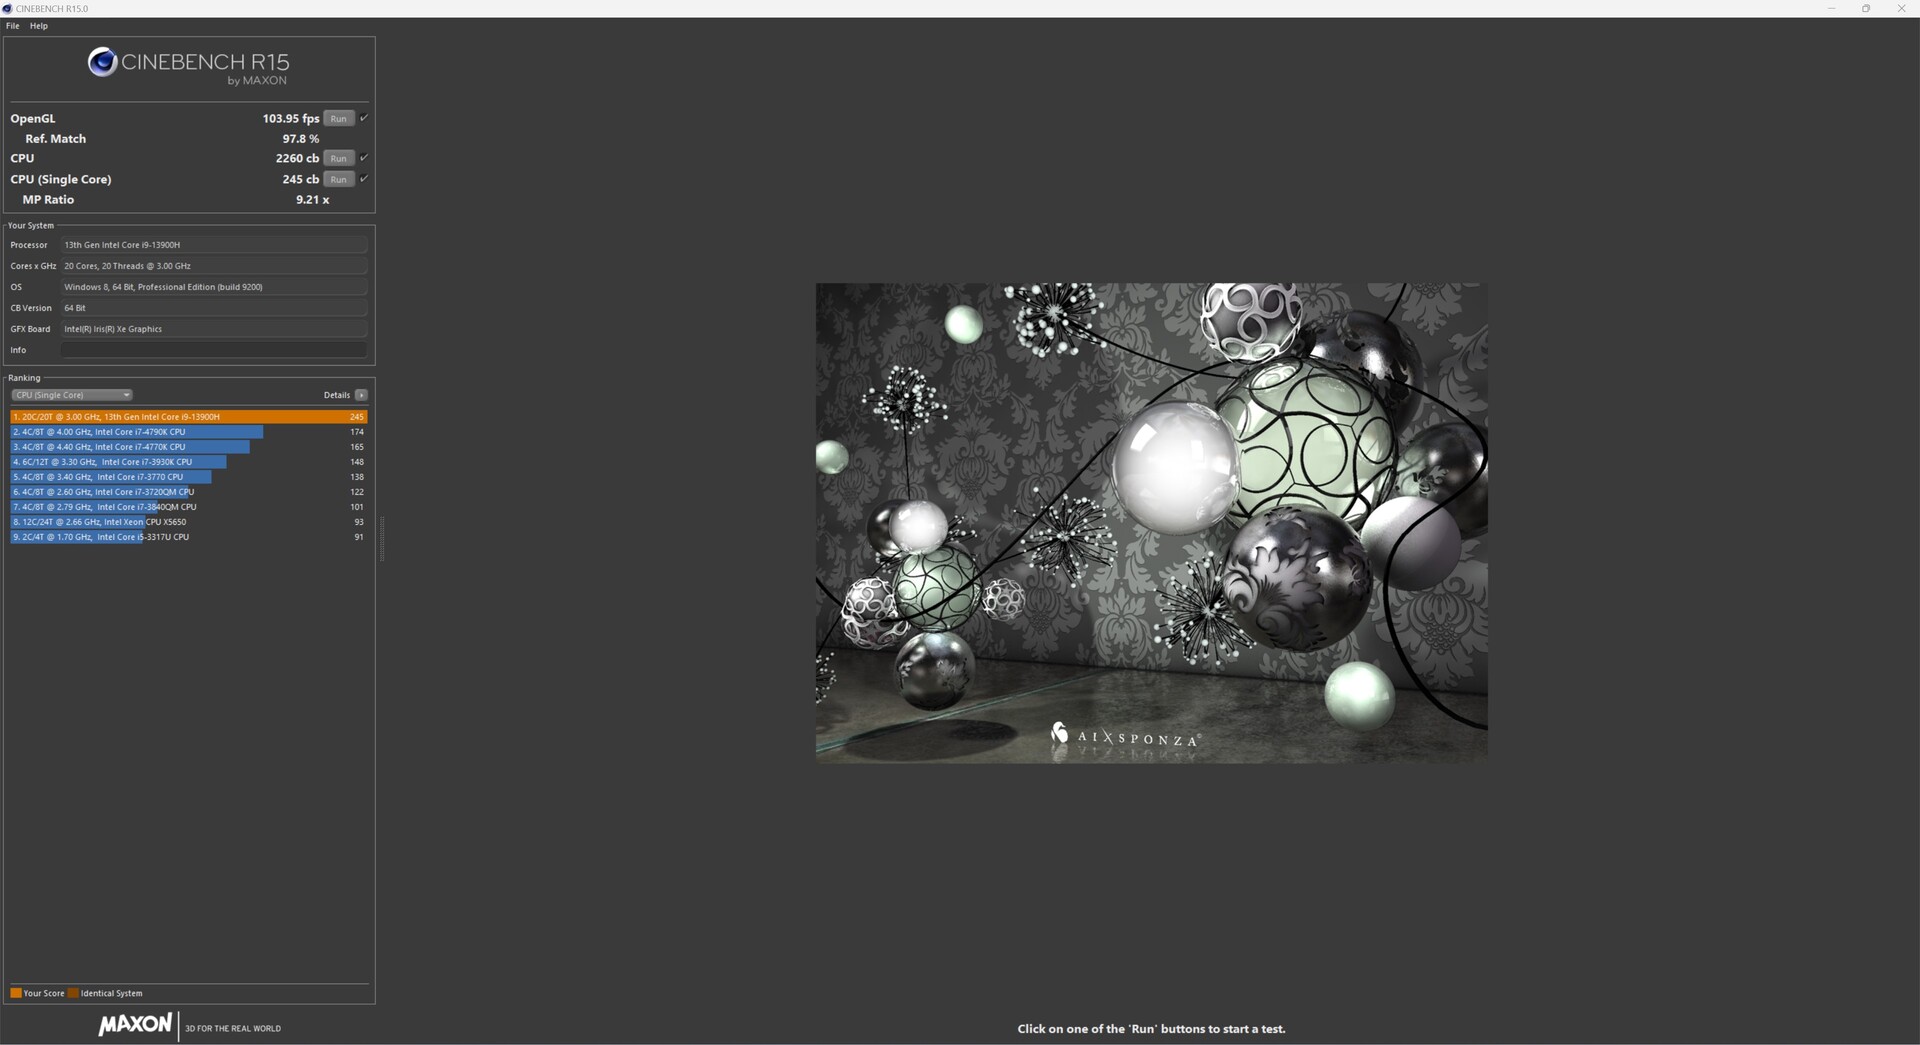
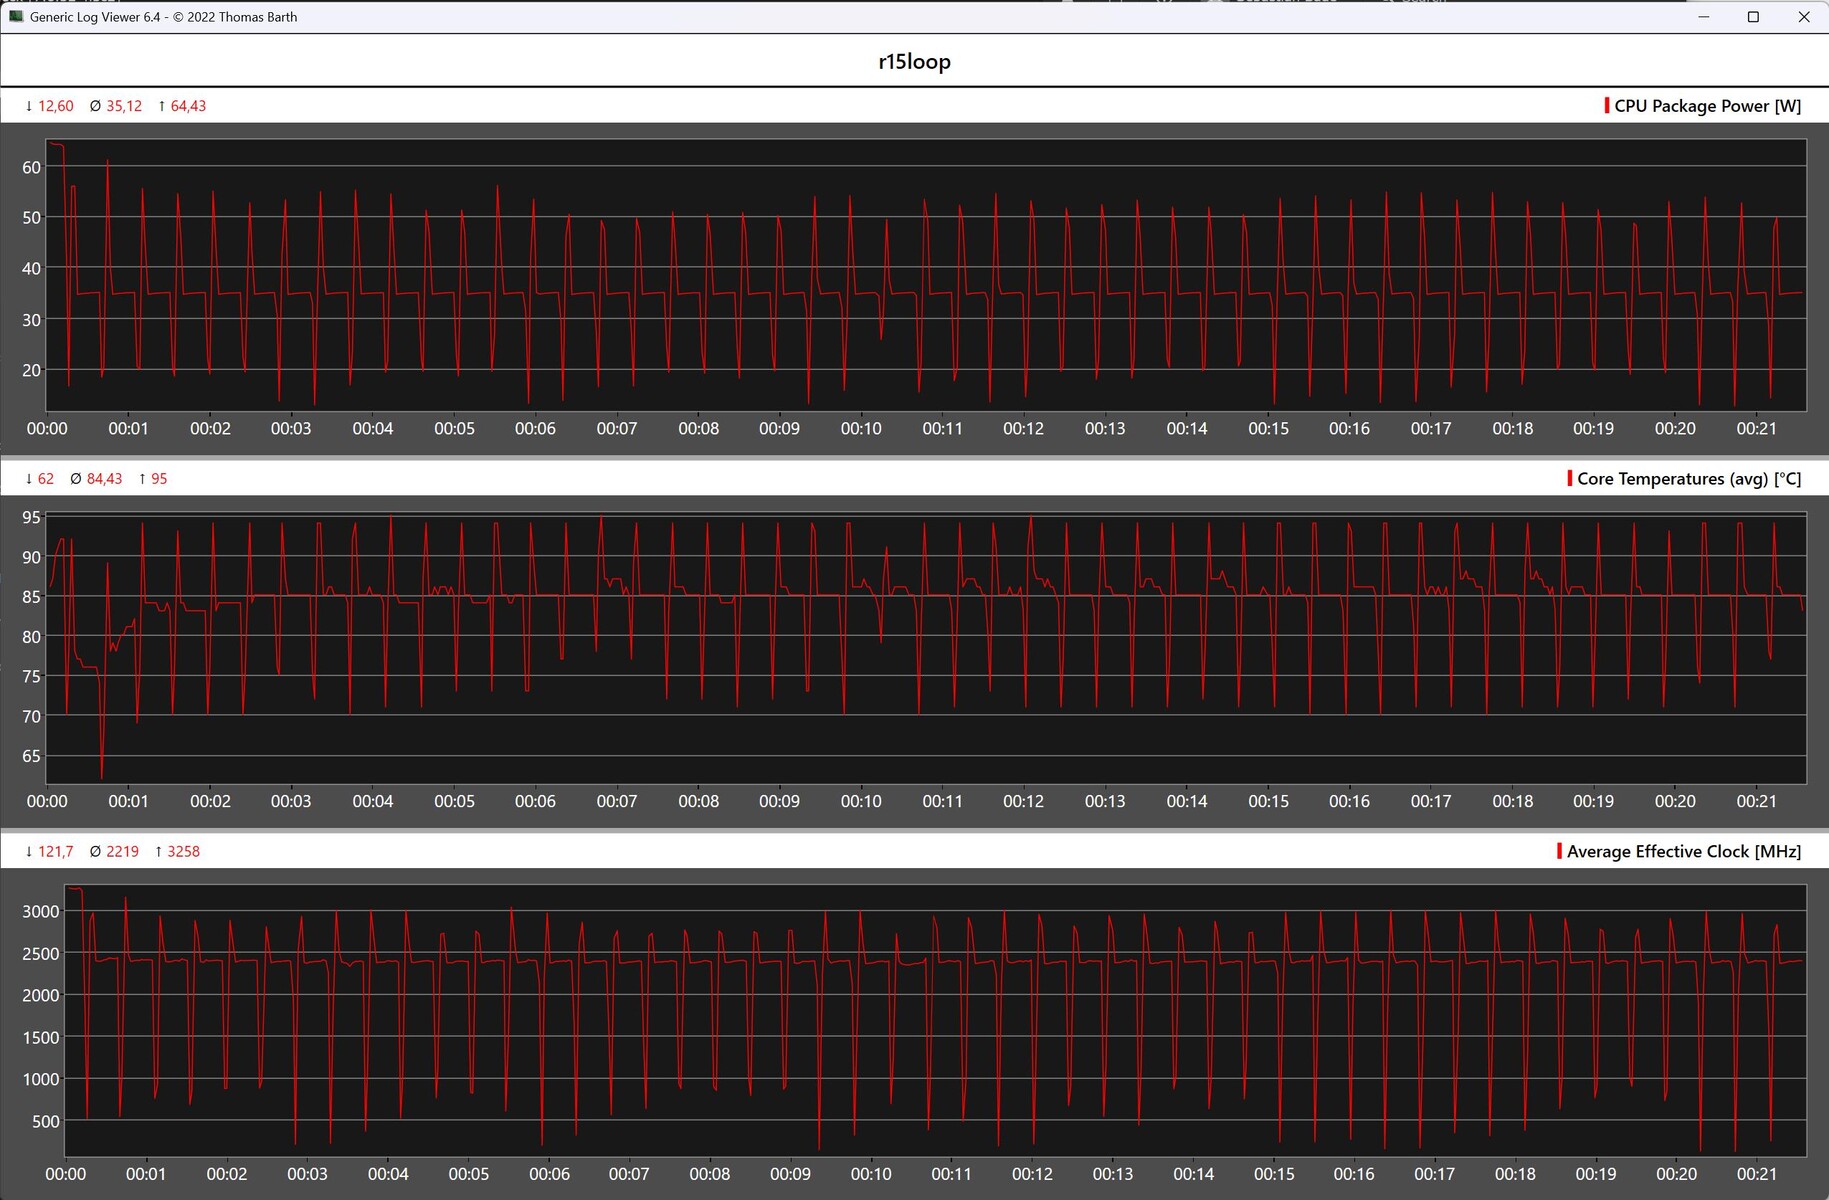
Cinebench R15 Multi loop
A look at the Cinebench R15 continuous loop shows that a significantly better result can be achieved at the start. During the first run, the Intel Core i9-13900H can maintain the PL2 value (64 watts) a little longer than in further runs. However, with a few exceptions, the SoC then delivers stable performance at a maximum of 35 watts.
System performance
On the whole, the Geekom GT13 Pro masters the system tests quite well. However, the test system has a hard time holding its own against its competitors. The performance losses, which are partly self-inflicted, most likely contribute to this result. Nevertheless, the performance in everyday tasks is at a good level. The generous working memory and fast mass storage make for a subjectively well-performing system.
| AIDA64 / Memory Copy | |
| Minisforum AtomMan X7 Ti | |
| Geekom A8 | |
| Aoostar GEM12 | |
| Minisforum EliteMini UM780 XTX | |
| Khadas Mind | |
| Acemagic F2A | |
| Geekom XT12 Pro | |
| Geekom GT13 Pro | |
| Average of class Mini PC (6481 - 71990, n=110, last 2 years) | |
| AIDA64 / Memory Read | |
| Minisforum AtomMan X7 Ti | |
| Acemagic F2A | |
| Minisforum EliteMini UM780 XTX | |
| Geekom A8 | |
| Aoostar GEM12 | |
| Khadas Mind | |
| Geekom XT12 Pro | |
| Geekom GT13 Pro | |
| Average of class Mini PC (6914 - 75449, n=110, last 2 years) | |
| AIDA64 / Memory Write | |
| Geekom A8 | |
| Minisforum EliteMini UM780 XTX | |
| Aoostar GEM12 | |
| Khadas Mind | |
| Minisforum AtomMan X7 Ti | |
| Acemagic F2A | |
| Average of class Mini PC (6862 - 89318, n=110, last 2 years) | |
| Geekom XT12 Pro | |
| Geekom GT13 Pro | |
| AIDA64 / Memory Latency | |
| Acemagic F2A | |
| Minisforum AtomMan X7 Ti | |
| Minisforum EliteMini UM780 XTX | |
| Geekom A8 | |
| Khadas Mind | |
| Aoostar GEM12 | |
| Average of class Mini PC (44.9 - 154.6, n=110, last 2 years) | |
| Geekom GT13 Pro | |
| Geekom XT12 Pro | |
* ... smaller is better
DPC latencies
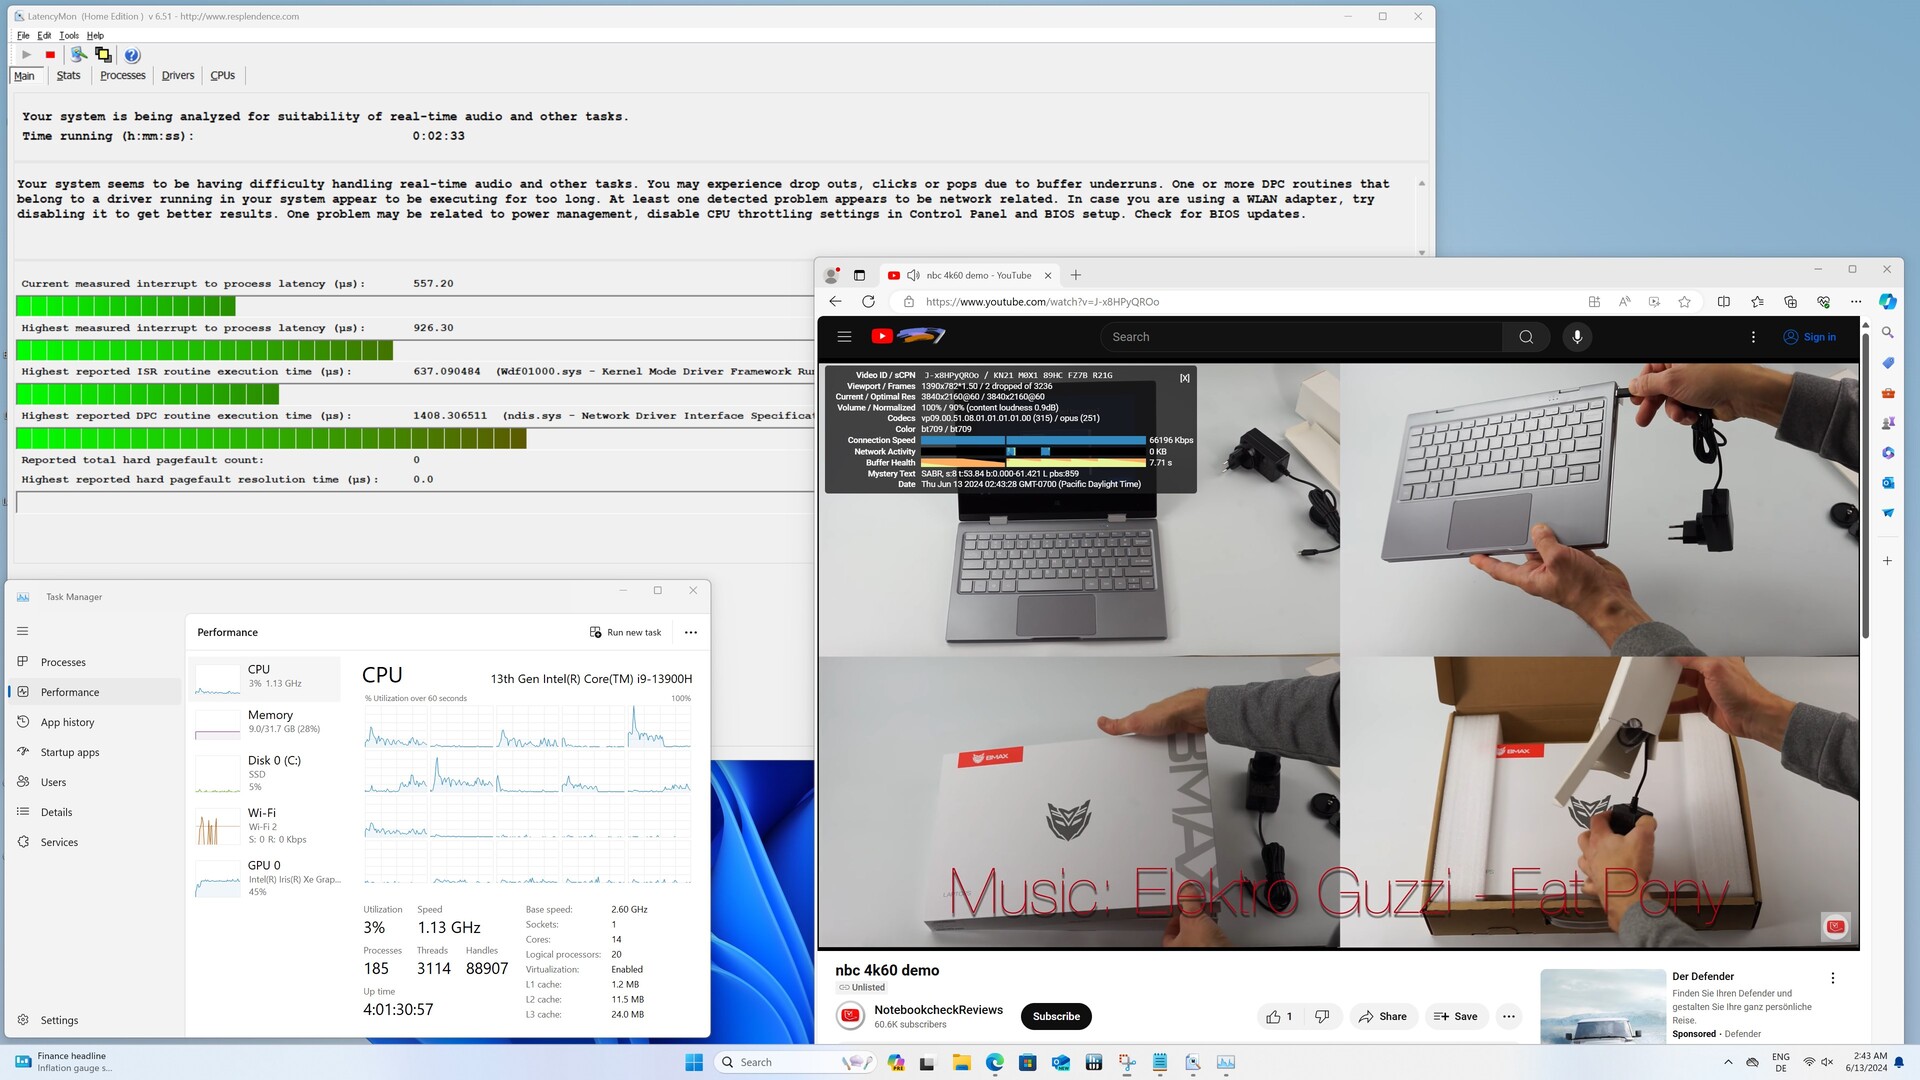
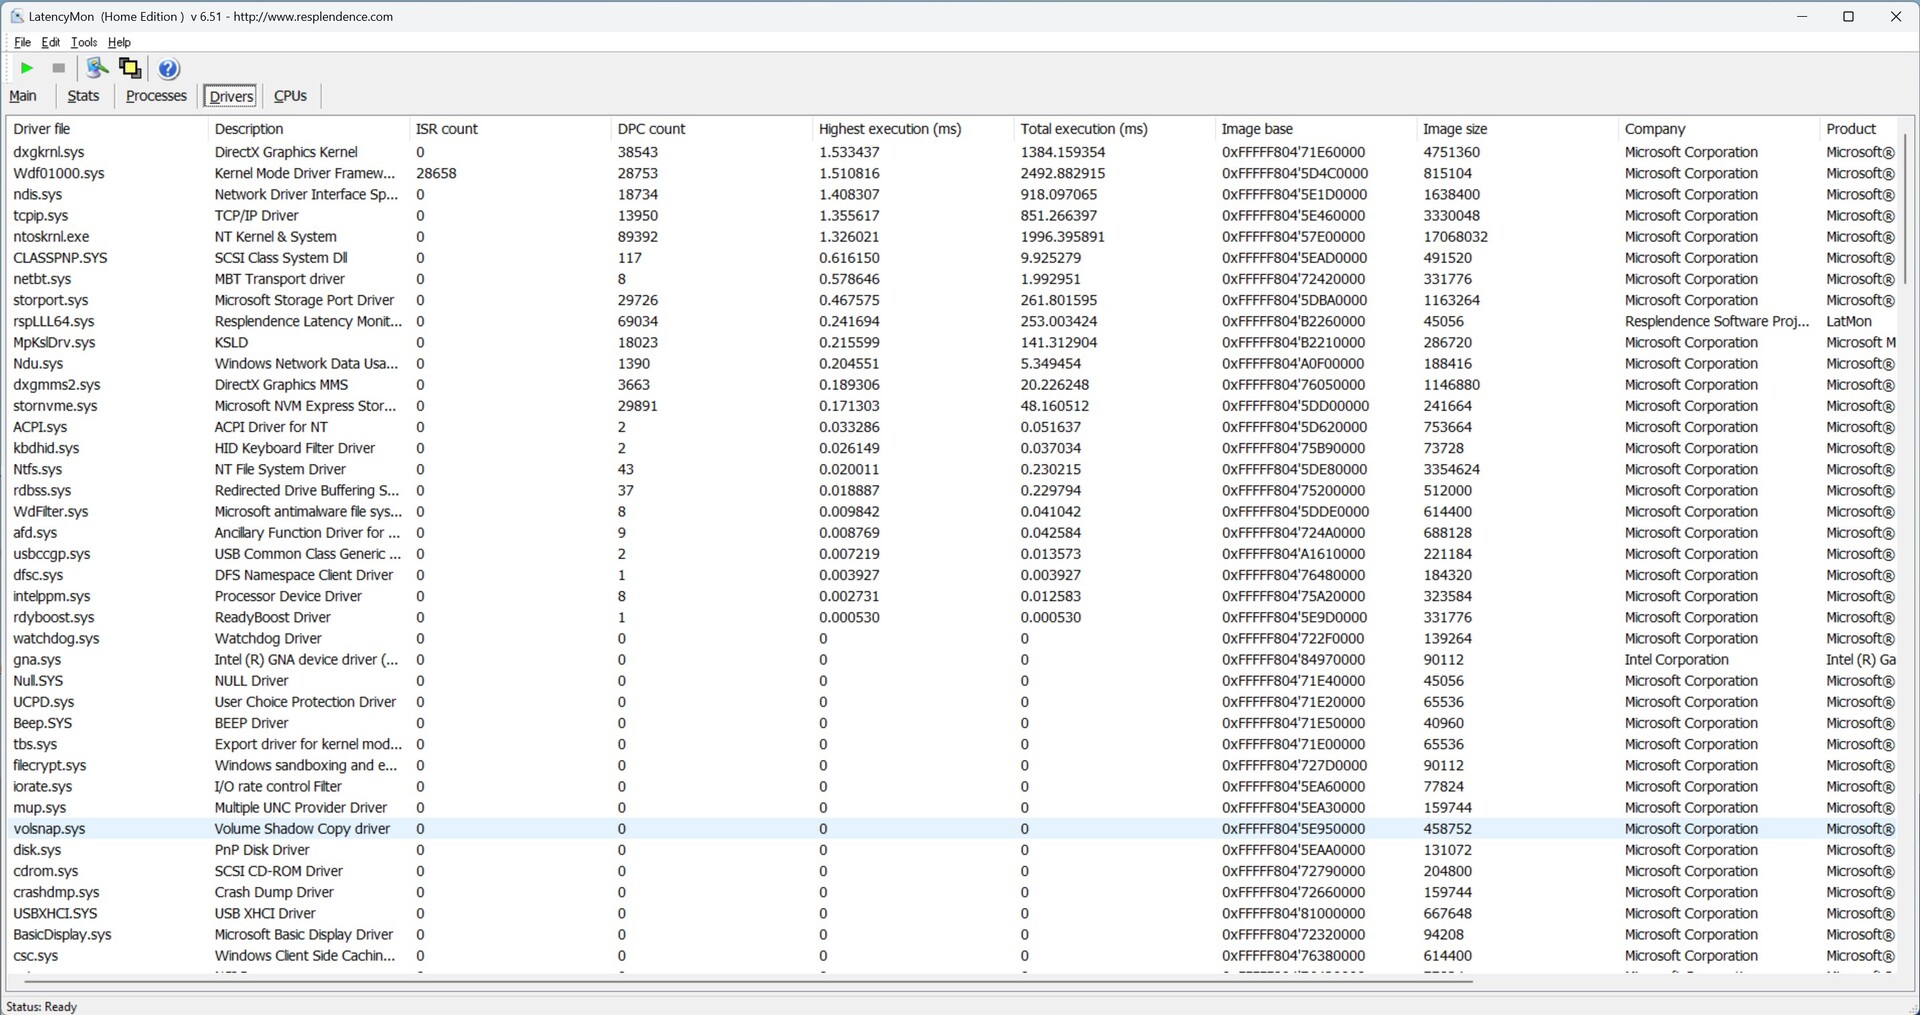
Unfortunately, the Geekom GT13 Pro does not achieve optimal DPC latencies. We already document increased latencies when surfing the Internet, which increase slightly again when playing the 4K test video. Only two dropped frames are okay and in no way reduce the quality as a streaming client. At the same time, the iGPU is loaded with around 45 percent.

| DPC Latencies / LatencyMon - interrupt to process latency (max), Web, Youtube, Prime95 | |
| Acemagic F2A | |
| Geekom XT12 Pro | |
| Geekom A8 | |
| Minisforum AtomMan X7 Ti | |
| Geekom GT13 Pro | |
| Minisforum EliteMini UM780 XTX | |
| Aoostar GEM12 | |
| Khadas Mind | |
* ... smaller is better
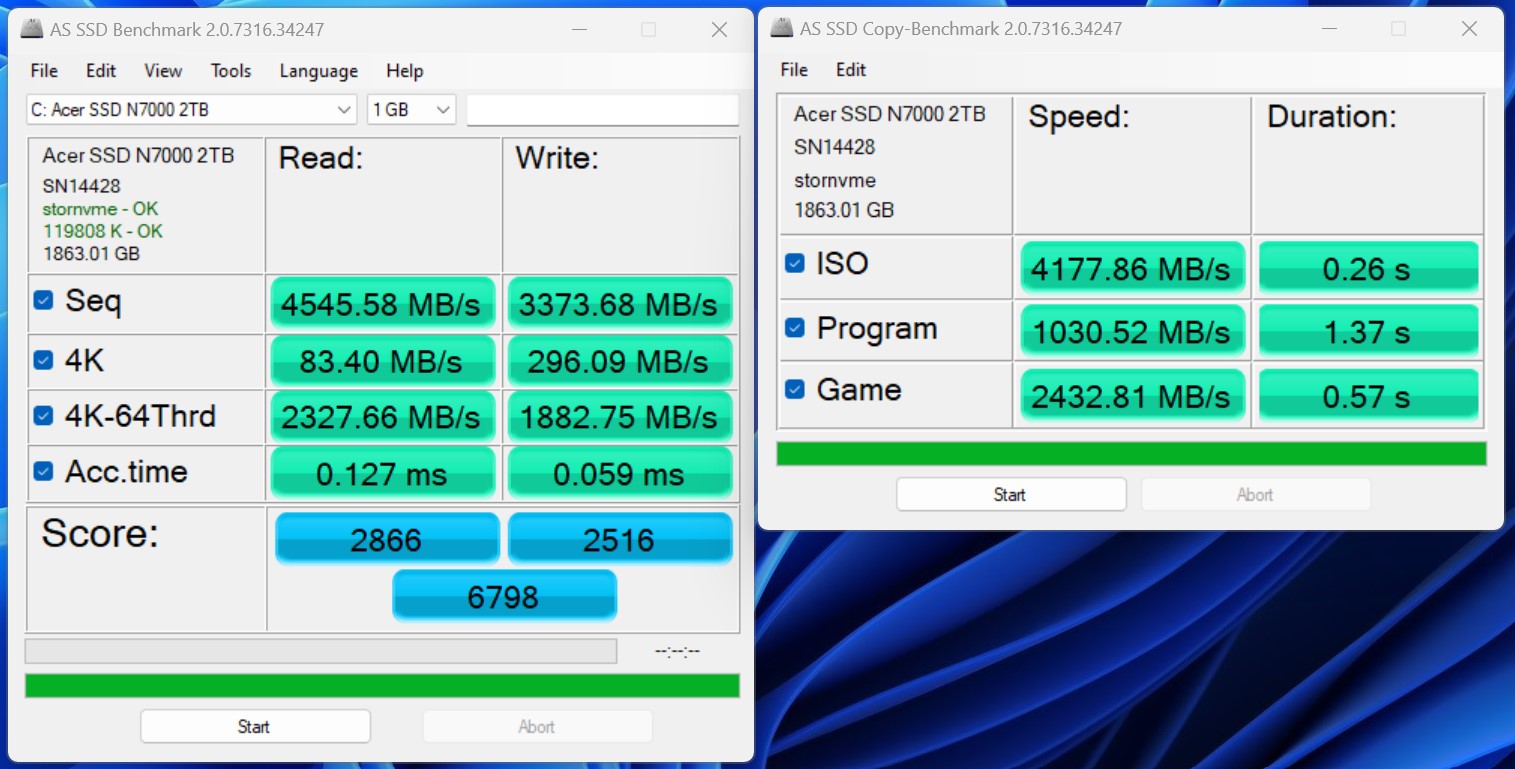
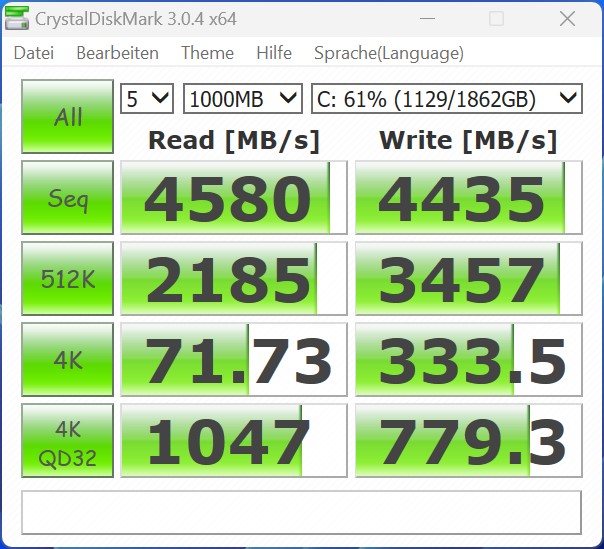
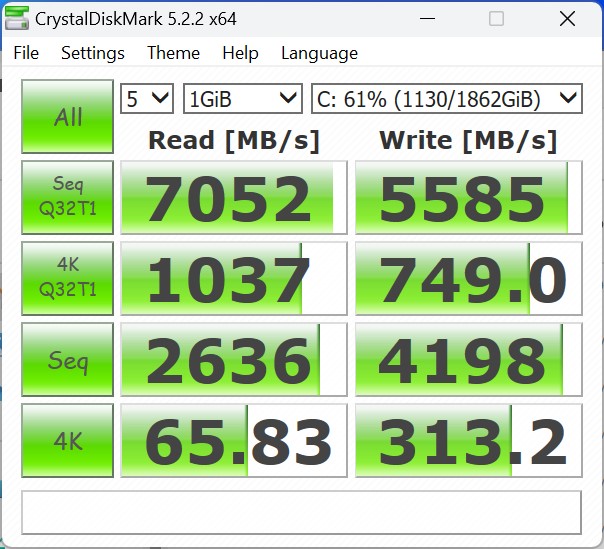
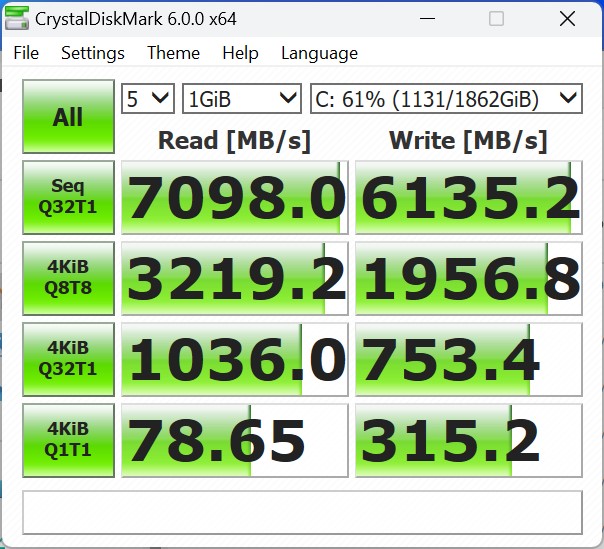
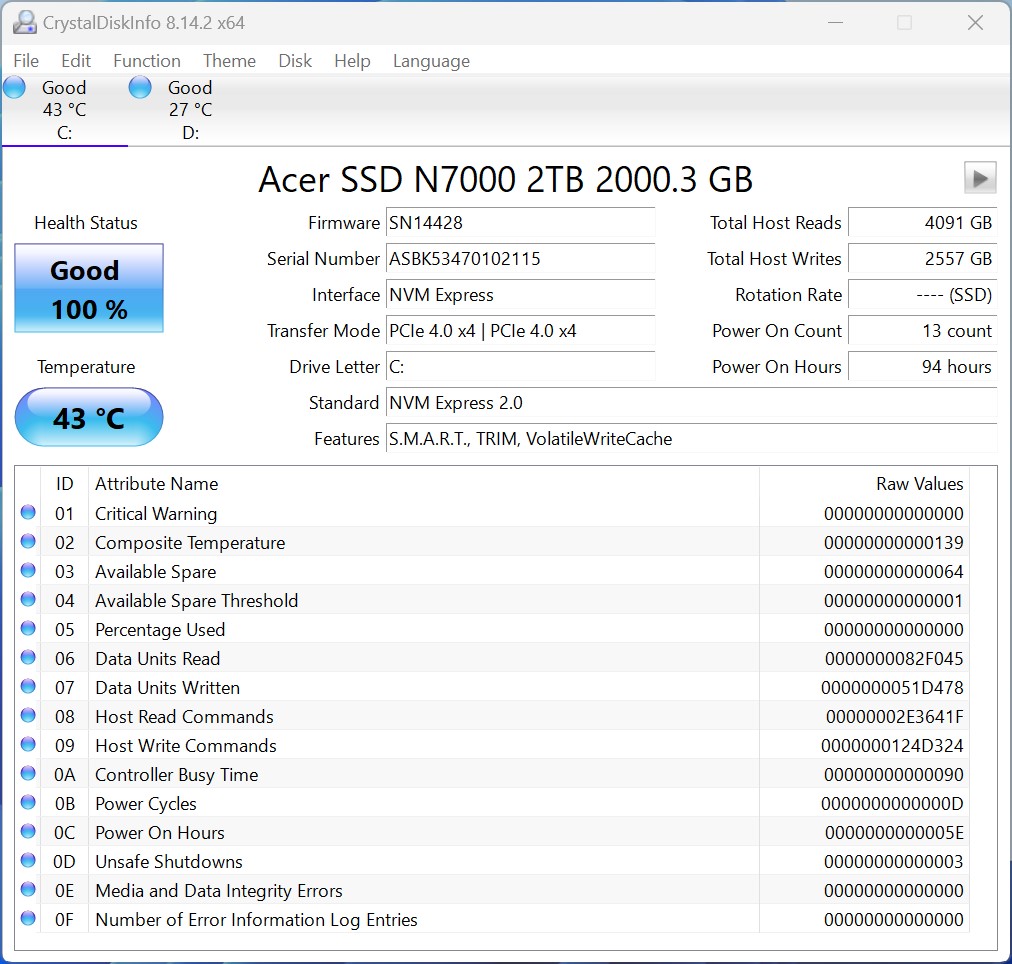
Mass storage
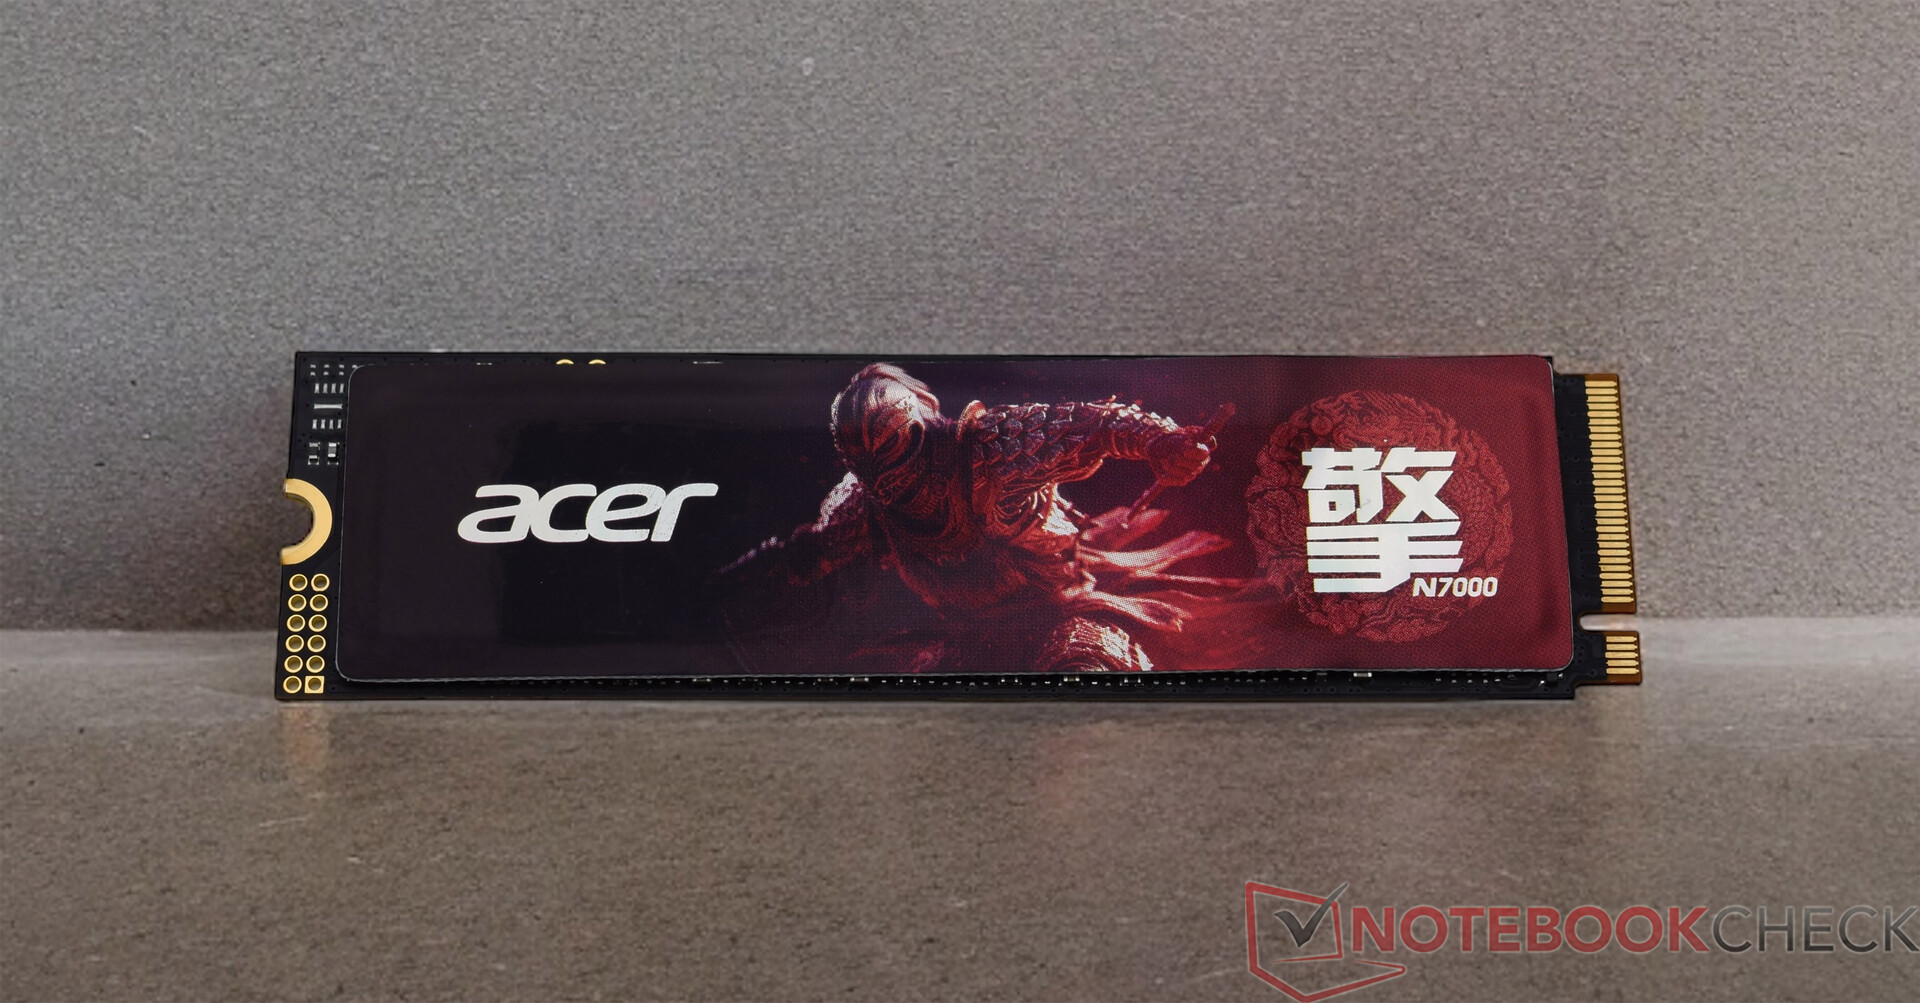
With 2 TB of storage space, the Geekom GT13 Pro is excellently equipped and offers sufficient storage space for many apps. An SSD from Acer is installed, which is impressive in terms of performance. The documented results are enough to put it behind the Aoostar GEM12 to secure second place in our rating. However, the SSD has problems maintaining its high level of performance under continuous load. Although the manufacturer has installed passive cooling for the SSD, this is ultimately not quite enough to keep the performance stable. Compared to the initial values, the read rate drops by almost 50 percent. However, this is not a total failure, as can be seen from the graph of continuous performance. At just under 4,000 MB/s, the Acer N7000 is still faster than the mass storage devices of other mini-PCs. A total of two SSDs can be installed in the Geekom GT13 Pro. However, it should be noted that the second M.2 slot only supports SATA SSDs with a length of 42 millimeters.
For further comparisons and benchmarks, please refer to our Comparison table.

| Drive Performance Rating - Percent | |
| Aoostar GEM12 | |
| Geekom GT13 Pro | |
| Khadas Mind | |
| Geekom XT12 Pro | |
| Minisforum EliteMini UM780 XTX | |
| Minisforum AtomMan X7 Ti | |
| Geekom A8 | |
| Acemagic F2A | |
| Average of class Mini PC | |
* ... smaller is better
Continuous read: DiskSpd Read Loop, Queue Depth 8
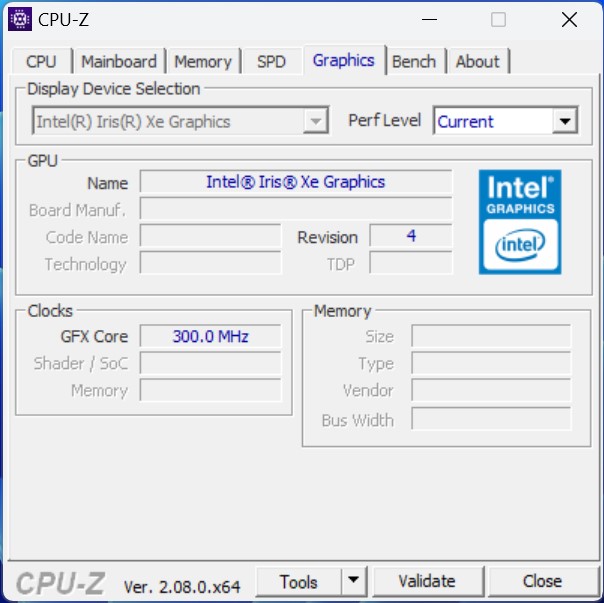
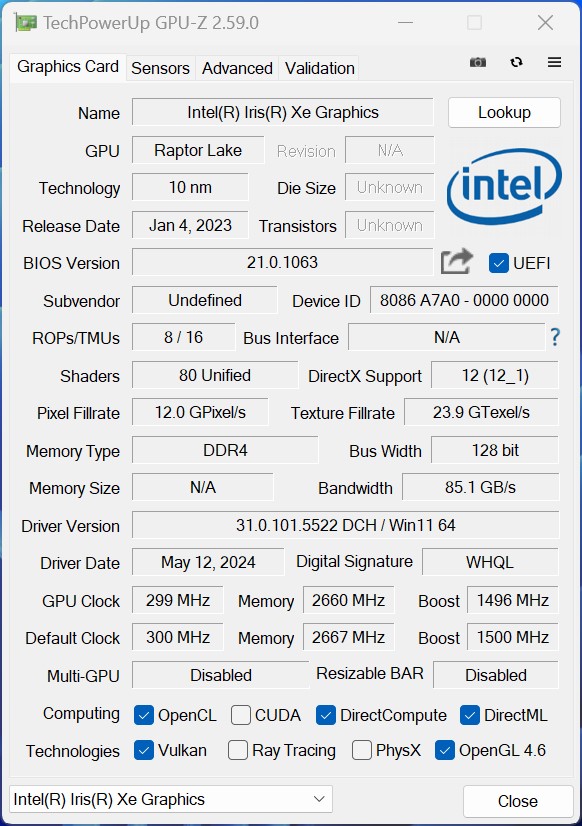
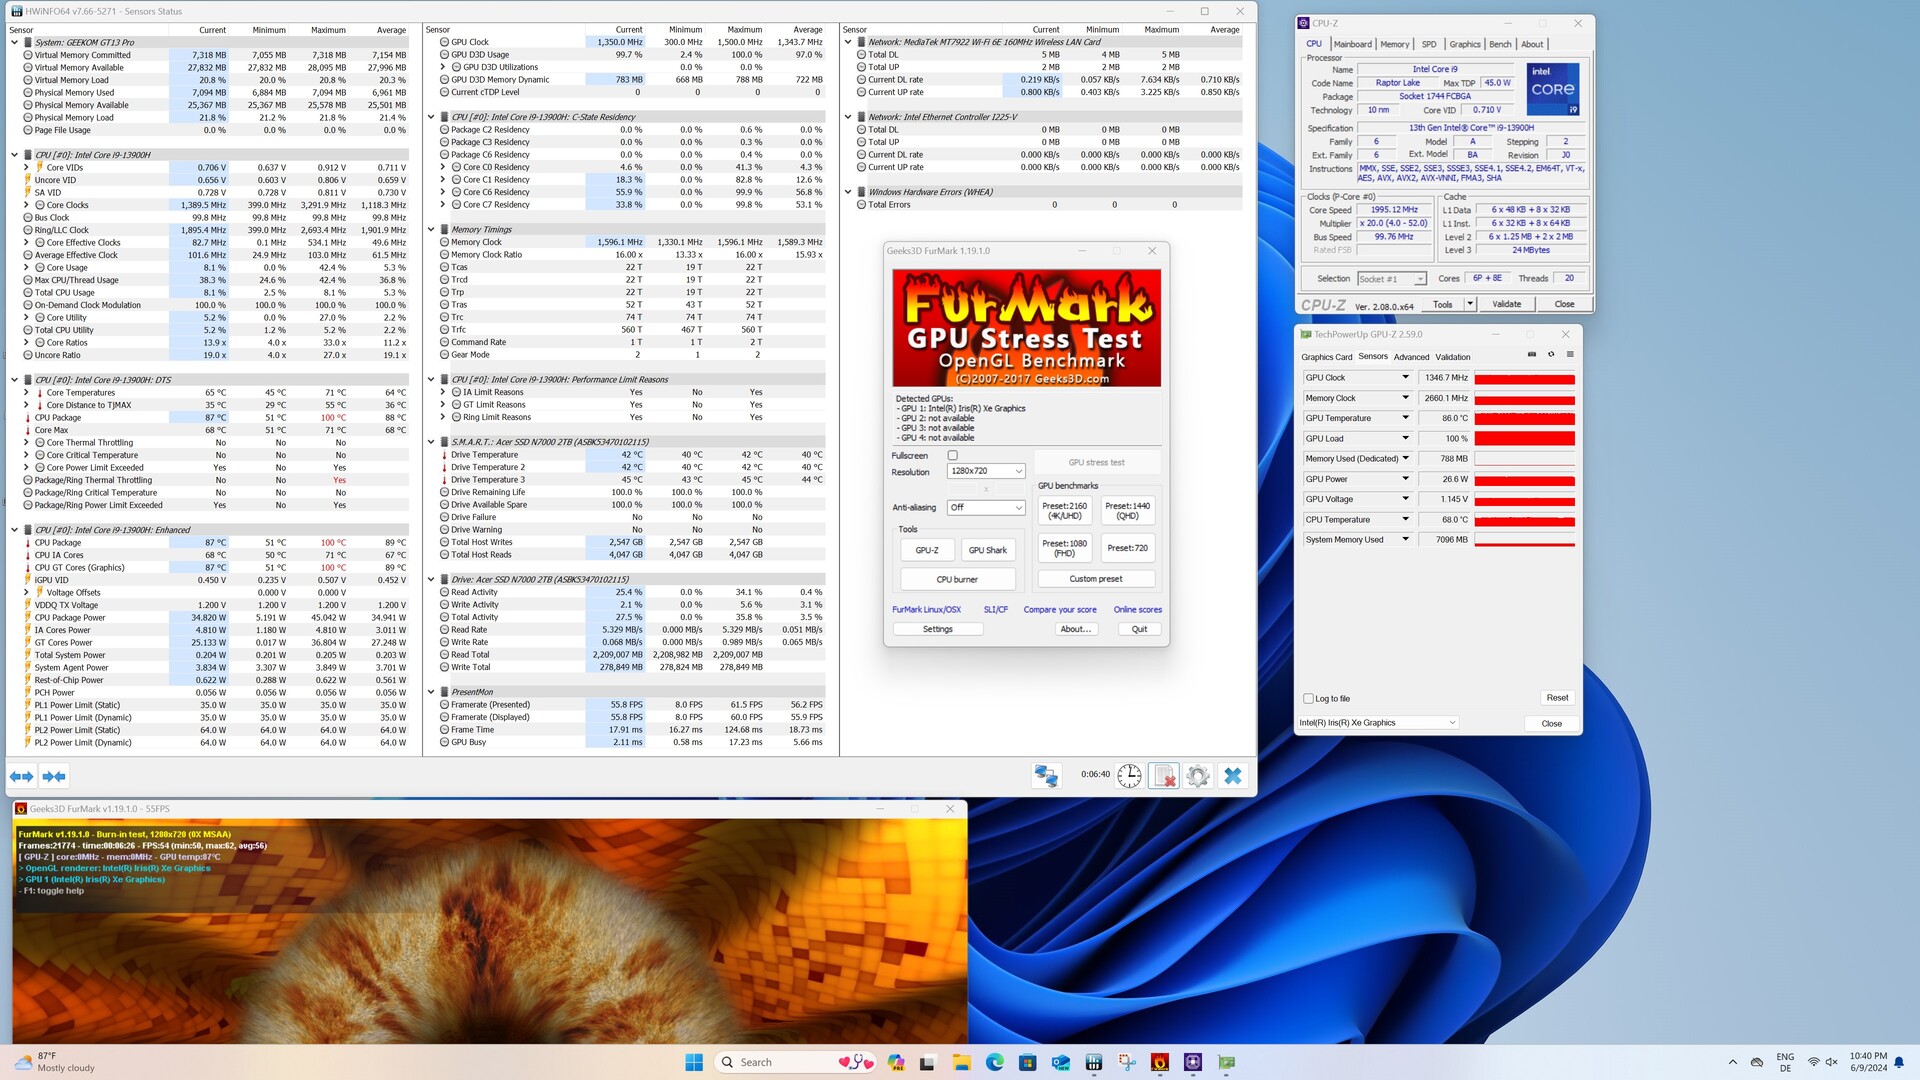
Graphics card
The choice of processor has a significant impact on 3D performance. As Geekom has opted for an Intel Core i9-13900H, the iGPU is only the Intel Iris Xe Graphics G7. Nevertheless, the graphics adapter with 96 EUs is used in the highest configuration level. However, the Intel Iris Xe Graphics G7 can no longer keep up with the newer iGPUs of the Meteor Lake models. We see almost two classes in the ranking. All the devices equipped with the Intel Iris Xe Graphics G7 are in the lower third. The performance between the devices is almost identical. All other devices that can compete with more modern and more powerful iGPUs (Intel Arc 8 and AMD Radeon 780) can clearly set themselves apart.
For further comparisons and benchmarks, please refer to our GPU comparison table.
| 3DMark Performance Rating - Percent | |
| Geekom A8 | |
| Minisforum EliteMini UM780 XTX | |
| Aoostar GEM12 | |
| Acemagic F2A | |
| Minisforum AtomMan X7 Ti | |
| Geekom GT13 Pro | |
| Khadas Mind | |
| Geekom XT12 Pro | |
| 3DMark 11 - 1280x720 Performance GPU | |
| Geekom A8 | |
| Aoostar GEM12 | |
| Minisforum EliteMini UM780 XTX | |
| Acemagic F2A | |
| Minisforum AtomMan X7 Ti | |
| Geekom GT13 Pro | |
| Geekom XT12 Pro | |
| Khadas Mind | |
| Unigine Valley 1.0 | |
| 1920x1080 Extreme HD DirectX AA:x8 | |
| Aoostar GEM12 | |
| Minisforum EliteMini UM780 XTX | |
| Geekom A8 | |
| Minisforum AtomMan X7 Ti | |
| Khadas Mind | |
| Acemagic F2A | |
| Geekom GT13 Pro | |
| Geekom XT12 Pro | |
| 1920x1080 Extreme HD Preset OpenGL AA:x8 | |
| Minisforum AtomMan X7 Ti | |
| Aoostar GEM12 | |
| Minisforum EliteMini UM780 XTX | |
| Khadas Mind | |
| Acemagic F2A | |
| Geekom GT13 Pro | |
| Geekom A8 | |
| Geekom XT12 Pro | |
| Affinity Photo 2 - Combined (Single / Multi GPU) | |
| Minisforum AtomMan X7 Ti | |
| Acemagic F2A | |
| Geekom GT13 Pro | |
| Geekom XT12 Pro | |
| Khadas Mind | |
| Aoostar GEM12 | |
| Geekom A8 | |
| Minisforum EliteMini UM780 XTX | |
| Photoshop PugetBench - GPU Score | |
| Geekom A8 | |
| Aoostar GEM12 | |
| Acemagic F2A | |
| Minisforum AtomMan X7 Ti | |
| Geekom GT13 Pro | |
| Geekom XT12 Pro | |
| Premiere Pro PugetBench - GPU 0.9 | |
| Acemagic F2A | |
| Aoostar GEM12 | |
| Geekom A8 | |
| Geekom GT13 Pro | |
| Geekom XT12 Pro | |
| Khadas Mind | |
| Minisforum AtomMan X7 Ti | |
| DaVinci Resolve PugetBench - GPU Effects 0.93 | |
| Aoostar GEM12 | |
| Acemagic F2A | |
| Geekom GT13 Pro | |
| Geekom XT12 Pro | |
| Geekom GT13 Pro, Intel Iris Xe Graphics G7 96EUs i9-13900H | Geekom XT12 Pro, Intel Iris Xe Graphics G7 96EUs i9-12900H | Khadas Mind, Intel Iris Xe Graphics G7 96EUs i7-1360P | Aoostar GEM12, AMD Radeon 780M R7 8845HS | Minisforum AtomMan X7 Ti, Intel Arc 8-Core iGPU Ultra 9 185H | Geekom A8, AMD Radeon 780M R9 8945HS | Acemagic F2A, Intel Arc 8-Core iGPU Ultra 7 155H | Minisforum EliteMini UM780 XTX, AMD Radeon 780M R7 7840HS | Average of class Mini PC | |
|---|---|---|---|---|---|---|---|---|---|
| SPECviewperf 12 | -5% | -9% | 662% | 20% | 674% | 26% | 725% | 434% | |
| 1900x1060 3ds Max (3dsmax-05) | 41.4 | 40.1 -3% | 37.8 -9% | 85.7 107% | 49.7 20% | 87.4 111% | 49.8 20% | 85 105% | 71 ? 71% |
| 1900x1060 Catia (catia-04) | 38.6 | 37.1 -4% | 39.4 2% | 86.6 124% | 51.3 33% | 86.4 124% | 48.2 25% | 89.8 133% | 62 ? 61% |
| 1900x1060 Creo (creo-01) | 28.2 | 26.9 -5% | 7.37 -74% | 53.3 89% | 22.7 -20% | 55.1 95% | 23.1 -18% | 51.1 81% | 35 ? 24% |
| 1900x1060 Energy (energy-01) | 0.41 | 0.4 -2% | 0.46 12% | 18.4 4388% | 0.67 63% | 19 4534% | 0.91 122% | 20.1 4802% | 12.8 ? 3022% |
| 1900x1060 Maya (maya-04) | 42.4 | 38.3 -10% | 41.3 -3% | 67.3 59% | 58 37% | 75 77% | 54.9 29% | 73.4 73% | 61.6 ? 45% |
| 1900x1060 Medical (medical-01) | 12.2 | 11.8 -3% | 12 -2% | 51.4 321% | 15.9 30% | 47.7 291% | 16.9 39% | 61.7 406% | 26.7 ? 119% |
| 1900x1060 Showcase (showcase-01) | 19.1 | 16.6 -13% | 21.2 11% | 30.3 59% | 19.9 4% | 25.8 35% | 18.2 -5% | 30.1 58% | 34.4 ? 80% |
| 1900x1060 Solidworks (sw-03) | 46.6 | 45.3 -3% | 41.6 -11% | 114 145% | 43 -8% | 106 127% | 42.7 -8% | 113 142% | 69.5 ? 49% |
| SPECviewperf 13 | -5% | -3% | 165% | 13% | 160% | 14% | 186% | 94% | |
| 3ds Max (3dsmax-06) | 41.2 | 40.1 -3% | 39 -5% | 82.4 100% | 48.5 18% | 85.8 108% | 46.4 13% | 86.1 109% | 70.4 ? 71% |
| Catia (catia-05) | 54.7 | 51.3 -6% | 57.1 4% | 124 127% | 76.8 40% | 126 130% | 71.6 31% | 132 141% | 89.8 ? 64% |
| Creo (creo-02) | 42.7 | 41.1 -4% | 37.5 -12% | 90.7 112% | 29.3 -31% | 92.8 117% | 29.6 -31% | 93.6 119% | 69.6 ? 63% |
| Energy (energy-02) | 4.62 | 4.5 -3% | 4.34 -6% | 22.2 381% | 5.27 14% | 22.6 389% | 5.69 23% | 25.8 458% | 16.4 ? 255% |
| Maya (maya-05) | 51.6 | 47.5 -8% | 46.3 -10% | 109 111% | 62.5 21% | 103 100% | 59.5 15% | 108 109% | 94.2 ? 83% |
| Medical (medical-02) | 15.6 | 14.4 -8% | 16 3% | 70.5 352% | 25 60% | 69.2 344% | 29.7 90% | 79.8 412% | 33.2 ? 113% |
| Showcase (showcase-02) | 19.1 | 17.3 -9% | 21.4 12% | 29.9 57% | 19.9 4% | 24.2 27% | 18.2 -5% | 30 57% | 34 ? 78% |
| Solidworks (sw-04) | 58.3 | 57.1 -2% | 53.7 -8% | 104 78% | 45.6 -22% | 97.3 67% | 44.8 -23% | 107 84% | 74.4 ? 28% |
| SPECviewperf 2020 | -2% | -1% | 309% | 38% | 367% | 29% | 288% | 185% | |
| 3840x2160 Medical (medical-03) | 2.69 | 3.49 30% | 2.67 -1% | 11.2 316% | 4.23 57% | 10.9 305% | 5.05 88% | 12 346% | 6.93 ? 158% |
| 3840x2160 Energy (energy-03) | 3.17 | 3.05 -4% | 2.97 -6% | 19.9 528% | 6.03 90% | 31 878% | 4.61 45% | 15.4 386% | 10.9 ? 244% |
| 3840x2160 Creo (creo-03) | 16.3 | 14.8 -9% | 16.9 4% | 33.4 105% | 18.5 13% | 35.6 118% | 17.9 10% | 31.4 93% | 29.2 ? 79% |
| 3840x2160 CATIA (catia-06) | 8.53 | 7.78 -9% | 8.82 3% | 23.2 172% | 11.1 30% | 24.6 188% | 10 17% | 24.4 186% | 18.3 ? 115% |
| 3840x2160 3ds Max (3dsmax-07) | 10.3 | 9.69 -6% | 10.1 -2% | 20.4 98% | 14.9 45% | 21 104% | 12.9 25% | 21 104% | 21.2 ? 106% |
| 3840x2160 Siemens NX (snx-04) | 6.62 | 6.29 -5% | 6.01 -9% | 64.1 868% | 6.24 -6% | 65.9 895% | 5.7 -14% | 61.5 829% | 39.1 ? 491% |
| 3840x2160 Maya (maya-06) | 27.3 | 23.9 -12% | 27.8 2% | 47.7 75% | 37.7 38% | 50.1 84% | 35.4 30% | 47.2 73% | 56.1 ? 105% |
| Total Average (Program / Settings) | -4% /
-4% | -4% /
-5% | 379% /
381% | 24% /
23% | 400% /
402% | 23% /
23% | 400% /
405% | 238% /
240% |
| 3DMark 05 Standard | 43190 points | |
| 3DMark 06 Standard Score | 33774 points | |
| 3DMark Vantage P Result | 28241 points | |
| 3DMark 11 Performance | 8027 points | |
| 3DMark Ice Storm Standard Score | 147975 points | |
| 3DMark Cloud Gate Standard Score | 27505 points | |
| 3DMark Fire Strike Score | 5420 points | |
| 3DMark Fire Strike Extreme Score | 2573 points | |
| 3DMark Time Spy Score | 1926 points | |
| 3DMark Steel Nomad Score | 186 points | |
| 3DMark Steel Nomad Light Score | 1283 points | |
Help | ||
Gaming performance
Many modern games overtax the Intel Iris Xe iGPU. Nevertheless, we can see that playable frame rates can still be achieved in some games if the level of detail is sacrificed. Nevertheless, we cannot certify that the Geekom GT13 Pro is suitable for gaming in this configuration. You get noticeably more 3D performance with the Geekom A8 or the Aoostar GEM12. Alternatively, you can also take a look at the Minisforum AtomMan X7 Ti which has been given a significantly more powerful iGPU with Intel's Meteor Lake SoC.
| Cyberpunk 2077 2.1 Phantom Liberty | |
| 1920x1080 Low Preset (FSR off) | |
| Geekom A8 | |
| Aoostar GEM12 | |
| Minisforum AtomMan X7 Ti | |
| Acemagic F2A | |
| Geekom GT13 Pro | |
| Geekom XT12 Pro | |
| 1920x1080 High Preset (FSR off) | |
| Aoostar GEM12 | |
| Minisforum AtomMan X7 Ti | |
| Geekom A8 | |
| Acemagic F2A | |
| Geekom GT13 Pro | |
| Geekom XT12 Pro | |
| Baldur's Gate 3 | |
| 1920x1080 Low Preset | |
| Aoostar GEM12 | |
| Geekom GT13 Pro | |
| 1920x1080 High Preset | |
| Aoostar GEM12 | |
| Geekom GT13 Pro | |
| Borderlands 3 | |
| 1280x720 Very Low Overall Quality (DX11) | |
| Geekom A8 | |
| Aoostar GEM12 | |
| Minisforum EliteMini UM780 XTX | |
| Minisforum AtomMan X7 Ti | |
| Acemagic F2A | |
| Geekom GT13 Pro | |
| Khadas Mind | |
| Geekom XT12 Pro | |
| 1920x1080 High Overall Quality (DX11) | |
| Minisforum EliteMini UM780 XTX | |
| Aoostar GEM12 | |
| Minisforum AtomMan X7 Ti | |
| Geekom A8 | |
| Acemagic F2A | |
| Geekom GT13 Pro | |
| Khadas Mind | |
| Geekom XT12 Pro | |
| GTA V | |
| 1024x768 Lowest Settings possible | |
| Geekom A8 | |
| Aoostar GEM12 | |
| Minisforum EliteMini UM780 XTX | |
| Minisforum AtomMan X7 Ti | |
| Acemagic F2A | |
| Geekom GT13 Pro | |
| Khadas Mind | |
| 1920x1080 High/On (Advanced Graphics Off) AA:2xMSAA + FX AF:8x | |
| Minisforum EliteMini UM780 XTX | |
| Aoostar GEM12 | |
| Geekom A8 | |
| Minisforum AtomMan X7 Ti | |
| Acemagic F2A | |
| Khadas Mind | |
| Geekom GT13 Pro | |
| F1 2020 | |
| 1280x720 Ultra Low Preset | |
| Minisforum EliteMini UM780 XTX | |
| Geekom A8 | |
| Aoostar GEM12 | |
| Minisforum AtomMan X7 Ti | |
| Geekom GT13 Pro | |
| Geekom XT12 Pro | |
| 1920x1080 High Preset AA:T AF:16x | |
| Minisforum EliteMini UM780 XTX | |
| Geekom A8 | |
| Aoostar GEM12 | |
| Minisforum AtomMan X7 Ti | |
| Geekom GT13 Pro | |
| Geekom XT12 Pro | |
| Shadow of the Tomb Raider | |
| 1280x720 Lowest Preset | |
| Acemagic F2A | |
| Minisforum EliteMini UM780 XTX | |
| Aoostar GEM12 | |
| Minisforum AtomMan X7 Ti | |
| Geekom A8 | |
| Geekom GT13 Pro | |
| Khadas Mind | |
| Geekom XT12 Pro | |
| 1920x1080 High Preset AA:SM | |
| Acemagic F2A | |
| Minisforum EliteMini UM780 XTX | |
| Aoostar GEM12 | |
| Minisforum AtomMan X7 Ti | |
| Geekom A8 | |
| Khadas Mind | |
| Geekom GT13 Pro | |
| Geekom XT12 Pro | |
FPS chart
| low | med. | high | ultra | |
| GTA V (2015) | 119.7 | 97.4 | 22 | 9.07 |
| Dota 2 Reborn (2015) | 109.8 | 80.2 | 65.5 | 58.6 |
| Final Fantasy XV Benchmark (2018) | 45.1 | 25.3 | 18.2 | |
| Far Cry 5 (2018) | 58 | 30 | 28 | 27 |
| Strange Brigade (2018) | 98.7 | 42.5 | 33.8 | 26.9 |
| Shadow of the Tomb Raider (2018) | 57.1 | 22.2 | 20.9 | 18 |
| Far Cry New Dawn (2019) | 52 | 31 | 29 | 27 |
| Metro Exodus (2019) | 38.5 | 19.1 | 14.2 | 11.2 |
| Total War: Three Kingdoms (2019) | 100.3 | 39.6 | 30.2 | 22.2 |
| Borderlands 3 (2019) | 54.4 | 26.5 | 16.7 | 12.7 |
| F1 2020 (2020) | 93.8 | 49.1 | 38.7 | 24.9 |
| F1 2021 (2021) | 105.6 | 52.2 | 39.9 | 29.4 |
| GRID Legends (2022) | 58.8 | 40.2 | 30.8 | 27.9 |
| Tiny Tina's Wonderlands (2022) | 34 | 26.4 | 16.7 | 13.2 |
| F1 22 (2022) | 46.3 | 43.1 | 31.2 | 24.9 |
| F1 23 (2023) | 43.2 | 39.4 | 28 | 21.9 |
| Baldur's Gate 3 (2023) | 18 | 14 | 11.7 | 11.2 |
| Cyberpunk 2077 2.1 Phantom Liberty (2023) | 18.2 | 14.7 | 12.8 | 11.5 |
| Total War Pharaoh (2023) | 68.9 | 48.8 | 34.8 | 30.9 |
| Prince of Persia The Lost Crown (2024) | 132.8 | 93.4 | 87.8 | |
| F1 24 (2024) | 40.4 | 35.4 | 25.6 | 20.4 |
Performance check of the Geekom GT13 Pro with the Razer Core X
The Geekom GT13 Pro enables the use of external graphics cards that can be connected via USB4. We took a closer look at the performance together with the Razer Core X and an Nvidia GeForce RTX 3060 Ti. As expected, the 3D performance can be massively increased. With this combination, the mini-PC covers a wide range of tasks and is suitable for both gaming and video editing. The performance of the Nvidia GeForce RTX 3060 Ti, which is only connected via USB4, cannot keep up with the performance of a conventional desktop PC. The available bandwidth for communication with the external graphics card is only at PCIe x4 3.0 speed.
Geekom GT13 Pro with Razer Core X and Nvidia GeForce RTX 3060 Ti
| Performance Rating - Percent | |
| Geekom A8 (Nvidia GeForce RTX 3060 Ti FE @TB3) | |
| Geekom GT13 Pro (Nvidia GeForce RTX 3060 Ti FE @TB3) | |
| Geekom XT12 Pro (Nvidia GeForce RTX 3060 Ti FE @TB3) | |
| 3DMark 11 - 1280x720 Performance GPU | |
| Geekom A8 (Nvidia GeForce RTX 3060 Ti FE @TB3) | |
| Geekom GT13 Pro (Nvidia GeForce RTX 3060 Ti FE @TB3) | |
| Geekom XT12 Pro (Nvidia GeForce RTX 3060 Ti FE @TB3) | |
| 3DMark | |
| 2560x1440 Time Spy Graphics | |
| Geekom A8 (Nvidia GeForce RTX 3060 Ti FE @TB3) | |
| Geekom GT13 Pro (Nvidia GeForce RTX 3060 Ti FE @TB3) | |
| Geekom XT12 Pro (Nvidia GeForce RTX 3060 Ti FE @TB3) | |
| 1920x1080 Fire Strike Graphics | |
| Geekom GT13 Pro (Nvidia GeForce RTX 3060 Ti FE @TB3) | |
| Geekom A8 (Nvidia GeForce RTX 3060 Ti FE @TB3) | |
| Geekom XT12 Pro (Nvidia GeForce RTX 3060 Ti FE @TB3) | |
| 3840x2160 Fire Strike Ultra Graphics | |
| Geekom GT13 Pro (Nvidia GeForce RTX 3060 Ti FE @TB3) | |
| Geekom XT12 Pro (Nvidia GeForce RTX 3060 Ti FE @TB3) | |
| Geekom A8 (Nvidia GeForce RTX 3060 Ti FE @TB3) | |
| Unigine Superposition | |
| 1280x720 720p Low | |
| Geekom GT13 Pro (Nvidia GeForce RTX 3060 Ti FE @TB3) | |
| Geekom A8 (Nvidia GeForce RTX 3060 Ti FE @TB3) | |
| Geekom XT12 Pro (Nvidia GeForce RTX 3060 Ti FE @TB3) | |
| 1920x1080 1080p High | |
| Geekom GT13 Pro (Nvidia GeForce RTX 3060 Ti FE @TB3) | |
| Geekom A8 (Nvidia GeForce RTX 3060 Ti FE @TB3) | |
| Geekom XT12 Pro (Nvidia GeForce RTX 3060 Ti FE @TB3) | |
| 1920x1080 1080p Extreme | |
| Geekom GT13 Pro (Nvidia GeForce RTX 3060 Ti FE @TB3) | |
| Geekom XT12 Pro (Nvidia GeForce RTX 3060 Ti FE @TB3) | |
| Geekom A8 (Nvidia GeForce RTX 3060 Ti FE @TB3) | |
| 3840x2160 4k Optimized | |
| Geekom GT13 Pro (Nvidia GeForce RTX 3060 Ti FE @TB3) | |
| Geekom XT12 Pro (Nvidia GeForce RTX 3060 Ti FE @TB3) | |
| Geekom A8 (Nvidia GeForce RTX 3060 Ti FE @TB3) | |
| 7680x4320 8k Optimized | |
| Geekom GT13 Pro (Nvidia GeForce RTX 3060 Ti FE @TB3) | |
| Geekom XT12 Pro (Nvidia GeForce RTX 3060 Ti FE @TB3) | |
| Geekom A8 (Nvidia GeForce RTX 3060 Ti FE @TB3) | |
| Unigine Valley 1.0 | |
| 1920x1080 Extreme HD DirectX AA:x8 | |
| Geekom XT12 Pro (Nvidia GeForce RTX 3060 Ti FE @TB3) | |
| Geekom GT13 Pro (Nvidia GeForce RTX 3060 Ti FE @TB3) | |
| Geekom A8 (Nvidia GeForce RTX 3060 Ti FE @TB3) | |
| 1920x1080 Extreme HD Preset OpenGL AA:x8 | |
| Geekom GT13 Pro (Nvidia GeForce RTX 3060 Ti FE @TB3) | |
| Geekom XT12 Pro (Nvidia GeForce RTX 3060 Ti FE @TB3) | |
| Geekom A8 (Nvidia GeForce RTX 3060 Ti FE @TB3) | |
| Unigine Heaven 4.0 | |
| Extreme Preset OpenGL | |
| Geekom A8 (Nvidia GeForce RTX 3060 Ti FE @TB3) | |
| Geekom GT13 Pro (Nvidia GeForce RTX 3060 Ti FE @TB3) | |
| Geekom XT12 Pro (Nvidia GeForce RTX 3060 Ti FE @TB3) | |
| Extreme Preset DX11 | |
| Geekom GT13 Pro (Nvidia GeForce RTX 3060 Ti FE @TB3) | |
| Geekom A8 (Nvidia GeForce RTX 3060 Ti FE @TB3) | |
| Geekom XT12 Pro (Nvidia GeForce RTX 3060 Ti FE @TB3) | |
| ComputeMark v2.1 | |
| 1024x600 Normal, Score | |
| Geekom GT13 Pro (Nvidia GeForce RTX 3060 Ti FE @TB3) | |
| Geekom A8 (Nvidia GeForce RTX 3060 Ti FE @TB3) | |
| Geekom XT12 Pro (Nvidia GeForce RTX 3060 Ti FE @TB3) | |
| 1024x600 Normal, Fluid 3DTex | |
| Geekom GT13 Pro (Nvidia GeForce RTX 3060 Ti FE @TB3) | |
| Geekom A8 (Nvidia GeForce RTX 3060 Ti FE @TB3) | |
| Geekom XT12 Pro (Nvidia GeForce RTX 3060 Ti FE @TB3) | |
| 1024x600 Normal, Fluid 2DTexArr | |
| Geekom GT13 Pro (Nvidia GeForce RTX 3060 Ti FE @TB3) | |
| Geekom A8 (Nvidia GeForce RTX 3060 Ti FE @TB3) | |
| Geekom XT12 Pro (Nvidia GeForce RTX 3060 Ti FE @TB3) | |
| 1024x600 Normal, Mandel Vector | |
| Geekom GT13 Pro (Nvidia GeForce RTX 3060 Ti FE @TB3) | |
| Geekom A8 (Nvidia GeForce RTX 3060 Ti FE @TB3) | |
| Geekom XT12 Pro (Nvidia GeForce RTX 3060 Ti FE @TB3) | |
| 1024x600 Normal, Mandel Scalar | |
| Geekom GT13 Pro (Nvidia GeForce RTX 3060 Ti FE @TB3) | |
| Geekom A8 (Nvidia GeForce RTX 3060 Ti FE @TB3) | |
| Geekom XT12 Pro (Nvidia GeForce RTX 3060 Ti FE @TB3) | |
| 1024x600 Normal, QJuliaRayTrace | |
| Geekom GT13 Pro (Nvidia GeForce RTX 3060 Ti FE @TB3) | |
| Geekom A8 (Nvidia GeForce RTX 3060 Ti FE @TB3) | |
| Geekom XT12 Pro (Nvidia GeForce RTX 3060 Ti FE @TB3) | |
| DaVinci Resolve PugetBench - GPU Effects 0.93 | |
| Geekom A8 (Nvidia GeForce RTX 3060 Ti FE @TB3) | |
| Geekom XT12 Pro (Nvidia GeForce RTX 3060 Ti FE @TB3) | |
| Geekom GT13 Pro (Nvidia GeForce RTX 3060 Ti FE @TB3) | |
| Photoshop PugetBench - GPU Score | |
| Geekom A8 (Nvidia GeForce RTX 3060 Ti FE @TB3) | |
| Geekom XT12 Pro (Nvidia GeForce RTX 3060 Ti FE @TB3) | |
| Geekom GT13 Pro (Nvidia GeForce RTX 3060 Ti FE @TB3) | |
| Premiere Pro PugetBench - GPU 0.9 | |
| Geekom A8 (Nvidia GeForce RTX 3060 Ti FE @TB3) | |
| Geekom GT13 Pro (Nvidia GeForce RTX 3060 Ti FE @TB3) | |
| Geekom XT12 Pro (Nvidia GeForce RTX 3060 Ti FE @TB3) | |
| low | med. | high | ultra | QHD | 4K DLSS | 4K | |
| GTA V (2015) | 182.1 | 178 | 170.7 | 103.6 | 91.6 | 103.8 | |
| Dota 2 Reborn (2015) | 180.5 | 157.2 | 146.6 | 133.3 | 108.6 | ||
| Final Fantasy XV Benchmark (2018) | 188 | 142.7 | 98.6 | 78 | 48.3 | ||
| X-Plane 11.11 (2018) | 151.3 | 135 | 106.6 | 95.4 | |||
| Far Cry 5 (2018) | 160 | 138 | 132 | 121 | 99 | 58 | |
| Strange Brigade (2018) | 214 | 160.5 | 156.8 | 152.9 | 130.2 | 84.5 | |
| Shadow of the Tomb Raider (2018) | 118.5 | 101 | 100.8 | 98.5 | 85.9 | 49.6 | |
| Far Cry New Dawn (2019) | 138 | 119 | 115 | 104 | 93 | 60 | |
| Metro Exodus (2019) | 144.8 | 91.6 | 69.6 | 52.5 | 45.8 | 33.7 | |
| Total War: Three Kingdoms (2019) | 300.4 | 145.6 | 95 | 70.1 | 49.3 | 26.7 | |
| Borderlands 3 (2019) | 155.8 | 132.4 | 104.8 | 84.6 | 64.6 | 38.3 | |
| F1 2020 (2020) | 207 | 127.8 | 128.9 | 105.5 | 90.6 | 61.4 | |
| F1 2021 (2021) | 143.5 | 110.1 | 69.1 | 51.7 | 48.1 | 41.4 | |
| Far Cry 6 (2021) | 78 | 65 | 53.9 | 46.9 | 45.8 | ||
| GRID Legends (2022) | 119.2 | 99.7 | 84 | 70.9 | 64.7 | 51 | |
| Tiny Tina's Wonderlands (2022) | 178.2 | 138.7 | 100.2 | 81.4 | 61.7 | 36.1 | |
| F1 22 (2022) | 61.4 | 56.1 | 43.2 | 27.6 | 26.2 | 19.6 | |
| F1 23 (2023) | 67.9 | 66.2 | 54.6 | 33.3 | 31.9 | 10.3 | |
| Baldur's Gate 3 (2023) | 113.4 | 90.8 | 78.9 | 79 | 61.4 | 54.7 | 36.9 |
| Cyberpunk 2077 2.1 Phantom Liberty (2023) | 85.3 | 80.4 | 71.3 | 63.9 | 44.9 | 22.1 | |
| Assassin's Creed Mirage (2023) | 88 | 82 | 77 | 63 | 59 | 56 | |
| Avatar Frontiers of Pandora (2023) | 53 | 49 | 43 | 30 | 23 | 9.7 | |
| Skull & Bones (2024) | 83 | 77 | 64 | 54 | 45 | 31 | |
| F1 24 (2024) | 77.3 | 72.8 | 61.3 | 42 | 36.5 | 28.9 | 19.6 |
| Geekom GT13 Pro, Intel Iris Xe Graphics G7 96EUs i9-13900H | Geekom GT13 Pro (Nvidia GeForce RTX 3060 Ti FE @TB3), i9-13900H | Geekom A8 (Nvidia GeForce RTX 3060 Ti FE @TB3), R9 8945HS | Minisforum MS-01 (Nvidia GeForce RTX 3060 Ti FE @TB3), i9-13900H | Geekom XT12 Pro (Nvidia GeForce RTX 3060 Ti FE @TB3), i9-12900H | |
|---|---|---|---|---|---|
| SPECviewperf 12 | 679% | 674% | 687% | 630% | |
| 1900x1060 3ds Max (3dsmax-05) | 41.4 | 147 255% | 146 253% | 147 255% | 124 200% |
| 1900x1060 Catia (catia-04) | 38.6 | 116 201% | 112 190% | 116 201% | 95.2 147% |
| 1900x1060 Creo (creo-01) | 28.2 | 62.9 123% | 62.9 123% | 64.2 128% | 53.5 90% |
| 1900x1060 Energy (energy-01) | 0.41 | 13.4 3168% | 13.3 3144% | 13.4 3168% | 13.4 3168% |
| 1900x1060 Maya (maya-04) | 42.4 | 228 438% | 235 454% | 235 454% | 182 329% |
| 1900x1060 Medical (medical-01) | 12.2 | 73.4 502% | 74.8 513% | 76.4 526% | 74.4 510% |
| 1900x1060 Showcase (showcase-01) | 19.1 | 149 680% | 141 638% | 149 680% | 123 544% |
| 1900x1060 Solidworks (sw-03) | 46.6 | 77.2 66% | 81.6 75% | 84.6 82% | 71.7 54% |
| SPECviewperf 13 | 386% | 374% | 385% | 311% | |
| 3ds Max (3dsmax-06) | 41.2 | 147 257% | 145 252% | 147 257% | 124 201% |
| Catia (catia-05) | 54.7 | 164 200% | 163 198% | 163 198% | 135 147% |
| Creo (creo-02) | 42.7 | 232 443% | 231 441% | 231 441% | 194 354% |
| Energy (energy-02) | 4.62 | 25.9 461% | 25.9 461% | 25.9 461% | 24 419% |
| Maya (maya-05) | 51.6 | 363 603% | 351 580% | 361 600% | 298 478% |
| Medical (medical-02) | 15.6 | 65.2 318% | 64.1 311% | 64.9 316% | 56.7 263% |
| Showcase (showcase-02) | 19.1 | 151 691% | 141 638% | 150 685% | 125 554% |
| Solidworks (sw-04) | 58.3 | 127 118% | 125 114% | 129 121% | 102 75% |
| SPECviewperf 2020 | 390% | 518% | 436% | 327% | |
| 3840x2160 Medical (medical-03) | 2.69 | 10.8 301% | 10.8 301% | 10.8 301% | 11.8 339% |
| 3840x2160 Energy (energy-03) | 3.17 | 21 562% | 50.3 1487% | 31.1 881% | 18.9 496% |
| 3840x2160 Creo (creo-03) | 16.3 | 76.4 369% | 76.6 370% | 76.8 371% | 62.7 285% |
| 3840x2160 CATIA (catia-06) | 8.53 | 40.1 370% | 38.8 355% | 39.7 365% | 32.8 285% |
| 3840x2160 3ds Max (3dsmax-07) | 10.3 | 47.3 359% | 45.9 346% | 47.6 362% | 40 288% |
| 3840x2160 Siemens NX (snx-04) | 6.62 | 16.5 149% | 16.6 151% | 16.6 151% | 15.2 130% |
| 3840x2160 Maya (maya-06) | 27.3 | 196 618% | 195 614% | 197 622% | 155 468% |
| Total Average (Program / Settings) | 485% /
489% | 522% /
522% | 503% /
505% | 423% /
427% |
Emissions - IceBlast 1.5 quickly reaches its limit
Noise emissions
In terms of cooling, the Geekom GT13 Pro is very limited due to its design. However, the mini-PC is still extremely quiet when idling, although the small fan can be clearly audible under load. In the test, we measured a maximum sound pressure level of 48.5 dB(A). The GT13 Pro only reaches this noise level for a short time, as long as the PL2 value is reached. Under prolonged load, the SoC works with the PL1 limit, which means that the volume then levels off at around 39 dB(A). If there is no permanent load, which we simulate with Prime95 for example, the fan works very nervously. The sound pressure level under average load fluctuates from 38 to 44 dB(A) in our test sample.
Noise Level
| Idle |
| 27.9 / 27.9 / 28 dB(A) |
| Load |
| 43.8 / 48.5 dB(A) |
 | ||
30 dB silent 40 dB(A) audible 50 dB(A) loud |
||
min: | ||
| Geekom GT13 Pro i9-13900H, Iris Xe G7 96EUs | Aoostar GEM12 R7 8845HS, Radeon 780M | Minisforum AtomMan X7 Ti Ultra 9 185H, Arc 8-Core | Geekom A8 R9 8945HS, Radeon 780M | Geekom XT12 Pro i9-12900H, Iris Xe G7 96EUs | Acemagic F2A Ultra 7 155H, Arc 8-Core | Minisforum EliteMini UM780 XTX R7 7840HS, Radeon 780M | Khadas Mind i7-1360P, Iris Xe G7 96EUs | |
|---|---|---|---|---|---|---|---|---|
| Noise | 9% | 1% | 4% | 2% | 2% | 6% | -13% | |
| off / environment * | 24.3 | 24.3 -0% | 24.1 1% | 24.4 -0% | 25.4 -5% | 24.9 -2% | 24.8 -2% | 25.2 -4% |
| Idle Minimum * | 27.9 | 27.5 1% | 29.8 -7% | 24.5 12% | 28 -0% | 25.4 9% | 28.5 -2% | 34.4 -23% |
| Idle Average * | 27.9 | 27.6 1% | 29.9 -7% | 24.7 11% | 28.1 -1% | 25.7 8% | 28.5 -2% | 34.4 -23% |
| Idle Maximum * | 28 | 27.6 1% | 30 -7% | 24.7 12% | 28.5 -2% | 25.7 8% | 28.7 -3% | 34.5 -23% |
| Load Average * | 43.8 | 36 18% | 37.3 15% | 48.5 -11% | 39.6 10% | 47.8 -9% | 32.4 26% | 44.7 -2% |
| Cyberpunk 2077 ultra * | 45.4 | 35.4 22% | ||||||
| Load Maximum * | 48.5 | 38.2 21% | 43.5 10% | 49.2 -1% | 44.2 9% | 49 -1% | 39.6 18% | 50.4 -4% |
| Witcher 3 ultra * | 35.4 | 40.2 | 47 | 47.2 | 45.23 | 32.7 | 49 |
* ... smaller is better
Temperature
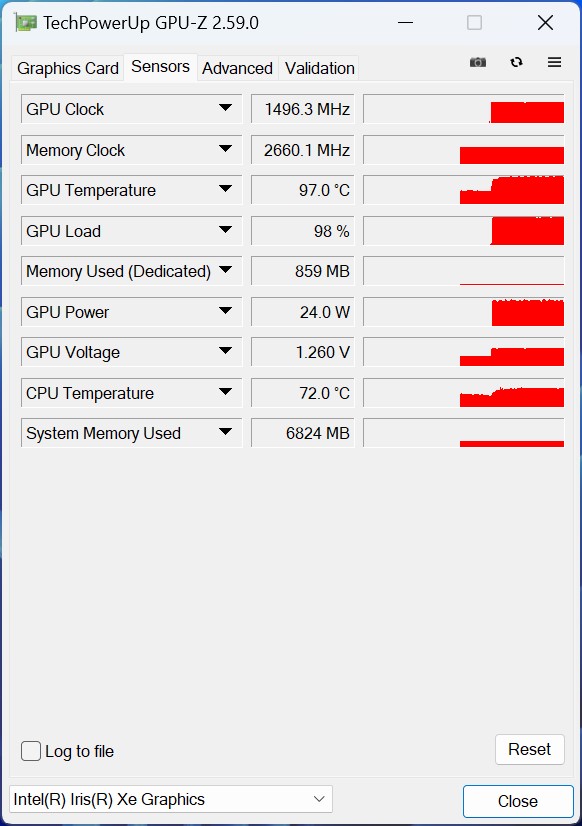
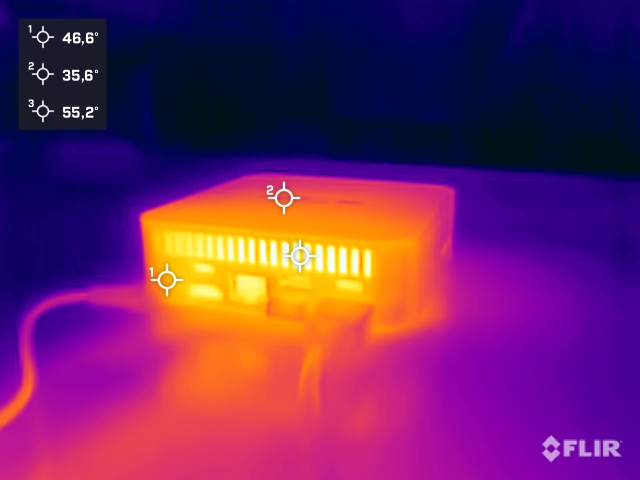
The casing of the Geekom GT13 Pro heats up noticeably both at idle and under load. Under load, the surface temperatures rise slightly again. However, the 50 °C is not quite reached. We record relatively high temperatures with the Intel Core i9-13900H, which is due to the poor ventilation of the compact cooling unit. At 100 °C, the SoC reaches the maximum value that Intel itself states in the specifications. It is important to know that the 100 °C is only reached for a short time. The CPU temperature drops slightly when the PL1 operates at a maximum of 35 watts. On average, the temperature of the Intel Core i9-13900H settles at around 90 °C.
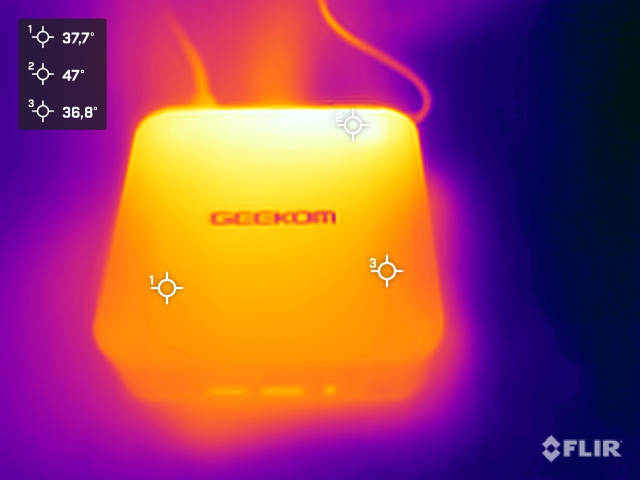

(-) The maximum temperature on the upper side is 48.2 °C / 119 F, compared to the average of 35.5 °C / 96 F, ranging from 24 to 69.5 °C for the class Mini PC.
(-) The bottom heats up to a maximum of 45.7 °C / 114 F, compared to the average of 36.3 °C / 97 F
(-) In idle usage, the average temperature for the upper side is 38.2 °C / 101 F, compared to the device average of 32 °C / 90 F.
Energy management
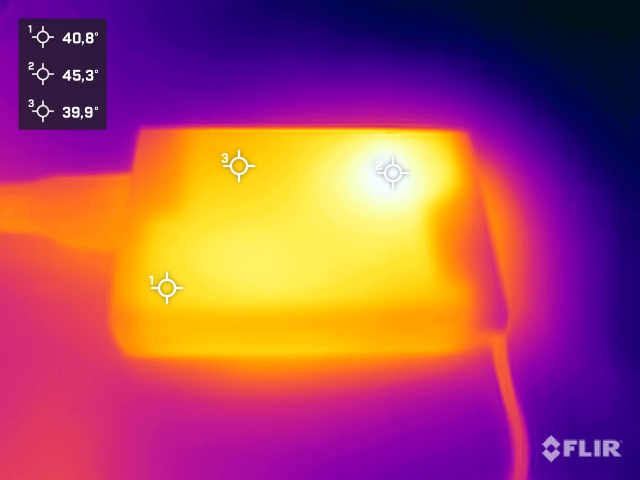
Mini-PCs are generally economical and require significantly less energy than a conventional desktop PC. Nevertheless, there are differences between the mini-PCs in terms of energy consumption. At 7.9 to 22.3 watts, the Geekom GT13 Pro is not particularly economical in idle mode when compared with its competitors. Under average load, our test device requires 57 watts, and the 120-watt power supply unit has to provide 93.4 watts at its peak.
| Off / Standby | |
| Idle | |
| Load |
|
| Geekom GT13 Pro i9-13900H, Iris Xe G7 96EUs | Aoostar GEM12 R7 8845HS, Radeon 780M | Minisforum AtomMan X7 Ti Ultra 9 185H, Arc 8-Core | Geekom A8 R9 8945HS, Radeon 780M | Geekom XT12 Pro i9-12900H, Iris Xe G7 96EUs | Acemagic F2A Ultra 7 155H, Arc 8-Core | Minisforum EliteMini UM780 XTX R7 7840HS, Radeon 780M | Khadas Mind i7-1360P, Iris Xe G7 96EUs | Average Intel Iris Xe Graphics G7 96EUs | Average of class Mini PC | |
|---|---|---|---|---|---|---|---|---|---|---|
| Power Consumption | 1% | 3% | 31% | 15% | 1% | 2% | 18% | 30% | 3% | |
| Idle Minimum * | 7.9 | 8.2 -4% | 8.2 -4% | 3.2 59% | 5.7 28% | 9.1 -15% | 8.5 -8% | 7.8 1% | 5.35 ? 32% | 9.63 ? -22% |
| Idle Average * | 10.3 | 10 3% | 12.1 -17% | 4.9 52% | 9.5 8% | 10.3 -0% | 10.5 -2% | 10.9 -6% | 8.57 ? 17% | 11.5 ? -12% |
| Idle Maximum * | 22.3 | 14.6 35% | 14 37% | 6.8 70% | 16.5 26% | 14.4 35% | 12.9 42% | 11.8 47% | 10.8 ? 52% | 14.7 ? 34% |
| Load Average * | 57.44 | 73.9 -29% | 53.1 8% | 71.3 -24% | 53.3 7% | 54.9 4% | 67.2 -17% | 39.2 32% | 45.3 ? 21% | 53.5 ? 7% |
| Load Maximum * | 93.4 | 95.3 -2% | 100.4 -7% | 93.2 -0% | 87.8 6% | 110.4 -18% | 97.2 -4% | 76.4 18% | 67.5 ? 28% | 87.7 ? 6% |
* ... smaller is better
Efficiency overview
| Power Consumption / Cinebench R15 Multi Efficiency (external Monitor) | |
| Geekom A8 | |
| Minisforum AtomMan X7 Ti | |
| Acemagic F2A | |
| Geekom GT13 Pro | |
| Geekom XT12 Pro | |
| Power Consumption / Cinebench R23 Single Power Efficiency - external Monitor | |
| Geekom A8 | |
| Minisforum AtomMan X7 Ti | |
| Geekom GT13 Pro | |
| Acemagic F2A | |
| Geekom XT12 Pro | |
| Power Consumption / Cinebench R23 Multi Power Efficiency - external Monitor | |
| Geekom A8 | |
| Geekom GT13 Pro | |
| Minisforum AtomMan X7 Ti | |
| Acemagic F2A | |
| Geekom XT12 Pro | |
Power consumtion with external monitor
Power consumtion with external monitor
Pros
Cons
Verdict - Great looks with average performance at a premium price

The manufacturer markets a stylish and very compact PC as the Geekom GT13 Pro. With the Intel Core i9-13900H, there is a powerful SoC, which is not based on the current Meteor Lake architecture. In principle, the processor delivers adequate performance if continuous loads are not necessarily generated. Due to its small design, the Intel Core i9-13900H can only be operated with a very low power consumption.
The Geekom GT13 Pro is a stylish, powerful mini-PC, and impresses with its great features. Unfortunately, the pricing doesn't quite match the performance of the Geekom GT13 Pro.
Visually, the Geekom GT13 Pro impresses with its stylish design. The look is not completely new, as the Geekom A7 and Geekom A8 are already based on the same housing. In terms of color, Geekom takes a different approach with the GT13 Pro, setting it apart from its AMD counterparts. The connectivity is one of the strengths of the Geekom GT13 Pro and is even slightly better than that of the aforementioned in-house competitors. Two USB4 ports are good and can make a difference in practice if many external devices need to be connected. The Geekom GT13 Pro passed the test with an external graphics card perfectly, even though its competitors did not fall short here either. Geekom should not lose sight of the possibility of offering an OCuLink interface so as not to lose touch with some of its opponents. As long as Thunderbolt 5 is not available, the OCuLink interface is currently the better option when it comes to operating external graphics cards.
The compact design is stylish and the materials chosen are also of high quality. Nevertheless, Geekom has to ask itself whether the concept is the right one when it comes to accommodating very powerful components in a very small space. The case offers limited airflow, making it difficult to cool the processor. Ultimately, this means that the Geekom GT13 Pro is clearly audible under load. Minisforum and Aoostar show with their devices that even powerful components can be cooled significantly more quietly.
Finally, we also have to look at the price again: At the time of testing, the Geekom GT13 Pro costs 930 euros in our configuration. This means that the GT13 Pro is truly no bargain and will probably have a hard time competing with its competitors, some of which are significantly cheaper.
Prices and availability
Note: We have recently updated our rating system and the results of version 8 are not comparable with the results of version 7. More information is available here .
Geekom GT13 Pro
-
06/21/2024 v8 (new)
Sebastian Bade
 Total Sustainability Score:
 Transparency
The present review sample was given to the author by the manufacturer free of charge for the purposes of review. There was no third-party influence on this review, nor did the manufacturer receive a copy of this review before publication. There was no obligation to publish this review.

