NVIDIA GeForce RTX 3050 6GB Laptop GPU vs NVIDIA GeForce RTX 2080 Max-Q vs NVIDIA GeForce RTX 3090 Ti
NVIDIA GeForce RTX 3050 6GB Laptop GPU ► remove from comparison
The Nvidia GeForce RTX 3050 6GB Laptop GPU (mobile, GN20-P0-R, 2023 Refresh) is the refresh of the RTX 3050 4GB Laptop GPU (slowest RTX 3000 mobile card) and also based on the GA107 Ampere chip. The 6GB variant offers more CUDA cores (2,560, +25%) but a cut down memory bus to 96 Bit. The clock speed depends on the TGP variant and can range from 713 - 1530 (base) and 1058 - 1740 (boost) for the TGP variants of 35 to 80 Watt (see table below).
The performance is between the old 4GB RTX 3050 and the RTX 3050 Ti and therefore best suited for full HD gaming (1920 x 1080) in medium to high graphic settings. The performance is not sufficient to enable Raytracing in most games, but the Tensor cores can be used for DLSS in some games (and get performance boost with slight quality reduction). Beware, that the low TGP variants will offer a significantly lower performance.
The GA107 chip offers 3,072 FP32 ALUs of which half can also execute INT32 instructions (i.e. 1,536 INT32 ALUs). The RTX 3050 however maybe won't use all ALUs on the chip. With Turing all shaders could still execute FP32 or INT32 instructions. The raytracing and tensor cores on the chip were also improved according to Nvidia. The Ampere chips also include an improved 5th generation video encoder (NVENC for H.264 and H.265) and a 7th generation decoder (for various formats now including AV1).
The GA107 chip is manufactured by Samsung in 8nm (8N), which is not quite able to keep up with the 7nm node at TSMC (e.g. used by AMD and also for the professional GA100 Ampere chip).
NVIDIA GeForce RTX 2080 Max-Q ► remove from comparison
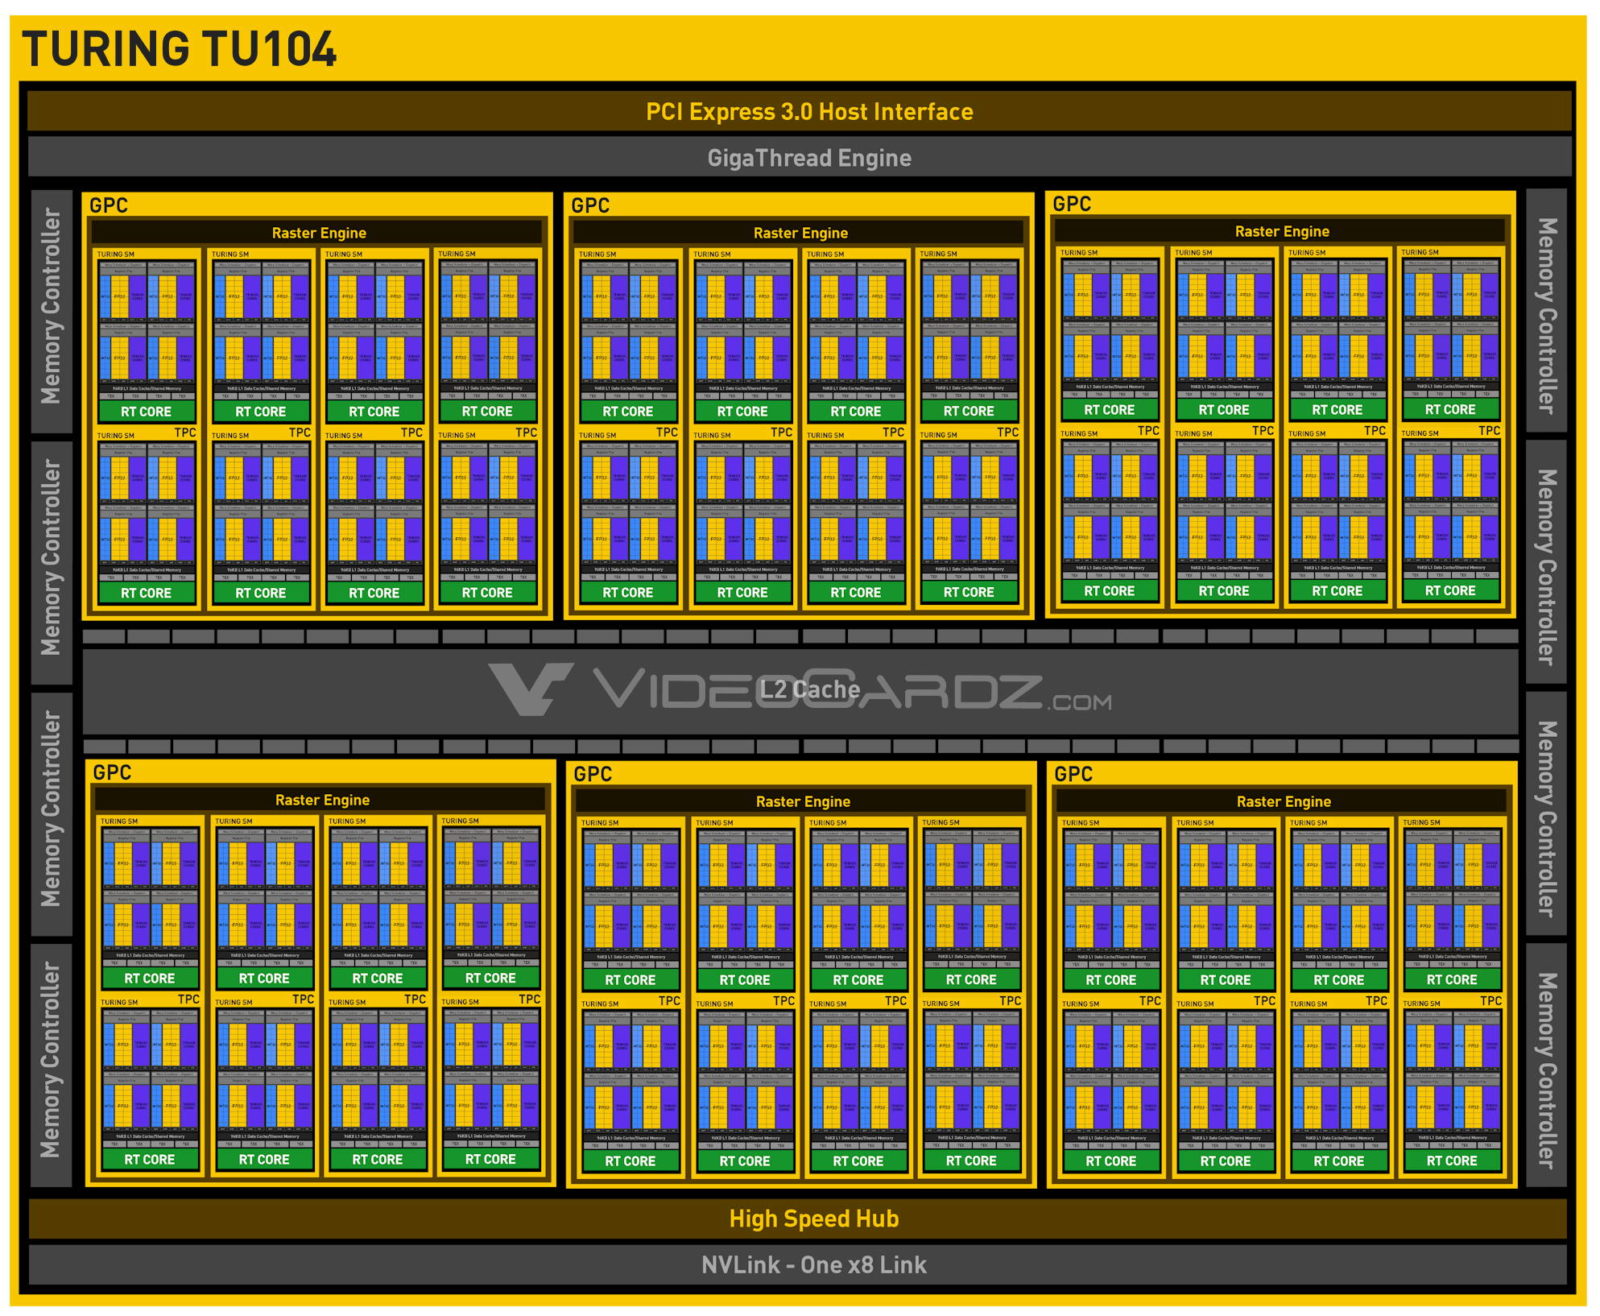
The NVIDIA GeForce RTX 2080 with Max-Q design is the power saving variant of the mobile RTX 2080 with reduced clock speeds and power consumption. Therefore, it is suitable for thin gaming laptops. It is based on the same TU104 chip is the desktop and mobile variant and offers 2,944 shaders and 8 GB GDDR6 memory connected by a 256 bit interface (12 GHz).
Currently it looks like there will be two variants, a low power 80 Watt variant with 735 - 1095 MHz core clock and a faster 90 Watt variant with 990 - 1230 MHz core clock).
The clock is not the only difference compared to the regular RTX 2080 though. The drivers for the Max-Q version were optimized for efficiency (and not performance; only for Max-Q models), there are optimized voltage converters for 1V operation, high-end cooling methods, and a 40 dB limit for the fan noise (with clock adjustments to ensure this at all times).
NVIDIA manufactures the TU104 chip on a 12 nm FinFET process and includes features like Deep Learning Super Sampling (DLSS) and Real-Time Ray Tracing (RTRT), which should combine to create more realistic lighting effects than older GPUs based on the company's Pascal architecture (if the games supports it). The RTX 2080 is also DisplayPort 1.4 ready, while there is also support for HDMI 2.0b, HDR, Simultaneous Multi-Projection (SMP) and H.265 video en/decoding (PlayReady 3.0).
The RTX 2080 Max-Q should be slightly faster than a regular mobile RTX 2070 and therefore a high end gaming graphics card. It should be able to run all demanding games in 4k with maximum details. Raytracing features however may reduce framerates a lot.
NVIDIA GeForce RTX 3090 Ti ► remove from comparison
The Nvidia GeForce RTX 3090 Ti is a high-end desktop graphics card based on the Ampere generation. It was announced early 2022 the fastest desktop gaming graphics card.
It uses the big GA102 chip and offers 10,752 shaders and 24 GB GDDR6X graphics memory. The RTX3090ti is rated at 450 Watt.
NVIDIA GeForce RTX 3050 6GB Laptop GPU NVIDIA GeForce RTX 2080 Max-Q NVIDIA GeForce RTX 3090 Ti GeForce RTX 3000 Series Codename GN20-P0-R 6GB N18E-G3-A1 MAX-Q TU104 Ampere GA102 Architecture Ampere Turing Ampere Pipelines 2560 - unified 2944 - unified 10752 - unified TMUs 80 336 ROPs 32 112 Raytracing Cores 16 84 Tensor / AI Cores 64 336 Core Speed 1237 - 1492 (Boost) MHz 735-990 - 1095-1230 (Boost) MHz 1560 - 1860 (Boost) MHz Memory Speed 12000 effective = 1500 MHz 12000 MHz 21000 effective = 1313 MHz Memory Bus Width 96 Bit 256 Bit 384 Bit Memory Type GDDR6 GDDR6 GDDR6X Max. Amount of Memory 6 GB 8 GB 24 GB Shared Memory no no no Memory Bandwidth 144 GB/s 1008 GB/s API DirectX 12_2, Shader 6.7, OpenGL 4.6 DirectX 12_1, OpenGL 4.6 DirectX 12_2, Shader 6.7, OpenGL 4.6 Power Consumption 60 Watt (35 - 80 Watt TGP) 80-90 Watt 450 Watt technology 8 nm 12 nm 8 nm PCIe 4.0 4.0 x16 Displays HDMI 2.1, DisplayPort 1.4a 4 Displays (max.), HDMI 2.1, DisplayPort 1.4a Features NVIDIA DLSS, NVIDIA Reflex, Resizable BAR, NVIDIA Broadcast, NVIDIA Ansel, NVIDIA ShadowPlay, NVIDIA G-SYNC, Advanced Optimus, Nvidia Max-Q, Dynamic Boost NVLink, DLSS, Raytraycing, VR Ready, G-SYNC, Vulkan, Multi Monitor, 650 Watt system power recommended Notebook Size large large Date of Announcement 06.01.2023 06.01.2019 27.01.2022 Predecessor GeForce RTX 3050 4GB Laptop GPU GeForce RTX 2080 Ti (Desktop) Transistors 13.6 Billion 28.3 Billion Theoretical Performance 40 TFLOPS FP16, 40 TFLOPS FP32, 625 TFLOPS FP64 Cache L1: 10.5 MB, L2: 6 MB Die Size 628 mm²
Benchmarks Performance Rating - 3DMark 11 + Fire Strike + Time Spy - GeForce RTX 3050 6GB Laptop GPU
5.5 pt (16%)
...
NVIDIA GeForce RTX 3050 6GB Laptop GPU
...
max:
Performance Rating - 3DMark 11 + Fire Strike + Time Spy - GeForce RTX 2080 Max-Q
9.4 pt (28%)
...
NVIDIA GeForce RTX 2080 Max-Q
...
max:
Performance Rating - 3DMark 11 + Fire Strike + Time Spy - NVIDIA GeForce RTX 3090 Ti
24.2 pt (73%)
...
NVIDIA GeForce RTX 3090 Ti
...
max:
3DMark - 3DMark Time Spy Score
min: 4933 avg: 5058 median: 5057.5 (15%) max: 5182 Points
GPU TDP 50 W TDP 63 W 95% 100%
min: 6399 avg: 7609 median: 7484 (22%) max: 8604 Points
GPU TDP ? TDP 50 W TDP 63 W 100% 65% 68%
19241 Points (55%)
GPU TDP ? TDP 50 W TDP 63 W TDP 450 W 43% 26% 27% 100%
3DMark - 3DMark Time Spy Graphics
min: 4501 avg: 4661 median: 4660.5 (12%) max: 4820 Points
GPU TDP 50 W TDP 63 W 93% 100%
min: 6464 avg: 7903 median: 7923 (21%) max: 8844 Points
GPU TDP ? TDP 50 W TDP 63 W 100% 57% 61%
21645 Points (57%)
GPU TDP ? TDP 50 W TDP 63 W TDP 450 W 40% 21% 22% 100%
3DMark - 3DMark Ice Storm Unlimited Graphics
500518 Points (57%)
min: 364184 avg: 413236 median: 425550 (48%) max: 444648 Points
GPU TDP ? TDP 60 W 83% 100%
564087 Points (64%)
GPU TDP ? TDP 60 W TDP 450 W 78% 89% 100%
3DMark - 3DMark Ice Storm Extreme Graphics
80214 Points (10%)
min: 166342 avg: 280059 median: 342495 (44%) max: 377016 Points
GPU TDP ? TDP 60 W 100% 29%
444102 Points (57%)
GPU TDP ? TDP 60 W TDP 450 W 69% 18% 100%
3DMark - 3DMark Cloud Gate Score
43015 Points (46%)
min: 25513 avg: 35405 median: 34287 (37%) max: 50705 Points
GPU TDP ? TDP 60 W 82% 100%
75753 Points (81%)
GPU TDP ? TDP 60 W TDP 450 W 50% 57% 100%
3DMark - 3DMark Cloud Gate Graphics
72486 Points (19%)
min: 38256 avg: 111063 median: 117764 (31%) max: 129506 Points
GPU TDP ? TDP 60 W 100% 65%
246319 Points (65%)
GPU TDP ? TDP 60 W TDP 450 W 48% 29% 100%
3DMark - 3DMark Fire Strike Standard Score
min: 10765 avg: 10995 median: 10890 (19%) max: 11330 Points
GPU TDP 50 W TDP 60 W TDP 63 W 95% 96% 100%
min: 15962 avg: 17836 median: 17504 (31%) max: 22184 Points
GPU TDP ? TDP 50 W TDP 60 W TDP 63 W 100% 60% 61% 64%
36563 Points (65%)
GPU TDP ? TDP 50 W TDP 60 W TDP 63 W TDP 450 W 51% 29% 30% 31% 100%
3DMark - 3DMark Fire Strike Standard Graphics
min: 11887 avg: 12155 median: 11960 (14%) max: 12618 Points
GPU TDP 50 W TDP 60 W TDP 63 W 94% 95% 100%
min: 18048 avg: 20658 median: 20703 (23%) max: 23032 Points
GPU TDP ? TDP 50 W TDP 60 W TDP 63 W 100% 58% 58% 61%
53110 Points (60%)
GPU TDP ? TDP 50 W TDP 60 W TDP 63 W TDP 450 W 42% 22% 23% 24% 100%
3DMark - 3DMark Ice Storm Graphics
80553 Points (10%)
min: 69036 avg: 274353 median: 300340 (36%) max: 419228 Points
GPU TDP ? TDP 60 W 100% 29%
465704 Points (56%)
GPU TDP ? TDP 60 W TDP 450 W 65% 17% 100%
3DMark - 3DMark Wild Life Unlimited
118439 Points (60%)
GPU TDP ? TDP 450 W 100% 100%
3DMark - 3DMark Wild Life Extreme Unlimited
8916 Points (10%)
46562 Points (54%)
GPU TDP ? TDP 50 W TDP 450 W 100% 19% 100%
3DMark - 3DMark Night Raid
39960 Points (38%)
64315 Points (61%)
GPU TDP ? TDP 450 W 81% 100%
3DMark - 3DMark Night Raid Graphics Score
90166 Points (35%)
139165 Points (54%)
GPU TDP ? TDP 450 W 82% 100%
3DMark 11 - 3DM11 Performance Score
min: 15844 avg: 16783 median: 17223 (24%) max: 17282 Points
GPU TDP 50 W TDP 60 W TDP 63 W 92% 100% 100%
min: 19220 avg: 21052 median: 21067 (29%) max: 23774 Points
GPU TDP ? TDP 50 W TDP 60 W TDP 63 W 100% 75% 82% 82%
49471 Points (69%)
GPU TDP ? TDP 50 W TDP 60 W TDP 63 W TDP 450 W 45% 32% 35% 35% 100%
3DMark 11 - 3DM11 Performance GPU
min: 15860 avg: 17113 median: 17421 (15%) max: 18059 Points
GPU TDP 50 W TDP 60 W TDP 63 W 88% 96% 100%
min: 23386 avg: 27852 median: 27973 (24%) max: 30910 Points
GPU TDP ? TDP 50 W TDP 60 W TDP 63 W 100% 57% 63% 65%
69481 Points (60%)
GPU TDP ? TDP 50 W TDP 60 W TDP 63 W TDP 450 W 43% 23% 25% 26% 100%
3DMark Vantage + NVIDIA GeForce RTX 2080 Max-Q 3DMark Vantage - 3DM Vant. Perf. total
51930 Points (15%)
3DM Vant. Perf. GPU no PhysX + NVIDIA GeForce RTX 2080 Max-Q 3DMark Vantage - 3DM Vant. Perf. GPU no PhysX
60439 Points (34%)
3DMark 06 3DMark 06 - Standard 1280x1024 + NVIDIA GeForce RTX 2080 Max-Q
min: 36228 avg: 37369 median: 37613 (49%) max: 38435 Points
Unigine Valley 1.0 - Unigine Valley 1.0 DX
201.7 fps (66%)
GPU TDP ? TDP 450 W 100% 100%
Blender - Blender 3.3 Classroom CUDA *
min: 107 avg: 110.7 median: 110 (16%) max: 115 Seconds
GPU TDP 50 W TDP 60 W TDP 63 W 100% 101% 101%
Blender - Blender 3.3 Classroom OPTIX *
min: 68 avg: 69.3 median: 68 (25%) max: 72 Seconds
GPU TDP 50 W TDP 60 W TDP 63 W 100% 102% 102%
SPECviewperf 12 + NVIDIA GeForce RTX 2080 Max-Q SPECviewperf 12 - specvp12 sw-03
69.5 fps (17%)
specvp12 sw-03 + NVIDIA GeForce RTX 3090 Ti
85.7 fps (21%)
GPU TDP ? TDP 450 W 91% 100%
specvp12 snx-02 + NVIDIA GeForce RTX 2080 Max-Q SPECviewperf 12 - specvp12 snx-02
11.4 fps (2%)
specvp12 snx-02 + NVIDIA GeForce RTX 3090 Ti
15.6 fps (2%)
GPU TDP ? TDP 450 W 87% 100%
specvp12 showcase-01 + NVIDIA GeForce RTX 2080 Max-Q SPECviewperf 12 - specvp12 showcase-01
95.6 fps (21%)
specvp12 showcase-01 + NVIDIA GeForce RTX 3090 Ti
265 fps (58%)
GPU TDP ? TDP 450 W 68% 100%
specvp12 mediacal-01 + NVIDIA GeForce RTX 2080 Max-Q SPECviewperf 12 - specvp12 mediacal-01
39.7 fps (10%)
specvp12 mediacal-01 + NVIDIA GeForce RTX 3090 Ti
87.1 fps (22%)
GPU TDP ? TDP 450 W 73% 100%
specvp12 maya-04 + NVIDIA GeForce RTX 2080 Max-Q SPECviewperf 12 - specvp12 maya-04
153.4 fps (42%)
specvp12 maya-04 + NVIDIA GeForce RTX 3090 Ti
197 fps (54%)
GPU TDP ? TDP 450 W 89% 100%
specvp12 energy-01 + NVIDIA GeForce RTX 2080 Max-Q SPECviewperf 12 - specvp12 energy-01
8.9 fps (8%)
specvp12 energy-01 + NVIDIA GeForce RTX 3090 Ti
27.6 fps (25%)
GPU TDP ? TDP 450 W 66% 100%
specvp12 creo-01 + NVIDIA GeForce RTX 2080 Max-Q SPECviewperf 12 - specvp12 creo-01
52.2 fps (21%)
specvp12 creo-01 + NVIDIA GeForce RTX 3090 Ti
76.4 fps (31%)
GPU TDP ? TDP 450 W 84% 100%
specvp12 catia-04 + NVIDIA GeForce RTX 2080 Max-Q SPECviewperf 12 - specvp12 catia-04
90.2 fps (15%)
specvp12 catia-04 + NVIDIA GeForce RTX 3090 Ti
150 fps (25%)
GPU TDP ? TDP 450 W 80% 100%
specvp12 3dsmax-05 + NVIDIA GeForce RTX 2080 Max-Q SPECviewperf 12 - specvp12 3dsmax-05
174.7 fps (31%)
specvp12 3dsmax-05 + NVIDIA GeForce RTX 3090 Ti
371 fps (65%)
GPU TDP ? TDP 450 W 74% 100%
SPECviewperf 13 specvp13 sw-04 + NVIDIA GeForce RTX 2080 Max-Q SPECviewperf 13 - specvp13 sw-04
89.3 fps (24%)
specvp13 sw-04 + NVIDIA GeForce RTX 3090 Ti
118 fps (32%)
GPU TDP ? TDP 450 W 88% 100%
specvp13 snx-03 + NVIDIA GeForce RTX 2080 Max-Q SPECviewperf 13 - specvp13 snx-03
20.3 fps (2%)
specvp13 snx-03 + NVIDIA GeForce RTX 3090 Ti
28 fps (3%)
GPU TDP ? TDP 450 W 86% 100%
specvp13 showcase-02 + NVIDIA GeForce RTX 2080 Max-Q SPECviewperf 13 - specvp13 showcase-02
95.5 fps (21%)
specvp13 showcase-02 + NVIDIA GeForce RTX 3090 Ti
265 fps (58%)
GPU TDP ? TDP 450 W 68% 100%
specvp13 medical-02 + NVIDIA GeForce RTX 2080 Max-Q SPECviewperf 13 - specvp13 medical-02
55.9 fps (12%)
specvp13 medical-02 + NVIDIA GeForce RTX 3090 Ti
113 fps (24%)
GPU TDP ? TDP 450 W 75% 100%
specvp13 maya-05 + NVIDIA GeForce RTX 2080 Max-Q SPECviewperf 13 - specvp13 maya-05
256 fps (29%)
specvp13 maya-05 + NVIDIA GeForce RTX 3090 Ti
493 fps (56%)
GPU TDP ? TDP 450 W 76% 100%
specvp13 energy-02 + NVIDIA GeForce RTX 2080 Max-Q SPECviewperf 13 - specvp13 energy-02
16 fps (5%)
specvp13 energy-02 + NVIDIA GeForce RTX 3090 Ti
48.4 fps (16%)
GPU TDP ? TDP 450 W 66% 100%
specvp13 creo-02 + NVIDIA GeForce RTX 2080 Max-Q SPECviewperf 13 - specvp13 creo-02
177.1 fps (26%)
specvp13 creo-02 + NVIDIA GeForce RTX 3090 Ti
353 fps (52%)
GPU TDP ? TDP 450 W 75% 100%
specvp13 catia-05 + NVIDIA GeForce RTX 2080 Max-Q SPECviewperf 13 - specvp13 catia-05
128 fps (14%)
specvp13 catia-05 + NVIDIA GeForce RTX 3090 Ti
230 fps (26%)
GPU TDP ? TDP 450 W 78% 100%
specvp13 3dsmax-06 + NVIDIA GeForce RTX 2080 Max-Q SPECviewperf 13 - specvp13 3dsmax-06
176.5 fps (31%)
specvp13 3dsmax-06 + NVIDIA GeForce RTX 3090 Ti
373 fps (65%)
GPU TDP ? TDP 450 W 74% 100%
SPECviewperf 2020 specvp2020 solidworks-05 4k + NVIDIA GeForce RTX 3090 Ti SPECviewperf 2020 - specvp2020 solidworks-05 4k
197 fps (58%)
GPU TDP ? TDP 450 W 100% 100%
specvp2020 snx-04 4k + NVIDIA GeForce RTX 3090 Ti SPECviewperf 2020 - specvp2020 snx-04 4k
23.7 fps (2%)
GPU TDP ? TDP 450 W 100% 100%
specvp2020 medical-03 4k + NVIDIA GeForce RTX 3090 Ti SPECviewperf 2020 - specvp2020 medical-03 4k
22.2 fps (21%)
GPU TDP ? TDP 450 W 100% 100%
specvp2020 maya-06 4k + NVIDIA GeForce RTX 3090 Ti SPECviewperf 2020 - specvp2020 maya-06 4k
353 fps (57%)
GPU TDP ? TDP 450 W 100% 100%
specvp2020 energy-03 4k + NVIDIA GeForce RTX 3090 Ti SPECviewperf 2020 - specvp2020 energy-03 4k
31.6 fps (7%)
GPU TDP ? TDP 450 W 100% 100%
specvp2020 creo-03 4k + NVIDIA GeForce RTX 3090 Ti SPECviewperf 2020 - specvp2020 creo-03 4k
84.5 fps (40%)
GPU TDP ? TDP 450 W 100% 100%
specvp2020 catia-06 4k + NVIDIA GeForce RTX 3090 Ti SPECviewperf 2020 - specvp2020 catia-06 4k
58.6 fps (38%)
GPU TDP ? TDP 450 W 100% 100%
specvp2020 3dsmax-07 4k + NVIDIA GeForce RTX 3090 Ti SPECviewperf 2020 - specvp2020 3dsmax-07 4k
145 fps (60%)
GPU TDP ? TDP 450 W 100% 100%
Cinebench R10 Cinebench R10 Shading (32bit) + NVIDIA GeForce RTX 2080 Max-Q Cinebench R10 - Cinebench R10 Shading (32bit)
min: 6820 avg: 9275 median: 8197.5 (6%) max: 13884 Points
Cinebench R11.5 Cinebench R11.5 OpenGL 64 Bit + NVIDIA GeForce RTX 2080 Max-Q Cinebench R11.5 - Cinebench R11.5 OpenGL 64 Bit
min: 73.1 avg: 77.2 median: 78.4 (27%) max: 80 fps
Cinebench R11.5 OpenGL 64 Bit + NVIDIA GeForce RTX 3090 Ti
108.2 fps (37%)
Cinebench R15 + NVIDIA GeForce RTX 3050 6GB Laptop GPU Cinebench R15 - Cinebench R15 OpenGL 64 Bit
min: 117.6 avg: 186.5 median: 221 (13%) max: 221 fps
GPU TDP 50 W TDP 60 W TDP 63 W 100% 100% 53%
Cinebench R15 OpenGL 64 Bit + NVIDIA GeForce RTX 2080 Max-Q
min: 107.8 avg: 120.4 median: 119.7 (7%) max: 138.6 fps
GPU TDP ? TDP 50 W TDP 60 W TDP 63 W 54% 100% 100% 53%
Cinebench R15 OpenGL 64 Bit + NVIDIA GeForce RTX 3090 Ti
204 fps (12%)
GPU TDP ? TDP 50 W TDP 60 W TDP 63 W 57% 100% 100% 53%
Cinebench R15 OpenGL Ref. Match 64 Bit + NVIDIA GeForce RTX 3050 6GB Laptop GPU Cinebench R15 - Cinebench R15 OpenGL Ref. Match 64 Bit
99.6 % (100%)
GPU TDP 50 W TDP 60 W TDP 63 W 100% 100% 100%
Cinebench R15 OpenGL Ref. Match 64 Bit + NVIDIA GeForce RTX 2080 Max-Q
99.6 % (100%)
GPU TDP ? TDP 50 W TDP 60 W TDP 63 W 100% 100% 100% 100%
Cinebench R15 OpenGL Ref. Match 64 Bit + NVIDIA GeForce RTX 3090 Ti
99.6 % (100%)
GPU TDP ? TDP 50 W TDP 60 W TDP 63 W 100% 100% 100% 100%
GFXBench - GFXBench Car Chase Offscreen
326 fps (37%)
Basemark GPU 1.2 - Basemark GPU 1.2 Vulkan Official Medium Offscreen 1080
min: 104.6 avg: 166.1 median: 104.6 (1%) max: 289 fps
GPU TDP 50 W TDP 60 W TDP 63 W 100% 36% 36%
Basemark GPU 1.2 - Basemark GPU 1.2 Vulkan Official High Offscreen 2160
3.6 fps (1%)
Geekbench 6.2 - Geekbench 6.2 GPU OpenCL
min: 52427 avg: 53591 median: 53590.5 (16%) max: 54754 Points
GPU TDP 50 W TDP 60 W 96% 100%
Geekbench 6.2 - Geekbench 6.2 GPU Vulkan
min: 18152 avg: 19500 median: 19499.5 (6%) max: 20847 Points
GPU TDP 50 W TDP 60 W 100% 87%
LuxMark v2.0 64Bit - LuxMark v2.0 Room GPU
2006 Samples/s (9%)
6221 Samples/s (28%)
GPU TDP ? TDP 450 W 32% 100%
LuxMark v2.0 64Bit - LuxMark v2.0 Sala GPU
5110 Samples/s (9%)
16046 Samples/s (28%)
GPU TDP ? TDP 450 W 32% 100%
ComputeMark v2.1 - ComputeMark v2.1 Result
14673 Points (16%)
52258 Points (56%)
GPU TDP ? TDP 450 W 28% 100%
Power Consumption - Furmark Stress Test Power Consumption - external Monitor *
min: 79.4 avg: 87.6 median: 87.3 (12%) max: 96.1 Watt
GPU TDP 50 W TDP 60 W TDP 63 W 101% 100% 103%
129 Watt (18%)
GPU TDP ? TDP 50 W TDP 60 W TDP 63 W 100% 107% 106% 109%
min: 598 avg: 615 median: 599 (85%) max: 648 Watt
GPU TDP ? TDP 50 W TDP 60 W TDP 63 W TDP 450 W 646% 693% 683% 702% 100%
Power Consumption - The Witcher 3 Power Consumption - external Monitor *
min: 83 avg: 87.2 median: 86.1 (12%) max: 92.6 Watt
GPU TDP 50 W TDP 60 W TDP 63 W 102% 100% 101%
131 Watt (18%)
GPU TDP ? TDP 50 W TDP 60 W TDP 63 W 100% 108% 107% 108%
min: 561 avg: 564 median: 561 (78%) max: 569 Watt
GPU TDP ? TDP 50 W TDP 60 W TDP 63 W TDP 450 W 245% 419% 413% 417% 100%
Power Consumption - Witcher 3 Power Consumption *
min: 86.8 avg: 90.8 median: 89.5 (20%) max: 96.2 Watt
GPU TDP 50 W TDP 60 W TDP 63 W 103% 100% 102%
min: 130 avg: 161.4 median: 161 (35%) max: 185.8 Watt
GPU TDP ? TDP 50 W TDP 60 W TDP 63 W 100% 125% 122% 125%
Power Consumption - Witcher 3 ultra Power Efficiency
min: 0.503 avg: 0.5 median: 0.5 (47%) max: 0.591 fps per Watt
GPU TDP 50 W TDP 60 W TDP 63 W 85% 88% 100%
min: 0.4198 avg: 0.5 median: 0.5 (44%) max: 0.534 fps per Watt
GPU TDP ? TDP 50 W TDP 60 W TDP 63 W 82% 85% 88% 100%
Power Consumption - Witcher 3 ultra Power Efficiency - external Monitor
min: 0.527 avg: 0.6 median: 0.5 (45%) max: 0.614 fps per Watt
GPU TDP 50 W TDP 60 W TDP 63 W 86% 88% 100%
0.6 fps per Watt (50%)
GPU TDP ? TDP 50 W TDP 60 W TDP 63 W 97% 86% 88% 100%
min: 0.3447 avg: 0.3 median: 0.3 (29%) max: 0.345 fps per Watt
GPU TDP ? TDP 50 W TDP 60 W TDP 63 W TDP 450 W 77% 86% 88% 100% 56%
Emissions Witcher 3 Fan Noise + NVIDIA GeForce RTX 3050 6GB Laptop GPU Emissions - Witcher 3 Fan Noise
min: 42.1 avg: 44.9 median: 43.8 (70%) max: 48.7 dB(A)
GPU TDP 50 W TDP 60 W TDP 63 W 100% 86% 90%
Witcher 3 Fan Noise + NVIDIA GeForce RTX 2080 Max-Q
min: 40.5 avg: 48 median: 48 (77%) max: 56.6 dB(A)
GPU TDP ? TDP 50 W TDP 60 W TDP 63 W 99% 100% 86% 90%
Clock Speed - GPU Clock Witcher 3 ultra
min: 915 avg: 1241 median: 1260 (49%) max: 1455 MHz
Clock Speed - GPU Clock Speed Furmark
1003 MHz (40%)
Average Benchmarks NVIDIA GeForce RTX 3050 6GB Laptop GPU → 100% n=13 Average Benchmarks NVIDIA GeForce RTX 2080 Max-Q → 170% n=13 Average Benchmarks NVIDIA GeForce RTX 3090 Ti → 328% n=13
- Range of benchmark values for this graphics card
- Average benchmark values for this graphics card
* Smaller numbers mean a higher performance
1 This benchmark is not used for the average calculation
Game Benchmarks The following benchmarks stem from our benchmarks of review laptops. The performance depends on the used graphics memory, clock rate, processor, system settings, drivers, and operating systems. So the results don't have to be representative for all laptops with this GPU. For detailed information on the benchmark results, click on the fps number.
100%
GeForce RTX 3050 6GB Laptop GPU:
39.5 fps
100%
GeForce RTX 3050 6GB Laptop GPU:
36.3 fps
100%
GeForce RTX 3050 6GB Laptop GPU:
31.5 fps
100%
GeForce RTX 3050 6GB Laptop GPU:
23.4 fps
100%
GeForce RTX 3050 6GB Laptop GPU:
15.1 fps
100%
GeForce RTX 3050 6GB Laptop GPU:
70 fps
100%
GeForce RTX 3050 6GB Laptop GPU:
63 fps
100%
GeForce RTX 3050 6GB Laptop GPU:
55 fps
100%
GeForce RTX 3050 6GB Laptop GPU:
41 fps
100%
GeForce RTX 3050 6GB Laptop GPU:
31 fps
100%
GeForce RTX 3050 6GB Laptop GPU:
55.2 67.6 ~ 61 fps
100%
GeForce RTX 3050 6GB Laptop GPU:
43.7 52.1 ~ 48 fps
100%
GeForce RTX 3050 6GB Laptop GPU:
36.6 43.2 ~ 40 fps
100%
GeForce RTX 3050 6GB Laptop GPU:
31.4 36.9 ~ 34 fps
100%
GeForce RTX 3050 6GB Laptop GPU:
21.3 fps
100%
GeForce RTX 3050 6GB Laptop GPU:
113.9 150.1 ~ 132 fps
100%
GeForce RTX 3050 6GB Laptop GPU:
109 141.2 ~ 125 fps
100%
GeForce RTX 3050 6GB Laptop GPU:
86.9 97.5 ~ 92 fps
100%
GeForce RTX 3050 6GB Laptop GPU:
20.5 26 ~ 23 fps
100%
GeForce RTX 3050 6GB Laptop GPU:
10.6 14.3 ~ 12 fps
100%
GeForce RTX 3050 6GB Laptop GPU:
40 fps
100%
GeForce RTX 3050 6GB Laptop GPU:
38 fps
100%
GeForce RTX 3050 6GB Laptop GPU:
34 fps
100%
GeForce RTX 3050 6GB Laptop GPU:
29 fps
100%
GeForce RTX 3050 6GB Laptop GPU:
30.7 33.6 34 ~ 33 fps
100%
GeForce RTX 3050 6GB Laptop GPU:
18.1 20.1 ~ 19 fps
NVIDIA GeForce RTX 3090 Ti:
263 263 [X] AMD Ryzen 7 5800X3D AMD Ryzen 7 5800X3D 3.4GHz
NVIDIA GeForce RTX 3090 Ti
min:
46.1 fps, P0.1:
75.9 fps, P1:
201 fps, max:
403 fps
~ 263 fps
NVIDIA GeForce RTX 3090 Ti:
260 260 [X] AMD Ryzen 7 5800X3D AMD Ryzen 7 5800X3D 3.4GHz
NVIDIA GeForce RTX 3090 Ti
min:
41.5 fps, P0.1:
79.1 fps, P1:
196.1 fps, max:
403 fps
~ 260 fps
NVIDIA GeForce RTX 3090 Ti:
261 261 [X] AMD Ryzen 7 5800X3D AMD Ryzen 7 5800X3D 3.4GHz
NVIDIA GeForce RTX 3090 Ti
min:
27.3 fps, P0.1:
83.4 fps, P1:
198.3 fps, max:
413 fps
~ 261 fps
NVIDIA GeForce RTX 3090 Ti:
261 261 [X] AMD Ryzen 7 5800X3D AMD Ryzen 7 5800X3D 3.4GHz
NVIDIA GeForce RTX 3090 Ti
min:
32.3 fps, P0.1:
79.8 fps, P1:
179.6 fps, max:
410 fps
~ 261 fps
NVIDIA GeForce RTX 3090 Ti:
210 210 [X] AMD Ryzen 7 5800X3D AMD Ryzen 7 5800X3D 3.4GHz
NVIDIA GeForce RTX 3090 Ti
min:
33 fps, P0.1:
72.3 fps, P1:
144.7 fps, max:
319 fps
~ 210 fps
NVIDIA GeForce RTX 3090 Ti:
113.2 113.2 [X] AMD Ryzen 7 5800X3D AMD Ryzen 7 5800X3D 3.4GHz
NVIDIA GeForce RTX 3090 Ti
min:
28.8 fps, P0.1:
56.8 fps, P1:
68.3 fps, max:
281 fps
~ 113 fps
100%
GeForce RTX 3050 6GB Laptop GPU:
113.3 fps
286%
NVIDIA GeForce RTX 3090 Ti:
324 fps
100%
GeForce RTX 3050 6GB Laptop GPU:
89.7 fps
309%
NVIDIA GeForce RTX 3090 Ti:
277 277 ~ 277 fps
100%
GeForce RTX 3050 6GB Laptop GPU:
59.2 fps
390%
NVIDIA GeForce RTX 3090 Ti:
231 231 ~ 231 fps
100%
GeForce RTX 3050 6GB Laptop GPU:
46.4 fps
409%
NVIDIA GeForce RTX 3090 Ti:
190.2 190.2 ~ 190 fps
NVIDIA GeForce RTX 3090 Ti:
81.1 81.1 ~ 81 fps
100%
GeForce RTX 3050 6GB Laptop GPU:
80.8 fps
271%
NVIDIA GeForce RTX 3090 Ti:
219 219 ~ 219 fps
100%
GeForce RTX 3050 6GB Laptop GPU:
64.2 fps
313%
NVIDIA GeForce RTX 3090 Ti:
201 201 ~ 201 fps
100%
GeForce RTX 3050 6GB Laptop GPU:
46.4 fps
373%
NVIDIA GeForce RTX 3090 Ti:
172.8 172.8 ~ 173 fps
100%
GeForce RTX 3050 6GB Laptop GPU:
38.5 fps
395%
NVIDIA GeForce RTX 3090 Ti:
151.8 151.8 ~ 152 fps
NVIDIA GeForce RTX 3090 Ti:
53.3 53.3 ~ 53 fps
NVIDIA GeForce RTX 3090 Ti:
228 228 ~ 228 fps
NVIDIA GeForce RTX 3090 Ti:
202 202 ~ 202 fps
NVIDIA GeForce RTX 3090 Ti:
60 60 [X] AMD Ryzen 7 5800X3D AMD Ryzen 7 5800X3D 3.4GHz
NVIDIA GeForce RTX 3090 Ti
min:
33.1 fps, P0.1:
40 fps, P1:
54.8 fps, max:
125.9 fps
~ 60 fps
NVIDIA GeForce RTX 3090 Ti:
60 60 [X] AMD Ryzen 7 5800X3D AMD Ryzen 7 5800X3D 3.4GHz
NVIDIA GeForce RTX 3090 Ti
min:
33.7 fps, P0.1:
38.6 fps, P1:
54.4 fps, max:
142.2 fps
~ 60 fps
NVIDIA GeForce RTX 3090 Ti:
60 60 [X] AMD Ryzen 7 5800X3D AMD Ryzen 7 5800X3D 3.4GHz
NVIDIA GeForce RTX 3090 Ti
min:
32.8 fps, P0.1:
40 fps, P1:
54.1 fps, max:
130.7 fps
~ 60 fps
NVIDIA GeForce RTX 3090 Ti:
60 60 [X] AMD Ryzen 7 5800X3D AMD Ryzen 7 5800X3D 3.4GHz
NVIDIA GeForce RTX 3090 Ti
min:
33.1 fps, P0.1:
39.3 fps, P1:
53.7 fps, max:
123.9 fps
~ 60 fps
NVIDIA GeForce RTX 3090 Ti:
60 60 [X] AMD Ryzen 7 5800X3D AMD Ryzen 7 5800X3D 3.4GHz
NVIDIA GeForce RTX 3090 Ti
min:
32.5 fps, P0.1:
36.7 fps, P1:
53 fps, max:
138.9 fps
~ 60 fps
NVIDIA GeForce RTX 3090 Ti:
60 60 [X] AMD Ryzen 7 5800X3D AMD Ryzen 7 5800X3D 3.4GHz
NVIDIA GeForce RTX 3090 Ti
min:
30.1 fps, P0.1:
39.7 fps, P1:
52.4 fps, max:
127.2 fps
~ 60 fps
NVIDIA GeForce RTX 3090 Ti:
202 202 [X] AMD Ryzen 7 5800X3D AMD Ryzen 7 5800X3D 3.4GHz
NVIDIA GeForce RTX 3090 Ti
min:
89.3 fps, P0.1:
148.3 fps, P1:
185.1 fps, max:
249 fps
~ 202 fps
NVIDIA GeForce RTX 3090 Ti:
171.4 171.4 [X] AMD Ryzen 7 5800X3D AMD Ryzen 7 5800X3D 3.4GHz
NVIDIA GeForce RTX 3090 Ti
min:
37.5 fps, P0.1:
134.1 fps, P1:
156.7 fps, max:
193.6 fps
~ 171 fps
NVIDIA GeForce RTX 3090 Ti:
153 153 [X] AMD Ryzen 7 5800X3D AMD Ryzen 7 5800X3D 3.4GHz
NVIDIA GeForce RTX 3090 Ti
min:
36.2 fps, P0.1:
88.3 fps, P1:
140.6 fps, max:
185.8 fps
~ 153 fps
NVIDIA GeForce RTX 3090 Ti:
113.2 113.2 [X] AMD Ryzen 7 5800X3D AMD Ryzen 7 5800X3D 3.4GHz
NVIDIA GeForce RTX 3090 Ti
min:
40.3 fps, P0.1:
79.1 fps, P1:
105.2 fps, max:
133.5 fps
~ 113 fps
NVIDIA GeForce RTX 3090 Ti:
64.3 64.3 [X] AMD Ryzen 7 5800X3D AMD Ryzen 7 5800X3D 3.4GHz
NVIDIA GeForce RTX 3090 Ti
min:
27.7 fps, P0.1:
40.2 fps, P1:
60 fps, max:
71.2 fps
~ 64 fps
NVIDIA GeForce RTX 3090 Ti:
411 411 ~ 411 fps
NVIDIA GeForce RTX 3090 Ti:
347 347 ~ 347 fps
NVIDIA GeForce RTX 3090 Ti:
315 315 ~ 315 fps
NVIDIA GeForce RTX 3090 Ti:
290 290 ~ 290 fps
NVIDIA GeForce RTX 3090 Ti:
208 208 ~ 208 fps
NVIDIA GeForce RTX 3090 Ti:
116 116 ~ 116 fps
NVIDIA GeForce RTX 3090 Ti:
231 fps
NVIDIA GeForce RTX 3090 Ti:
200 200 ~ 200 fps
NVIDIA GeForce RTX 3090 Ti:
188 188 ~ 188 fps
NVIDIA GeForce RTX 3090 Ti:
127 127 ~ 127 fps
NVIDIA GeForce RTX 3090 Ti:
114 114 ~ 114 fps
NVIDIA GeForce RTX 3090 Ti:
89 89 ~ 89 fps
NVIDIA GeForce RTX 3090 Ti:
195.5 195.5 [X] AMD Ryzen 7 5800X3D AMD Ryzen 7 5800X3D 3.4GHz
NVIDIA GeForce RTX 3090 Ti
min:
117 fps, P0.1:
128.1 fps, P1:
161.1 fps, max:
406 fps
~ 196 fps
NVIDIA GeForce RTX 3090 Ti:
207 207 [X] AMD Ryzen 7 5800X3D AMD Ryzen 7 5800X3D 3.4GHz
NVIDIA GeForce RTX 3090 Ti
min:
115 fps, P0.1:
130.5 fps, P1:
168.7 fps, max:
414 fps
~ 207 fps
NVIDIA GeForce RTX 3090 Ti:
191.2 191.2 [X] AMD Ryzen 7 5800X3D AMD Ryzen 7 5800X3D 3.4GHz
NVIDIA GeForce RTX 3090 Ti
min:
79.1 fps, P0.1:
121.3 fps, P1:
152.5 fps, max:
408 fps
~ 191 fps
NVIDIA GeForce RTX 3090 Ti:
149.9 149.9 [X] AMD Ryzen 7 5800X3D AMD Ryzen 7 5800X3D 3.4GHz
NVIDIA GeForce RTX 3090 Ti
min:
75.1 fps, P0.1:
117.6 fps, P1:
127 fps, max:
395 fps
~ 150 fps
NVIDIA GeForce RTX 3090 Ti:
93.7 93.7 [X] AMD Ryzen 7 5800X3D AMD Ryzen 7 5800X3D 3.4GHz
NVIDIA GeForce RTX 3090 Ti
min:
72.7 fps, P0.1:
81.2 fps, P1:
83.7 fps, max:
154.8 fps
~ 94 fps
NVIDIA GeForce RTX 3090 Ti:
179 179 ~ 179 fps
NVIDIA GeForce RTX 3090 Ti:
161.6 162 ~ 162 fps
NVIDIA GeForce RTX 3090 Ti:
142 142 ~ 142 fps
NVIDIA GeForce RTX 3090 Ti:
89.9 90 ~ 90 fps
100%
GeForce RTX 3050 6GB Laptop GPU:
218 fps
100%
GeForce RTX 3050 6GB Laptop GPU:
127.4 fps
422%
NVIDIA GeForce RTX 3090 Ti:
537 537 [X] AMD Ryzen 7 5800X3D 874931
AMD Ryzen 7 5800X3D 3.4GHz
NVIDIA GeForce RTX 3090 Ti
min:
421 fps, P1:
347 fps, max:
585 fps
~ 537 fps
100%
GeForce RTX 3050 6GB Laptop GPU:
104.8 fps
448%
NVIDIA GeForce RTX 3090 Ti:
470 470 [X] AMD Ryzen 7 5800X3D 874931
AMD Ryzen 7 5800X3D 3.4GHz
NVIDIA GeForce RTX 3090 Ti
min:
395 fps, P1:
316 fps, max:
516 fps
~ 470 fps
100%
GeForce RTX 3050 6GB Laptop GPU:
61.9 fps
391%
NVIDIA GeForce RTX 3090 Ti:
242 242 [X] AMD Ryzen 7 5800X3D 874931
AMD Ryzen 7 5800X3D 3.4GHz
NVIDIA GeForce RTX 3090 Ti
min:
172 fps, P1:
179 fps, max:
271 fps
~ 242 fps
100%
GeForce RTX 3050 6GB Laptop GPU:
40 fps
473%
NVIDIA GeForce RTX 3090 Ti:
189.3 189.3 [X] AMD Ryzen 7 5800X3D 874931
AMD Ryzen 7 5800X3D 3.4GHz
NVIDIA GeForce RTX 3090 Ti
min:
161 fps, P1:
161 fps, max:
209 fps
~ 189 fps
NVIDIA GeForce RTX 3090 Ti:
114.9 114.9 [X] AMD Ryzen 7 5800X3D 874931
AMD Ryzen 7 5800X3D 3.4GHz
NVIDIA GeForce RTX 3090 Ti
min:
99 fps, P1:
100 fps, max:
128 fps
~ 115 fps
NVIDIA GeForce RTX 3090 Ti:
160 160 ~ 160 fps
NVIDIA GeForce RTX 3090 Ti:
138 138 ~ 138 fps
NVIDIA GeForce RTX 3090 Ti:
123 123 ~ 123 fps
NVIDIA GeForce RTX 3090 Ti:
108 108 ~ 108 fps
NVIDIA GeForce RTX 3090 Ti:
73 73 ~ 73 fps
NVIDIA GeForce RTX 3090 Ti:
171.4 171.4 [X] AMD Ryzen 7 5800X3D AMD Ryzen 7 5800X3D 3.4GHz
NVIDIA GeForce RTX 3090 Ti
min:
75.65 fps, P1:
123.08 fps, max:
245.68 fps
~ 171 fps
NVIDIA GeForce RTX 3090 Ti:
154.2 154.2 [X] AMD Ryzen 7 5800X3D AMD Ryzen 7 5800X3D 3.4GHz
NVIDIA GeForce RTX 3090 Ti
min:
88.03 fps, P1:
113.17 fps, max:
222.42 fps
~ 154 fps
NVIDIA GeForce RTX 3090 Ti:
130.2 130.2 [X] AMD Ryzen 7 5800X3D AMD Ryzen 7 5800X3D 3.4GHz
NVIDIA GeForce RTX 3090 Ti
min:
80.06 fps, P1:
100.27 fps, max:
192.77 fps
~ 130 fps
NVIDIA GeForce RTX 3090 Ti:
107.8 107.8 [X] AMD Ryzen 7 5800X3D AMD Ryzen 7 5800X3D 3.4GHz
NVIDIA GeForce RTX 3090 Ti
min:
37.5 fps, P1:
87.55 fps, max:
159.3 fps
~ 108 fps
NVIDIA GeForce RTX 3090 Ti:
70.1 70.1 [X] AMD Ryzen 7 5800X3D AMD Ryzen 7 5800X3D 3.4GHz
NVIDIA GeForce RTX 3090 Ti
min:
42.4 fps, P1:
58.37 fps, max:
143.5 fps
~ 70 fps
NVIDIA GeForce RTX 3090 Ti:
240 240 [X] AMD Ryzen 7 5800X3D AMD Ryzen 7 5800X3D 3.4GHz
NVIDIA GeForce RTX 3090 Ti
min:
24 fps, P0.1:
112.2 fps, P1:
170.4 fps, max:
468 fps
240 [X] AMD Ryzen 7 5800X3D AMD Ryzen 7 5800X3D 3.4GHz
NVIDIA GeForce RTX 3090 Ti
min:
24 fps, P0.1:
112.2 fps, P1:
170.4 fps, max:
468 fps
~ 240 fps
NVIDIA GeForce RTX 3090 Ti:
231 231 [X] AMD Ryzen 7 5800X3D AMD Ryzen 7 5800X3D 3.4GHz
NVIDIA GeForce RTX 3090 Ti
min:
84.7 fps, P0.1:
116.2 fps, P1:
160.4 fps, max:
402 fps
~ 231 fps
NVIDIA GeForce RTX 3090 Ti:
173.9 173.9 [X] AMD Ryzen 7 5800X3D AMD Ryzen 7 5800X3D 3.4GHz
NVIDIA GeForce RTX 3090 Ti
min:
73.1 fps, P0.1:
101.4 fps, P1:
134.6 fps, max:
324 fps
~ 174 fps
NVIDIA GeForce RTX 3090 Ti:
99.2 99.2 [X] AMD Ryzen 7 5800X3D AMD Ryzen 7 5800X3D 3.4GHz
NVIDIA GeForce RTX 3090 Ti
min:
29.7 fps, P0.1:
56 fps, P1:
77.1 fps, max:
331 fps
~ 99 fps
GeForce RTX 2080 Max-Q:
156 fps
GeForce RTX 2080 Max-Q:
140 fps
GeForce RTX 2080 Max-Q:
138 fps
GeForce RTX 2080 Max-Q:
134 fps
GeForce RTX 2080 Max-Q:
184 fps
GeForce RTX 2080 Max-Q:
134 fps
GeForce RTX 2080 Max-Q:
121 fps
GeForce RTX 2080 Max-Q:
121 fps
GeForce RTX 2080 Max-Q:
121 fps
GeForce RTX 2080 Max-Q:
120 fps
GeForce RTX 2080 Max-Q:
117 fps
GeForce RTX 2080 Max-Q:
121 fps
GeForce RTX 2080 Max-Q:
102.6 fps
GeForce RTX 2080 Max-Q:
72.8 fps
GeForce RTX 2080 Max-Q:
45.6 fps
GeForce RTX 2080 Max-Q:
94.5 fps
GeForce RTX 2080 Max-Q:
84.2 fps
GeForce RTX 2080 Max-Q:
82.3 fps
GeForce RTX 2080 Max-Q:
85.6 fps
GeForce RTX 2080 Max-Q:
66 fps
GeForce RTX 2080 Max-Q:
63.6 fps
GeForce RTX 2080 Max-Q:
57.2 fps
GeForce RTX 2080 Max-Q:
171.5 fps
GeForce RTX 2080 Max-Q:
126.7 fps
GeForce RTX 2080 Max-Q:
104.9 fps
GeForce RTX 2080 Max-Q:
90.6 fps
GeForce RTX 2080 Max-Q:
213.5 fps
GeForce RTX 2080 Max-Q:
187.6 fps
GeForce RTX 2080 Max-Q:
120.7 fps
GeForce RTX 2080 Max-Q:
81.3 fps
GeForce RTX 2080 Max-Q:
105 fps
GeForce RTX 2080 Max-Q:
95 fps
GeForce RTX 2080 Max-Q:
92 fps
GeForce RTX 2080 Max-Q:
71 fps
GeForce RTX 2080 Max-Q:
214.6 fps
GeForce RTX 2080 Max-Q:
208.1 fps
GeForce RTX 2080 Max-Q:
197.7 fps
GeForce RTX 2080 Max-Q:
197.1 fps
GeForce RTX 2080 Max-Q:
128.8 fps
GeForce RTX 2080 Max-Q:
110.8 fps
NVIDIA GeForce RTX 3090 Ti:
204 204 ~ 204 fps
GeForce RTX 2080 Max-Q:
84.7 fps
GeForce RTX 2080 Max-Q:
67.1 fps
NVIDIA GeForce RTX 3090 Ti:
83.8 83.8 ~ 84 fps
GeForce RTX 2080 Max-Q:
231.9 fps
GeForce RTX 2080 Max-Q:
92.8 fps
NVIDIA GeForce RTX 3090 Ti:
240 240 [X] AMD Ryzen 7 5800X3D AMD Ryzen 7 5800X3D 3.4GHz
NVIDIA GeForce RTX 3090 Ti
min:
111.7 fps, P0.1:
137.1 fps, P1:
150 fps, max:
576 fps
~ 240 fps
GeForce RTX 2080 Max-Q:
71.9 fps
NVIDIA GeForce RTX 3090 Ti:
209 209 [X] AMD Ryzen 7 5800X3D AMD Ryzen 7 5800X3D 3.4GHz
NVIDIA GeForce RTX 3090 Ti
min:
55.6 fps, P0.1:
119.8 fps, P1:
162.7 fps, max:
646 fps
~ 209 fps
NVIDIA GeForce RTX 3090 Ti:
142.5 142.5 [X] AMD Ryzen 7 5800X3D AMD Ryzen 7 5800X3D 3.4GHz
NVIDIA GeForce RTX 3090 Ti
min:
51.8 fps, P0.1:
81.9 fps, P1:
115.5 fps, max:
567 fps
~ 143 fps
NVIDIA GeForce RTX 3090 Ti:
73.9 73.9 [X] AMD Ryzen 7 5800X3D AMD Ryzen 7 5800X3D 3.4GHz
NVIDIA GeForce RTX 3090 Ti
min:
46.2 fps, P0.1:
53.2 fps, P1:
62.6 fps, max:
167 fps
~ 74 fps
GeForce RTX 2080 Max-Q:
188 fps
GeForce RTX 2080 Max-Q:
165 fps
GeForce RTX 2080 Max-Q:
137 fps
GeForce RTX 2080 Max-Q:
114 fps
GeForce RTX 2080 Max-Q:
224.8 [X] SCHENKER Key 16 Intel Core i7-8750H 2.2GHz
GeForce RTX 2080 Max-Q
min:
141 fps, max:
317 fps
fps
GeForce RTX 2080 Max-Q:
126.1 [X] SCHENKER Key 16 Intel Core i7-8750H 2.2GHz
GeForce RTX 2080 Max-Q
min:
89 fps, max:
177 fps
fps
GeForce RTX 2080 Max-Q:
88.8 [X] SCHENKER Key 16 Intel Core i7-8750H 2.2GHz
GeForce RTX 2080 Max-Q
min:
42 fps, max:
109 fps
fps
GeForce RTX 2080 Max-Q:
65.5 [X] SCHENKER Key 16 Intel Core i7-8750H 2.2GHz
GeForce RTX 2080 Max-Q
min:
27 fps, max:
79 fps
fps
NVIDIA GeForce RTX 3090 Ti:
59.9 59.9 ~ 60 fps
GeForce RTX 2080 Max-Q:
111 112.2 ~ 112 fps
GeForce RTX 2080 Max-Q:
93.5 96.1 ~ 95 fps
GeForce RTX 2080 Max-Q:
91.9 93.3 ~ 93 fps
GeForce RTX 2080 Max-Q:
98.5 fps
GeForce RTX 2080 Max-Q:
93.9 fps
GeForce RTX 2080 Max-Q:
77.7 fps
GeForce RTX 2080 Max-Q:
41.2 fps
GeForce RTX 2080 Max-Q:
132 fps
GeForce RTX 2080 Max-Q:
97 fps
GeForce RTX 2080 Max-Q:
84 93 ~ 89 fps
GeForce RTX 2080 Max-Q:
69 77 ~ 73 fps
GeForce RTX 2080 Max-Q:
26 fps
GeForce RTX 2080 Max-Q:
157.8 fps
GeForce RTX 2080 Max-Q:
116.1 fps
GeForce RTX 2080 Max-Q:
101.1 143 ~ 122 fps
GeForce RTX 2080 Max-Q:
66.3 85.1 ~ 76 fps
GeForce RTX 2080 Max-Q:
31.2 fps
GeForce RTX 2080 Max-Q:
84.5 fps
GeForce RTX 2080 Max-Q:
73.7 fps
GeForce RTX 2080 Max-Q:
72.1 86.1 ~ 79 fps
GeForce RTX 2080 Max-Q:
67.4 78.9 ~ 73 fps
GeForce RTX 2080 Max-Q:
26.4 fps
GeForce RTX 2080 Max-Q:
88 95 98 ~ 94 fps
GeForce RTX 2080 Max-Q:
82 90 92 94 ~ 90 fps
GeForce RTX 2080 Max-Q:
74 81 82 85 ~ 81 fps
GeForce RTX 2080 Max-Q:
36 fps
NVIDIA GeForce RTX 3090 Ti:
213 213 ~ 213 fps
GeForce RTX 2080 Max-Q:
47.8 54 58.4 [X] Lenovo LEGION Y740 Intel Core i7-9750H 2.6GHz
GeForce RTX 2080 Max-Q
59 59 62 [X] Asus ROG GX701G Intel Core i7-9750H 2.6GHz
GeForce RTX 2080 Max-Q
~ 57 fps
GeForce RTX 2080 Max-Q:
20.9 fps
NVIDIA GeForce RTX 3090 Ti:
84.3 84.3 ~ 84 fps
GeForce RTX 2080 Max-Q:
143.7 fps
GeForce RTX 2080 Max-Q:
137.1 fps
GeForce RTX 2080 Max-Q:
111.8 130 ~ 121 fps
GeForce RTX 2080 Max-Q:
109.9 128 ~ 119 fps
GeForce RTX 2080 Max-Q:
36 fps
GeForce RTX 2080 Max-Q:
137 140 [X] Acer Triton 500 Intel Core i7-8750H 2.2GHz
GeForce RTX 2080 Max-Q
min:
128 fps
~ 139 fps
GeForce RTX 2080 Max-Q:
103 104 [X] Acer Triton 500 Intel Core i7-8750H 2.2GHz
GeForce RTX 2080 Max-Q
min:
97 fps
~ 104 fps
GeForce RTX 2080 Max-Q:
98.1 [X] Acer Triton 500 Intel Core i7-8750H 2.2GHz
GeForce RTX 2080 Max-Q
min:
89 fps
101 ~ 100 fps
GeForce RTX 2080 Max-Q:
67.6 [X] Acer Triton 500 Intel Core i7-8750H 2.2GHz
GeForce RTX 2080 Max-Q
min:
62 fps
69.9 ~ 69 fps
GeForce RTX 2080 Max-Q:
39.5 [X] Acer Triton 500 Intel Core i7-8750H 2.2GHz
GeForce RTX 2080 Max-Q
min:
36 fps
39.9 ~ 40 fps
GeForce RTX 2080 Max-Q:
137 fps
GeForce RTX 2080 Max-Q:
103.5 126 [X] Acer Triton 500 Intel Core i7-8750H 2.2GHz
GeForce RTX 2080 Max-Q
min:
82 fps
130 ~ 120 fps
GeForce RTX 2080 Max-Q:
84.5 [X] Gigabyte Aero 15-Y9 Single-Channel
Intel Core i9-8950HK 2.9GHz
GeForce RTX 2080 Max-Q
94.3 110 [X] Acer Triton 500 Intel Core i7-8750H 2.2GHz
GeForce RTX 2080 Max-Q
min:
77 fps
121 ~ 102 fps
GeForce RTX 2080 Max-Q:
81.4 [X] Gigabyte Aero 15-Y9 Single-Channel
Intel Core i9-8950HK 2.9GHz
GeForce RTX 2080 Max-Q
84.8 103 [X] Acer Triton 500 Intel Core i7-8750H 2.2GHz
GeForce RTX 2080 Max-Q
min:
74 fps
112 ~ 95 fps
GeForce RTX 2080 Max-Q:
75.2 [X] Acer Triton 500 Intel Core i7-8750H 2.2GHz
GeForce RTX 2080 Max-Q
min:
64 fps
82.6 ~ 79 fps
GeForce RTX 2080 Max-Q:
29.8 37.8 [X] Acer Triton 500 Intel Core i7-8750H 2.2GHz
GeForce RTX 2080 Max-Q
min:
32 fps
42.7 ~ 37 fps
GeForce RTX 2080 Max-Q:
131 [X] Acer Triton 500 Intel Core i7-8750H 2.2GHz
GeForce RTX 2080 Max-Q
min:
102 fps
143 ~ 137 fps
GeForce RTX 2080 Max-Q:
121 [X] Acer Triton 500 Intel Core i7-8750H 2.2GHz
GeForce RTX 2080 Max-Q
min:
96 fps
130 ~ 126 fps
GeForce RTX 2080 Max-Q:
112 116 [X] Acer Triton 500 Intel Core i7-8750H 2.2GHz
GeForce RTX 2080 Max-Q
min:
88 fps
122 ~ 117 fps
GeForce RTX 2080 Max-Q:
91.2 91.6 [X] Acer Triton 500 Intel Core i7-8750H 2.2GHz
GeForce RTX 2080 Max-Q
min:
72 fps
98.2 ~ 94 fps
GeForce RTX 2080 Max-Q:
52.4 52.5 [X] Acer Triton 500 Intel Core i7-8750H 2.2GHz
GeForce RTX 2080 Max-Q
min:
42 fps
57.8 ~ 54 fps
GeForce RTX 2080 Max-Q:
144 [X] Acer Triton 500 Intel Core i7-8750H 2.2GHz
GeForce RTX 2080 Max-Q
min:
123 fps
161 ~ 153 fps
GeForce RTX 2080 Max-Q:
130 [X] Acer Triton 500 Intel Core i7-8750H 2.2GHz
GeForce RTX 2080 Max-Q
min:
112 fps
141 ~ 136 fps
GeForce RTX 2080 Max-Q:
121 [X] Acer Triton 500 Intel Core i7-8750H 2.2GHz
GeForce RTX 2080 Max-Q
min:
101 fps
131 ~ 126 fps
GeForce RTX 2080 Max-Q:
107 [X] Acer Triton 500 Intel Core i7-8750H 2.2GHz
GeForce RTX 2080 Max-Q
min:
89 fps
113 ~ 110 fps
GeForce RTX 2080 Max-Q:
77.9 [X] Acer Triton 500 Intel Core i7-8750H 2.2GHz
GeForce RTX 2080 Max-Q
min:
59 fps
78.8 ~ 78 fps
GeForce RTX 2080 Max-Q:
70.3 [X] Acer Triton 500 Intel Core i7-8750H 2.2GHz
GeForce RTX 2080 Max-Q
min:
51 fps
70.9 ~ 71 fps
GeForce RTX 2080 Max-Q:
67.1 [X] Acer Triton 500 Intel Core i7-8750H 2.2GHz
GeForce RTX 2080 Max-Q
min:
45 fps
69.1 ~ 68 fps
GeForce RTX 2080 Max-Q:
65.3 [X] Acer Triton 500 Intel Core i7-8750H 2.2GHz
GeForce RTX 2080 Max-Q
min:
44 fps
66 ~ 66 fps
GeForce RTX 2080 Max-Q:
38.2 [X] Acer Triton 500 Intel Core i7-8750H 2.2GHz
GeForce RTX 2080 Max-Q
min:
32 fps
fps
GeForce RTX 2080 Max-Q:
140 [X] Asus GX701GX (Optimus-Mode) Intel Core i7-8750H 2.2GHz
GeForce RTX 2080 Max-Q
min:
111 fps
142 [X] Acer Triton 500 Intel Core i7-8750H 2.2GHz
GeForce RTX 2080 Max-Q
min:
102 fps
151 ~ 144 fps
GeForce RTX 2080 Max-Q:
128 [X] Asus GX701GX (Optimus-Mode) Intel Core i7-8750H 2.2GHz
GeForce RTX 2080 Max-Q
min:
106 fps
132 [X] Acer Triton 500 Intel Core i7-8750H 2.2GHz
GeForce RTX 2080 Max-Q
min:
99 fps
138 ~ 133 fps
GeForce RTX 2080 Max-Q:
125 [X] Asus GX701GX (Optimus-Mode) Intel Core i7-8750H 2.2GHz
GeForce RTX 2080 Max-Q
min:
101 fps
128 [X] Acer Triton 500 Intel Core i7-8750H 2.2GHz
GeForce RTX 2080 Max-Q
min:
94 fps
131 ~ 128 fps
GeForce RTX 2080 Max-Q:
83.8 [X] Acer Triton 500 Intel Core i7-8750H 2.2GHz
GeForce RTX 2080 Max-Q
min:
62 fps
91.4 ~ 88 fps
GeForce RTX 2080 Max-Q:
40.4 [X] Acer Triton 500 Intel Core i7-8750H 2.2GHz
GeForce RTX 2080 Max-Q
min:
30 fps
41.6 ~ 41 fps
GeForce RTX 2080 Max-Q:
68 [X] Acer Triton 500 Intel Core i7-8750H 2.2GHz
GeForce RTX 2080 Max-Q
min:
39 fps
81 [X] Asus GX701GX (Optimus-Mode) Intel Core i7-8750H 2.2GHz
GeForce RTX 2080 Max-Q
87 ~ 79 fps
GeForce RTX 2080 Max-Q:
64 [X] Acer Triton 500 Intel Core i7-8750H 2.2GHz
GeForce RTX 2080 Max-Q
min:
38 fps
72 [X] Asus GX701GX (Optimus-Mode) Intel Core i7-8750H 2.2GHz
GeForce RTX 2080 Max-Q
76 ~ 71 fps
GeForce RTX 2080 Max-Q:
53 [X] Acer Triton 500 Intel Core i7-8750H 2.2GHz
GeForce RTX 2080 Max-Q
min:
27 fps
56 [X] Asus GX701GX (Optimus-Mode) Intel Core i7-8750H 2.2GHz
GeForce RTX 2080 Max-Q
59 ~ 56 fps
GeForce RTX 2080 Max-Q:
46 [X] Acer Triton 500 Intel Core i7-8750H 2.2GHz
GeForce RTX 2080 Max-Q
min:
19 fps
48 ~ 47 fps
GeForce RTX 2080 Max-Q:
30 [X] Acer Triton 500 Intel Core i7-8750H 2.2GHz
GeForce RTX 2080 Max-Q
min:
15 fps
32 ~ 31 fps
GeForce RTX 2080 Max-Q:
203 [X] Asus GX701GX (Optimus-Mode) Intel Core i7-8750H 2.2GHz
GeForce RTX 2080 Max-Q
min:
189 fps
271 272 [X] Acer Triton 500 Intel Core i7-8750H 2.2GHz
GeForce RTX 2080 Max-Q
min:
252 fps
~ 249 fps
GeForce RTX 2080 Max-Q:
186 [X] Asus GX701GX (Optimus-Mode) Intel Core i7-8750H 2.2GHz
GeForce RTX 2080 Max-Q
min:
177 fps
223 [X] Acer Triton 500 Intel Core i7-8750H 2.2GHz
GeForce RTX 2080 Max-Q
min:
196 fps
254 ~ 221 fps
GeForce RTX 2080 Max-Q:
182 [X] Asus GX701GX (Optimus-Mode) Intel Core i7-8750H 2.2GHz
GeForce RTX 2080 Max-Q
min:
174 fps
219 [X] Acer Triton 500 Intel Core i7-8750H 2.2GHz
GeForce RTX 2080 Max-Q
min:
192 fps
248 ~ 216 fps
GeForce RTX 2080 Max-Q:
211 [X] Acer Triton 500 Intel Core i7-8750H 2.2GHz
GeForce RTX 2080 Max-Q
min:
187 fps
237 ~ 224 fps
GeForce RTX 2080 Max-Q:
161 [X] Acer Triton 500 Intel Core i7-8750H 2.2GHz
GeForce RTX 2080 Max-Q
min:
135 fps
188 ~ 175 fps
GeForce RTX 2080 Max-Q:
80 [X] Acer Triton 500 Intel Core i7-8750H 2.2GHz
GeForce RTX 2080 Max-Q
min:
43 fps
84 91 102 103 110 118 ~ 98 fps
NVIDIA GeForce RTX 3090 Ti:
265 265 ~ 265 fps
GeForce RTX 2080 Max-Q:
78 [X] Acer Triton 500 Intel Core i7-8750H 2.2GHz
GeForce RTX 2080 Max-Q
min:
42 fps
82 89 97 99 105 111 ~ 94 fps
NVIDIA GeForce RTX 3090 Ti:
257 257 ~ 257 fps
GeForce RTX 2080 Max-Q:
71 [X] Acer Triton 500 Intel Core i7-8750H 2.2GHz
GeForce RTX 2080 Max-Q
min:
39 fps
75 78 84 87 94 99 105 ~ 87 fps
NVIDIA GeForce RTX 3090 Ti:
244 244 ~ 244 fps
GeForce RTX 2080 Max-Q:
57 [X] Acer Triton 500 Intel Core i7-8750H 2.2GHz
GeForce RTX 2080 Max-Q
min:
37 fps
58 61 ~ 59 fps
NVIDIA GeForce RTX 3090 Ti:
184 184 ~ 184 fps
GeForce RTX 2080 Max-Q:
33 33 [X] Acer Triton 500 Intel Core i7-8750H 2.2GHz
GeForce RTX 2080 Max-Q
min:
17 fps
37 40 ~ 36 fps
NVIDIA GeForce RTX 3090 Ti:
106 106 ~ 106 fps
100%
GeForce RTX 3050 6GB Laptop GPU:
210 256 ~ 233 fps
100%
GeForce RTX 3050 6GB Laptop GPU:
96.5 112.8 ~ 105 fps
100%
GeForce RTX 3050 6GB Laptop GPU:
80.9 91.9 ~ 86 fps
100%
GeForce RTX 3050 6GB Laptop GPU:
70.7 80.5 ~ 76 fps
100%
GeForce RTX 3050 6GB Laptop GPU:
57.1 fps
GeForce RTX 2080 Max-Q:
169 178 [X] Acer Triton 500 Intel Core i7-8750H 2.2GHz
GeForce RTX 2080 Max-Q
min:
112 fps
~ 174 fps
GeForce RTX 2080 Max-Q:
130 136 [X] Acer Triton 500 Intel Core i7-8750H 2.2GHz
GeForce RTX 2080 Max-Q
min:
106 fps
~ 133 fps
GeForce RTX 2080 Max-Q:
102 [X] Acer Triton 500 Intel Core i7-8750H 2.2GHz
GeForce RTX 2080 Max-Q
min:
82 fps
102 ~ 102 fps
GeForce RTX 2080 Max-Q:
86 [X] Acer Triton 500 Intel Core i7-8750H 2.2GHz
GeForce RTX 2080 Max-Q
min:
60 fps
87 ~ 87 fps
GeForce RTX 2080 Max-Q:
51 [X] Acer Triton 500 Intel Core i7-8750H 2.2GHz
GeForce RTX 2080 Max-Q
min:
47 fps
56 ~ 54 fps
GeForce RTX 2080 Max-Q:
117 [X] Acer Triton 500 Intel Core i7-8750H 2.2GHz
GeForce RTX 2080 Max-Q
min:
94 fps
123 ~ 120 fps
GeForce RTX 2080 Max-Q:
105 [X] Acer Triton 500 Intel Core i7-8750H 2.2GHz
GeForce RTX 2080 Max-Q
min:
77 fps
111 ~ 108 fps
GeForce RTX 2080 Max-Q:
84.8 [X] Acer Triton 500 Intel Core i7-8750H 2.2GHz
GeForce RTX 2080 Max-Q
min:
68 fps
90.9 ~ 88 fps
GeForce RTX 2080 Max-Q:
52.5 [X] Acer Triton 500 Intel Core i7-8750H 2.2GHz
GeForce RTX 2080 Max-Q
min:
45 fps
58.4 ~ 55 fps
GeForce RTX 2080 Max-Q:
27.1 [X] Acer Triton 500 Intel Core i7-8750H 2.2GHz
GeForce RTX 2080 Max-Q
min:
23 fps
29.7 ~ 28 fps
GeForce RTX 2080 Max-Q:
60 [X] Acer Triton 500 Intel Core i7-8750H 2.2GHz
GeForce RTX 2080 Max-Q
min:
59 fps
60 ~ 60 fps
GeForce RTX 2080 Max-Q:
60 [X] Acer Triton 500 Intel Core i7-8750H 2.2GHz
GeForce RTX 2080 Max-Q
min:
59 fps
60 ~ 60 fps
GeForce RTX 2080 Max-Q:
60 [X] Acer Triton 500 Intel Core i7-8750H 2.2GHz
GeForce RTX 2080 Max-Q
min:
58 fps
60 ~ 60 fps
GeForce RTX 2080 Max-Q:
60 [X] Acer Triton 500 Intel Core i7-8750H 2.2GHz
GeForce RTX 2080 Max-Q
min:
58 fps
60 ~ 60 fps
GeForce RTX 2080 Max-Q:
37.4 [X] Acer Triton 500 Intel Core i7-8750H 2.2GHz
GeForce RTX 2080 Max-Q
min:
34 fps
39.9 ~ 39 fps
100%
GeForce RTX 3050 6GB Laptop GPU:
132 fps
91%
GeForce RTX 2080 Max-Q:
114 122 123 ~ 120 fps
100%
GeForce RTX 3050 6GB Laptop GPU:
76 89 ~ 83 fps
125%
GeForce RTX 2080 Max-Q:
94 101 [X] Asus GX701GX (Optimus-Mode) Intel Core i7-8750H 2.2GHz
GeForce RTX 2080 Max-Q
min:
83 fps
103 107 [X] Acer Triton 500 Intel Core i7-8750H 2.2GHz
GeForce RTX 2080 Max-Q
min:
87 fps
109 109 ~ 104 fps
100%
GeForce RTX 3050 6GB Laptop GPU:
70 82 ~ 76 fps
122%
GeForce RTX 2080 Max-Q:
68 [X] Gigabyte Aero 15-Y9 Single-Channel
Intel Core i9-8950HK 2.9GHz
GeForce RTX 2080 Max-Q
88 97 [X] Asus GX701GX (Optimus-Mode) Intel Core i7-8750H 2.2GHz
GeForce RTX 2080 Max-Q
min:
75 fps
97 99 [X] Acer Triton 500 Intel Core i7-8750H 2.2GHz
GeForce RTX 2080 Max-Q
min:
82 fps
99 106 ~ 93 fps
100%
GeForce RTX 3050 6GB Laptop GPU:
65 76 ~ 71 fps
125%
GeForce RTX 2080 Max-Q:
66 [X] Gigabyte Aero 15-Y9 Single-Channel
Intel Core i9-8950HK 2.9GHz
GeForce RTX 2080 Max-Q
84 92 [X] Asus GX701GX (Optimus-Mode) Intel Core i7-8750H 2.2GHz
GeForce RTX 2080 Max-Q
min:
74 fps
93 [X] Acer Triton 500 Intel Core i7-8750H 2.2GHz
GeForce RTX 2080 Max-Q
min:
73 fps
93 95 100 ~ 89 fps
100%
GeForce RTX 3050 6GB Laptop GPU:
52 fps
146%
GeForce RTX 2080 Max-Q:
72 [X] Acer Triton 500 Intel Core i7-8750H 2.2GHz
GeForce RTX 2080 Max-Q
min:
58 fps
79 ~ 76 fps
GeForce RTX 2080 Max-Q:
34 40 [X] Acer Triton 500 Intel Core i7-8750H 2.2GHz
GeForce RTX 2080 Max-Q
min:
35 fps
44 ~ 39 fps
77%
GeForce RTX 2080 Max-Q:
82.9 [X] Gigabyte Aero 15-Y9 Single-Channel
Intel Core i9-8950HK 2.9GHz
GeForce RTX 2080 Max-Q
91 101.9 108 ~ 96 fps
136%
NVIDIA GeForce RTX 3090 Ti:
169.1 169.1 ~ 169 fps
100%
GeForce RTX 3050 6GB Laptop GPU:
76 116.2 117 ~ 103 fps
82%
GeForce RTX 2080 Max-Q:
68.9 [X] Gigabyte Aero 15-Y9 Single-Channel
Intel Core i9-8950HK 2.9GHz
GeForce RTX 2080 Max-Q
80.5 89.2 97.4 ~ 84 fps
153%
NVIDIA GeForce RTX 3090 Ti:
158.1 158.1 ~ 158 fps
100%
GeForce RTX 3050 6GB Laptop GPU:
61.6 97.1 97.3 ~ 85 fps
82%
GeForce RTX 2080 Max-Q:
55.8 [X] Gigabyte Aero 15-Y9 Single-Channel
Intel Core i9-8950HK 2.9GHz
GeForce RTX 2080 Max-Q
67.2 74.8 81.6 ~ 70 fps
160%
NVIDIA GeForce RTX 3090 Ti:
135.9 135.9 ~ 136 fps
GeForce RTX 2080 Max-Q:
36.5 [X] Gigabyte Aero 15-Y9 Single-Channel
Intel Core i9-8950HK 2.9GHz
GeForce RTX 2080 Max-Q
51.8 ~ 44 fps
GeForce RTX 2080 Max-Q:
115 118 [X] Acer Triton 500 Intel Core i7-8750H 2.2GHz
GeForce RTX 2080 Max-Q
min:
96 fps
~ 117 fps
GeForce RTX 2080 Max-Q:
89.5 90.5 [X] Acer Triton 500 Intel Core i7-8750H 2.2GHz
GeForce RTX 2080 Max-Q
min:
66 fps
~ 90 fps
GeForce RTX 2080 Max-Q:
64.9 [X] Acer Triton 500 Intel Core i7-8750H 2.2GHz
GeForce RTX 2080 Max-Q
min:
42 fps
68.4 ~ 67 fps
GeForce RTX 2080 Max-Q:
50.2 52.2 [X] Acer Triton 500 Intel Core i7-8750H 2.2GHz
GeForce RTX 2080 Max-Q
min:
41 fps
~ 51 fps
GeForce RTX 2080 Max-Q:
26.7 [X] Acer Triton 500 Intel Core i7-8750H 2.2GHz
GeForce RTX 2080 Max-Q
min:
23 fps
27.5 ~ 27 fps
180%
NVIDIA GeForce RTX 3090 Ti:
222 222 ~ 222 fps
100%
GeForce RTX 3050 6GB Laptop GPU:
59.9 70.3 70.9 ~ 67 fps
154%
GeForce RTX 2080 Max-Q:
100.1 100.7 103 [X] Acer Triton 500 Intel Core i7-8750H 2.2GHz
GeForce RTX 2080 Max-Q
min:
52 fps
103 [X] Asus GX701GX (Optimus-Mode) Intel Core i7-8750H 2.2GHz
GeForce RTX 2080 Max-Q
min:
50 fps
106 ~ 103 fps
337%
NVIDIA GeForce RTX 3090 Ti:
226 226 ~ 226 fps
100%
GeForce RTX 3050 6GB Laptop GPU:
44.2 51.2 52 ~ 49 fps
159%
GeForce RTX 2080 Max-Q:
74 75.9 77.3 [X] Acer Triton 500 Intel Core i7-8750H 2.2GHz
GeForce RTX 2080 Max-Q
min:
42 fps
79.7 [X] Asus GX701GX (Optimus-Mode) Intel Core i7-8750H 2.2GHz
GeForce RTX 2080 Max-Q
min:
41 fps
81.4 ~ 78 fps
380%
NVIDIA GeForce RTX 3090 Ti:
186.1 186.1 ~ 186 fps
100%
GeForce RTX 3050 6GB Laptop GPU:
32 37.4 ~ 35 fps
434%
NVIDIA GeForce RTX 3090 Ti:
151.6 151.6 ~ 152 fps
GeForce RTX 2080 Max-Q:
32.7 [X] Acer Triton 500 Intel Core i7-8750H 2.2GHz
GeForce RTX 2080 Max-Q
min:
20 fps
35.9 ~ 34 fps
NVIDIA GeForce RTX 3090 Ti:
96.3 96.3 ~ 96 fps
GeForce RTX 2080 Max-Q:
139 [X] Asus GX701GX (Optimus-Mode) Intel Core i7-8750H 2.2GHz
GeForce RTX 2080 Max-Q
min:
103 fps
143 147 [X] Acer Triton 500 Intel Core i7-8750H 2.2GHz
GeForce RTX 2080 Max-Q
min:
101 fps
~ 143 fps
GeForce RTX 2080 Max-Q:
128 [X] Asus GX701GX (Optimus-Mode) Intel Core i7-8750H 2.2GHz
GeForce RTX 2080 Max-Q
min:
99 fps
138 140 [X] Acer Triton 500 Intel Core i7-8750H 2.2GHz
GeForce RTX 2080 Max-Q
min:
97 fps
~ 135 fps
GeForce RTX 2080 Max-Q:
116 [X] Asus GX701GX (Optimus-Mode) Intel Core i7-8750H 2.2GHz
GeForce RTX 2080 Max-Q
min:
98 fps
121 [X] Acer Triton 500 Intel Core i7-8750H 2.2GHz
GeForce RTX 2080 Max-Q
min:
90 fps
136 ~ 124 fps
GeForce RTX 2080 Max-Q:
97.7 [X] Acer Triton 500 Intel Core i7-8750H 2.2GHz
GeForce RTX 2080 Max-Q
min:
64 fps
105 ~ 101 fps
GeForce RTX 2080 Max-Q:
46.7 [X] Acer Triton 500 Intel Core i7-8750H 2.2GHz
GeForce RTX 2080 Max-Q
min:
42 fps
50.4 ~ 49 fps
GeForce RTX 2080 Max-Q:
143 [X] Asus GX701GX (Optimus-Mode) Intel Core i7-8750H 2.2GHz
GeForce RTX 2080 Max-Q
min:
121 fps
145 160 [X] Acer Triton 500 Intel Core i7-8750H 2.2GHz
GeForce RTX 2080 Max-Q
min:
141 fps
~ 149 fps
GeForce RTX 2080 Max-Q:
129 [X] Asus GX701GX (Optimus-Mode) Intel Core i7-8750H 2.2GHz
GeForce RTX 2080 Max-Q
min:
108 fps
131 140 [X] Acer Triton 500 Intel Core i7-8750H 2.2GHz
GeForce RTX 2080 Max-Q
min:
112 fps
~ 133 fps
GeForce RTX 2080 Max-Q:
110 [X] Acer Triton 500 Intel Core i7-8750H 2.2GHz
GeForce RTX 2080 Max-Q
min:
103 fps
111 [X] Asus GX701GX (Optimus-Mode) Intel Core i7-8750H 2.2GHz
GeForce RTX 2080 Max-Q
min:
98 fps
117 ~ 113 fps
GeForce RTX 2080 Max-Q:
76.5 [X] Acer Triton 500 Intel Core i7-8750H 2.2GHz
GeForce RTX 2080 Max-Q
min:
70 fps
80.9 ~ 79 fps
GeForce RTX 2080 Max-Q:
39.3 [X] Acer Triton 500 Intel Core i7-8750H 2.2GHz
GeForce RTX 2080 Max-Q
min:
36 fps
42.7 ~ 41 fps
GeForce RTX 2080 Max-Q:
111 [X] Acer Triton 500 Intel Core i7-8750H 2.2GHz
GeForce RTX 2080 Max-Q
min:
86 fps
118 [X] Asus GX701GX (Optimus-Mode) Intel Core i7-8750H 2.2GHz
GeForce RTX 2080 Max-Q
min:
89 fps
127 ~ 119 fps
GeForce RTX 2080 Max-Q:
108 [X] Acer Triton 500 Intel Core i7-8750H 2.2GHz
GeForce RTX 2080 Max-Q
min:
84 fps
112 [X] Asus GX701GX (Optimus-Mode) Intel Core i7-8750H 2.2GHz
GeForce RTX 2080 Max-Q
min:
88 fps
120 ~ 113 fps
GeForce RTX 2080 Max-Q:
104 [X] Acer Triton 500 Intel Core i7-8750H 2.2GHz
GeForce RTX 2080 Max-Q
min:
79 fps
111 [X] Asus GX701GX (Optimus-Mode) Intel Core i7-8750H 2.2GHz
GeForce RTX 2080 Max-Q
min:
87 fps
115 ~ 110 fps
GeForce RTX 2080 Max-Q:
88.2 [X] Acer Triton 500 Intel Core i7-8750H 2.2GHz
GeForce RTX 2080 Max-Q
min:
66 fps
95.6 ~ 92 fps
GeForce RTX 2080 Max-Q:
47.2 [X] Acer Triton 500 Intel Core i7-8750H 2.2GHz
GeForce RTX 2080 Max-Q
min:
34 fps
54.3 ~ 51 fps
GeForce RTX 2080 Max-Q:
82 fps
GeForce RTX 2080 Max-Q:
65 80 ~ 73 fps
GeForce RTX 2080 Max-Q:
62 69 ~ 66 fps
GeForce RTX 2080 Max-Q:
61 fps
GeForce RTX 2080 Max-Q:
39 fps
GeForce RTX 2080 Max-Q:
117 120 [X] Acer Triton 500 Intel Core i7-8750H 2.2GHz
GeForce RTX 2080 Max-Q
min:
117 fps
~ 119 fps
GeForce RTX 2080 Max-Q:
112 [X] Acer Triton 500 Intel Core i7-8750H 2.2GHz
GeForce RTX 2080 Max-Q
min:
95 fps
115 ~ 114 fps
GeForce RTX 2080 Max-Q:
92.7 [X] Acer Triton 500 Intel Core i7-8750H 2.2GHz
GeForce RTX 2080 Max-Q
min:
86 fps
99 ~ 96 fps
GeForce RTX 2080 Max-Q:
63.2 [X] Acer Triton 500 Intel Core i7-8750H 2.2GHz
GeForce RTX 2080 Max-Q
min:
59 fps
68.1 ~ 66 fps
GeForce RTX 2080 Max-Q:
33 [X] Acer Triton 500 Intel Core i7-8750H 2.2GHz
GeForce RTX 2080 Max-Q
min:
31 fps
35.7 ~ 34 fps
GeForce RTX 2080 Max-Q:
150 [X] Acer Triton 500 Intel Core i7-8750H 2.2GHz
GeForce RTX 2080 Max-Q
min:
33 fps
157 ~ 154 fps
GeForce RTX 2080 Max-Q:
119 [X] Acer Triton 500 Intel Core i7-8750H 2.2GHz
GeForce RTX 2080 Max-Q
min:
32 fps
125 ~ 122 fps
GeForce RTX 2080 Max-Q:
93 [X] Acer Triton 500 Intel Core i7-8750H 2.2GHz
GeForce RTX 2080 Max-Q
min:
30 fps
99 ~ 96 fps
GeForce RTX 2080 Max-Q:
40 [X] Acer Triton 500 Intel Core i7-8750H 2.2GHz
GeForce RTX 2080 Max-Q
min:
22 fps
44 ~ 42 fps
GeForce RTX 2080 Max-Q:
160.9 fps
GeForce RTX 2080 Max-Q:
87.9 fps
GeForce RTX 2080 Max-Q:
63.5 fps
GeForce RTX 2080 Max-Q:
43.9 fps
GeForce RTX 2080 Max-Q:
190 [X] Acer Triton 500 Intel Core i7-8750H 2.2GHz
GeForce RTX 2080 Max-Q
min:
133 fps
207 ~ 199 fps
GeForce RTX 2080 Max-Q:
174 [X] Acer Triton 500 Intel Core i7-8750H 2.2GHz
GeForce RTX 2080 Max-Q
min:
130 fps
175 ~ 175 fps
GeForce RTX 2080 Max-Q:
133 [X] Acer Triton 500 Intel Core i7-8750H 2.2GHz
GeForce RTX 2080 Max-Q
min:
106 fps
139 ~ 136 fps
GeForce RTX 2080 Max-Q:
48.4 [X] Acer Triton 500 Intel Core i7-8750H 2.2GHz
GeForce RTX 2080 Max-Q
min:
37 fps
51.5 ~ 50 fps
GeForce RTX 2080 Max-Q:
212 [X] Acer Triton 500 Intel Core i7-8750H 2.2GHz
GeForce RTX 2080 Max-Q
min:
178 fps
225 ~ 219 fps
GeForce RTX 2080 Max-Q:
150 164 [X] Acer Triton 500 Intel Core i7-8750H 2.2GHz
GeForce RTX 2080 Max-Q
min:
109 fps
~ 157 fps
GeForce RTX 2080 Max-Q:
102 105 [X] Acer Triton 500 Intel Core i7-8750H 2.2GHz
GeForce RTX 2080 Max-Q
min:
82 fps
~ 104 fps
GeForce RTX 2080 Max-Q:
248.7 249 ~ 249 fps
GeForce RTX 2080 Max-Q:
239.3 247.7 248 249 [X] Acer Triton 500 Intel Core i7-8750H 2.2GHz
GeForce RTX 2080 Max-Q
min:
234 fps
~ 246 fps
GeForce RTX 2080 Max-Q:
218 218.5 248 [X] Acer Triton 500 Intel Core i7-8750H 2.2GHz
GeForce RTX 2080 Max-Q
min:
230 fps
248.4 ~ 233 fps
GeForce RTX 2080 Max-Q:
112 123 [X] Acer Triton 500 Intel Core i7-8750H 2.2GHz
GeForce RTX 2080 Max-Q
min:
102 fps
~ 118 fps
GeForce RTX 2080 Max-Q:
142 [X] Acer Triton 500 Intel Core i7-8750H 2.2GHz
GeForce RTX 2080 Max-Q
min:
125 fps
142 ~ 142 fps
GeForce RTX 2080 Max-Q:
140 [X] Acer Triton 500 Intel Core i7-8750H 2.2GHz
GeForce RTX 2080 Max-Q
min:
123 fps
141 ~ 141 fps
GeForce RTX 2080 Max-Q:
139 [X] Acer Triton 500 Intel Core i7-8750H 2.2GHz
GeForce RTX 2080 Max-Q
min:
122 fps
139 ~ 139 fps
GeForce RTX 2080 Max-Q:
63.4 [X] Acer Triton 500 Intel Core i7-8750H 2.2GHz
GeForce RTX 2080 Max-Q
min:
55 fps
69.5 ~ 66 fps
GeForce RTX 2080 Max-Q:
89.8 [X] Acer Triton 500 Intel Core i7-8750H 2.2GHz
GeForce RTX 2080 Max-Q
min:
75 fps
94.4 [X] Asus GX701GX (Optimus-Mode) Intel Core i7-8750H 2.2GHz
GeForce RTX 2080 Max-Q
min:
79 fps
105 ~ 96 fps
GeForce RTX 2080 Max-Q:
87 [X] Acer Triton 500 Intel Core i7-8750H 2.2GHz
GeForce RTX 2080 Max-Q
min:
73 fps
89.8 [X] Asus GX701GX (Optimus-Mode) Intel Core i7-8750H 2.2GHz
GeForce RTX 2080 Max-Q
min:
78 fps
98.2 ~ 92 fps
GeForce RTX 2080 Max-Q:
57.2 [X] Asus GX701GX (Optimus-Mode) Intel Core i7-8750H 2.2GHz
GeForce RTX 2080 Max-Q
min:
46 fps
57.7 [X] Acer Triton 500 Intel Core i7-8750H 2.2GHz
GeForce RTX 2080 Max-Q
min:
46 fps
58 ~ 58 fps
GeForce RTX 2080 Max-Q:
39.1 [X] Acer Triton 500 Intel Core i7-8750H 2.2GHz
GeForce RTX 2080 Max-Q
min:
29 fps
42 ~ 41 fps
GeForce RTX 2080 Max-Q:
267.2 fps
GeForce RTX 2080 Max-Q:
163 [X] Asus GX701GX (Optimus-Mode) Intel Core i7-8750H 2.2GHz
GeForce RTX 2080 Max-Q
min:
129 fps
165.2 166 [X] Acer Triton 500 Intel Core i7-8750H 2.2GHz
GeForce RTX 2080 Max-Q
min:
115 fps
171 ~ 166 fps
GeForce RTX 2080 Max-Q:
156 [X] Acer Triton 500 Intel Core i7-8750H 2.2GHz
GeForce RTX 2080 Max-Q
min:
111 fps
156.5 158 [X] Asus GX701GX (Optimus-Mode) Intel Core i7-8750H 2.2GHz
GeForce RTX 2080 Max-Q
min:
127 fps
164 ~ 159 fps
GeForce RTX 2080 Max-Q:
122 [X] Acer Triton 500 Intel Core i7-8750H 2.2GHz
GeForce RTX 2080 Max-Q
min:
88 fps
123.4 130 [X] Asus GX701GX (Optimus-Mode) Intel Core i7-8750H 2.2GHz
GeForce RTX 2080 Max-Q
min:
93 fps
131 ~ 127 fps
GeForce RTX 2080 Max-Q:
52.9 [X] Acer Triton 500 Intel Core i7-8750H 2.2GHz
GeForce RTX 2080 Max-Q
min:
39 fps
57.2 ~ 55 fps
GeForce RTX 2080 Max-Q:
352 [X] Acer Triton 500 Intel Core i7-8750H 2.2GHz
GeForce RTX 2080 Max-Q
min:
282 fps
360 ~ 356 fps
GeForce RTX 2080 Max-Q:
194 [X] Acer Triton 500 Intel Core i7-8750H 2.2GHz
GeForce RTX 2080 Max-Q
min:
164 fps
220 ~ 207 fps
GeForce RTX 2080 Max-Q:
163 [X] Acer Triton 500 Intel Core i7-8750H 2.2GHz
GeForce RTX 2080 Max-Q
min:
142 fps
182 ~ 173 fps
GeForce RTX 2080 Max-Q:
58.6 [X] Acer Triton 500 Intel Core i7-8750H 2.2GHz
GeForce RTX 2080 Max-Q
min:
48 fps
65.1 ~ 62 fps
GeForce RTX 2080 Max-Q:
98.8 [X] Acer Triton 500 Intel Core i7-8750H 2.2GHz
GeForce RTX 2080 Max-Q
min:
85 fps
109 ~ 104 fps
GeForce RTX 2080 Max-Q:
92.8 [X] Acer Triton 500 Intel Core i7-8750H 2.2GHz
GeForce RTX 2080 Max-Q
min:
80 fps
94 ~ 93 fps
GeForce RTX 2080 Max-Q:
54.4 [X] Acer Triton 500 Intel Core i7-8750H 2.2GHz
GeForce RTX 2080 Max-Q
min:
45 fps
61.1 ~ 58 fps
GeForce RTX 2080 Max-Q:
134 146 ~ 140 fps
GeForce RTX 2080 Max-Q:
129 134 ~ 132 fps
GeForce RTX 2080 Max-Q:
65 fps
GeForce RTX 2080 Max-Q:
103 [X] Acer Triton 500 Intel Core i7-8750H 2.2GHz
GeForce RTX 2080 Max-Q
min:
76 fps
107 ~ 105 fps
GeForce RTX 2080 Max-Q:
59.7 [X] Acer Triton 500 Intel Core i7-8750H 2.2GHz
GeForce RTX 2080 Max-Q
min:
46 fps
63.5 ~ 62 fps
GeForce RTX 2080 Max-Q:
37.4 [X] Acer Triton 500 Intel Core i7-8750H 2.2GHz
GeForce RTX 2080 Max-Q
min:
31 fps
40.6 ~ 39 fps
GeForce RTX 2080 Max-Q:
120 [X] Asus GX701GX (Optimus-Mode) Intel Core i7-8750H 2.2GHz
GeForce RTX 2080 Max-Q
min:
87 fps
121 [X] Acer Triton 500 Intel Core i7-8750H 2.2GHz
GeForce RTX 2080 Max-Q
min:
106 fps
135 ~ 125 fps
GeForce RTX 2080 Max-Q:
110 [X] Acer Triton 500 Intel Core i7-8750H 2.2GHz
GeForce RTX 2080 Max-Q
min:
98 fps
113 [X] Asus GX701GX (Optimus-Mode) Intel Core i7-8750H 2.2GHz
GeForce RTX 2080 Max-Q
min:
86 fps
123 ~ 115 fps
GeForce RTX 2080 Max-Q:
45.6 [X] Acer Triton 500 Intel Core i7-8750H 2.2GHz
GeForce RTX 2080 Max-Q
min:
42 fps
50.2 ~ 48 fps
GeForce RTX 2080 Max-Q:
238 [X] Asus GX701GX (Optimus-Mode) Intel Core i7-8750H 2.2GHz
GeForce RTX 2080 Max-Q
min:
206 fps
289 [X] Acer Triton 500 Intel Core i7-8750H 2.2GHz
GeForce RTX 2080 Max-Q
min:
245 fps
292 ~ 273 fps
GeForce RTX 2080 Max-Q:
178 [X] Acer Triton 500 Intel Core i7-8750H 2.2GHz
GeForce RTX 2080 Max-Q
min:
148 fps
179 [X] Asus GX701GX (Optimus-Mode) Intel Core i7-8750H 2.2GHz
GeForce RTX 2080 Max-Q
min:
157 fps
196 ~ 184 fps
GeForce RTX 2080 Max-Q:
102 [X] Acer Triton 500 Intel Core i7-8750H 2.2GHz
GeForce RTX 2080 Max-Q
min:
85 fps
111 ~ 107 fps
GeForce RTX 2080 Max-Q:
131 [X] Acer Triton 500 Intel Core i7-8750H 2.2GHz
GeForce RTX 2080 Max-Q
min:
113 fps
134 ~ 133 fps
GeForce RTX 2080 Max-Q:
127 [X] Acer Triton 500 Intel Core i7-8750H 2.2GHz
GeForce RTX 2080 Max-Q
min:
106 fps
129 ~ 128 fps
GeForce RTX 2080 Max-Q:
71.1 [X] Acer Triton 500 Intel Core i7-8750H 2.2GHz
GeForce RTX 2080 Max-Q
min:
62 fps
79.3 ~ 75 fps
GeForce RTX 2080 Max-Q:
82.5 fps
GeForce RTX 2080 Max-Q:
80.7 fps
GeForce RTX 2080 Max-Q:
81.3 fps
GeForce RTX 2080 Max-Q:
113 [X] Asus GX701GX (Optimus-Mode) Intel Core i7-8750H 2.2GHz
GeForce RTX 2080 Max-Q
min:
81 fps
117 [X] Acer Triton 500 Intel Core i7-8750H 2.2GHz
GeForce RTX 2080 Max-Q
min:
63 fps
127 ~ 119 fps
GeForce RTX 2080 Max-Q:
93 [X] Acer Triton 500 Intel Core i7-8750H 2.2GHz
GeForce RTX 2080 Max-Q
min:
61 fps
93.9 [X] Asus GX701GX (Optimus-Mode) Intel Core i7-8750H 2.2GHz
GeForce RTX 2080 Max-Q
min:
67 fps
100 ~ 96 fps
GeForce RTX 2080 Max-Q:
45.6 [X] Acer Triton 500 Intel Core i7-8750H 2.2GHz
GeForce RTX 2080 Max-Q
min:
20 fps
51.7 ~ 49 fps
GeForce RTX 2080 Max-Q:
52.4 fps
GeForce RTX 2080 Max-Q:
152 [X] Asus GX701GX (Optimus-Mode) Intel Core i7-8750H 2.2GHz
GeForce RTX 2080 Max-Q
min:
85 fps
210 [X] Acer Triton 500 Intel Core i7-8750H 2.2GHz
GeForce RTX 2080 Max-Q
min:
46 fps
230 ~ 197 fps
GeForce RTX 2080 Max-Q:
148 [X] Asus GX701GX (Optimus-Mode) Intel Core i7-8750H 2.2GHz
GeForce RTX 2080 Max-Q
min:
77 fps
201 [X] Acer Triton 500 Intel Core i7-8750H 2.2GHz
GeForce RTX 2080 Max-Q
min:
41 fps
217 ~ 189 fps
GeForce RTX 2080 Max-Q:
90.8 [X] Acer Triton 500 Intel Core i7-8750H 2.2GHz
GeForce RTX 2080 Max-Q
min:
36 fps
98.2 ~ 95 fps
102%
GeForce RTX 2080 Max-Q:
144.9 fps
182%
NVIDIA GeForce RTX 3090 Ti:
257.7 257.7 ~ 258 fps
104%
GeForce RTX 2080 Max-Q:
132.2 fps
182%
NVIDIA GeForce RTX 3090 Ti:
231.2 231.2 ~ 231 fps
111%
GeForce RTX 2080 Max-Q:
126.4 fps
190%
NVIDIA GeForce RTX 3090 Ti:
217.1 217.1 ~ 217 fps
100%
GeForce RTX 3050 6GB Laptop GPU:
98 99.5 116.9 ~ 105 fps
114%
GeForce RTX 2080 Max-Q:
119.6 fps
186%
NVIDIA GeForce RTX 3090 Ti:
194.1 195.8 ~ 195 fps
GeForce RTX 2080 Max-Q:
172 fps
GeForce RTX 2080 Max-Q:
161 fps
GeForce RTX 2080 Max-Q:
134 fps
GeForce RTX 2080 Max-Q:
92 fps
100%
GeForce RTX 3050 6GB Laptop GPU:
187 236 244 ~ 222 fps
100%
GeForce RTX 3050 6GB Laptop GPU:
118 159.1 ~ 139 fps
100%
GeForce RTX 3050 6GB Laptop GPU:
71 91.4 96.5 ~ 86 fps
458%
NVIDIA GeForce RTX 3090 Ti:
394 394 [X] AMD Ryzen 7 5800X3D AMD Ryzen 7 5800X3D 3.4GHz
NVIDIA GeForce RTX 3090 Ti
min:
335 fps, P1:
342.98 fps, max:
440 fps
~ 394 fps
100%
GeForce RTX 3050 6GB Laptop GPU:
43.7 50.1 52.9 ~ 49 fps
100%
GeForce RTX 3050 6GB Laptop GPU:
37 fps
GeForce RTX 2080 Max-Q:
39.6 50.6 53 53.3 [X] Acer Triton 500 Intel Core i7-8750H 2.2GHz
GeForce RTX 2080 Max-Q
min:
43 fps
57.6 65.5 ~ 53 fps
NVIDIA GeForce RTX 3090 Ti:
172.9 172.9 [X] AMD Ryzen 7 5800X3D AMD Ryzen 7 5800X3D 3.4GHz
NVIDIA GeForce RTX 3090 Ti
min:
152 fps, P1:
152.57 fps, max:
188 fps
~ 173 fps
90%
GeForce RTX 2080 Max-Q:
140 171 ~ 156 fps
100%
GeForce RTX 3050 6GB Laptop GPU:
172 172.6 ~ 172 fps
88%
GeForce RTX 2080 Max-Q:
135.3 166 ~ 151 fps
115%
GeForce RTX 2080 Max-Q:
115.4 144 ~ 130 fps
162%
NVIDIA GeForce RTX 3090 Ti:
179.9 185.6 ~ 183 fps
100%
GeForce RTX 3050 6GB Laptop GPU:
53 62.7 63.8 ~ 60 fps
117%
GeForce RTX 2080 Max-Q:
62.6 77.2 ~ 70 fps
260%
NVIDIA GeForce RTX 3090 Ti:
151.8 160.7 ~ 156 fps
100%
GeForce RTX 3050 6GB Laptop GPU:
36.5 42.7 ~ 40 fps
378%
NVIDIA GeForce RTX 3090 Ti:
146.4 155.3 ~ 151 fps
GeForce RTX 2080 Max-Q:
74 fps
Average Gaming NVIDIA GeForce RTX 3050 6GB Laptop GPU → 100% Average Gaming 30-70 fps → 100%
Average Gaming NVIDIA GeForce RTX 2080 Max-Q → 119% Average Gaming NVIDIA GeForce RTX 3090 Ti → 309%  Deutsch
 English
 Español
 Français
 Italiano
 Nederlands
 Polski
 Português
 Русский
 Türkçe
 Svenska
 Chinese
 Magyar