NVIDIA GeForce MX570 vs NVIDIA GeForce GTX 1660 Ti Max-Q vs NVIDIA GeForce MX550
NVIDIA GeForce MX570 ► remove from comparison
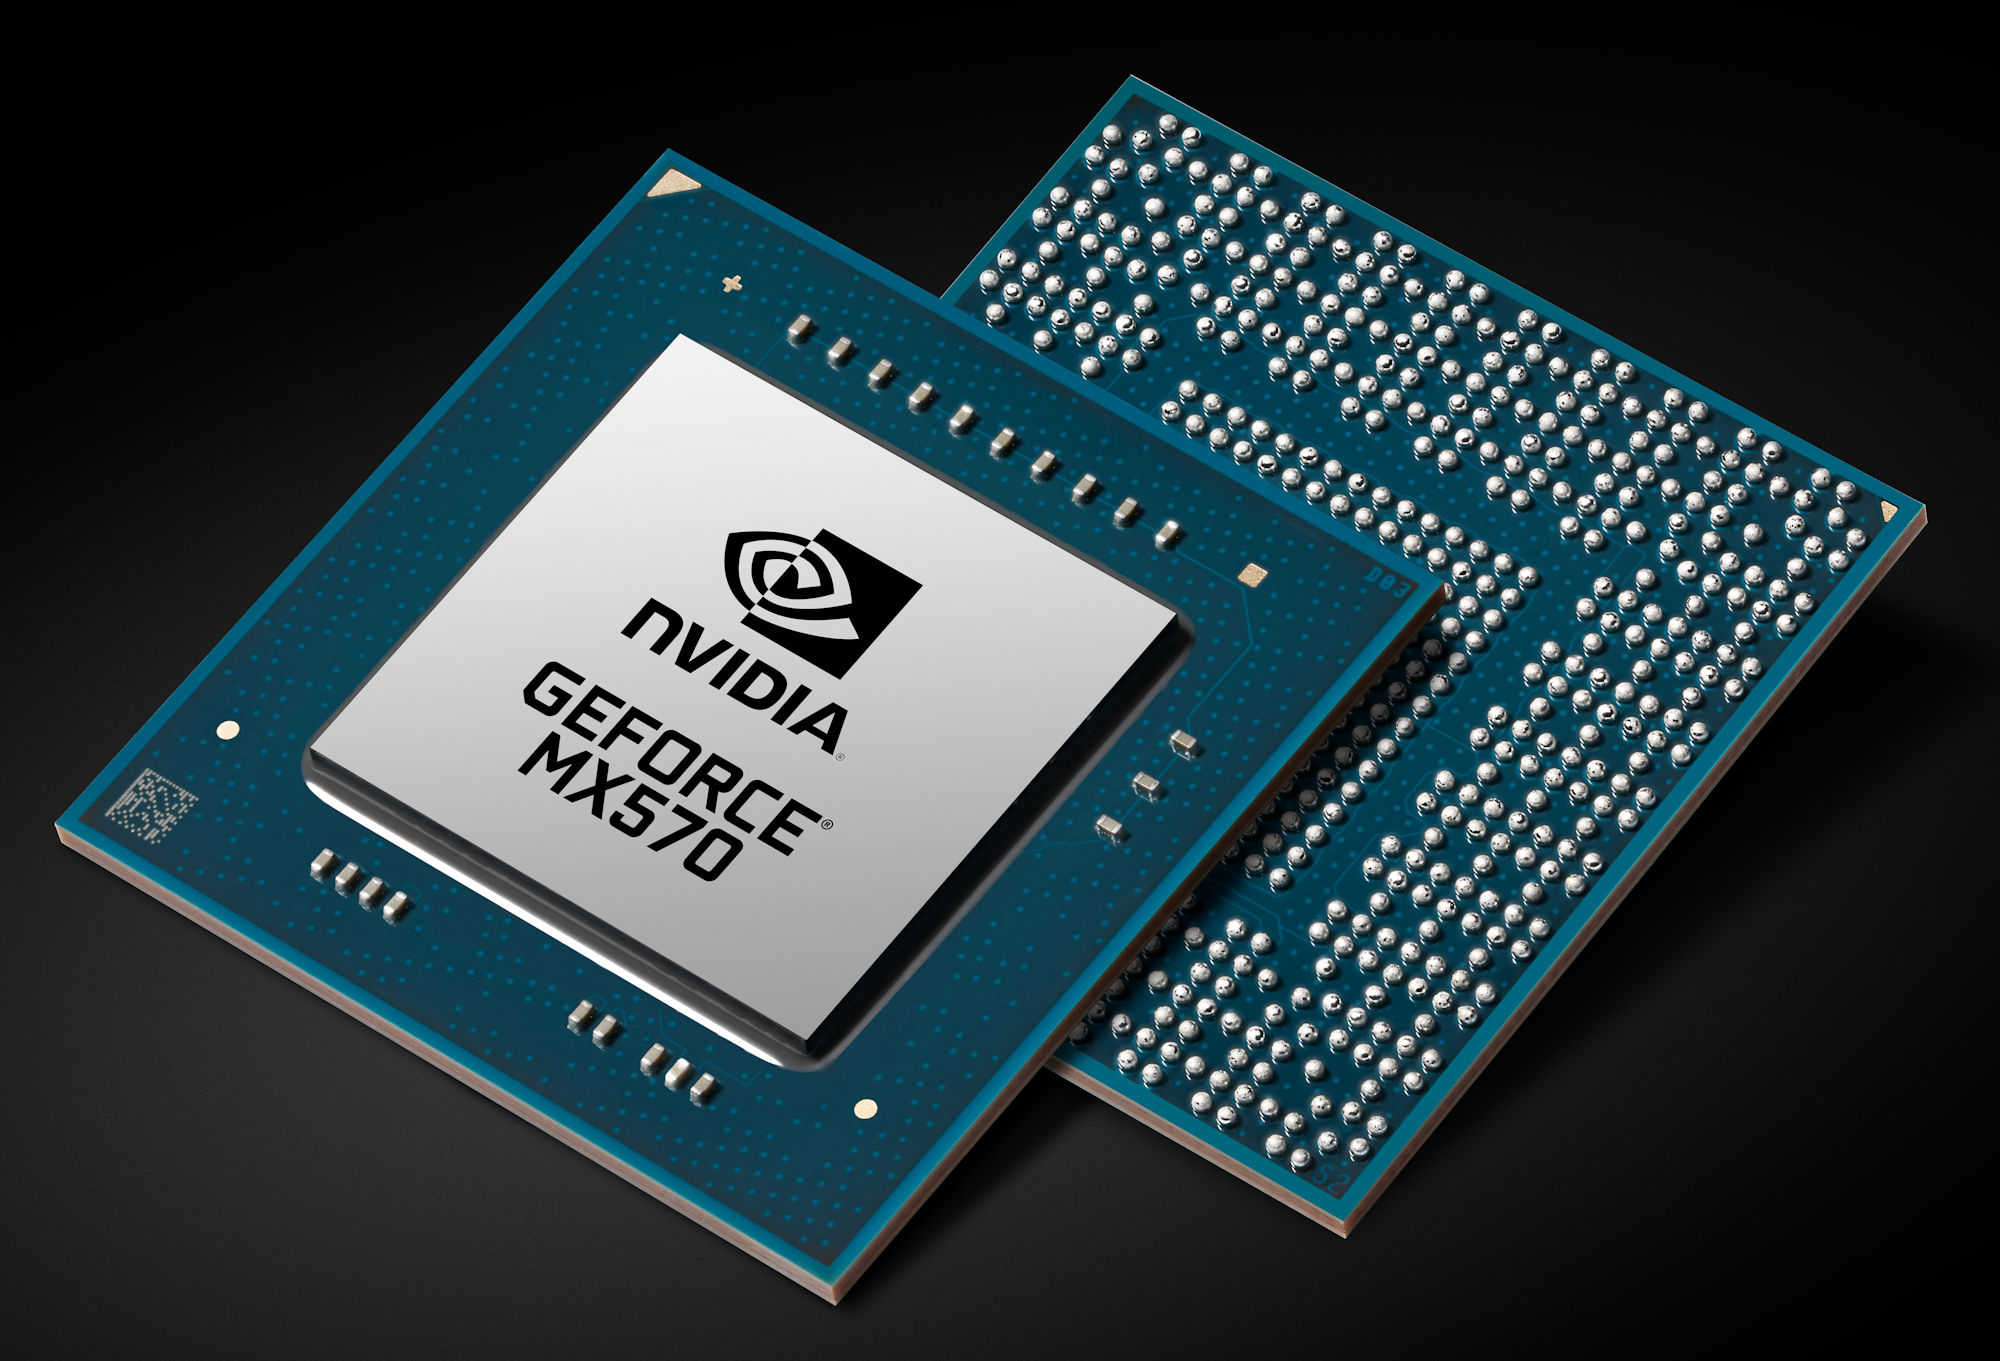
The Nvidia GeForce MX570 (GN20-S5, Device ID 0x25A6) is an entry-level mobile graphics card for laptops. It is based on the Ampere GA107 chip with 2 GB GDDR6. Compared to the similar GeForce RTX 2050 , the MX570 offers 2 GB less VRAM and a lower TDP. Compared to the RTX 3050 , the MX570 and RTX 2050 offer a greatly reduced memory bus of only 64 Bit. In theory the MX570 also offers Raytracing and Tensor cores, but the performance for Raytracing will be too low. DLSS however could help in selected games.
The gaming performance of the mobile GeForce MX570 should be clearly lower than the RTX 3050 thanks to the greatly reduced graphics memory bus. First benchmarks position a fast version slightly above a GeForce GTX 1650 and on the same level of a RTX 2050.
The GA107 chip is manufactured on an 8nm process. The raytracing cores are not usable in the MX570.
NVIDIA GeForce GTX 1660 Ti Max-Q ► remove from comparison
The Nvidia GeForce GTX 1660 Ti with Max-Q Design is a mobile graphics card for laptops that is based on the Turing architecture (TU116 chip). It is designed for thin and light laptops and about 10-15% slower than a regular GTX 1660 Ti for laptops (depending on the cooling capabilities). According to the specifications, the Max-Q variant clocks 22% slower for the base speed and 16% for the boost speed.
Compared to the faster RTX 2000 GPUs (e.g. RTX 2060 ), the 1660Ti integrates no Raytracing or Tensor cores. The performance is similar to the old GTX 1070 (Max-Q) but at a reduced TGP of 60 Watt (versus 80 of the laptop version 115 Watt of the desktop version).
In April 2020 Nvidia refreshed the GTX 1660 Ti with the new codename N18E-G0-A1 with similar specs and pin compatible to the refreshed RTX chips (e.g., RTX 2070 Super Mobile ).
The Turing generation did not only introduce raytracing for the RTX cards, but also optimized the architecture of the cores and caches. According to Nvidia the CUDA cores offer now a concurrent execution of floating point and integer operations for increased performance in compute-heavy workloads of modern games. Furthermore, the caches were reworked (new unified memory architecture with twice the cache compared to Pascal). This leads to 50% more instructions per clock and a 40% more power efficient usage compared to Pascal.
Nvidia specifies a power consumption of 60 Watt TGP (Total Graphics Power) and therefore 20 Watts lower than a normal (Max-P) 1660Ti for laptops . Therefore, the Max-Q variant is well suited for thin and light gaming laptops. The TU116 chip is manufactured in 12nm FFN at TSMC.
NVIDIA GeForce MX550 ► remove from comparison
The Nvidia GeForce MX550 (GN18-S5-A1, TU117-670-A1 Chip) is an entry-level mobile graphics card for laptops. It is based on the old Turing TU117 chip (as the older MX450) and uses a 64 Bit memory bus with GDDR6 graphics memory. First benchmarks show a 17% performance increase compared to the old GeForce MX450 which could indicate more shaders (1024 instead of 896). The similarly named GeForce MX570 is around 30% faster and uses the Ampere GA107 chip.
The gaming performance should be similar to the older GeForce GTX 1050 Ti and therefore demanding games will only run in low settings fluently.
The TU117 chip is manufactured on a 12nm TSMC process and should be rated at 25 Watt TGP (as the old MX450).
NVIDIA GeForce MX570 NVIDIA GeForce GTX 1660 Ti Max-Q NVIDIA GeForce MX550 GeForce MX500 Series GeForce MX570 2048 @ 1.48 GHz 64 Bit @ 12000 MHz GeForce MX550 1024 @ 1.32 GHz 64 Bit @ 12000 MHz
GeForce MX570 2048 @ 1.48 GHz 64 Bit @ 12000 MHz GeForce MX550 1024 @ 1.32 GHz 64 Bit @ 12000 MHz
Codename GN20-S5 N18E-G0 GN18-S5 Architecture Ampere Turing Turing Pipelines 2048 - unified 1536 - unified 1024 - unified Core Speed 1477 (Boost) MHz 1140 - 1335 (Boost) MHz 1320 (Boost) MHz Memory Speed 12000 MHz 12000 MHz 12000 MHz Memory Bus Width 64 Bit 192 Bit 64 Bit Memory Type GDDR6 GDDR6 GDDR6 Max. Amount of Memory 2048 MB 6 GB Shared Memory no no no API DirectX 12_1, OpenGL 4.6 DirectX 12_1, OpenGL 4.6 DirectX 12_1, OpenGL 4.6 Power Consumption 15-45 Watt 60 Watt 15-25 Watt technology 8 nm 12 nm 12 nm Features Vulkan 1.2, OpenGL 4.6, OpenCL 3.0, GPU Boost, Optimus, PCIe 4.0, Game Ready Drivers, Win 10 / 11 Vulkan 1.2, OpenGL 4.6, OpenCL 3.0, GPU Boost, Optimus, PCIe 4.0, Game Ready Drivers, Win 10 / 11 Date of Announcement 17.12.2021 23.04.2019 17.12.2021 Notebook Size medium sized Link to Manufacturer Page www.nvidia.com
Benchmarks Performance Rating - 3DMark 11 + Fire Strike + Time Spy - GeForce GTX 1660 Ti Max-Q
6.1 pt (18%)
...
NVIDIA GeForce GTX 1660 Ti Max-Q
...
max:
3DMark - 3DMark Time Spy Score
3625 Points (10%)
min: 4547 avg: 5197 median: 5072 (15%) max: 6395 Points
min: 2695 avg: 2771 median: 2800 (8%) max: 2818 Points
GPU TDP ? TDP 30 W TDP 35 W 100% 57% 59%
3DMark - 3DMark Time Spy Graphics
min: 3240 avg: 3610 median: 3610 (10%) max: 3980 Points
min: 4867 avg: 5089 median: 5084.5 (13%) max: 5440 Points
min: 2419 avg: 2472 median: 2470 (7%) max: 2526 Points
GPU TDP ? TDP 30 W TDP 35 W 100% 53% 55%
3DMark - 3DMark Ice Storm Unlimited Graphics
min: 220799 avg: 314100 median: 306910 (35%) max: 414592 Points
3DMark - 3DMark Ice Storm Extreme Graphics
min: 76153 avg: 110626 median: 110626 (14%) max: 145099 Points
3DMark - 3DMark Cloud Gate Score
min: 16807 avg: 29350 median: 33027 (35%) max: 39942 Points
29680 Points (32%)
GPU TDP ? TDP 35 W 99% 100%
3DMark - 3DMark Cloud Gate Graphics
min: 38321 avg: 63736 median: 63086 (17%) max: 89505 Points
40364 Points (11%)
GPU TDP ? TDP 35 W 100% 63%
3DMark - 3DMark Fire Strike Standard Score
min: 10103 avg: 11548 median: 11615 (20%) max: 12739 Points
min: 5764 avg: 5869 median: 5869 (10%) max: 5974 Points
GPU TDP ? TDP 30 W TDP 35 W 100% 50% 52%
3DMark - 3DMark Fire Strike Standard Graphics
min: 12903 avg: 13356 median: 13355 (15%) max: 13870 Points
min: 5994 avg: 6126 median: 6125.5 (7%) max: 6257 Points
GPU TDP ? TDP 30 W TDP 35 W 100% 45% 47%
3DMark - 3DMark Ice Storm Graphics
min: 59373 avg: 104094 median: 86295 (10%) max: 166615 Points
3DMark - 3DMark Wild Life Extreme Unlimited
min: 4807 avg: 4928 median: 4927.5 (6%) max: 5048 Points
GPU TDP 30 W TDP 35 W 95% 100%
3DMark 11 - 3DM11 Performance Score
min: 12279 avg: 15364 median: 15913 (22%) max: 17377 Points
min: 10068 avg: 10320 median: 10319.5 (14%) max: 10571 Points
GPU TDP ? TDP 30 W TDP 35 W 100% 66% 69%
3DMark 11 - 3DM11 Performance GPU
min: 17010 avg: 17711 median: 17439 (15%) max: 18653 Points
min: 9679 avg: 10005 median: 10005 (9%) max: 10331 Points
GPU TDP ? TDP 30 W TDP 35 W 100% 55% 58%
3DMark Vantage + NVIDIA GeForce GTX 1660 Ti Max-Q 3DMark Vantage - 3DM Vant. Perf. total
31845 Points (9%)
3DM Vant. Perf. total + NVIDIA GeForce MX550
36560 Points (11%)
GPU TDP ? TDP 35 W 87% 100%
3DM Vant. Perf. GPU no PhysX + NVIDIA GeForce GTX 1660 Ti Max-Q 3DMark Vantage - 3DM Vant. Perf. GPU no PhysX
34951 Points (20%)
3DM Vant. Perf. GPU no PhysX + NVIDIA GeForce MX550
31800 Points (18%)
GPU TDP ? TDP 35 W 100% 91%
3DMark 06 3DMark 06 - Standard 1280x1024 + NVIDIA GeForce GTX 1660 Ti Max-Q
min: 24029 avg: 28247 median: 25211 (33%) max: 38536 Points
3DMark 06 - Standard 1280x1024 + NVIDIA GeForce MX550
42476 Points (56%)
GPU TDP ? TDP 35 W 67% 100%
Unigine Valley 1.0 - Unigine Valley 1.0 DX
27.1 fps (9%)
Blender - Blender 3.3 Classroom CUDA *
262 Seconds (39%)
Blender - Blender 3.3 Classroom OPTIX *
236 Seconds (88%)
SPECviewperf 13 specvp13 sw-04 + NVIDIA GeForce MX550 SPECviewperf 13 - specvp13 sw-04
67.6 fps (18%)
specvp13 snx-03 + NVIDIA GeForce MX550 SPECviewperf 13 - specvp13 snx-03
11.2 fps (1%)
specvp13 showcase-02 + NVIDIA GeForce MX550 SPECviewperf 13 - specvp13 showcase-02
28.9 fps (6%)
specvp13 medical-02 + NVIDIA GeForce MX550 SPECviewperf 13 - specvp13 medical-02
22.8 fps (5%)
specvp13 maya-05 + NVIDIA GeForce MX550 SPECviewperf 13 - specvp13 maya-05
95.1 fps (11%)
specvp13 energy-02 + NVIDIA GeForce MX550 SPECviewperf 13 - specvp13 energy-02
0.6 fps (0%)
specvp13 creo-02 + NVIDIA GeForce MX550 SPECviewperf 13 - specvp13 creo-02
76.9 fps (11%)
specvp13 catia-05 + NVIDIA GeForce MX550 SPECviewperf 13 - specvp13 catia-05
51.1 fps (6%)
specvp13 3dsmax-06 + NVIDIA GeForce MX550 SPECviewperf 13 - specvp13 3dsmax-06
52.2 fps (9%)
SPECviewperf 2020 specvp2020 solidworks-05 1080p + NVIDIA GeForce MX550 SPECviewperf 2020 - specvp2020 solidworks-05 1080p
60.3 fps (12%)
specvp2020 snx-04 1080p + NVIDIA GeForce MX550 SPECviewperf 2020 - specvp2020 snx-04 1080p
11.1 fps (2%)
specvp2020 medical-03 1080p + NVIDIA GeForce MX550 SPECviewperf 2020 - specvp2020 medical-03 1080p
10.6 fps (8%)
specvp2020 maya-06 1080p + NVIDIA GeForce MX550 SPECviewperf 2020 - specvp2020 maya-06 1080p
113.2 fps (16%)
specvp2020 energy-03 1080p + NVIDIA GeForce MX550 SPECviewperf 2020 - specvp2020 energy-03 1080p
0.6 fps (1%)
specvp2020 creo-03 1080p + NVIDIA GeForce MX550 SPECviewperf 2020 - specvp2020 creo-03 1080p
45.1 fps (22%)
specvp2020 catia-06 1080p + NVIDIA GeForce MX550 SPECviewperf 2020 - specvp2020 catia-06 1080p
19.1 fps (12%)
specvp2020 3dsmax-07 1080p + NVIDIA GeForce MX550 SPECviewperf 2020 - specvp2020 3dsmax-07 1080p
20.9 fps (9%)
Cinebench R10 Cinebench R10 Shading (32bit) + NVIDIA GeForce GTX 1660 Ti Max-Q Cinebench R10 - Cinebench R10 Shading (32bit)
min: 6820 avg: 9290 median: 8562.5 (6%) max: 13213 Points
Cinebench R11.5 Cinebench R11.5 OpenGL 64 Bit + NVIDIA GeForce GTX 1660 Ti Max-Q Cinebench R11.5 - Cinebench R11.5 OpenGL 64 Bit
min: 49.83 avg: 59.5 median: 59.5 (21%) max: 69.2 fps
Cinebench R15 + NVIDIA GeForce GTX 1660 Ti Max-Q Cinebench R15 - Cinebench R15 OpenGL 64 Bit
min: 78.2 avg: 100.5 median: 96.9 (6%) max: 130.7 fps
Cinebench R15 OpenGL 64 Bit + NVIDIA GeForce MX550
min: 169.3 avg: 173.5 median: 173.5 (10%) max: 177.6 fps
GPU TDP ? TDP 30 W TDP 35 W 57% 95% 100%
Cinebench R15 OpenGL Ref. Match 64 Bit + NVIDIA GeForce GTX 1660 Ti Max-Q Cinebench R15 - Cinebench R15 OpenGL Ref. Match 64 Bit
99.6 % (100%)
Cinebench R15 OpenGL Ref. Match 64 Bit + NVIDIA GeForce MX550
99.6 % (100%)
GPU TDP ? TDP 30 W TDP 35 W 100% 100% 100%
GFXBench - GFXBench 5.0 4K Aztec Ruins High Tier Offscreen
28.7 fps (12%)
GFXBench - GFXBench 5.0 Aztec Ruins High Tier Offscreen
110.2 fps (20%)
62.7 fps (11%)
GPU TDP ? TDP 35 W 100% 57%
GFXBench - GFXBench 5.0 Aztec Ruins Normal Tier Offscreen
253.8 fps (19%)
155.2 fps (11%)
GPU TDP ? TDP 35 W 100% 61%
GFXBench - GFXBench Car Chase Offscreen
227.4 fps (26%)
153.9 fps (17%)
GPU TDP ? TDP 35 W 100% 68%
GFXBench 3.1 - GFXBench Manhattan ES 3.1 Offscreen
345.8 fps (7%)
GFXBench 3.0 - GFXBench 3.0 Manhattan Offscreen
360.6 fps (21%)
GFXBench (DX / GLBenchmark) 2.7 + NVIDIA GeForce GTX 1660 Ti Max-Q GFXBench (DX / GLBenchmark) 2.7 - GFXBench T-Rex HD Offscreen C24Z16
943 fps (8%)
LuxMark v2.0 64Bit - LuxMark v2.0 Room GPU
2141 Samples/s (10%)
523 Samples/s (2%)
GPU TDP ? TDP 35 W 100% 24%
LuxMark v2.0 64Bit - LuxMark v2.0 Sala GPU
4254 Samples/s (7%)
1058 Samples/s (2%)
GPU TDP ? TDP 35 W 100% 25%
ComputeMark v2.1 - ComputeMark v2.1 Result
10027 Points (11%)
6176 Points (7%)
GPU TDP ? TDP 35 W 100% 62%
Power Consumption - Furmark Stress Test Power Consumption - external Monitor *
min: 77.6 avg: 86.3 median: 86.3 (12%) max: 95 Watt
47.8 Watt (7%)
GPU TDP ? TDP 30 W 100% 106%
Power Consumption - The Witcher 3 Power Consumption - external Monitor *
min: 92 avg: 96.6 median: 96.6 (13%) max: 101.2 Watt
min: 53.1 avg: 56 median: 56 (8%) max: 58.9 Watt
GPU TDP ? TDP 30 W TDP 35 W 100% 107% 106%
Power Consumption - Witcher 3 Power Consumption *
min: 94.2 avg: 104.8 median: 106.9 (24%) max: 121 Watt
52.5 Watt (12%)
GPU TDP ? TDP 30 W 100% 115%
Power Consumption - Witcher 3 ultra Power Efficiency
min: 0.4388 avg: 0.5 median: 0.5 (43%) max: 0.537 fps per Watt
0.5 fps per Watt (41%)
GPU TDP ? TDP 30 W 100% 95%
Power Consumption - Witcher 3 ultra Power Efficiency - external Monitor
min: 0.4822 avg: 0.5 median: 0.5 (44%) max: 0.578 fps per Watt
min: 0.452 avg: 0.5 median: 0.5 (39%) max: 0.4924 fps per Watt
GPU TDP ? TDP 30 W TDP 35 W 100% 85% 93%
Emissions Witcher 3 Fan Noise + NVIDIA GeForce GTX 1660 Ti Max-Q Emissions - Witcher 3 Fan Noise
min: 34 avg: 43.4 median: 43.7 (70%) max: 53.8 dB(A)
Witcher 3 Fan Noise + NVIDIA GeForce MX550
39.6 dB(A) (63%)
GPU TDP ? TDP 30 W 100% 91%
Clock Speed - GPU Clock Witcher 3 ultra
1501 MHz (59%)
Clock Speed - GPU Clock Speed Furmark
1062 MHz (42%)
Average Benchmarks NVIDIA GeForce MX570 → 100% n=2 Average Benchmarks NVIDIA GeForce GTX 1660 Ti Max-Q → 140% n=2 Average Benchmarks NVIDIA GeForce MX550 → 73% n=2
- Range of benchmark values for this graphics card
- Average benchmark values for this graphics card
* Smaller numbers mean a higher performance
1 This benchmark is not used for the average calculation
Game Benchmarks The following benchmarks stem from our benchmarks of review laptops. The performance depends on the used graphics memory, clock rate, processor, system settings, drivers, and operating systems. So the results don't have to be representative for all laptops with this GPU. For detailed information on the benchmark results, click on the fps number.
GeForce MX550:
53.5 73 ~ 63 fps
GeForce GTX 1660 Ti Max-Q:
55.1 fps
GeForce GTX 1660 Ti Max-Q:
49.4 fps
GeForce GTX 1660 Ti Max-Q:
37.1 fps
GeForce GTX 1660 Ti Max-Q:
25.3 fps
GeForce GTX 1660 Ti Max-Q:
119 fps
GeForce GTX 1660 Ti Max-Q:
78 fps
GeForce GTX 1660 Ti Max-Q:
65 fps
GeForce GTX 1660 Ti Max-Q:
51 fps
GeForce GTX 1660 Ti Max-Q:
136.1 fps
GeForce GTX 1660 Ti Max-Q:
87.7 fps
GeForce GTX 1660 Ti Max-Q:
81.3 fps
GeForce GTX 1660 Ti Max-Q:
78.4 fps
GeForce GTX 1660 Ti Max-Q:
219 fps
GeForce GTX 1660 Ti Max-Q:
130 fps
GeForce GTX 1660 Ti Max-Q:
112 fps
GeForce GTX 1660 Ti Max-Q:
79 fps
GeForce GTX 1660 Ti Max-Q:
214.7 fps
GeForce GTX 1660 Ti Max-Q:
130.2 fps
GeForce GTX 1660 Ti Max-Q:
79.9 fps
GeForce GTX 1660 Ti Max-Q:
56.1 fps
GeForce GTX 1660 Ti Max-Q:
168.9 fps
GeForce GTX 1660 Ti Max-Q:
101.7 fps
GeForce GTX 1660 Ti Max-Q:
95.4 fps
GeForce GTX 1660 Ti Max-Q:
93.4 fps
GeForce GTX 1660 Ti Max-Q:
176.8 fps
GeForce GTX 1660 Ti Max-Q:
81.2 fps
GeForce GTX 1660 Ti Max-Q:
63.3 fps
GeForce GTX 1660 Ti Max-Q:
121.2 fps
GeForce GTX 1660 Ti Max-Q:
98.3 fps
GeForce GTX 1660 Ti Max-Q:
90.5 fps
GeForce GTX 1660 Ti Max-Q:
87.7 fps
GeForce GTX 1660 Ti Max-Q:
115.1 fps
GeForce GTX 1660 Ti Max-Q:
71.7 fps
GeForce GTX 1660 Ti Max-Q:
47.2 fps
GeForce GTX 1660 Ti Max-Q:
29.4 fps
GeForce GTX 1660 Ti Max-Q:
91.5 fps
GeForce GTX 1660 Ti Max-Q:
78.1 fps
GeForce GTX 1660 Ti Max-Q:
72.4 fps
GeForce GTX 1660 Ti Max-Q:
95.8 fps
GeForce GTX 1660 Ti Max-Q:
83 fps
GeForce GTX 1660 Ti Max-Q:
73.9 fps
GeForce GTX 1660 Ti Max-Q:
66.9 fps
GeForce GTX 1660 Ti Max-Q:
135.2 fps
GeForce GTX 1660 Ti Max-Q:
88 fps
GeForce GTX 1660 Ti Max-Q:
72.6 fps
GeForce GTX 1660 Ti Max-Q:
62.6 fps
GeForce GTX 1660 Ti Max-Q:
112.9 fps
GeForce GTX 1660 Ti Max-Q:
86.5 fps
GeForce GTX 1660 Ti Max-Q:
72 fps
GeForce GTX 1660 Ti Max-Q:
58.7 fps
GeForce GTX 1660 Ti Max-Q:
83 114 ~ 99 fps
GeForce GTX 1660 Ti Max-Q:
68 72 ~ 70 fps
GeForce GTX 1660 Ti Max-Q:
65 66 ~ 66 fps
GeForce GTX 1660 Ti Max-Q:
48 51 ~ 50 fps
GeForce GTX 1660 Ti Max-Q:
147.9 fps
GeForce GTX 1660 Ti Max-Q:
145.4 fps
GeForce GTX 1660 Ti Max-Q:
141 fps
GeForce GTX 1660 Ti Max-Q:
139.3 fps
GeForce GTX 1660 Ti Max-Q:
87 116.5 ~ 102 fps
GeForce GTX 1660 Ti Max-Q:
72.1 81.5 ~ 77 fps
GeForce GTX 1660 Ti Max-Q:
52.9 54.9 ~ 54 fps
GeForce GTX 1660 Ti Max-Q:
41.5 42.3 ~ 42 fps
GeForce GTX 1660 Ti Max-Q:
158.3 fps
GeForce GTX 1660 Ti Max-Q:
63.7 fps
GeForce GTX 1660 Ti Max-Q:
47.1 fps
GeForce GTX 1660 Ti Max-Q:
155 183 ~ 169 fps
GeForce GTX 1660 Ti Max-Q:
119 140 ~ 130 fps
GeForce GTX 1660 Ti Max-Q:
106 117 ~ 112 fps
GeForce GTX 1660 Ti Max-Q:
71 77 ~ 74 fps
GeForce GTX 1660 Ti Max-Q:
76.5 93.1 ~ 85 fps
GeForce GTX 1660 Ti Max-Q:
54.7 57.1 ~ 56 fps
GeForce GTX 1660 Ti Max-Q:
41.1 41.6 ~ 41 fps
GeForce GTX 1660 Ti Max-Q:
70.9 76.2 ~ 74 fps
GeForce GTX 1660 Ti Max-Q:
58.7 65.8 ~ 62 fps
GeForce GTX 1660 Ti Max-Q:
58.2 64.8 ~ 62 fps
GeForce GTX 1660 Ti Max-Q:
59.6 87.9 ~ 74 fps
GeForce GTX 1660 Ti Max-Q:
58.7 83.2 ~ 71 fps
GeForce GTX 1660 Ti Max-Q:
45.3 64.1 ~ 55 fps
GeForce GTX 1660 Ti Max-Q:
26 33.2 ~ 30 fps
GeForce GTX 1660 Ti Max-Q:
110 142 ~ 126 fps
GeForce GTX 1660 Ti Max-Q:
80 87 ~ 84 fps
GeForce GTX 1660 Ti Max-Q:
66 69 ~ 68 fps
GeForce GTX 1660 Ti Max-Q:
49 50 ~ 50 fps
GeForce GTX 1660 Ti Max-Q:
88.7 103.2 ~ 96 fps
GeForce GTX 1660 Ti Max-Q:
57.3 59.2 ~ 58 fps
GeForce GTX 1660 Ti Max-Q:
53.6 fps
GeForce GTX 1660 Ti Max-Q:
48.9 fps
GeForce GTX 1660 Ti Max-Q:
48.8 fps
GeForce GTX 1660 Ti Max-Q:
46.4 fps
GeForce GTX 1660 Ti Max-Q:
97 fps
GeForce GTX 1660 Ti Max-Q:
81 fps
GeForce GTX 1660 Ti Max-Q:
78 fps
GeForce GTX 1660 Ti Max-Q:
71 fps
GeForce GTX 1660 Ti Max-Q:
144 144 ~ 144 fps
GeForce GTX 1660 Ti Max-Q:
90.1 99.6 ~ 95 fps
GeForce GTX 1660 Ti Max-Q:
89 99.6 ~ 94 fps
GeForce GTX 1660 Ti Max-Q:
135.6 fps
GeForce GTX 1660 Ti Max-Q:
85.8 fps
GeForce GTX 1660 Ti Max-Q:
77.4 fps
GeForce GTX 1660 Ti Max-Q:
72.8 fps
GeForce GTX 1660 Ti Max-Q:
61 73 85 ~ 73 fps
GeForce GTX 1660 Ti Max-Q:
37.9 fps
GeForce GTX 1660 Ti Max-Q:
115.2 fps
GeForce GTX 1660 Ti Max-Q:
87.9 fps
GeForce GTX 1660 Ti Max-Q:
84.6 fps
GeForce GTX 1660 Ti Max-Q:
83.1 fps
GeForce GTX 1660 Ti Max-Q:
48 64 90 ~ 67 fps
GeForce GTX 1660 Ti Max-Q:
43 56 71 ~ 57 fps
GeForce GTX 1660 Ti Max-Q:
39 51 60 ~ 50 fps
GeForce GTX 1660 Ti Max-Q:
33 42 44 ~ 40 fps
GeForce GTX 1660 Ti Max-Q:
53 57 83 85 ~ 70 fps
GeForce GTX 1660 Ti Max-Q:
52 53 74 75 ~ 64 fps
GeForce GTX 1660 Ti Max-Q:
49 49 64 67 ~ 57 fps
GeForce MX550:
147 156 ~ 152 fps
GeForce MX550:
59 61 ~ 60 fps
GeForce MX550:
51 53 ~ 52 fps
GeForce MX550:
38.1 45 ~ 42 fps
GeForce GTX 1660 Ti Max-Q:
66.9 fps
GeForce GTX 1660 Ti Max-Q:
59.3 fps
GeForce GTX 1660 Ti Max-Q:
59.5 fps
GeForce GTX 1660 Ti Max-Q:
50.8 fps
GeForce GTX 1660 Ti Max-Q:
68 103 ~ 86 fps
GeForce MX550:
95 105 ~ 100 fps
GeForce GTX 1660 Ti Max-Q:
54 84 ~ 69 fps
GeForce MX550:
40 49 ~ 45 fps
GeForce GTX 1660 Ti Max-Q:
53 79 ~ 66 fps
GeForce MX550:
32 44 ~ 38 fps
GeForce GTX 1660 Ti Max-Q:
50 74 ~ 62 fps
GeForce MX550:
30 40 ~ 35 fps
GeForce GTX 1660 Ti Max-Q:
30 fps
GeForce GTX 1660 Ti Max-Q:
376.8 fps
GeForce GTX 1660 Ti Max-Q:
215.9 fps
GeForce GTX 1660 Ti Max-Q:
117.3 fps
GeForce MX550:
67 73.4 ~ 70 fps
GeForce GTX 1660 Ti Max-Q:
125.6 fps
GeForce GTX 1660 Ti Max-Q:
91.7 fps
GeForce GTX 1660 Ti Max-Q:
77.3 fps
GeForce GTX 1660 Ti Max-Q:
53.7 fps
GeForce GTX 1660 Ti Max-Q:
138 fps
GeForce GTX 1660 Ti Max-Q:
92.2 fps
GeForce GTX 1660 Ti Max-Q:
89.5 fps
GeForce GTX 1660 Ti Max-Q:
78.6 fps
GeForce GTX 1660 Ti Max-Q:
91 fps
GeForce GTX 1660 Ti Max-Q:
82 fps
GeForce GTX 1660 Ti Max-Q:
72 fps
GeForce GTX 1660 Ti Max-Q:
61 fps
GeForce GTX 1660 Ti Max-Q:
130.4 fps
GeForce GTX 1660 Ti Max-Q:
78.1 fps
GeForce GTX 1660 Ti Max-Q:
72.4 fps
GeForce GTX 1660 Ti Max-Q:
41.5 fps
GeForce GTX 1660 Ti Max-Q:
193.7 fps
GeForce GTX 1660 Ti Max-Q:
140.7 fps
GeForce GTX 1660 Ti Max-Q:
116 fps
GeForce GTX 1660 Ti Max-Q:
42.4 fps
GeForce GTX 1660 Ti Max-Q:
40.7 fps
GeForce GTX 1660 Ti Max-Q:
93.7 fps
GeForce GTX 1660 Ti Max-Q:
72.7 fps
GeForce GTX 1660 Ti Max-Q:
64.5 fps
GeForce GTX 1660 Ti Max-Q:
232.8 fps
GeForce GTX 1660 Ti Max-Q:
200.1 fps
GeForce GTX 1660 Ti Max-Q:
163.6 fps
GeForce GTX 1660 Ti Max-Q:
148.8 fps
GeForce GTX 1660 Ti Max-Q:
60 fps
GeForce GTX 1660 Ti Max-Q:
60 fps
GeForce GTX 1660 Ti Max-Q:
60 fps
GeForce GTX 1660 Ti Max-Q:
89 fps
GeForce GTX 1660 Ti Max-Q:
69 fps
GeForce GTX 1660 Ti Max-Q:
51 fps
GeForce MX550:
149 159 ~ 154 fps
GeForce MX550:
89 94 ~ 92 fps
GeForce MX550:
48 51 ~ 50 fps
GeForce MX550:
24 29 ~ 27 fps
GeForce GTX 1660 Ti Max-Q:
30.9 fps
GeForce GTX 1660 Ti Max-Q:
161.3 fps
GeForce GTX 1660 Ti Max-Q:
151.5 fps
GeForce GTX 1660 Ti Max-Q:
114.6 fps
GeForce GTX 1660 Ti Max-Q:
59.6 fps
GeForce MX550:
33.7 35 ~ 34 fps
GeForce GTX 1660 Ti Max-Q:
343.8 fps
GeForce GTX 1660 Ti Max-Q:
322.9 fps
GeForce GTX 1660 Ti Max-Q:
296.9 fps
GeForce GTX 1660 Ti Max-Q:
166.1 fps
NVIDIA GeForce MX550 low med. high ultra QHD 4K F1 22 59.4 51.3 41.2 28.1 Ghostwire Tokyo 35.8 35.5 35.1 33.2 GRID Legends 85 70 44 30 God of War 36 28 7 Farming Simulator 22 169 80 60 42 Forza Horizon 5 119 47 31 12 F1 2021 166 63 51 28 Cyberpunk 2077 1.0 31 24 17 7 Strange Brigade 152 60 52 42 Far Cry 5 100 45 38 35 X-Plane 11.11 106 88 70 Final Fantasy XV Benchmark 75 36 22 Dota 2 Reborn 142 127 111 104 The Witcher 3 154 92 50 27 GTA V 163 154 76 34 < 30 fps < 60 fps < 120 fps ≥ 120 fps 4 5 6 2 5 6 2 3 8 4 4 6 1 1
For more games that might be playable and a list of all games and graphics cards visit our Gaming List
v1.28
log 30. 22:56:09
#0 checking url part for id 11112 +0s ... 0s
#1 checking url part for id 9832 +0s ... 0s
#2 checking url part for id 11110 +0s ... 0s
#3 redirected to Ajax server, took 1719780969 +0s ... 0s
#4 did not recreate cache, as it is less than 5 days old! Created at Fri, 28 Jun 2024 05:15:43 +0200 +0s ... 0s
#5 composed specs +0.055s ... 0.055s
#6 did output specs +0s ... 0.055s
#7 start showIntegratedCPUs +0s ... 0.055s
#8 getting avg benchmarks for device 11112 +0.032s ... 0.087s
#9 got single benchmarks 11112 +0.003s ... 0.091s
#10 getting avg benchmarks for device 9832 +0.004s ... 0.095s
#11 got single benchmarks 9832 +0.012s ... 0.107s
#12 getting avg benchmarks for device 11110 +0s ... 0.107s
#13 got single benchmarks 11110 +0.006s ... 0.114s
#14 got avg benchmarks for devices +0s ... 0.114s
#15 min, max, avg, median took s +0.041s ... 0.155s
#16 before gaming benchmark output +0s ... 0.155s
#17 Got 428 rows for game benchmarks. +0.022s ... 0.176s
#18 composed SQL query for gamebenchmarks +0s ... 0.176s
#19 got data and put it in $dataArray +0.003s ... 0.18s
#20 benchmarks composed for output. +0.022s ... 0.201s
#21 calculated avg scores. +0s ... 0.201s
#22 return log +0.001s ... 0.202s
Please share our article, every link counts!
Redaktion, 2017-09- 8 (Update: 2023-07- 1)
 Deutsch
 English
 Español
 Français
 Italiano
 Nederlands
 Polski
 Português
 Русский
 Türkçe
 Svenska
 Chinese
 Magyar