NVIDIA GeForce MX330 vs NVIDIA GeForce RTX 2070 Super Mobile vs NVIDIA GeForce RTX 2080 Max-Q
NVIDIA GeForce MX330 ► remove from comparison
The Nvidia GeForce MX330 is a dedicated entry-level mobile graphics card for laptops . It was released in February 2020 and is basically a renamed Geforce MX250 / GeForce MX150 / desktop GeForce GT 1030 . It uses the same GP108 chip as the MX250 (GP108-655-A1 e.g.). It offers the same 384 CUDA cores as the MX250 and MX150 and also the clock speeds only increased slightly (+12 MHz Boost = 0.8% for the 25 Watt version). The dedicated GDDR5 graphics memory is connected via a 64 Bit memory bus and clocked at 3500 MHz (7000 MHz effective) leading to maximal bandwidth of 56 GB/s. Again there is a 25 Watt and slower 12 Watt (low power) variant.
In Nvidia drivers the GeForce MX330 appeared with the hardware ID 1D16.
The GP108 chip is manufactured in a 16 nm FinFET process and offers a number of new features, including support for DisplayPort 1.4 (ready), HDMI 2.0b, HDR and improved H.265 video de- and encoding (PlayReady 3.0). 4K HDR with Netflix however won't run due to the minimum 3 GB graphics memory that is required. Compared to the bigger Pascal chips, the small GP108 does not support Simultaneous Multi-Projection (SMP) for VR and G-Sync. A full list of improvements and the new Pascal desktop GPUs is available in our dedicated Pascal architecture article .
The performance of the GeForce MX330 should be identical to the MX150 and MX250 of previous years. See our GeForce MX250 page for gaming benchmarks . Nvidia states on the product page that the MX330 offers 2x of the performance of a Intel Iris Plus Graphics G7 in an i7-1065G7 (vs 2.5x of the MX350 ). Therefore, very demanding games like Red Dead Redemption 2 will not run smoothly, older and less demanding games like Fifa 20 or Farming Simulator 19 however should run fine in medium settings (see below for our benchmark results with different laptops). The low power version (see below) will be clearly slower however.
There is a low power version N17S-LP with a TGP of 12 Watt (up 2 Watt from 10 Watt of the LP MX250) and a "normal" 25 Watt N17S-G3. The performance of both variants should clearly differ. The low power variant offers relatively slow clock rates of 746 - 936 MHz (base - Turbo), where the 25 Watt G3 variant is clocked at 1531 - 1594 (similar to the MX250 and +70% boost clock versus the LP variant).
NVIDIA GeForce RTX 2070 Super Mobile ► remove from comparison
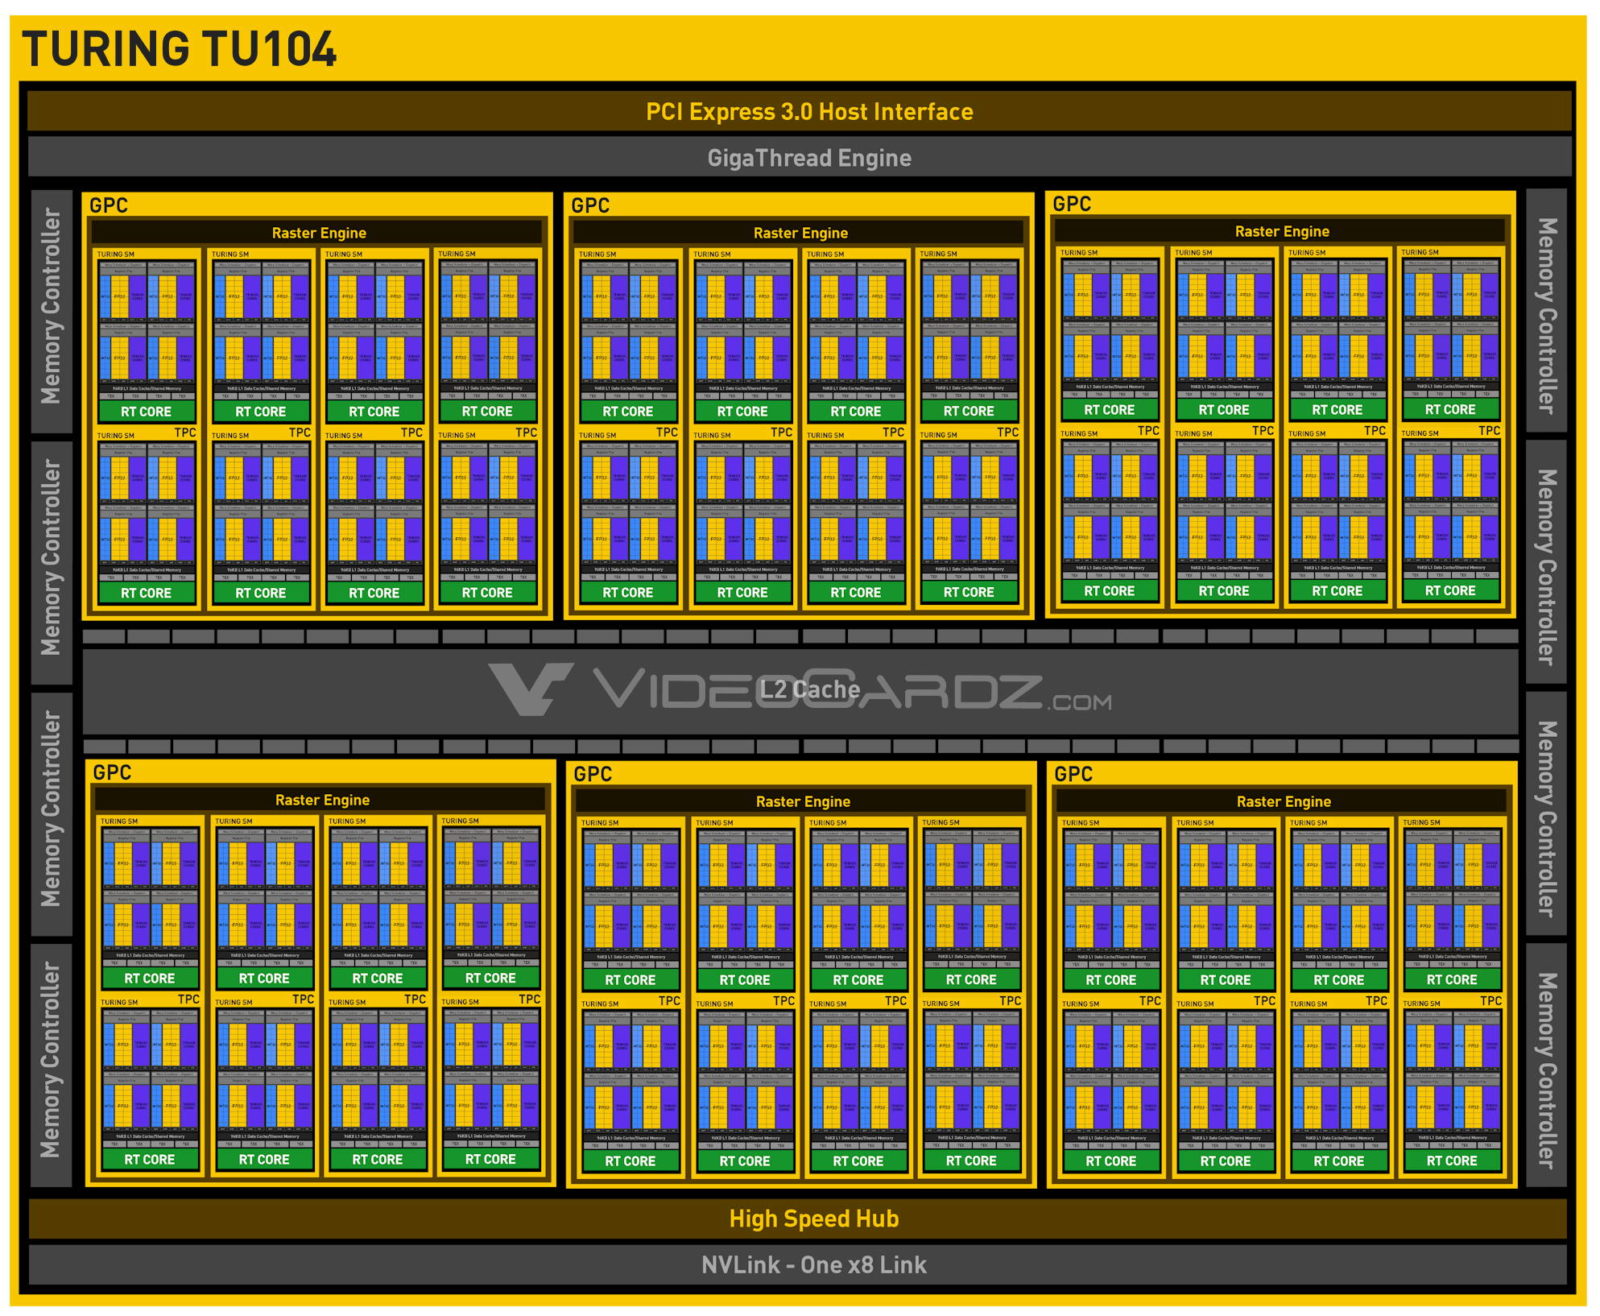
The NVIDIA GeForce RTX 2070 Super Mobile is a high end gaming graphics cards for laptops. It is the 2020 refresh of the GeForce RTX 2070 Mobile and may now also use the TU104 chip with more shaders (as the desktop RTX 2070 Super did). The older mobile RTX 2070 uses the TU106 chip with 2,304 shaders and should be slightly slower than the new Super model.
NVIDIA manufacturers the TU106 and TU104 chips on a 12 nm FinFET process and includes features like Deep Learning Super Sampling (DLSS) and Real-Time Ray Tracing (RTRT), which should combine to create more realistic lighting effects than older GPUs based on the company's Pascal architecture (if the games supports it). The RTX 2070 Super is also DisplayPort 1.4 ready, while there is also support for HDMI 2.0b, HDR, Simultaneous Multi-Projection (SMP) and H.265 video en/decoding (PlayReady 3.0).
NVIDIA GeForce RTX 2080 Max-Q ► remove from comparison
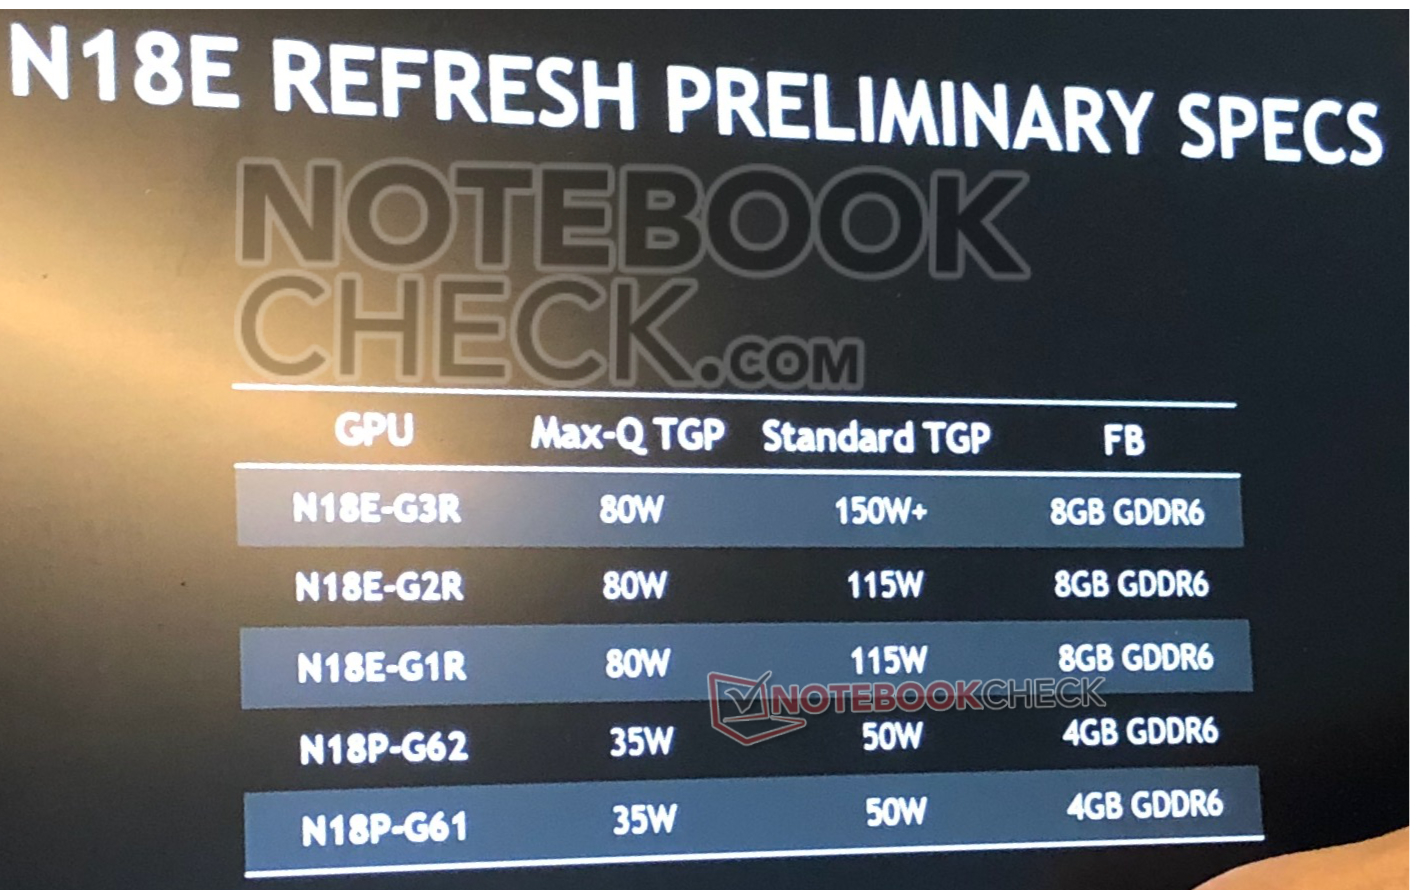
The NVIDIA GeForce RTX 2080 with Max-Q design is the power saving variant of the mobile RTX 2080 with reduced clock speeds and power consumption. Therefore, it is suitable for thin gaming laptops. It is based on the same TU104 chip is the desktop and mobile variant and offers 2,944 shaders and 8 GB GDDR6 memory connected by a 256 bit interface (12 GHz).
Currently it looks like there will be two variants, a low power 80 Watt variant with 735 - 1095 MHz core clock and a faster 90 Watt variant with 990 - 1230 MHz core clock).
The clock is not the only difference compared to the regular RTX 2080 though. The drivers for the Max-Q version were optimized for efficiency (and not performance; only for Max-Q models), there are optimized voltage converters for 1V operation, high-end cooling methods, and a 40 dB limit for the fan noise (with clock adjustments to ensure this at all times).
NVIDIA manufactures the TU104 chip on a 12 nm FinFET process and includes features like Deep Learning Super Sampling (DLSS) and Real-Time Ray Tracing (RTRT), which should combine to create more realistic lighting effects than older GPUs based on the company's Pascal architecture (if the games supports it). The RTX 2080 is also DisplayPort 1.4 ready, while there is also support for HDMI 2.0b, HDR, Simultaneous Multi-Projection (SMP) and H.265 video en/decoding (PlayReady 3.0).
The RTX 2080 Max-Q should be slightly faster than a regular mobile RTX 2070 and therefore a high end gaming graphics card. It should be able to run all demanding games in 4k with maximum details. Raytracing features however may reduce framerates a lot.
NVIDIA GeForce MX330 NVIDIA GeForce RTX 2070 Super Mobile NVIDIA GeForce RTX 2080 Max-Q GeForce RTX 2000 Series GeForce MX450 896 @ 1.4 - 1.58 GHz 64 Bit @ 10000 MHz GeForce MX350 640 @ 1.35 - 1.47 GHz 64 Bit @ 7000 MHz GeForce MX330 384 @ 1.53 - 1.59 GHz 64 Bit @ 7000 MHz
Codename N17S-LP / N17S-G3 N18E-G2R N18E-G3-A1 MAX-Q TU104 Architecture Pascal Turing Turing Pipelines 384 - unified 2560 - unified 2944 - unified TMUs 32 ROPs 16 Core Speed 1531 - 1594 (Boost) MHz 1140 - 1380 (Boost) MHz 735-990 - 1095-1230 (Boost) MHz Memory Speed 7000 effective = 1752 MHz 14002 MHz 12000 MHz Memory Bus Width 64 Bit 256 Bit 256 Bit Memory Type GDDR5 GDDR6 GDDR6 Shared Memory no no no Memory Bandwidth 56.1 GB/s API DirectX 12_1, OpenGL 4.6 DirectX 12_1, OpenGL 4.6 DirectX 12_1, OpenGL 4.6 Power Consumption 25 Watt (12 - 25 Watt TGP) 115 Watt 80-90 Watt technology 14 nm 12 nm 12 nm PCIe 3.0 Displays HDMI 2.0b, DisplayPort 1.4 Features Vulkan 1.1, OpenGL 4.6, OpenCL 1.2, GPU Boost 3.0, Multi Monitor, Optimus, GameWorks DLSS, Raytraycing, VR Ready, G-SYNC, Vulkan, Multi Monitor, 550 Watt system power recommended NVLink, DLSS, Raytraycing, VR Ready, G-SYNC, Vulkan, Multi Monitor, 650 Watt system power recommended Date of Announcement 20.02.2020 02.04.2020 06.01.2019 Link to Manufacturer Page www.nvidia.com Max. Amount of Memory 8 GB 8 GB Notebook Size large large Transistors 13.6 Billion
Benchmarks Performance Rating - 3DMark 11 + Fire Strike + Time Spy - GeForce MX330
1.7 pt (5%)
...
...
max:
Performance Rating - 3DMark 11 + Fire Strike + Time Spy - GeForce RTX 2080 Max-Q
9.4 pt (28%)
...
NVIDIA GeForce RTX 2080 Max-Q
...
max:
3DMark - 3DMark Time Spy Score
min: 1178 avg: 1236 median: 1235.5 (4%) max: 1293 Points
min: 7943 avg: 8292 median: 8315.5 (24%) max: 8602 Points
GPU TDP ? TDP 113 W TDP 115 W 85% 97% 100%
min: 6399 avg: 7609 median: 7484 (22%) max: 8604 Points
GPU TDP ? TDP 113 W TDP 115 W 89% 97% 100%
3DMark - 3DMark Time Spy Graphics
min: 1059 avg: 1136 median: 1160 (3%) max: 1190 Points
min: 7840 avg: 8238 median: 8272 (22%) max: 8657 Points
GPU TDP ? TDP 113 W TDP 115 W 80% 100% 100%
min: 6464 avg: 7903 median: 7923 (21%) max: 8844 Points
GPU TDP ? TDP 113 W TDP 115 W 89% 100% 100%
3DMark - 3DMark Ice Storm Unlimited Graphics
min: 234893 avg: 243721 median: 243721 (28%) max: 252549 Points
min: 446705 avg: 471516 median: 481195 (55%) max: 486649 Points
GPU TDP ? TDP 113 W TDP 115 W 64% 99% 100%
min: 364184 avg: 413236 median: 425550 (48%) max: 444648 Points
GPU TDP ? TDP 113 W TDP 115 W 77% 99% 100%
3DMark - 3DMark Ice Storm Extreme Graphics
min: 32370 avg: 49651 median: 49651 (6%) max: 66932 Points
min: 166342 avg: 280059 median: 342495 (44%) max: 377016 Points
3DMark - 3DMark Cloud Gate Score
min: 12137 avg: 14691 median: 15382 (16%) max: 16555 Points
min: 39220 avg: 45009 median: 46745 (50%) max: 50766 Points
GPU TDP ? TDP 113 W TDP 115 W 87% 98% 100%
min: 25513 avg: 35405 median: 34287 (37%) max: 50705 Points
GPU TDP ? TDP 113 W TDP 115 W 88% 98% 100%
3DMark - 3DMark Cloud Gate Graphics
min: 15595 avg: 19968 median: 20729 (5%) max: 23580 Points
min: 75986 avg: 121959 median: 126287 (33%) max: 141778 Points
GPU TDP ? TDP 113 W TDP 115 W 72% 100% 61%
min: 38256 avg: 111063 median: 117764 (31%) max: 129506 Points
GPU TDP ? TDP 113 W TDP 115 W 84% 100% 61%
3DMark - 3DMark Fire Strike Standard Score
min: 3308 avg: 3436 median: 3470 (6%) max: 3530 Points
min: 14771 avg: 18634 median: 18919.5 (33%) max: 19884 Points
GPU TDP ? TDP 113 W TDP 115 W 83% 100% 91%
min: 15962 avg: 17836 median: 17504 (31%) max: 22184 Points
GPU TDP ? TDP 113 W TDP 115 W 92% 100% 91%
3DMark - 3DMark Fire Strike Standard Graphics
min: 3581 avg: 3727 median: 3762 (4%) max: 3838 Points
min: 18662 avg: 21824 median: 22016 (25%) max: 23042 Points
GPU TDP ? TDP 113 W TDP 115 W 82% 100% 93%
min: 18048 avg: 20658 median: 20703 (23%) max: 23032 Points
GPU TDP ? TDP 113 W TDP 115 W 90% 100% 93%
3DMark - 3DMark Ice Storm Graphics
min: 21238 avg: 45268 median: 45267.5 (5%) max: 69297 Points
min: 69036 avg: 274353 median: 300340 (36%) max: 419228 Points
3DMark - 3DMark Wild Life Unlimited
51350 Points (26%)
3DMark - 3DMark Night Raid
12842 Points (12%)
39960 Points (38%)
3DMark - 3DMark Night Raid Graphics Score
15787 Points (6%)
90166 Points (35%)
3DMark 11 - 3DM11 Performance Score
min: 4898 avg: 5080 median: 5121.5 (7%) max: 5180 Points
min: 20961 avg: 23775 median: 24028.5 (33%) max: 25360 Points
GPU TDP ? TDP 113 W TDP 115 W 69% 87% 100%
min: 19220 avg: 21052 median: 21067 (29%) max: 23774 Points
GPU TDP ? TDP 113 W TDP 115 W 81% 87% 100%
3DMark 11 - 3DM11 Performance GPU
min: 4616 avg: 4787 median: 4834 (4%) max: 4863 Points
min: 28207 avg: 29416 median: 29092.5 (25%) max: 31050 Points
GPU TDP ? TDP 113 W TDP 115 W 68% 100% 98%
min: 23386 avg: 27852 median: 27973 (24%) max: 30910 Points
GPU TDP ? TDP 113 W TDP 115 W 87% 100% 98%
3DMark Vantage + NVIDIA GeForce RTX 2070 Super Mobile 3DMark Vantage - 3DM Vant. Perf. total
70601 Points (20%)
3DM Vant. Perf. total + NVIDIA GeForce RTX 2080 Max-Q
51930 Points (15%)
3DM Vant. Perf. GPU no PhysX + NVIDIA GeForce RTX 2070 Super Mobile 3DMark Vantage - 3DM Vant. Perf. GPU no PhysX
75429 Points (43%)
3DM Vant. Perf. GPU no PhysX + NVIDIA GeForce RTX 2080 Max-Q
60439 Points (34%)
3DMark 06 3DMark 06 - Standard 1280x1024 + NVIDIA GeForce RTX 2070 Super Mobile
43041 Points (56%)
3DMark 06 - Standard 1280x1024 + NVIDIA GeForce RTX 2080 Max-Q
min: 36228 avg: 37369 median: 37613 (49%) max: 38435 Points
Unigine Valley 1.0 - Unigine Valley 1.0 DX
18.1 fps (6%)
SPECviewperf 12 + NVIDIA GeForce MX330 SPECviewperf 12 - specvp12 sw-03
26.5 fps (7%)
specvp12 sw-03 + NVIDIA GeForce RTX 2080 Max-Q
69.5 fps (17%)
specvp12 snx-02 + NVIDIA GeForce MX330 SPECviewperf 12 - specvp12 snx-02
3.4 fps (1%)
specvp12 snx-02 + NVIDIA GeForce RTX 2080 Max-Q
11.4 fps (2%)
specvp12 showcase-01 + NVIDIA GeForce MX330 SPECviewperf 12 - specvp12 showcase-01
16.5 fps (4%)
specvp12 showcase-01 + NVIDIA GeForce RTX 2080 Max-Q
95.6 fps (21%)
specvp12 mediacal-01 + NVIDIA GeForce MX330 SPECviewperf 12 - specvp12 mediacal-01
10.5 fps (3%)
specvp12 mediacal-01 + NVIDIA GeForce RTX 2080 Max-Q
39.7 fps (10%)
specvp12 maya-04 + NVIDIA GeForce MX330 SPECviewperf 12 - specvp12 maya-04
27.1 fps (7%)
specvp12 maya-04 + NVIDIA GeForce RTX 2080 Max-Q
153.4 fps (42%)
specvp12 energy-01 + NVIDIA GeForce MX330 SPECviewperf 12 - specvp12 energy-01
0.5 fps (0%)
specvp12 energy-01 + NVIDIA GeForce RTX 2080 Max-Q
8.9 fps (8%)
specvp12 creo-01 + NVIDIA GeForce MX330 SPECviewperf 12 - specvp12 creo-01
12.2 fps (5%)
specvp12 creo-01 + NVIDIA GeForce RTX 2080 Max-Q
52.2 fps (21%)
specvp12 catia-04 + NVIDIA GeForce MX330 SPECviewperf 12 - specvp12 catia-04
17.7 fps (3%)
specvp12 catia-04 + NVIDIA GeForce RTX 2080 Max-Q
90.2 fps (15%)
specvp12 3dsmax-05 + NVIDIA GeForce MX330 SPECviewperf 12 - specvp12 3dsmax-05
27.1 fps (5%)
specvp12 3dsmax-05 + NVIDIA GeForce RTX 2080 Max-Q
174.7 fps (31%)
SPECviewperf 13 specvp13 sw-04 + NVIDIA GeForce MX330 SPECviewperf 13 - specvp13 sw-04
37.3 fps (10%)
specvp13 sw-04 + NVIDIA GeForce RTX 2070 Super Mobile
91.2 fps (24%)
specvp13 sw-04 + NVIDIA GeForce RTX 2080 Max-Q
89.3 fps (24%)
specvp13 snx-03 + NVIDIA GeForce MX330 SPECviewperf 13 - specvp13 snx-03
6.1 fps (1%)
specvp13 snx-03 + NVIDIA GeForce RTX 2070 Super Mobile
20.1 fps (2%)
specvp13 snx-03 + NVIDIA GeForce RTX 2080 Max-Q
20.3 fps (2%)
specvp13 showcase-02 + NVIDIA GeForce MX330 SPECviewperf 13 - specvp13 showcase-02
16.5 fps (4%)
specvp13 showcase-02 + NVIDIA GeForce RTX 2070 Super Mobile
112.1 fps (24%)
specvp13 showcase-02 + NVIDIA GeForce RTX 2080 Max-Q
95.5 fps (21%)
specvp13 medical-02 + NVIDIA GeForce MX330 SPECviewperf 13 - specvp13 medical-02
10.9 fps (2%)
specvp13 medical-02 + NVIDIA GeForce RTX 2070 Super Mobile
56.3 fps (12%)
specvp13 medical-02 + NVIDIA GeForce RTX 2080 Max-Q
55.9 fps (12%)
specvp13 maya-05 + NVIDIA GeForce MX330 SPECviewperf 13 - specvp13 maya-05
47.5 fps (5%)
specvp13 maya-05 + NVIDIA GeForce RTX 2070 Super Mobile
225 fps (26%)
specvp13 maya-05 + NVIDIA GeForce RTX 2080 Max-Q
256 fps (29%)
specvp13 energy-02 + NVIDIA GeForce MX330 SPECviewperf 13 - specvp13 energy-02
0.5 fps (0%)
specvp13 energy-02 + NVIDIA GeForce RTX 2070 Super Mobile
21.6 fps (7%)
specvp13 energy-02 + NVIDIA GeForce RTX 2080 Max-Q
16 fps (5%)
specvp13 creo-02 + NVIDIA GeForce MX330 SPECviewperf 13 - specvp13 creo-02
26.4 fps (4%)
specvp13 creo-02 + NVIDIA GeForce RTX 2070 Super Mobile
177.5 fps (26%)
specvp13 creo-02 + NVIDIA GeForce RTX 2080 Max-Q
177.1 fps (26%)
specvp13 catia-05 + NVIDIA GeForce MX330 SPECviewperf 13 - specvp13 catia-05
25.8 fps (3%)
specvp13 catia-05 + NVIDIA GeForce RTX 2070 Super Mobile
137.6 fps (15%)
specvp13 catia-05 + NVIDIA GeForce RTX 2080 Max-Q
128 fps (14%)
specvp13 3dsmax-06 + NVIDIA GeForce MX330 SPECviewperf 13 - specvp13 3dsmax-06
26.8 fps (5%)
specvp13 3dsmax-06 + NVIDIA GeForce RTX 2070 Super Mobile
188.7 fps (33%)
specvp13 3dsmax-06 + NVIDIA GeForce RTX 2080 Max-Q
176.5 fps (31%)
Cinebench R10 Cinebench R10 Shading (32bit) + NVIDIA GeForce RTX 2080 Max-Q Cinebench R10 - Cinebench R10 Shading (32bit)
min: 6820 avg: 9275 median: 8197.5 (6%) max: 13884 Points
Cinebench R11.5 Cinebench R11.5 OpenGL 64 Bit + NVIDIA GeForce RTX 2080 Max-Q Cinebench R11.5 - Cinebench R11.5 OpenGL 64 Bit
min: 73.1 avg: 77.2 median: 78.4 (27%) max: 80 fps
Cinebench R15 + NVIDIA GeForce MX330 Cinebench R15 - Cinebench R15 OpenGL 64 Bit
min: 93.4 avg: 98.2 median: 98.2 (6%) max: 103 fps
Cinebench R15 OpenGL 64 Bit + NVIDIA GeForce RTX 2070 Super Mobile
min: 130 avg: 141 median: 142.1 (8%) max: 154 fps
GPU TDP ? TDP 113 W TDP 115 W 86% 96% 100%
Cinebench R15 OpenGL 64 Bit + NVIDIA GeForce RTX 2080 Max-Q
min: 107.8 avg: 120.4 median: 119.7 (7%) max: 138.6 fps
GPU TDP ? TDP 113 W TDP 115 W 82% 96% 100%
Cinebench R15 OpenGL Ref. Match 64 Bit + NVIDIA GeForce MX330 Cinebench R15 - Cinebench R15 OpenGL Ref. Match 64 Bit
99.6 % (100%)
Cinebench R15 OpenGL Ref. Match 64 Bit + NVIDIA GeForce RTX 2070 Super Mobile
99.6 % (100%)
GPU TDP ? TDP 113 W TDP 115 W 100% 100% 100%
Cinebench R15 OpenGL Ref. Match 64 Bit + NVIDIA GeForce RTX 2080 Max-Q
99.6 % (100%)
GPU TDP ? TDP 113 W TDP 115 W 100% 100% 100%
GFXBench - GFXBench Car Chase Offscreen
402.6 fps (45%)
326 fps (37%)
LuxMark v2.0 64Bit - LuxMark v2.0 Room GPU
735 Samples/s (3%)
2006 Samples/s (9%)
LuxMark v2.0 64Bit - LuxMark v2.0 Sala GPU
1047 Samples/s (2%)
5110 Samples/s (9%)
ComputeMark v2.1 - ComputeMark v2.1 Result
2890 Points (3%)
15586 Points (17%)
14673 Points (16%)
Power Consumption - Furmark Stress Test Power Consumption - external Monitor *
min: 45 avg: 49.9 median: 49.9 (7%) max: 54.8 Watt
175 Watt (25%)
GPU TDP ? TDP 115 W 124% 100%
129 Watt (18%)
GPU TDP ? TDP 115 W 119% 100%
Power Consumption - The Witcher 3 Power Consumption - external Monitor *
min: 48.3 avg: 73.6 median: 73.6 (10%) max: 98.8 Watt
131 Watt (18%)
Power Consumption - Witcher 3 Power Consumption *
min: 53 avg: 57.6 median: 57.6 (13%) max: 62.2 Watt
min: 175 avg: 190.3 median: 190.5 (42%) max: 201 Watt
GPU TDP ? TDP 113 W 112% 100%
min: 130 avg: 161.4 median: 161 (35%) max: 185.8 Watt
GPU TDP ? TDP 113 W 110% 100%
Power Consumption - Witcher 3 ultra Power Efficiency
0.2 fps per Watt (20%)
min: 0.4264 avg: 0.4 median: 0.4 (40%) max: 0.472 fps per Watt
GPU TDP ? TDP 113 W 86% 100%
min: 0.4198 avg: 0.5 median: 0.5 (44%) max: 0.534 fps per Watt
GPU TDP ? TDP 113 W 99% 100%
Power Consumption - Witcher 3 ultra Power Efficiency - external Monitor
0.2 fps per Watt (19%)
0.6 fps per Watt (50%)
Emissions Witcher 3 Fan Noise + NVIDIA GeForce MX330 Emissions - Witcher 3 Fan Noise
min: 34.2 avg: 39.1 median: 39.1 (63%) max: 43.9 dB(A)
Witcher 3 Fan Noise + NVIDIA GeForce RTX 2070 Super Mobile
min: 50 avg: 53.4 median: 54 (86%) max: 57.5 dB(A)
GPU TDP ? TDP 113 W 100% 100%
Witcher 3 Fan Noise + NVIDIA GeForce RTX 2080 Max-Q
min: 40.5 avg: 48 median: 48 (77%) max: 56.6 dB(A)
GPU TDP ? TDP 113 W 97% 100%
Clock Speed - GPU Clock Witcher 3 ultra
1683 MHz (66%)
min: 1425 avg: 1479 median: 1455 (57%) max: 1560 MHz
GPU TDP ? TDP 113 W 100% 100%
min: 915 avg: 1241 median: 1260 (49%) max: 1455 MHz
GPU TDP ? TDP 113 W 89% 100%
Clock Speed - GPU Clock Speed Furmark
1403 MHz (56%)
1148 MHz (45%)
GPU TDP ? TDP 115 W 100% 82%
1003 MHz (40%)
GPU TDP ? TDP 115 W 100% 95%
Average Benchmarks NVIDIA GeForce MX330 → 100% n=23 Average Benchmarks NVIDIA GeForce RTX 2070 Super Mobile → 618% n=23 Average Benchmarks NVIDIA GeForce RTX 2080 Max-Q → 542% n=23
- Range of benchmark values for this graphics card
- Average benchmark values for this graphics card
* Smaller numbers mean a higher performance
1 This benchmark is not used for the average calculation
Game Benchmarks The following benchmarks stem from our benchmarks of review laptops. The performance depends on the used graphics memory, clock rate, processor, system settings, drivers, and operating systems. So the results don't have to be representative for all laptops with this GPU. For detailed information on the benchmark results, click on the fps number.
100%
GeForce MX330:
26 [X] MSI Prestige 14 Intel Core i7-10510U 1.8GHz
GeForce MX330
min:
9.35 fps, P0.1:
9.81 fps, P1:
17.3 fps, max:
78 fps
fps
100%
GeForce MX330:
20.9 [X] MSI Prestige 14 Intel Core i7-10510U 1.8GHz
GeForce MX330
min:
4.65 fps, P0.1:
5.59 fps, P1:
12.2 fps, max:
76.4 fps
fps
100%
GeForce MX330:
14.6 [X] MSI Prestige 14 Intel Core i7-10510U 1.8GHz
GeForce MX330
min:
3.31 fps, P0.1:
3.75 fps, P1:
7.26 fps, max:
69.5 fps
fps
100%
GeForce MX330:
18.8 [X] MSI Prestige 14 Intel Core i7-10510U 1.8GHz
GeForce MX330
min:
12 fps
fps
100%
GeForce MX330:
15 [X] MSI Prestige 14 Intel Core i7-10510U 1.8GHz
GeForce MX330
min:
9 fps
fps
100%
GeForce MX330:
14.4 [X] MSI Prestige 14 Intel Core i7-10510U 1.8GHz
GeForce MX330
min:
6 fps
fps
100%
GeForce MX330:
19.7 [X] MSI Prestige 14 Intel Core i7-10510U 1.8GHz
GeForce MX330
min:
14 fps, P0.1:
14.2 fps, P1:
15.2 fps, max:
30.7 fps
fps
100%
GeForce MX330:
9.2 [X] MSI Prestige 14 Intel Core i7-10510U 1.8GHz
GeForce MX330
min:
4.88 fps, P0.1:
5.55 fps, P1:
6.39 fps, max:
15.5 fps
fps
100%
GeForce MX330:
6.2 [X] MSI Prestige 14 Intel Core i7-10510U 1.8GHz
GeForce MX330
min:
2.23 fps, P0.1:
2.83 fps, P1:
3.92 fps, max:
34.9 fps
fps
100%
GeForce MX330:
5.1 [X] MSI Prestige 14 Intel Core i7-10510U 1.8GHz
GeForce MX330
min:
1.875 fps, P0.1:
2.04 fps, P1:
2.69 fps, max:
16 fps
fps
100%
GeForce MX330:
36 [X] MSI Prestige 14 Intel Core i7-10510U 1.8GHz
GeForce MX330
min:
16 fps
fps
100%
GeForce MX330:
15 [X] MSI Prestige 14 Intel Core i7-10510U 1.8GHz
GeForce MX330
min:
9 fps
fps
100%
GeForce MX330:
9 [X] MSI Prestige 14 Intel Core i7-10510U 1.8GHz
GeForce MX330
min:
6 fps
fps
100%
GeForce MX330:
8 [X] MSI Prestige 14 Intel Core i7-10510U 1.8GHz
GeForce MX330
min:
3 fps
fps
100%
GeForce MX330:
44.3 [X] MSI Prestige 14 Intel Core i7-10510U 1.8GHz
GeForce MX330
min:
24.7 fps, P0.1:
24.8 fps, P1:
29.1 fps, max:
96.1 fps
fps
352%
GeForce RTX 2070 Super Mobile:
156 fps
100%
GeForce MX330:
15.7 [X] MSI Prestige 14 Intel Core i7-10510U 1.8GHz
GeForce MX330
min:
9.07 fps, P0.1:
9.09 fps, P1:
9.46 fps, max:
44.6 fps
fps
671%
GeForce RTX 2070 Super Mobile:
105.4 fps
100%
GeForce MX330:
15.4 [X] MSI Prestige 14 Intel Core i7-10510U 1.8GHz
GeForce MX330
min:
7.99 fps, P0.1:
8.3 fps, P1:
8.81 fps, max:
43.2 fps
fps
676%
GeForce RTX 2070 Super Mobile:
104.1 fps
100%
GeForce MX330:
13.4 [X] MSI Prestige 14 Intel Core i7-10510U 1.8GHz
GeForce MX330
min:
6.59 fps, P0.1:
6.62 fps, P1:
7.27 fps, max:
43 fps
fps
688%
GeForce RTX 2070 Super Mobile:
92.2 fps
GeForce RTX 2070 Super Mobile:
61 fps
GeForce RTX 2070 Super Mobile:
31.4 fps
100%
GeForce MX330:
35.3 [X] MSI Prestige 14 Intel Core i7-10510U 1.8GHz
GeForce MX330
min:
20.8 fps, P0.1:
22.7 fps, P1:
25.3 fps, max:
86.4 fps
fps
541%
GeForce RTX 2070 Super Mobile:
191 fps
100%
GeForce MX330:
12.7 [X] MSI Prestige 14 Intel Core i7-10510U 1.8GHz
GeForce MX330
min:
10 fps, P0.1:
10.1 fps, P1:
10.4 fps, max:
19.5 fps
fps
791%
GeForce RTX 2070 Super Mobile:
100.5 fps
100%
GeForce MX330:
8.1 [X] MSI Prestige 14 Intel Core i7-10510U 1.8GHz
GeForce MX330
min:
7.95 fps, P0.1:
7.96 fps, P1:
8.26 fps, max:
13.8 fps
fps
1159%
GeForce RTX 2070 Super Mobile:
93.8 fps
GeForce RTX 2070 Super Mobile:
85.1 fps
GeForce RTX 2070 Super Mobile:
60.6 fps
GeForce RTX 2070 Super Mobile:
35.3 fps
100%
GeForce MX330:
18 [X] MSI Prestige 14 Intel Core i7-10510U 1.8GHz
GeForce MX330
P0.1:
5 fpsP1:
fps
fps
678%
GeForce RTX 2070 Super Mobile:
122 fps
100%
GeForce MX330:
9 [X] MSI Prestige 14 Intel Core i7-10510U 1.8GHz
GeForce MX330
P0.1:
6 fpsP1:
fps
fps
922%
GeForce RTX 2070 Super Mobile:
83 fps
100%
GeForce MX330:
8 [X] MSI Prestige 14 Intel Core i7-10510U 1.8GHz
GeForce MX330
P0.1:
5 fpsP1:
fps
fps
888%
GeForce RTX 2070 Super Mobile:
71 fps
GeForce RTX 2070 Super Mobile:
60 61 [X] SCHENKER XMG Neo 17 Comet Lake Overboost
Intel Core i7-10875H 2.3GHz
GeForce RTX 2070 Super Mobile
min:
18 fps, P0.1:
29 fps, P1:
42 fps, max:
124 fps
93 [X] SCHENKER Compact 17 Leistungsmodus
Intel Core i7-10875H 2.3GHz
GeForce RTX 2070 Super Mobile
min:
35 fps, P0.1:
40 fps, P1:
60 fps, max:
149 fps
~ 71 fps
100%
GeForce MX330:
37.1 [X] MSI Prestige 14 Intel Core i7-10510U 1.8GHz
GeForce MX330
min:
23.6 fps, P0.1:
26.8 fps, P1:
29.4 fps, max:
56.1 fps
fps
434%
GeForce RTX 2070 Super Mobile:
157 165 [X] SCHENKER Compact 17 Intel Core i7-10875H 2.3GHz
GeForce RTX 2070 Super Mobile
min:
112 fps, P0.1:
123.8 fps, P1:
129.7 fps, max:
233.8 fps
~ 161 fps
100%
GeForce MX330:
9.6 [X] MSI Prestige 14 Intel Core i7-10510U 1.8GHz
GeForce MX330
min:
7.1 fps, P0.1:
7.2 fps, P1:
7.7 fps, max:
12.3 fps
fps
969%
GeForce RTX 2070 Super Mobile:
91 91 95.5 [X] SCHENKER Compact 17 Intel Core i7-10875H 2.3GHz
GeForce RTX 2070 Super Mobile
min:
52.2 fps, P0.1:
65.7 fps, P1:
79.8 fps, max:
128.7 fps
~ 93 fps
GeForce RTX 2070 Super Mobile:
73.6 78 [X] SCHENKER Compact 17 Intel Core i7-10875H 2.3GHz
GeForce RTX 2070 Super Mobile
min:
52.6 fps, P0.1:
58.3 fps, P1:
66.9 fps, max:
97 fps
~ 76 fps
GeForce RTX 2070 Super Mobile:
45.5 63.8 [X] SCHENKER Compact 17 Intel Core i7-10875H 2.3GHz
GeForce RTX 2070 Super Mobile
min:
40.1 fps, P0.1:
48.9 fps, P1:
53.5 fps, max:
78.2 fps
68.6 [X] SCHENKER Compact 17 Leistungsmodus
Intel Core i7-10875H 2.3GHz
GeForce RTX 2070 Super Mobile
min:
46.8 fps, P0.1:
51.6 fps, P1:
58.2 fps, max:
125.1 fps
~ 59 fps
GeForce RTX 2070 Super Mobile:
52.3 [X] SCHENKER Compact 17 Intel Core i7-10875H 2.3GHz
GeForce RTX 2070 Super Mobile
min:
36.6 fps, P0.1:
39.1 fps, P1:
44.2 fps, max:
70.7 fps
fps
GeForce RTX 2070 Super Mobile:
34.9 [X] SCHENKER Compact 17 Intel Core i7-10875H 2.3GHz
GeForce RTX 2070 Super Mobile
min:
21.3 fps, P0.1:
24.1 fps, P1:
30.5 fps, max:
42.3 fps
fps
100%
GeForce MX330:
26.2 [X] MSI Prestige 14 Intel Core i7-10510U 1.8GHz
GeForce MX330
min:
13.09 fps, P1:
19.27 fps, max:
64.13 fps
fps
427%
GeForce RTX 2070 Super Mobile:
112 [X] SCHENKER Compact 17 Intel Core i7-10875H 2.3GHz
GeForce RTX 2070 Super Mobile
min:
46 fps, P0.1:
63 fps, P1:
81 fps, max:
162 fps
112.2 ~ 112 fps
100%
GeForce MX330:
13.9 [X] MSI Prestige 14 Intel Core i7-10510U 1.8GHz
GeForce MX330
min:
9.49 fps, P1:
10.84 fps, max:
17.29 fps
fps
748%
GeForce RTX 2070 Super Mobile:
102.7 105 [X] SCHENKER Compact 17 Intel Core i7-10875H 2.3GHz
GeForce RTX 2070 Super Mobile
min:
49 fps, P0.1:
62 fps, P1:
81 fps, max:
141 fps
~ 104 fps
100%
GeForce MX330:
12 [X] MSI Prestige 14 Intel Core i7-10510U 1.8GHz
GeForce MX330
min:
8.11 fps, P1:
9.18 fps, max:
14.75 fps
fps
758%
GeForce RTX 2070 Super Mobile:
90.1 92 [X] SCHENKER Compact 17 Intel Core i7-10875H 2.3GHz
GeForce RTX 2070 Super Mobile
min:
48 fps, P0.1:
58 fps, P1:
70 fps, max:
128 fps
~ 91 fps
GeForce RTX 2070 Super Mobile:
59.3 60 [X] SCHENKER XMG Neo 17 Comet Lake Overboost
Intel Core i7-10875H 2.3GHz
GeForce RTX 2070 Super Mobile
min:
31 fps, P0.1:
42 fps, P1:
47 fps, max:
112 fps
61 [X] SCHENKER Compact 17 Intel Core i7-10875H 2.3GHz
GeForce RTX 2070 Super Mobile
min:
18 fps, P0.1:
40 fps, P1:
50 fps, max:
99 fps
64 [X] SCHENKER Compact 17 Leistungsmodus
Intel Core i7-10875H 2.3GHz
GeForce RTX 2070 Super Mobile
min:
38 fps, P0.1:
47 fps, P1:
53 fps, max:
98 fps
~ 61 fps
GeForce RTX 2070 Super Mobile:
44 [X] SCHENKER Compact 17 Intel Core i7-10875H 2.3GHz
GeForce RTX 2070 Super Mobile
min:
19 fps, P0.1:
20 fps, P1:
22 fps, max:
114 fps
fps
GeForce RTX 2070 Super Mobile:
25 [X] SCHENKER Compact 17 Intel Core i7-10875H 2.3GHz
GeForce RTX 2070 Super Mobile
min:
13 fps, P0.1:
14 fps, P1:
15 fps, max:
85 fps
fps
100%
GeForce MX330:
125 [X] MSI Prestige 14 1.5.4.5
Intel Core i7-10510U 1.8GHz
GeForce MX330
min:
6.74 fps, P1:
82.8 fps, max:
206 fps
fps
100%
GeForce MX330:
79.5 [X] MSI Prestige 14 1.5.4.5
Intel Core i7-10510U 1.8GHz
GeForce MX330
min:
15.4 fps, P1:
52.1 fps, max:
186 fps
fps
100%
GeForce MX330:
75.1 [X] MSI Prestige 14 1.5.4.5
Intel Core i7-10510U 1.8GHz
GeForce MX330
min:
36.6 fps, P1:
49.8 fps, max:
170 fps
fps
100%
GeForce MX330:
63.1 [X] MSI Prestige 14 1.5.4.5
Intel Core i7-10510U 1.8GHz
GeForce MX330
min:
40.1 fps, P1:
47 fps, max:
135 fps
fps
100%
GeForce MX330:
119 [X] MSI Prestige 14 1.5.4.5
Intel Core i7-10510U 1.8GHz
GeForce MX330
min:
21.3 fps, P1:
86.1 fps, max:
242 fps
fps
221%
GeForce RTX 2070 Super Mobile:
263.1 fps
100%
GeForce MX330:
48.6 [X] MSI Prestige 14 1.5.4.5
Intel Core i7-10510U 1.8GHz
GeForce MX330
min:
31.5 fps, P1:
37.9 fps, max:
172 fps
fps
462%
GeForce RTX 2070 Super Mobile:
224.6 fps
100%
GeForce MX330:
40.9 [X] MSI Prestige 14 1.5.4.5
Intel Core i7-10510U 1.8GHz
GeForce MX330
min:
30.9 fps, P1:
33 fps, max:
100 fps
fps
517%
GeForce RTX 2070 Super Mobile:
211.5 fps
100%
GeForce MX330:
21.8 [X] MSI Prestige 14 1.5.4.5
Intel Core i7-10510U 1.8GHz
GeForce MX330
min:
18.3 fps, P1:
19 fps, max:
29.4 fps
fps
928%
GeForce RTX 2070 Super Mobile:
202.4 fps
100%
GeForce MX330:
36.7 [X] MSI Prestige 14 1.5.4.5
Intel Core i7-10510U 1.8GHz
GeForce MX330
min:
20 fps, P1:
27.4 fps, max:
73.8 fps
fps
373%
GeForce RTX 2070 Super Mobile:
123.7 149.5 ~ 137 fps
100%
GeForce MX330:
16.5 [X] MSI Prestige 14 1.5.4.5
Intel Core i7-10510U 1.8GHz
GeForce MX330
min:
12.4 fps, P1:
13.3 fps, max:
24.6 fps
fps
612%
GeForce RTX 2070 Super Mobile:
95.2 106 ~ 101 fps
100%
GeForce MX330:
15.8 [X] MSI Prestige 14 1.5.4.5
Intel Core i7-10510U 1.8GHz
GeForce MX330
min:
12.3 fps, P1:
13.2 fps, max:
23.5 fps
fps
595%
GeForce RTX 2070 Super Mobile:
92 96.6 ~ 94 fps
100%
GeForce MX330:
85.7 [X] MSI Prestige 14 Intel Core i7-10510U 1.8GHz
GeForce MX330
min:
28.9 fps, P1:
60.9 fps, max:
230 fps
fps
152%
GeForce RTX 2070 Super Mobile:
122 124 143 [X] SCHENKER Compact 17 Intel Core i7-10875H 2.3GHz
GeForce RTX 2070 Super Mobile
min:
7.13 fps, P0.1:
24.4 fps, P1:
82.4 fps, max:
271 fps
~ 130 fps
100%
GeForce MX330:
13 [X] MSI Prestige 14 Intel Core i7-10510U 1.8GHz
GeForce MX330
min:
1.896 fps, P1:
4.24 fps, max:
76 fps
fps
746%
GeForce RTX 2070 Super Mobile:
93.7 94 102 [X] SCHENKER Compact 17 Intel Core i7-10875H 2.3GHz
GeForce RTX 2070 Super Mobile
min:
7.57 fps, P0.1:
17.8 fps, P1:
57.4 fps, max:
202 fps
~ 97 fps
100%
GeForce MX330:
8.2 [X] MSI Prestige 14 Intel Core i7-10510U 1.8GHz
GeForce MX330
min:
1.41 fps, P1:
1.734 fps, max:
73.9 fps
fps
1042%
GeForce RTX 2070 Super Mobile:
81.6 86.6 [X] SCHENKER Compact 17 Intel Core i7-10875H 2.3GHz
GeForce RTX 2070 Super Mobile
min:
16.2 fps, P0.1:
22.6 fps, P1:
45.3 fps, max:
185 fps
87.8 ~ 85 fps
GeForce RTX 2070 Super Mobile:
71.1 72.5 78 [X] SCHENKER Compact 17 Intel Core i7-10875H 2.3GHz
GeForce RTX 2070 Super Mobile
min:
4.71 fps, P0.1:
24.4 fps, P1:
46.2 fps, max:
153 fps
82.1 [X] SCHENKER Compact 17 Leistungsmodus
Intel Core i7-10875H 2.3GHz
GeForce RTX 2070 Super Mobile
min:
16.4 fps, P0.1:
30.7 fps, P1:
46.6 fps, max:
143 fps
~ 76 fps
GeForce RTX 2070 Super Mobile:
63.7 [X] SCHENKER Compact 17 Intel Core i7-10875H 2.3GHz
GeForce RTX 2070 Super Mobile
min:
17.5 fps, P0.1:
24.3 fps, P1:
36.7 fps, max:
125 fps
fps
GeForce RTX 2070 Super Mobile:
39.8 [X] SCHENKER Compact 17 Intel Core i7-10875H 2.3GHz
GeForce RTX 2070 Super Mobile
min:
8.15 fps, P0.1:
15.3 fps, P1:
22.5 fps, max:
99.7 fps
fps
100%
GeForce MX330:
61.7 [X] MSI Prestige 14 Intel Core i7-10510U 1.8GHz
GeForce MX330
min:
12.8 fps, P0.1:
13 fps, P1:
13.8 fps, max:
320 fps
fps
100%
GeForce MX330:
22.8 [X] MSI Prestige 14 Intel Core i7-10510U 1.8GHz
GeForce MX330
min:
4.99 fps, P0.1:
5.02 fps, P1:
5.7 fps, max:
231 fps
fps
100%
GeForce MX330:
11.9 [X] MSI Prestige 14 Intel Core i7-10510U 1.8GHz
GeForce MX330
min:
7.5 fps, P0.1:
8.11 fps, P1:
9.5 fps, max:
16.5 fps
fps
100%
GeForce MX330:
8.9 [X] MSI Prestige 14 Intel Core i7-10510U 1.8GHz
GeForce MX330
min:
5.38 fps, P0.1:
5.88 fps, P1:
7 fps, max:
16.8 fps
fps
100%
GeForce MX330:
28.4 [X] MSI Prestige 14 1.5.4.5
Intel Core i7-10510U 1.8GHz
GeForce MX330
min:
8.54 fps, P1:
22.5 fps, max:
49.2 fps
fps
243%
GeForce RTX 2070 Super Mobile:
66.6 71.2 ~ 69 fps
100%
GeForce MX330:
12.1 [X] MSI Prestige 14 1.5.4.5
Intel Core i7-10510U 1.8GHz
GeForce MX330
min:
6.01 fps, P1:
8.2054 fps, max:
33.3 fps
fps
496%
GeForce RTX 2070 Super Mobile:
58 61.7 ~ 60 fps
100%
GeForce MX330:
6.9 [X] MSI Prestige 14 1.5.4.5
Intel Core i7-10510U 1.8GHz
GeForce MX330
min:
4.48 fps, P1:
4.8428 fps, max:
13.9 fps
fps
737%
GeForce RTX 2070 Super Mobile:
48.8 53.3 ~ 51 fps
100%
GeForce MX330:
3.3 [X] MSI Prestige 14 1.5.4.5
Intel Core i7-10510U 1.8GHz
GeForce MX330
min:
0.848 fps, P1:
2.1328 fps, max:
13.6 fps
fps
1228%
GeForce RTX 2070 Super Mobile:
37.8 42.1 43.8 [X] SCHENKER XMG Neo 17 Comet Lake Overboost
Intel Core i7-10875H 2.3GHz
GeForce RTX 2070 Super Mobile
~ 41 fps
100%
GeForce MX330:
27 [X] MSI Prestige 14 Intel Core i7-10510U 1.8GHz
GeForce MX330
min:
10 fps
fps
541%
GeForce RTX 2070 Super Mobile:
139 152 ~ 146 fps
100%
GeForce MX330:
13 [X] MSI Prestige 14 Intel Core i7-10510U 1.8GHz
GeForce MX330
min:
7 fps
fps
908%
GeForce RTX 2070 Super Mobile:
107 129 ~ 118 fps
100%
GeForce MX330:
11 [X] MSI Prestige 14 Intel Core i7-10510U 1.8GHz
GeForce MX330
min:
5 fps
fps
955%
GeForce RTX 2070 Super Mobile:
94 116 ~ 105 fps
100%
GeForce MX330:
9 [X] MSI Prestige 14 Intel Core i7-10510U 1.8GHz
GeForce MX330
min:
4 fps
fps
944%
GeForce RTX 2070 Super Mobile:
77 79 [X] Asus Strix G17 G712LWS Turbo
Intel Core i7-10750H 2.6GHz
GeForce RTX 2070 Super Mobile
98 ~ 85 fps
100%
GeForce MX330:
33.4 [X] MSI Prestige 14 Intel Core i7-10510U 1.8GHz
GeForce MX330
min:
25 fps
fps
422%
GeForce RTX 2070 Super Mobile:
137.5 145 ~ 141 fps
100%
GeForce MX330:
14.7 [X] MSI Prestige 14 Intel Core i7-10510U 1.8GHz
GeForce MX330
min:
9 fps
fps
878%
GeForce RTX 2070 Super Mobile:
128.2 129.2 ~ 129 fps
100%
GeForce MX330:
13.7 [X] MSI Prestige 14 Intel Core i7-10510U 1.8GHz
GeForce MX330
min:
9 fps
fps
861%
GeForce RTX 2070 Super Mobile:
117.8 119.1 ~ 118 fps
100%
GeForce MX330:
13.4 [X] MSI Prestige 14 Intel Core i7-10510U 1.8GHz
GeForce MX330
min:
8 fps
fps
896%
GeForce RTX 2070 Super Mobile:
116.2 116.8 121.6 [X] SCHENKER Compact 17 Leistungsmodus
Intel Core i7-10875H 2.3GHz
GeForce RTX 2070 Super Mobile
123.8 [X] Asus Strix G17 G712LWS Turbo
Intel Core i7-10750H 2.6GHz
GeForce RTX 2070 Super Mobile
~ 120 fps
GeForce RTX 2070 Super Mobile:
81.3 fps
GeForce RTX 2070 Super Mobile:
46.9 fps
100%
GeForce MX330:
81 [X] MSI Prestige 14 Intel Core i7-10510U 1.8GHz
GeForce MX330
min:
73 fps
fps
280%
GeForce RTX 2070 Super Mobile:
227 fps
100%
GeForce MX330:
39 [X] MSI Prestige 14 Intel Core i7-10510U 1.8GHz
GeForce MX330
min:
32 fps
fps
431%
GeForce RTX 2070 Super Mobile:
168 fps
100%
GeForce MX330:
28 [X] MSI Prestige 14 Intel Core i7-10510U 1.8GHz
GeForce MX330
min:
22 fps
fps
525%
GeForce RTX 2070 Super Mobile:
147 fps
100%
GeForce MX330:
16 [X] MSI Prestige 14 Intel Core i7-10510U 1.8GHz
GeForce MX330
min:
12 fps
fps
756%
GeForce RTX 2070 Super Mobile:
118 124 [X] Asus Strix G17 G712LWS Turbo
Intel Core i7-10750H 2.6GHz
GeForce RTX 2070 Super Mobile
min:
108 fps, max:
143 fps
~ 121 fps
100%
GeForce MX330:
147 [X] MSI Prestige 14 Intel Core i7-10510U 1.8GHz
GeForce MX330
min:
135 fps
fps
100%
GeForce MX330:
118 [X] MSI Prestige 14 Intel Core i7-10510U 1.8GHz
GeForce MX330
min:
91 fps
fps
100%
GeForce MX330:
106 [X] MSI Prestige 14 Intel Core i7-10510U 1.8GHz
GeForce MX330
min:
85 fps
fps
100%
GeForce MX330:
94.6 [X] MSI Prestige 14 Intel Core i7-10510U 1.8GHz
GeForce MX330
fps
263%
GeForce RTX 2070 Super Mobile:
249.1 fps
100%
GeForce MX330:
34.5 [X] MSI Prestige 14 Intel Core i7-10510U 1.8GHz
GeForce MX330
fps
562%
GeForce RTX 2070 Super Mobile:
172.4 215 ~ 194 fps
100%
GeForce MX330:
22.1 [X] MSI Prestige 14 Intel Core i7-10510U 1.8GHz
GeForce MX330
fps
602%
GeForce RTX 2070 Super Mobile:
122.2 144 ~ 133 fps
100%
GeForce MX330:
15.9 [X] MSI Prestige 14 Intel Core i7-10510U 1.8GHz
GeForce MX330
fps
610%
GeForce RTX 2070 Super Mobile:
90 103 ~ 97 fps
GeForce RTX 2070 Super Mobile:
64.5 fps
GeForce RTX 2070 Super Mobile:
33.3 fps
100%
GeForce MX330:
35.3 [X] MSI Prestige 14 Intel Core i7-10510U 1.8GHz
GeForce MX330
min:
22 fps
fps
643%
GeForce RTX 2070 Super Mobile:
219.1 234.1 ~ 227 fps
442%
GeForce RTX 2080 Max-Q:
156 fps
GeForce RTX 2080 Max-Q:
140 fps
GeForce RTX 2080 Max-Q:
138 fps
GeForce RTX 2070 Super Mobile:
151 155.4 163.2 [X] Asus Strix G17 G712LWS Turbo
Intel Core i7-10750H 2.6GHz
GeForce RTX 2070 Super Mobile
170 190.4 ~ 166 fps
GeForce RTX 2080 Max-Q:
134 fps
GeForce RTX 2070 Super Mobile:
118 fps
GeForce RTX 2070 Super Mobile:
61.6 fps
100%
GeForce MX330:
51.6 [X] MSI Prestige 14 Intel Core i7-10510U 1.8GHz
GeForce MX330
min:
49 fps
fps
357%
GeForce RTX 2080 Max-Q:
184 fps
100%
GeForce MX330:
19 [X] MSI Prestige 14 Intel Core i7-10510U 1.8GHz
GeForce MX330
min:
17 fps
fps
716%
GeForce RTX 2070 Super Mobile:
136 fps
705%
GeForce RTX 2080 Max-Q:
134 fps
100%
GeForce MX330:
15.1 [X] MSI Prestige 14 Intel Core i7-10510U 1.8GHz
GeForce MX330
min:
14 fps
fps
748%
GeForce RTX 2070 Super Mobile:
113 fps
801%
GeForce RTX 2080 Max-Q:
121 fps
GeForce RTX 2070 Super Mobile:
74 fps
GeForce RTX 2070 Super Mobile:
34.1 fps
100%
GeForce MX330:
58.2 [X] MSI Prestige 14 Intel Core i7-10510U 1.8GHz
GeForce MX330
min:
54 fps
fps
208%
GeForce RTX 2080 Max-Q:
121 fps
100%
GeForce MX330:
33.7 [X] MSI Prestige 14 Intel Core i7-10510U 1.8GHz
GeForce MX330
min:
26 fps
fps
359%
GeForce RTX 2070 Super Mobile:
121 fps
359%
GeForce RTX 2080 Max-Q:
121 fps
100%
GeForce MX330:
23.3 [X] MSI Prestige 14 Intel Core i7-10510U 1.8GHz
GeForce MX330
min:
20 fps
fps
519%
GeForce RTX 2070 Super Mobile:
121 fps
515%
GeForce RTX 2080 Max-Q:
120 fps
100%
GeForce MX330:
21.6 [X] MSI Prestige 14 Intel Core i7-10510U 1.8GHz
GeForce MX330
min:
19 fps
fps
560%
GeForce RTX 2070 Super Mobile:
121 fps
542%
GeForce RTX 2080 Max-Q:
117 fps
GeForce RTX 2070 Super Mobile:
81 fps
GeForce RTX 2070 Super Mobile:
41.4 fps
100%
GeForce MX330:
20.8 [X] MSI Prestige 14 Intel Core i7-10510U 1.8GHz
GeForce MX330
min:
16 fps
fps
582%
GeForce RTX 2080 Max-Q:
121 fps
100%
GeForce MX330:
15.1 [X] MSI Prestige 14 Intel Core i7-10510U 1.8GHz
GeForce MX330
min:
12 fps
fps
728%
GeForce RTX 2070 Super Mobile:
110 fps
679%
GeForce RTX 2080 Max-Q:
102.6 fps
GeForce RTX 2070 Super Mobile:
73.1 fps
GeForce RTX 2080 Max-Q:
72.8 fps
GeForce RTX 2070 Super Mobile:
47.6 fps
GeForce RTX 2080 Max-Q:
45.6 fps
GeForce RTX 2070 Super Mobile:
38.1 fps
GeForce RTX 2070 Super Mobile:
24.8 fps
100%
GeForce MX330:
25.7 fps
463%
GeForce RTX 2070 Super Mobile:
119 fps
368%
GeForce RTX 2080 Max-Q:
94.5 fps
100%
GeForce MX330:
21.3 fps
535%
GeForce RTX 2070 Super Mobile:
114 fps
395%
GeForce RTX 2080 Max-Q:
84.2 fps
100%
GeForce MX330:
8.7 fps
1239%
GeForce RTX 2070 Super Mobile:
108 fps
944%
GeForce RTX 2080 Max-Q:
82.3 fps
GeForce RTX 2070 Super Mobile:
84 fps
GeForce RTX 2070 Super Mobile:
42.5 fps
100%
GeForce MX330:
43.1 fps
199%
GeForce RTX 2080 Max-Q:
85.6 fps
100%
GeForce MX330:
22.3 fps
471%
GeForce RTX 2070 Super Mobile:
105 fps
296%
GeForce RTX 2080 Max-Q:
66 fps
100%
GeForce MX330:
19.7 fps
492%
GeForce RTX 2070 Super Mobile:
97 fps
323%
GeForce RTX 2080 Max-Q:
63.6 fps
GeForce RTX 2070 Super Mobile:
92.4 fps
GeForce RTX 2080 Max-Q:
57.2 fps
GeForce RTX 2070 Super Mobile:
81.7 fps
GeForce RTX 2070 Super Mobile:
48.1 fps
100%
GeForce MX330:
42.5 fps
404%
GeForce RTX 2080 Max-Q:
171.5 fps
100%
GeForce MX330:
23.2 fps
608%
GeForce RTX 2070 Super Mobile:
141 fps
546%
GeForce RTX 2080 Max-Q:
126.7 fps
100%
GeForce MX330:
14.5 fps
924%
GeForce RTX 2070 Super Mobile:
134 fps
723%
GeForce RTX 2080 Max-Q:
104.9 fps
100%
GeForce MX330:
13.9 fps
770%
GeForce RTX 2070 Super Mobile:
107 fps
652%
GeForce RTX 2080 Max-Q:
90.6 fps
GeForce RTX 2070 Super Mobile:
75.3 fps
GeForce RTX 2070 Super Mobile:
41.6 fps
100%
GeForce MX330:
18.3 fps
1167%
GeForce RTX 2080 Max-Q:
213.5 fps
100%
GeForce MX330:
15.7 fps
1019%
GeForce RTX 2070 Super Mobile:
160 fps
1195%
GeForce RTX 2080 Max-Q:
187.6 fps
100%
GeForce MX330:
14.7 fps
810%
GeForce RTX 2070 Super Mobile:
119 fps
821%
GeForce RTX 2080 Max-Q:
120.7 fps
100%
GeForce MX330:
7.4 fps
1091%
GeForce RTX 2070 Super Mobile:
80.7 fps
1099%
GeForce RTX 2080 Max-Q:
81.3 fps
GeForce RTX 2070 Super Mobile:
70.2 fps
GeForce RTX 2070 Super Mobile:
47.2 fps
100%
GeForce MX330:
22 fps
477%
GeForce RTX 2080 Max-Q:
105 fps
100%
GeForce MX330:
11 fps
1045%
GeForce RTX 2070 Super Mobile:
115 fps
864%
GeForce RTX 2080 Max-Q:
95 fps
100%
GeForce MX330:
10 fps
1010%
GeForce RTX 2070 Super Mobile:
101 fps
920%
GeForce RTX 2080 Max-Q:
92 fps
1875%
GeForce RTX 2070 Super Mobile:
75 fps
1775%
GeForce RTX 2080 Max-Q:
71 fps
GeForce RTX 2070 Super Mobile:
55 fps
GeForce RTX 2070 Super Mobile:
32 fps
100%
GeForce MX330:
124 fps
173%
GeForce RTX 2080 Max-Q:
214.6 fps
100%
GeForce MX330:
72.1 fps
388%
GeForce RTX 2070 Super Mobile:
280 fps
289%
GeForce RTX 2080 Max-Q:
208.1 fps
100%
GeForce MX330:
22.3 fps
1197%
GeForce RTX 2070 Super Mobile:
267 fps
887%
GeForce RTX 2080 Max-Q:
197.7 fps
100%
GeForce MX330:
21.2 fps
1245%
GeForce RTX 2070 Super Mobile:
264 fps
930%
GeForce RTX 2080 Max-Q:
197.1 fps
GeForce RTX 2070 Super Mobile:
262 fps
GeForce RTX 2070 Super Mobile:
211 fps
100%
GeForce MX330:
45.4 fps
284%
GeForce RTX 2080 Max-Q:
128.8 fps
100%
GeForce MX330:
14.2 fps
894%
GeForce RTX 2070 Super Mobile:
127 fps
780%
GeForce RTX 2080 Max-Q:
110.8 fps
100%
GeForce MX330:
12.1 fps
761%
GeForce RTX 2070 Super Mobile:
92.1 fps
700%
GeForce RTX 2080 Max-Q:
84.7 fps
100%
GeForce MX330:
8.8 fps
802%
GeForce RTX 2070 Super Mobile:
70.6 fps
763%
GeForce RTX 2080 Max-Q:
67.1 fps
GeForce RTX 2070 Super Mobile:
49.8 fps
GeForce RTX 2070 Super Mobile:
26.8 fps
100%
GeForce MX330:
44.4 fps
522%
GeForce RTX 2080 Max-Q:
231.9 fps
100%
GeForce MX330:
13.9 fps
770%
GeForce RTX 2070 Super Mobile:
107 fps
668%
GeForce RTX 2080 Max-Q:
92.8 fps
100%
GeForce MX330:
9.7 fps
831%
GeForce RTX 2070 Super Mobile:
80.8 fps
740%
GeForce RTX 2080 Max-Q:
71.9 fps
GeForce RTX 2070 Super Mobile:
52.6 fps
GeForce RTX 2070 Super Mobile:
25.6 fps
100%
GeForce MX330:
59 73 ~ 66 fps
285%
GeForce RTX 2080 Max-Q:
188 fps
100%
GeForce MX330:
17 31 ~ 24 fps
846%
GeForce RTX 2070 Super Mobile:
203 fps
688%
GeForce RTX 2080 Max-Q:
165 fps
100%
GeForce MX330:
16 24 ~ 20 fps
890%
GeForce RTX 2070 Super Mobile:
178 fps
685%
GeForce RTX 2080 Max-Q:
137 fps
100%
GeForce MX330:
13 19 ~ 16 fps
1063%
GeForce RTX 2070 Super Mobile:
170 fps
713%
GeForce RTX 2080 Max-Q:
114 fps
GeForce RTX 2070 Super Mobile:
116 fps
GeForce RTX 2070 Super Mobile:
73 fps
100%
GeForce MX330:
52.9 fps
425%
GeForce RTX 2080 Max-Q:
224.8 [X] SCHENKER Key 16 Intel Core i7-8750H 2.2GHz
GeForce RTX 2080 Max-Q
min:
141 fps, max:
317 fps
fps
100%
GeForce MX330:
16.1 fps
783%
GeForce RTX 2080 Max-Q:
126.1 [X] SCHENKER Key 16 Intel Core i7-8750H 2.2GHz
GeForce RTX 2080 Max-Q
min:
89 fps, max:
177 fps
fps
GeForce RTX 2080 Max-Q:
88.8 [X] SCHENKER Key 16 Intel Core i7-8750H 2.2GHz
GeForce RTX 2080 Max-Q
min:
42 fps, max:
109 fps
fps
GeForce RTX 2080 Max-Q:
65.5 [X] SCHENKER Key 16 Intel Core i7-8750H 2.2GHz
GeForce RTX 2080 Max-Q
min:
27 fps, max:
79 fps
fps
100%
GeForce MX330:
41.1 fps
100%
GeForce MX330:
14.6 fps
979%
GeForce RTX 2070 Super Mobile:
143 fps
767%
GeForce RTX 2080 Max-Q:
111 112.2 ~ 112 fps
100%
GeForce MX330:
13 fps
931%
GeForce RTX 2070 Super Mobile:
121 fps
731%
GeForce RTX 2080 Max-Q:
93.5 96.1 ~ 95 fps
100%
GeForce MX330:
12.9 fps
922%
GeForce RTX 2070 Super Mobile:
119 fps
721%
GeForce RTX 2080 Max-Q:
91.9 93.3 ~ 93 fps
GeForce RTX 2070 Super Mobile:
74.2 fps
GeForce RTX 2070 Super Mobile:
36.7 fps
100%
GeForce MX330:
58.2 fps
169%
GeForce RTX 2080 Max-Q:
98.5 fps
100%
GeForce MX330:
11 fps
1055%
GeForce RTX 2070 Super Mobile:
116 fps
854%
GeForce RTX 2080 Max-Q:
93.9 fps
100%
GeForce MX330:
8.6 fps
1046%
GeForce RTX 2070 Super Mobile:
90.4 fps
899%
GeForce RTX 2080 Max-Q:
77.7 fps
100%
GeForce MX330:
6.1 fps
832%
GeForce RTX 2070 Super Mobile:
51 fps
672%
GeForce RTX 2080 Max-Q:
41.2 fps
GeForce RTX 2070 Super Mobile:
44 fps
GeForce RTX 2070 Super Mobile:
23.9 fps
100%
GeForce MX330:
50 fps
264%
GeForce RTX 2080 Max-Q:
132 fps
100%
GeForce MX330:
19 fps
789%
GeForce RTX 2070 Super Mobile:
150 fps
511%
GeForce RTX 2080 Max-Q:
97 fps
1550%
GeForce RTX 2070 Super Mobile:
124 fps
1113%
GeForce RTX 2080 Max-Q:
84 93 ~ 89 fps
1243%
GeForce RTX 2070 Super Mobile:
87 fps
1043%
GeForce RTX 2080 Max-Q:
69 77 ~ 73 fps
GeForce RTX 2070 Super Mobile:
61 fps
GeForce RTX 2070 Super Mobile:
32 fps
GeForce RTX 2080 Max-Q:
26 fps
100%
GeForce MX330:
94.5 fps
167%
GeForce RTX 2080 Max-Q:
157.8 fps
100%
GeForce MX330:
29.3 fps
720%
GeForce RTX 2070 Super Mobile:
211 fps
396%
GeForce RTX 2080 Max-Q:
116.1 fps
100%
GeForce MX330:
26.8 fps
664%
GeForce RTX 2070 Super Mobile:
178 fps
455%
GeForce RTX 2080 Max-Q:
101.1 143 ~ 122 fps
100%
GeForce MX330:
16.1 fps
607%
GeForce RTX 2070 Super Mobile:
97.7 fps
472%
GeForce RTX 2080 Max-Q:
66.3 85.1 ~ 76 fps
GeForce RTX 2070 Super Mobile:
72.4 fps
GeForce RTX 2080 Max-Q:
31.2 fps
GeForce RTX 2080 Max-Q:
84.5 fps
GeForce RTX 2080 Max-Q:
73.7 fps
GeForce RTX 2080 Max-Q:
72.1 86.1 ~ 79 fps
GeForce RTX 2080 Max-Q:
67.4 78.9 ~ 73 fps
GeForce RTX 2080 Max-Q:
26.4 fps
100%
GeForce MX330:
45 fps
242%
GeForce RTX 2080 Max-Q:
101 110 116 ~ 109 fps
100%
GeForce MX330:
24 fps
463%
GeForce RTX 2070 Super Mobile:
111 fps
392%
GeForce RTX 2080 Max-Q:
88 95 98 ~ 94 fps
100%
GeForce MX330:
15 fps
693%
GeForce RTX 2070 Super Mobile:
104 fps
600%
GeForce RTX 2080 Max-Q:
82 90 92 94 ~ 90 fps
100%
GeForce MX330:
14 fps
671%
GeForce RTX 2070 Super Mobile:
94 fps
579%
GeForce RTX 2080 Max-Q:
74 81 82 85 ~ 81 fps
GeForce RTX 2070 Super Mobile:
89 fps
GeForce RTX 2070 Super Mobile:
50 fps
GeForce RTX 2080 Max-Q:
36 fps
100%
GeForce MX330:
34.3 fps
100%
GeForce MX330:
13.3 fps
842%
GeForce RTX 2070 Super Mobile:
112 fps
100%
GeForce MX330:
10.4 fps
795%
GeForce RTX 2070 Super Mobile:
82.7 fps
100%
GeForce MX330:
7.8 fps
840%
GeForce RTX 2070 Super Mobile:
65.5 fps
731%
GeForce RTX 2080 Max-Q:
47.8 54 58.4 [X] Lenovo LEGION Y740 Intel Core i7-9750H 2.6GHz
GeForce RTX 2080 Max-Q
59 59 62 [X] Asus ROG GX701G Intel Core i7-9750H 2.6GHz
GeForce RTX 2080 Max-Q
~ 57 fps
GeForce RTX 2070 Super Mobile:
54.4 fps
GeForce RTX 2070 Super Mobile:
31.9 fps
GeForce RTX 2080 Max-Q:
20.9 fps
100%
GeForce MX330:
67.2 fps
214%
GeForce RTX 2080 Max-Q:
143.7 fps
100%
GeForce MX330:
26.5 fps
543%
GeForce RTX 2070 Super Mobile:
144 fps
517%
GeForce RTX 2080 Max-Q:
137.1 fps
100%
GeForce MX330:
22.5 fps
640%
GeForce RTX 2070 Super Mobile:
144 fps
538%
GeForce RTX 2080 Max-Q:
111.8 130 ~ 121 fps
100%
GeForce MX330:
19.4 fps
742%
GeForce RTX 2070 Super Mobile:
144 fps
613%
GeForce RTX 2080 Max-Q:
109.9 128 ~ 119 fps
GeForce RTX 2070 Super Mobile:
121 fps
GeForce RTX 2070 Super Mobile:
66.6 fps
GeForce RTX 2080 Max-Q:
36 fps
100%
GeForce MX330:
44.7 [X] MSI Prestige 14 Intel Core i7-10510U 1.8GHz
GeForce MX330
min:
41 fps
fps
100%
GeForce MX330:
27.4 [X] MSI Prestige 14 Intel Core i7-10510U 1.8GHz
GeForce MX330
min:
24 fps
fps
591%
GeForce RTX 2070 Super Mobile:
162 fps
507%
GeForce RTX 2080 Max-Q:
137 140 [X] Acer Triton 500 Intel Core i7-8750H 2.2GHz
GeForce RTX 2080 Max-Q
min:
128 fps
~ 139 fps
100%
GeForce MX330:
20.6 [X] MSI Prestige 14 Intel Core i7-10510U 1.8GHz
GeForce MX330
min:
18 fps
fps
578%
GeForce RTX 2070 Super Mobile:
119 fps
505%
GeForce RTX 2080 Max-Q:
103 104 [X] Acer Triton 500 Intel Core i7-8750H 2.2GHz
GeForce RTX 2080 Max-Q
min:
97 fps
~ 104 fps
100%
GeForce MX330:
18.2 [X] MSI Prestige 14 Intel Core i7-10510U 1.8GHz
GeForce MX330
min:
16 fps
fps
577%
GeForce RTX 2070 Super Mobile:
105 fps
549%
GeForce RTX 2080 Max-Q:
98.1 [X] Acer Triton 500 Intel Core i7-8750H 2.2GHz
GeForce RTX 2080 Max-Q
min:
89 fps
101 ~ 100 fps
GeForce RTX 2070 Super Mobile:
75 fps
GeForce RTX 2080 Max-Q:
67.6 [X] Acer Triton 500 Intel Core i7-8750H 2.2GHz
GeForce RTX 2080 Max-Q
min:
62 fps
69.9 ~ 69 fps
GeForce RTX 2070 Super Mobile:
41.2 fps
GeForce RTX 2080 Max-Q:
39.5 [X] Acer Triton 500 Intel Core i7-8750H 2.2GHz
GeForce RTX 2080 Max-Q
min:
36 fps
39.9 ~ 40 fps
100%
GeForce MX330:
112 [X] MSI Prestige 14 Intel Core i7-10510U 1.8GHz
GeForce MX330
min:
71 fps
fps
122%
GeForce RTX 2080 Max-Q:
137 fps
100%
GeForce MX330:
30.1 [X] MSI Prestige 14 Intel Core i7-10510U 1.8GHz
GeForce MX330
min:
25 fps
fps
551%
GeForce RTX 2070 Super Mobile:
166 fps
399%
GeForce RTX 2080 Max-Q:
103.5 126 [X] Acer Triton 500 Intel Core i7-8750H 2.2GHz
GeForce RTX 2080 Max-Q
min:
82 fps
130 ~ 120 fps
100%
GeForce MX330:
23.1 [X] MSI Prestige 14 Intel Core i7-10510U 1.8GHz
GeForce MX330
min:
20 fps
fps
610%
GeForce RTX 2070 Super Mobile:
141 fps
442%
GeForce RTX 2080 Max-Q:
84.5 [X] Gigabyte Aero 15-Y9 Single-Channel
Intel Core i9-8950HK 2.9GHz
GeForce RTX 2080 Max-Q
94.3 110 [X] Acer Triton 500 Intel Core i7-8750H 2.2GHz
GeForce RTX 2080 Max-Q
min:
77 fps
121 ~ 102 fps
100%
GeForce MX330:
20.5 [X] MSI Prestige 14 Intel Core i7-10510U 1.8GHz
GeForce MX330
min:
18 fps
fps
620%
GeForce RTX 2070 Super Mobile:
127 fps
463%
GeForce RTX 2080 Max-Q:
81.4 [X] Gigabyte Aero 15-Y9 Single-Channel
Intel Core i9-8950HK 2.9GHz
GeForce RTX 2080 Max-Q
84.8 103 [X] Acer Triton 500 Intel Core i7-8750H 2.2GHz
GeForce RTX 2080 Max-Q
min:
74 fps
112 ~ 95 fps
GeForce RTX 2070 Super Mobile:
88.3 fps
GeForce RTX 2080 Max-Q:
75.2 [X] Acer Triton 500 Intel Core i7-8750H 2.2GHz
GeForce RTX 2080 Max-Q
min:
64 fps
82.6 ~ 79 fps
GeForce RTX 2070 Super Mobile:
44 fps
GeForce RTX 2080 Max-Q:
29.8 37.8 [X] Acer Triton 500 Intel Core i7-8750H 2.2GHz
GeForce RTX 2080 Max-Q
min:
32 fps
42.7 ~ 37 fps
100%
GeForce MX330:
59.4 [X] MSI Prestige 14 Intel Core i7-10510U 1.8GHz
GeForce MX330
min:
41 fps
fps
100%
GeForce MX330:
29.4 [X] MSI Prestige 14 Intel Core i7-10510U 1.8GHz
GeForce MX330
min:
22 fps
fps
565%
GeForce RTX 2070 Super Mobile:
166 fps
466%
GeForce RTX 2080 Max-Q:
131 [X] Acer Triton 500 Intel Core i7-8750H 2.2GHz
GeForce RTX 2080 Max-Q
min:
102 fps
143 ~ 137 fps
100%
GeForce MX330:
23.2 [X] MSI Prestige 14 Intel Core i7-10510U 1.8GHz
GeForce MX330
min:
17 fps
fps
655%
GeForce RTX 2070 Super Mobile:
152 fps
543%
GeForce RTX 2080 Max-Q:
121 [X] Acer Triton 500 Intel Core i7-8750H 2.2GHz
GeForce RTX 2080 Max-Q
min:
96 fps
130 ~ 126 fps
100%
GeForce MX330:
18.7 [X] MSI Prestige 14 Intel Core i7-10510U 1.8GHz
GeForce MX330
min:
11 fps
fps
754%
GeForce RTX 2070 Super Mobile:
141 fps
626%
GeForce RTX 2080 Max-Q:
112 116 [X] Acer Triton 500 Intel Core i7-8750H 2.2GHz
GeForce RTX 2080 Max-Q
min:
88 fps
122 ~ 117 fps
GeForce RTX 2070 Super Mobile:
110 fps
GeForce RTX 2080 Max-Q:
91.2 91.6 [X] Acer Triton 500 Intel Core i7-8750H 2.2GHz
GeForce RTX 2080 Max-Q
min:
72 fps
98.2 ~ 94 fps
GeForce RTX 2070 Super Mobile:
62.7 fps
GeForce RTX 2080 Max-Q:
52.4 52.5 [X] Acer Triton 500 Intel Core i7-8750H 2.2GHz
GeForce RTX 2080 Max-Q
min:
42 fps
57.8 ~ 54 fps
100%
GeForce MX330:
164 [X] MSI Prestige 14 Intel Core i7-10510U 1.8GHz
GeForce MX330
min:
136 fps
fps
100%
GeForce MX330:
62.2 [X] MSI Prestige 14 Intel Core i7-10510U 1.8GHz
GeForce MX330
min:
52 fps
fps
246%
GeForce RTX 2080 Max-Q:
144 [X] Acer Triton 500 Intel Core i7-8750H 2.2GHz
GeForce RTX 2080 Max-Q
min:
123 fps
161 ~ 153 fps
100%
GeForce MX330:
37.5 [X] MSI Prestige 14 Intel Core i7-10510U 1.8GHz
GeForce MX330
min:
31 fps
fps
363%
GeForce RTX 2080 Max-Q:
130 [X] Acer Triton 500 Intel Core i7-8750H 2.2GHz
GeForce RTX 2080 Max-Q
min:
112 fps
141 ~ 136 fps
100%
GeForce MX330:
28.3 [X] MSI Prestige 14 Intel Core i7-10510U 1.8GHz
GeForce MX330
min:
23 fps
fps
445%
GeForce RTX 2080 Max-Q:
121 [X] Acer Triton 500 Intel Core i7-8750H 2.2GHz
GeForce RTX 2080 Max-Q
min:
101 fps
131 ~ 126 fps
GeForce RTX 2080 Max-Q:
107 [X] Acer Triton 500 Intel Core i7-8750H 2.2GHz
GeForce RTX 2080 Max-Q
min:
89 fps
113 ~ 110 fps
100%
GeForce MX330:
37.1 [X] MSI Prestige 14 Intel Core i7-10510U 1.8GHz
GeForce MX330
min:
30 fps
fps
100%
GeForce MX330:
23.7 [X] MSI Prestige 14 Intel Core i7-10510U 1.8GHz
GeForce MX330
min:
20 fps
fps
417%
GeForce RTX 2070 Super Mobile:
98.8 fps
329%
GeForce RTX 2080 Max-Q:
77.9 [X] Acer Triton 500 Intel Core i7-8750H 2.2GHz
GeForce RTX 2080 Max-Q
min:
59 fps
78.8 ~ 78 fps
100%
GeForce MX330:
13.3 [X] MSI Prestige 14 Intel Core i7-10510U 1.8GHz
GeForce MX330
min:
9 fps
fps
674%
GeForce RTX 2070 Super Mobile:
89.7 fps
534%
GeForce RTX 2080 Max-Q:
70.3 [X] Acer Triton 500 Intel Core i7-8750H 2.2GHz
GeForce RTX 2080 Max-Q
min:
51 fps
70.9 ~ 71 fps
100%
GeForce MX330:
11 [X] MSI Prestige 14 Intel Core i7-10510U 1.8GHz
GeForce MX330
min:
5 fps
fps
750%
GeForce RTX 2070 Super Mobile:
82.5 fps
618%
GeForce RTX 2080 Max-Q:
67.1 [X] Acer Triton 500 Intel Core i7-8750H 2.2GHz
GeForce RTX 2080 Max-Q
min:
45 fps
69.1 ~ 68 fps
GeForce RTX 2070 Super Mobile:
78.8 fps
GeForce RTX 2080 Max-Q:
65.3 [X] Acer Triton 500 Intel Core i7-8750H 2.2GHz
GeForce RTX 2080 Max-Q
min:
44 fps
66 ~ 66 fps
GeForce RTX 2070 Super Mobile:
46.4 fps
GeForce RTX 2080 Max-Q:
38.2 [X] Acer Triton 500 Intel Core i7-8750H 2.2GHz
GeForce RTX 2080 Max-Q
min:
32 fps
fps
GeForce RTX 2080 Max-Q:
140 [X] Asus GX701GX (Optimus-Mode) Intel Core i7-8750H 2.2GHz
GeForce RTX 2080 Max-Q
min:
111 fps
142 [X] Acer Triton 500 Intel Core i7-8750H 2.2GHz
GeForce RTX 2080 Max-Q
min:
102 fps
151 ~ 144 fps
GeForce RTX 2080 Max-Q:
128 [X] Asus GX701GX (Optimus-Mode) Intel Core i7-8750H 2.2GHz
GeForce RTX 2080 Max-Q
min:
106 fps
132 [X] Acer Triton 500 Intel Core i7-8750H 2.2GHz
GeForce RTX 2080 Max-Q
min:
99 fps
138 ~ 133 fps
GeForce RTX 2080 Max-Q:
125 [X] Asus GX701GX (Optimus-Mode) Intel Core i7-8750H 2.2GHz
GeForce RTX 2080 Max-Q
min:
101 fps
128 [X] Acer Triton 500 Intel Core i7-8750H 2.2GHz
GeForce RTX 2080 Max-Q
min:
94 fps
131 ~ 128 fps
GeForce RTX 2080 Max-Q:
83.8 [X] Acer Triton 500 Intel Core i7-8750H 2.2GHz
GeForce RTX 2080 Max-Q
min:
62 fps
91.4 ~ 88 fps
GeForce RTX 2080 Max-Q:
40.4 [X] Acer Triton 500 Intel Core i7-8750H 2.2GHz
GeForce RTX 2080 Max-Q
min:
30 fps
41.6 ~ 41 fps
100%
GeForce MX330:
40 [X] MSI Prestige 14 Intel Core i7-10510U 1.8GHz
GeForce MX330
min:
22 fps
fps
100%
GeForce MX330:
19 [X] MSI Prestige 14 Intel Core i7-10510U 1.8GHz
GeForce MX330
min:
12 fps
fps
547%
GeForce RTX 2070 Super Mobile:
104 fps
416%
GeForce RTX 2080 Max-Q:
68 [X] Acer Triton 500 Intel Core i7-8750H 2.2GHz
GeForce RTX 2080 Max-Q
min:
39 fps
81 [X] Asus GX701GX (Optimus-Mode) Intel Core i7-8750H 2.2GHz
GeForce RTX 2080 Max-Q
87 ~ 79 fps
100%
GeForce MX330:
14 [X] MSI Prestige 14 Intel Core i7-10510U 1.8GHz
GeForce MX330
min:
6 fps
fps
643%
GeForce RTX 2070 Super Mobile:
90 fps
507%
GeForce RTX 2080 Max-Q:
64 [X] Acer Triton 500 Intel Core i7-8750H 2.2GHz
GeForce RTX 2080 Max-Q
min:
38 fps
72 [X] Asus GX701GX (Optimus-Mode) Intel Core i7-8750H 2.2GHz
GeForce RTX 2080 Max-Q
76 ~ 71 fps
100%
GeForce MX330:
7 [X] MSI Prestige 14 Intel Core i7-10510U 1.8GHz
GeForce MX330
min:
4 fps
fps
900%
GeForce RTX 2070 Super Mobile:
63 fps
800%
GeForce RTX 2080 Max-Q:
53 [X] Acer Triton 500 Intel Core i7-8750H 2.2GHz
GeForce RTX 2080 Max-Q
min:
27 fps
56 [X] Asus GX701GX (Optimus-Mode) Intel Core i7-8750H 2.2GHz
GeForce RTX 2080 Max-Q
59 ~ 56 fps
GeForce RTX 2070 Super Mobile:
56 fps
GeForce RTX 2080 Max-Q:
46 [X] Acer Triton 500 Intel Core i7-8750H 2.2GHz
GeForce RTX 2080 Max-Q
min:
19 fps
48 ~ 47 fps
GeForce RTX 2070 Super Mobile:
36 fps
GeForce RTX 2080 Max-Q:
30 [X] Acer Triton 500 Intel Core i7-8750H 2.2GHz
GeForce RTX 2080 Max-Q
min:
15 fps
32 ~ 31 fps
100%
GeForce MX330:
62 fps
100%
GeForce MX330:
31 fps
100%
GeForce MX330:
22 fps
100%
GeForce MX330:
16 fps
GeForce RTX 2080 Max-Q:
203 [X] Asus GX701GX (Optimus-Mode) Intel Core i7-8750H 2.2GHz
GeForce RTX 2080 Max-Q
min:
189 fps
271 272 [X] Acer Triton 500 Intel Core i7-8750H 2.2GHz
GeForce RTX 2080 Max-Q
min:
252 fps
~ 249 fps
GeForce RTX 2080 Max-Q:
186 [X] Asus GX701GX (Optimus-Mode) Intel Core i7-8750H 2.2GHz
GeForce RTX 2080 Max-Q
min:
177 fps
223 [X] Acer Triton 500 Intel Core i7-8750H 2.2GHz
GeForce RTX 2080 Max-Q
min:
196 fps
254 ~ 221 fps
GeForce RTX 2080 Max-Q:
182 [X] Asus GX701GX (Optimus-Mode) Intel Core i7-8750H 2.2GHz
GeForce RTX 2080 Max-Q
min:
174 fps
219 [X] Acer Triton 500 Intel Core i7-8750H 2.2GHz
GeForce RTX 2080 Max-Q
min:
192 fps
248 ~ 216 fps
GeForce RTX 2080 Max-Q:
211 [X] Acer Triton 500 Intel Core i7-8750H 2.2GHz
GeForce RTX 2080 Max-Q
min:
187 fps
237 ~ 224 fps
GeForce RTX 2080 Max-Q:
161 [X] Acer Triton 500 Intel Core i7-8750H 2.2GHz
GeForce RTX 2080 Max-Q
min:
135 fps
188 ~ 175 fps
298%
GeForce RTX 2070 Super Mobile:
121 153 ~ 137 fps
694%
GeForce RTX 2070 Super Mobile:
110 120 123 ~ 118 fps
576%
GeForce RTX 2080 Max-Q:
80 [X] Acer Triton 500 Intel Core i7-8750H 2.2GHz
GeForce RTX 2080 Max-Q
min:
43 fps
84 91 102 103 110 118 ~ 98 fps
100%
GeForce MX330:
10 12 ~ 11 fps
1027%
GeForce RTX 2070 Super Mobile:
107 115 118 ~ 113 fps
855%
GeForce RTX 2080 Max-Q:
78 [X] Acer Triton 500 Intel Core i7-8750H 2.2GHz
GeForce RTX 2080 Max-Q
min:
42 fps
82 89 97 99 105 111 ~ 94 fps
100%
GeForce MX330:
8 10 ~ 9 fps
1156%
GeForce RTX 2070 Super Mobile:
100 104 108 ~ 104 fps
967%
GeForce RTX 2080 Max-Q:
71 [X] Acer Triton 500 Intel Core i7-8750H 2.2GHz
GeForce RTX 2080 Max-Q
min:
39 fps
75 78 84 87 94 99 105 ~ 87 fps
GeForce RTX 2070 Super Mobile:
73 fps
GeForce RTX 2080 Max-Q:
57 [X] Acer Triton 500 Intel Core i7-8750H 2.2GHz
GeForce RTX 2080 Max-Q
min:
37 fps
58 61 ~ 59 fps
GeForce RTX 2070 Super Mobile:
37 fps
GeForce RTX 2080 Max-Q:
33 33 [X] Acer Triton 500 Intel Core i7-8750H 2.2GHz
GeForce RTX 2080 Max-Q
min:
17 fps
37 40 ~ 36 fps
GeForce RTX 2080 Max-Q:
169 178 [X] Acer Triton 500 Intel Core i7-8750H 2.2GHz
GeForce RTX 2080 Max-Q
min:
112 fps
~ 174 fps
GeForce RTX 2080 Max-Q:
130 136 [X] Acer Triton 500 Intel Core i7-8750H 2.2GHz
GeForce RTX 2080 Max-Q
min:
106 fps
~ 133 fps
GeForce RTX 2080 Max-Q:
102 [X] Acer Triton 500 Intel Core i7-8750H 2.2GHz
GeForce RTX 2080 Max-Q
min:
82 fps
102 ~ 102 fps
GeForce RTX 2080 Max-Q:
86 [X] Acer Triton 500 Intel Core i7-8750H 2.2GHz
GeForce RTX 2080 Max-Q
min:
60 fps
87 ~ 87 fps
GeForce RTX 2080 Max-Q:
51 [X] Acer Triton 500 Intel Core i7-8750H 2.2GHz
GeForce RTX 2080 Max-Q
min:
47 fps
56 ~ 54 fps
100%
GeForce MX330:
47.6 [X] MSI Prestige 14 Intel Core i7-10510U 1.8GHz
GeForce MX330
min:
39 fps
fps
100%
GeForce MX330:
19.7 [X] MSI Prestige 14 Intel Core i7-10510U 1.8GHz
GeForce MX330
min:
17 fps
fps
660%
GeForce RTX 2070 Super Mobile:
130 fps
609%
GeForce RTX 2080 Max-Q:
117 [X] Acer Triton 500 Intel Core i7-8750H 2.2GHz
GeForce RTX 2080 Max-Q
min:
94 fps
123 ~ 120 fps
100%
GeForce MX330:
16.8 [X] MSI Prestige 14 Intel Core i7-10510U 1.8GHz
GeForce MX330
min:
14 fps
fps
714%
GeForce RTX 2070 Super Mobile:
120 fps
643%
GeForce RTX 2080 Max-Q:
105 [X] Acer Triton 500 Intel Core i7-8750H 2.2GHz
GeForce RTX 2080 Max-Q
min:
77 fps
111 ~ 108 fps
100%
GeForce MX330:
13.3 [X] MSI Prestige 14 Intel Core i7-10510U 1.8GHz
GeForce MX330
min:
11 fps
fps
744%
GeForce RTX 2070 Super Mobile:
98.9 fps
662%
GeForce RTX 2080 Max-Q:
84.8 [X] Acer Triton 500 Intel Core i7-8750H 2.2GHz
GeForce RTX 2080 Max-Q
min:
68 fps
90.9 ~ 88 fps
GeForce RTX 2070 Super Mobile:
63.9 fps
GeForce RTX 2080 Max-Q:
52.5 [X] Acer Triton 500 Intel Core i7-8750H 2.2GHz
GeForce RTX 2080 Max-Q
min:
45 fps
58.4 ~ 55 fps
GeForce RTX 2070 Super Mobile:
32.1 fps
GeForce RTX 2080 Max-Q:
27.1 [X] Acer Triton 500 Intel Core i7-8750H 2.2GHz
GeForce RTX 2080 Max-Q
min:
23 fps
29.7 ~ 28 fps
GeForce RTX 2080 Max-Q:
60 [X] Acer Triton 500 Intel Core i7-8750H 2.2GHz
GeForce RTX 2080 Max-Q
min:
59 fps
60 ~ 60 fps
GeForce RTX 2080 Max-Q:
60 [X] Acer Triton 500 Intel Core i7-8750H 2.2GHz
GeForce RTX 2080 Max-Q
min:
59 fps
60 ~ 60 fps
GeForce RTX 2080 Max-Q:
60 [X] Acer Triton 500 Intel Core i7-8750H 2.2GHz
GeForce RTX 2080 Max-Q
min:
58 fps
60 ~ 60 fps
GeForce RTX 2080 Max-Q:
60 [X] Acer Triton 500 Intel Core i7-8750H 2.2GHz
GeForce RTX 2080 Max-Q
min:
58 fps
60 ~ 60 fps
GeForce RTX 2080 Max-Q:
37.4 [X] Acer Triton 500 Intel Core i7-8750H 2.2GHz
GeForce RTX 2080 Max-Q
min:
34 fps
39.9 ~ 39 fps
100%
GeForce MX330:
47 fps
255%
GeForce RTX 2080 Max-Q:
114 122 123 ~ 120 fps
100%
GeForce MX330:
23 fps
452%
GeForce RTX 2080 Max-Q:
94 101 [X] Asus GX701GX (Optimus-Mode) Intel Core i7-8750H 2.2GHz
GeForce RTX 2080 Max-Q
min:
83 fps
103 107 [X] Acer Triton 500 Intel Core i7-8750H 2.2GHz
GeForce RTX 2080 Max-Q
min:
87 fps
109 109 ~ 104 fps
100%
GeForce MX330:
15 fps
620%
GeForce RTX 2080 Max-Q:
68 [X] Gigabyte Aero 15-Y9 Single-Channel
Intel Core i9-8950HK 2.9GHz
GeForce RTX 2080 Max-Q
88 97 [X] Asus GX701GX (Optimus-Mode) Intel Core i7-8750H 2.2GHz
GeForce RTX 2080 Max-Q
min:
75 fps
97 99 [X] Acer Triton 500 Intel Core i7-8750H 2.2GHz
GeForce RTX 2080 Max-Q
min:
82 fps
99 106 ~ 93 fps
100%
GeForce MX330:
14 fps
750%
GeForce RTX 2070 Super Mobile:
98 112 ~ 105 fps
636%
GeForce RTX 2080 Max-Q:
66 [X] Gigabyte Aero 15-Y9 Single-Channel
Intel Core i9-8950HK 2.9GHz
GeForce RTX 2080 Max-Q
84 92 [X] Asus GX701GX (Optimus-Mode) Intel Core i7-8750H 2.2GHz
GeForce RTX 2080 Max-Q
min:
74 fps
93 [X] Acer Triton 500 Intel Core i7-8750H 2.2GHz
GeForce RTX 2080 Max-Q
min:
73 fps
93 95 100 ~ 89 fps
GeForce RTX 2080 Max-Q:
72 [X] Acer Triton 500 Intel Core i7-8750H 2.2GHz
GeForce RTX 2080 Max-Q
min:
58 fps
79 ~ 76 fps
GeForce RTX 2080 Max-Q:
34 40 [X] Acer Triton 500 Intel Core i7-8750H 2.2GHz
GeForce RTX 2080 Max-Q
min:
35 fps
44 ~ 39 fps
190%
GeForce RTX 2070 Super Mobile:
107 113 117 118 ~ 114 fps
160%
GeForce RTX 2080 Max-Q:
82.9 [X] Gigabyte Aero 15-Y9 Single-Channel
Intel Core i9-8950HK 2.9GHz
GeForce RTX 2080 Max-Q
91 101.9 108 ~ 96 fps
165%
GeForce RTX 2080 Max-Q:
68.9 [X] Gigabyte Aero 15-Y9 Single-Channel
Intel Core i9-8950HK 2.9GHz
GeForce RTX 2080 Max-Q
80.5 89.2 97.4 ~ 84 fps
159%
GeForce RTX 2080 Max-Q:
55.8 [X] Gigabyte Aero 15-Y9 Single-Channel
Intel Core i9-8950HK 2.9GHz
GeForce RTX 2080 Max-Q
67.2 74.8 81.6 ~ 70 fps
210%
GeForce RTX 2080 Max-Q:
36.5 [X] Gigabyte Aero 15-Y9 Single-Channel
Intel Core i9-8950HK 2.9GHz
GeForce RTX 2080 Max-Q
51.8 ~ 44 fps
100%
GeForce MX330:
49.8 [X] MSI Prestige 14 Intel Core i7-10510U 1.8GHz
GeForce MX330
min:
39 fps
fps
100%
GeForce MX330:
21.3 [X] MSI Prestige 14 Intel Core i7-10510U 1.8GHz
GeForce MX330
min:
16 fps
fps
685%
GeForce RTX 2070 Super Mobile:
146 fps
549%
GeForce RTX 2080 Max-Q:
115 118 [X] Acer Triton 500 Intel Core i7-8750H 2.2GHz
GeForce RTX 2080 Max-Q
min:
96 fps
~ 117 fps
100%
GeForce MX330:
18.3 [X] MSI Prestige 14 Intel Core i7-10510U 1.8GHz
GeForce MX330
min:
14 fps
fps
650%
GeForce RTX 2070 Super Mobile:
119 fps
492%
GeForce RTX 2080 Max-Q:
89.5 90.5 [X] Acer Triton 500 Intel Core i7-8750H 2.2GHz
GeForce RTX 2080 Max-Q
min:
66 fps
~ 90 fps
100%
GeForce MX330:
12.3 [X] MSI Prestige 14 Intel Core i7-10510U 1.8GHz
GeForce MX330
min:
9 fps
fps
671%
GeForce RTX 2070 Super Mobile:
82.5 fps
545%
GeForce RTX 2080 Max-Q:
64.9 [X] Acer Triton 500 Intel Core i7-8750H 2.2GHz
GeForce RTX 2080 Max-Q
min:
42 fps
68.4 ~ 67 fps
GeForce RTX 2070 Super Mobile:
59.7 fps
GeForce RTX 2080 Max-Q:
50.2 52.2 [X] Acer Triton 500 Intel Core i7-8750H 2.2GHz
GeForce RTX 2080 Max-Q
min:
41 fps
~ 51 fps
GeForce RTX 2070 Super Mobile:
31.1 fps
GeForce RTX 2080 Max-Q:
26.7 [X] Acer Triton 500 Intel Core i7-8750H 2.2GHz
GeForce RTX 2080 Max-Q
min:
23 fps
27.5 ~ 27 fps
100%
GeForce MX330:
37.1 [X] MSI Prestige 14 Intel Core i7-10510U 1.8GHz
GeForce MX330
min:
12 fps
fps
100%
GeForce MX330:
18 [X] MSI Prestige 14 Intel Core i7-10510U 1.8GHz
GeForce MX330
min:
10 fps
fps
672%
GeForce RTX 2070 Super Mobile:
121 fps
572%
GeForce RTX 2080 Max-Q:
100.1 100.7 103 [X] Acer Triton 500 Intel Core i7-8750H 2.2GHz
GeForce RTX 2080 Max-Q
min:
52 fps
103 [X] Asus GX701GX (Optimus-Mode) Intel Core i7-8750H 2.2GHz
GeForce RTX 2080 Max-Q
min:
50 fps
106 ~ 103 fps
100%
GeForce MX330:
11.2 [X] MSI Prestige 14 Intel Core i7-10510U 1.8GHz
GeForce MX330
min:
5 fps
fps
759%
GeForce RTX 2070 Super Mobile:
79.7 91.1 ~ 85 fps
696%
GeForce RTX 2080 Max-Q:
74 75.9 77.3 [X] Acer Triton 500 Intel Core i7-8750H 2.2GHz
GeForce RTX 2080 Max-Q
min:
42 fps
79.7 [X] Asus GX701GX (Optimus-Mode) Intel Core i7-8750H 2.2GHz
GeForce RTX 2080 Max-Q
min:
41 fps
81.4 ~ 78 fps
GeForce RTX 2070 Super Mobile:
37.7 fps
GeForce RTX 2080 Max-Q:
32.7 [X] Acer Triton 500 Intel Core i7-8750H 2.2GHz
GeForce RTX 2080 Max-Q
min:
20 fps
35.9 ~ 34 fps
100%
GeForce MX330:
95 [X] MSI Prestige 14 Intel Core i7-10510U 1.8GHz
GeForce MX330
min:
72 fps
fps
100%
GeForce MX330:
63.3 [X] MSI Prestige 14 Intel Core i7-10510U 1.8GHz
GeForce MX330
min:
28 fps
fps
259%
GeForce RTX 2070 Super Mobile:
164 fps
226%
GeForce RTX 2080 Max-Q:
139 [X] Asus GX701GX (Optimus-Mode) Intel Core i7-8750H 2.2GHz
GeForce RTX 2080 Max-Q
min:
103 fps
143 147 [X] Acer Triton 500 Intel Core i7-8750H 2.2GHz
GeForce RTX 2080 Max-Q
min:
101 fps
~ 143 fps
100%
GeForce MX330:
33.7 [X] MSI Prestige 14 Intel Core i7-10510U 1.8GHz
GeForce MX330
min:
26 fps
fps
463%
GeForce RTX 2070 Super Mobile:
156 fps
401%
GeForce RTX 2080 Max-Q:
128 [X] Asus GX701GX (Optimus-Mode) Intel Core i7-8750H 2.2GHz
GeForce RTX 2080 Max-Q
min:
99 fps
138 140 [X] Acer Triton 500 Intel Core i7-8750H 2.2GHz
GeForce RTX 2080 Max-Q
min:
97 fps
~ 135 fps
100%
GeForce MX330:
21 [X] MSI Prestige 14 Intel Core i7-10510U 1.8GHz
GeForce MX330
min:
16 fps
fps
614%
GeForce RTX 2070 Super Mobile:
129 fps
590%
GeForce RTX 2080 Max-Q:
116 [X] Asus GX701GX (Optimus-Mode) Intel Core i7-8750H 2.2GHz
GeForce RTX 2080 Max-Q
min:
98 fps
121 [X] Acer Triton 500 Intel Core i7-8750H 2.2GHz
GeForce RTX 2080 Max-Q
min:
90 fps
136 ~ 124 fps
GeForce RTX 2070 Super Mobile:
93.4 fps
GeForce RTX 2080 Max-Q:
97.7 [X] Acer Triton 500 Intel Core i7-8750H 2.2GHz
GeForce RTX 2080 Max-Q
min:
64 fps
105 ~ 101 fps
GeForce RTX 2070 Super Mobile:
47.9 fps
GeForce RTX 2080 Max-Q:
46.7 [X] Acer Triton 500 Intel Core i7-8750H 2.2GHz
GeForce RTX 2080 Max-Q
min:
42 fps
50.4 ~ 49 fps
GeForce RTX 2080 Max-Q:
143 [X] Asus GX701GX (Optimus-Mode) Intel Core i7-8750H 2.2GHz
GeForce RTX 2080 Max-Q
min:
121 fps
145 160 [X] Acer Triton 500 Intel Core i7-8750H 2.2GHz
GeForce RTX 2080 Max-Q
min:
141 fps
~ 149 fps
GeForce RTX 2080 Max-Q:
129 [X] Asus GX701GX (Optimus-Mode) Intel Core i7-8750H 2.2GHz
GeForce RTX 2080 Max-Q
min:
108 fps
131 140 [X] Acer Triton 500 Intel Core i7-8750H 2.2GHz
GeForce RTX 2080 Max-Q
min:
112 fps
~ 133 fps
GeForce RTX 2080 Max-Q:
110 [X] Acer Triton 500 Intel Core i7-8750H 2.2GHz
GeForce RTX 2080 Max-Q
min:
103 fps
111 [X] Asus GX701GX (Optimus-Mode) Intel Core i7-8750H 2.2GHz
GeForce RTX 2080 Max-Q
min:
98 fps
117 ~ 113 fps
GeForce RTX 2080 Max-Q:
76.5 [X] Acer Triton 500 Intel Core i7-8750H 2.2GHz
GeForce RTX 2080 Max-Q
min:
70 fps
80.9 ~ 79 fps
GeForce RTX 2080 Max-Q:
39.3 [X] Acer Triton 500 Intel Core i7-8750H 2.2GHz
GeForce RTX 2080 Max-Q
min:
36 fps
42.7 ~ 41 fps
GeForce RTX 2080 Max-Q:
111 [X] Acer Triton 500 Intel Core i7-8750H 2.2GHz
GeForce RTX 2080 Max-Q
min:
86 fps
118 [X] Asus GX701GX (Optimus-Mode) Intel Core i7-8750H 2.2GHz
GeForce RTX 2080 Max-Q
min:
89 fps
127 ~ 119 fps
GeForce RTX 2080 Max-Q:
108 [X] Acer Triton 500 Intel Core i7-8750H 2.2GHz
GeForce RTX 2080 Max-Q
min:
84 fps
112 [X] Asus GX701GX (Optimus-Mode) Intel Core i7-8750H 2.2GHz
GeForce RTX 2080 Max-Q
min:
88 fps
120 ~ 113 fps
GeForce RTX 2080 Max-Q:
104 [X] Acer Triton 500 Intel Core i7-8750H 2.2GHz
GeForce RTX 2080 Max-Q
min:
79 fps
111 [X] Asus GX701GX (Optimus-Mode) Intel Core i7-8750H 2.2GHz
GeForce RTX 2080 Max-Q
min:
87 fps
115 ~ 110 fps
GeForce RTX 2080 Max-Q:
88.2 [X] Acer Triton 500 Intel Core i7-8750H 2.2GHz
GeForce RTX 2080 Max-Q
min:
66 fps
95.6 ~ 92 fps
GeForce RTX 2080 Max-Q:
47.2 [X] Acer Triton 500 Intel Core i7-8750H 2.2GHz
GeForce RTX 2080 Max-Q
min:
34 fps
54.3 ~ 51 fps
GeForce RTX 2080 Max-Q:
82 fps
GeForce RTX 2080 Max-Q:
65 80 ~ 73 fps
GeForce RTX 2080 Max-Q:
62 69 ~ 66 fps
GeForce RTX 2080 Max-Q:
61 fps
GeForce RTX 2080 Max-Q:
39 fps
GeForce RTX 2080 Max-Q:
117 120 [X] Acer Triton 500 Intel Core i7-8750H 2.2GHz
GeForce RTX 2080 Max-Q
min:
117 fps
~ 119 fps
GeForce RTX 2080 Max-Q:
112 [X] Acer Triton 500 Intel Core i7-8750H 2.2GHz
GeForce RTX 2080 Max-Q
min:
95 fps
115 ~ 114 fps
GeForce RTX 2080 Max-Q:
92.7 [X] Acer Triton 500 Intel Core i7-8750H 2.2GHz
GeForce RTX 2080 Max-Q
min:
86 fps
99 ~ 96 fps
GeForce RTX 2080 Max-Q:
63.2 [X] Acer Triton 500 Intel Core i7-8750H 2.2GHz
GeForce RTX 2080 Max-Q
min:
59 fps
68.1 ~ 66 fps
GeForce RTX 2080 Max-Q:
33 [X] Acer Triton 500 Intel Core i7-8750H 2.2GHz
GeForce RTX 2080 Max-Q
min:
31 fps
35.7 ~ 34 fps
GeForce RTX 2080 Max-Q:
150 [X] Acer Triton 500 Intel Core i7-8750H 2.2GHz
GeForce RTX 2080 Max-Q
min:
33 fps
157 ~ 154 fps
GeForce RTX 2080 Max-Q:
119 [X] Acer Triton 500 Intel Core i7-8750H 2.2GHz
GeForce RTX 2080 Max-Q
min:
32 fps
125 ~ 122 fps
GeForce RTX 2080 Max-Q:
93 [X] Acer Triton 500 Intel Core i7-8750H 2.2GHz
GeForce RTX 2080 Max-Q
min:
30 fps
99 ~ 96 fps
GeForce RTX 2080 Max-Q:
40 [X] Acer Triton 500 Intel Core i7-8750H 2.2GHz
GeForce RTX 2080 Max-Q
min:
22 fps
44 ~ 42 fps
GeForce RTX 2080 Max-Q:
160.9 fps
GeForce RTX 2080 Max-Q:
87.9 fps
GeForce RTX 2080 Max-Q:
63.5 fps
GeForce RTX 2080 Max-Q:
43.9 fps
GeForce RTX 2080 Max-Q:
190 [X] Acer Triton 500 Intel Core i7-8750H 2.2GHz
GeForce RTX 2080 Max-Q
min:
133 fps
207 ~ 199 fps
GeForce RTX 2080 Max-Q:
174 [X] Acer Triton 500 Intel Core i7-8750H 2.2GHz
GeForce RTX 2080 Max-Q
min:
130 fps
175 ~ 175 fps
GeForce RTX 2080 Max-Q:
133 [X] Acer Triton 500 Intel Core i7-8750H 2.2GHz
GeForce RTX 2080 Max-Q
min:
106 fps
139 ~ 136 fps
GeForce RTX 2080 Max-Q:
48.4 [X] Acer Triton 500 Intel Core i7-8750H 2.2GHz
GeForce RTX 2080 Max-Q
min:
37 fps
51.5 ~ 50 fps
GeForce RTX 2080 Max-Q:
212 [X] Acer Triton 500 Intel Core i7-8750H 2.2GHz
GeForce RTX 2080 Max-Q
min:
178 fps
225 ~ 219 fps
GeForce RTX 2080 Max-Q:
150 164 [X] Acer Triton 500 Intel Core i7-8750H 2.2GHz
GeForce RTX 2080 Max-Q
min:
109 fps
~ 157 fps
GeForce RTX 2080 Max-Q:
102 105 [X] Acer Triton 500 Intel Core i7-8750H 2.2GHz
GeForce RTX 2080 Max-Q
min:
82 fps
~ 104 fps
100%
GeForce MX330:
178 fps
140%
GeForce RTX 2080 Max-Q:
248.7 249 ~ 249 fps
100%
GeForce MX330:
59.3 fps
415%
GeForce RTX 2080 Max-Q:
239.3 247.7 248 249 [X] Acer Triton 500 Intel Core i7-8750H 2.2GHz
GeForce RTX 2080 Max-Q
min:
234 fps
~ 246 fps
100%
GeForce MX330:
47.4 fps
492%
GeForce RTX 2080 Max-Q:
218 218.5 248 [X] Acer Triton 500 Intel Core i7-8750H 2.2GHz
GeForce RTX 2080 Max-Q
min:
230 fps
248.4 ~ 233 fps
GeForce RTX 2080 Max-Q:
112 123 [X] Acer Triton 500 Intel Core i7-8750H 2.2GHz
GeForce RTX 2080 Max-Q
min:
102 fps
~ 118 fps
GeForce RTX 2080 Max-Q:
142 [X] Acer Triton 500 Intel Core i7-8750H 2.2GHz
GeForce RTX 2080 Max-Q
min:
125 fps
142 ~ 142 fps
GeForce RTX 2080 Max-Q:
140 [X] Acer Triton 500 Intel Core i7-8750H 2.2GHz
GeForce RTX 2080 Max-Q
min:
123 fps
141 ~ 141 fps
GeForce RTX 2080 Max-Q:
139 [X] Acer Triton 500 Intel Core i7-8750H 2.2GHz
GeForce RTX 2080 Max-Q
min:
122 fps
139 ~ 139 fps
GeForce RTX 2080 Max-Q:
63.4 [X] Acer Triton 500 Intel Core i7-8750H 2.2GHz
GeForce RTX 2080 Max-Q
min:
55 fps
69.5 ~ 66 fps
GeForce RTX 2080 Max-Q:
89.8 [X] Acer Triton 500 Intel Core i7-8750H 2.2GHz
GeForce RTX 2080 Max-Q
min:
75 fps
94.4 [X] Asus GX701GX (Optimus-Mode) Intel Core i7-8750H 2.2GHz
GeForce RTX 2080 Max-Q
min:
79 fps
105 ~ 96 fps
GeForce RTX 2080 Max-Q:
87 [X] Acer Triton 500 Intel Core i7-8750H 2.2GHz
GeForce RTX 2080 Max-Q
min:
73 fps
89.8 [X] Asus GX701GX (Optimus-Mode) Intel Core i7-8750H 2.2GHz
GeForce RTX 2080 Max-Q
min:
78 fps
98.2 ~ 92 fps
GeForce RTX 2080 Max-Q:
57.2 [X] Asus GX701GX (Optimus-Mode) Intel Core i7-8750H 2.2GHz
GeForce RTX 2080 Max-Q
min:
46 fps
57.7 [X] Acer Triton 500 Intel Core i7-8750H 2.2GHz
GeForce RTX 2080 Max-Q
min:
46 fps
58 ~ 58 fps
GeForce RTX 2080 Max-Q:
39.1 [X] Acer Triton 500 Intel Core i7-8750H 2.2GHz
GeForce RTX 2080 Max-Q
min:
29 fps
42 ~ 41 fps
GeForce RTX 2080 Max-Q:
267.2 fps
GeForce RTX 2080 Max-Q:
163 [X] Asus GX701GX (Optimus-Mode) Intel Core i7-8750H 2.2GHz
GeForce RTX 2080 Max-Q
min:
129 fps
165.2 166 [X] Acer Triton 500 Intel Core i7-8750H 2.2GHz
GeForce RTX 2080 Max-Q
min:
115 fps
171 ~ 166 fps
GeForce RTX 2080 Max-Q:
156 [X] Acer Triton 500 Intel Core i7-8750H 2.2GHz
GeForce RTX 2080 Max-Q
min:
111 fps
156.5 158 [X] Asus GX701GX (Optimus-Mode) Intel Core i7-8750H 2.2GHz
GeForce RTX 2080 Max-Q
min:
127 fps
164 ~ 159 fps
GeForce RTX 2080 Max-Q:
122 [X] Acer Triton 500 Intel Core i7-8750H 2.2GHz
GeForce RTX 2080 Max-Q
min:
88 fps
123.4 130 [X] Asus GX701GX (Optimus-Mode) Intel Core i7-8750H 2.2GHz
GeForce RTX 2080 Max-Q
min:
93 fps
131 ~ 127 fps
GeForce RTX 2080 Max-Q:
52.9 [X] Acer Triton 500 Intel Core i7-8750H 2.2GHz
GeForce RTX 2080 Max-Q
min:
39 fps
57.2 ~ 55 fps
GeForce RTX 2080 Max-Q:
352 [X] Acer Triton 500 Intel Core i7-8750H 2.2GHz
GeForce RTX 2080 Max-Q
min:
282 fps
360 ~ 356 fps
GeForce RTX 2080 Max-Q:
194 [X] Acer Triton 500 Intel Core i7-8750H 2.2GHz
GeForce RTX 2080 Max-Q
min:
164 fps
220 ~ 207 fps
GeForce RTX 2080 Max-Q:
163 [X] Acer Triton 500 Intel Core i7-8750H 2.2GHz
GeForce RTX 2080 Max-Q
min:
142 fps
182 ~ 173 fps
GeForce RTX 2080 Max-Q:
58.6 [X] Acer Triton 500 Intel Core i7-8750H 2.2GHz
GeForce RTX 2080 Max-Q
min:
48 fps
65.1 ~ 62 fps
GeForce RTX 2080 Max-Q:
98.8 [X] Acer Triton 500 Intel Core i7-8750H 2.2GHz
GeForce RTX 2080 Max-Q
min:
85 fps
109 ~ 104 fps
GeForce RTX 2080 Max-Q:
92.8 [X] Acer Triton 500 Intel Core i7-8750H 2.2GHz
GeForce RTX 2080 Max-Q
min:
80 fps
94 ~ 93 fps
GeForce RTX 2080 Max-Q:
54.4 [X] Acer Triton 500 Intel Core i7-8750H 2.2GHz
GeForce RTX 2080 Max-Q
min:
45 fps
61.1 ~ 58 fps
GeForce RTX 2080 Max-Q:
134 146 ~ 140 fps
GeForce RTX 2080 Max-Q:
129 134 ~ 132 fps
GeForce RTX 2080 Max-Q:
65 fps
GeForce RTX 2080 Max-Q:
103 [X] Acer Triton 500 Intel Core i7-8750H 2.2GHz
GeForce RTX 2080 Max-Q
min:
76 fps
107 ~ 105 fps
GeForce RTX 2080 Max-Q:
59.7 [X] Acer Triton 500 Intel Core i7-8750H 2.2GHz
GeForce RTX 2080 Max-Q
min:
46 fps
63.5 ~ 62 fps
GeForce RTX 2080 Max-Q:
37.4 [X] Acer Triton 500 Intel Core i7-8750H 2.2GHz
GeForce RTX 2080 Max-Q
min:
31 fps
40.6 ~ 39 fps
GeForce RTX 2080 Max-Q:
120 [X] Asus GX701GX (Optimus-Mode) Intel Core i7-8750H 2.2GHz
GeForce RTX 2080 Max-Q
min:
87 fps
121 [X] Acer Triton 500 Intel Core i7-8750H 2.2GHz
GeForce RTX 2080 Max-Q
min:
106 fps
135 ~ 125 fps
GeForce RTX 2080 Max-Q:
110 [X] Acer Triton 500 Intel Core i7-8750H 2.2GHz
GeForce RTX 2080 Max-Q
min:
98 fps
113 [X] Asus GX701GX (Optimus-Mode) Intel Core i7-8750H 2.2GHz
GeForce RTX 2080 Max-Q
min:
86 fps
123 ~ 115 fps
GeForce RTX 2080 Max-Q:
45.6 [X] Acer Triton 500 Intel Core i7-8750H 2.2GHz
GeForce RTX 2080 Max-Q
min:
42 fps
50.2 ~ 48 fps
GeForce RTX 2080 Max-Q:
238 [X] Asus GX701GX (Optimus-Mode) Intel Core i7-8750H 2.2GHz
GeForce RTX 2080 Max-Q
min:
206 fps
289 [X] Acer Triton 500 Intel Core i7-8750H 2.2GHz
GeForce RTX 2080 Max-Q
min:
245 fps
292 ~ 273 fps
GeForce RTX 2080 Max-Q:
178 [X] Acer Triton 500 Intel Core i7-8750H 2.2GHz
GeForce RTX 2080 Max-Q
min:
148 fps
179 [X] Asus GX701GX (Optimus-Mode) Intel Core i7-8750H 2.2GHz
GeForce RTX 2080 Max-Q
min:
157 fps
196 ~ 184 fps
GeForce RTX 2080 Max-Q:
102 [X] Acer Triton 500 Intel Core i7-8750H 2.2GHz
GeForce RTX 2080 Max-Q
min:
85 fps
111 ~ 107 fps
GeForce RTX 2080 Max-Q:
131 [X] Acer Triton 500 Intel Core i7-8750H 2.2GHz
GeForce RTX 2080 Max-Q
min:
113 fps
134 ~ 133 fps
GeForce RTX 2080 Max-Q:
127 [X] Acer Triton 500 Intel Core i7-8750H 2.2GHz
GeForce RTX 2080 Max-Q
min:
106 fps
129 ~ 128 fps
GeForce RTX 2080 Max-Q:
71.1 [X] Acer Triton 500 Intel Core i7-8750H 2.2GHz
GeForce RTX 2080 Max-Q
min:
62 fps
79.3 ~ 75 fps
GeForce RTX 2080 Max-Q:
82.5 fps
GeForce RTX 2080 Max-Q:
80.7 fps
GeForce RTX 2080 Max-Q:
81.3 fps
GeForce RTX 2080 Max-Q:
113 [X] Asus GX701GX (Optimus-Mode) Intel Core i7-8750H 2.2GHz
GeForce RTX 2080 Max-Q
min:
81 fps
117 [X] Acer Triton 500 Intel Core i7-8750H 2.2GHz
GeForce RTX 2080 Max-Q
min:
63 fps
127 ~ 119 fps
GeForce RTX 2080 Max-Q:
93 [X] Acer Triton 500 Intel Core i7-8750H 2.2GHz
GeForce RTX 2080 Max-Q
min:
61 fps
93.9 [X] Asus GX701GX (Optimus-Mode) Intel Core i7-8750H 2.2GHz
GeForce RTX 2080 Max-Q
min:
67 fps
100 ~ 96 fps
GeForce RTX 2080 Max-Q:
45.6 [X] Acer Triton 500 Intel Core i7-8750H 2.2GHz
GeForce RTX 2080 Max-Q
min:
20 fps
51.7 ~ 49 fps
GeForce RTX 2080 Max-Q:
52.4 fps
GeForce RTX 2080 Max-Q:
152 [X] Asus GX701GX (Optimus-Mode) Intel Core i7-8750H 2.2GHz
GeForce RTX 2080 Max-Q
min:
85 fps
210 [X] Acer Triton 500 Intel Core i7-8750H 2.2GHz
GeForce RTX 2080 Max-Q
min:
46 fps
230 ~ 197 fps
GeForce RTX 2080 Max-Q:
148 [X] Asus GX701GX (Optimus-Mode) Intel Core i7-8750H 2.2GHz
GeForce RTX 2080 Max-Q
min:
77 fps
201 [X] Acer Triton 500 Intel Core i7-8750H 2.2GHz
GeForce RTX 2080 Max-Q
min:
41 fps
217 ~ 189 fps
GeForce RTX 2080 Max-Q:
90.8 [X] Acer Triton 500 Intel Core i7-8750H 2.2GHz
GeForce RTX 2080 Max-Q
min:
36 fps
98.2 ~ 95 fps
135%
GeForce RTX 2070 Super Mobile:
154 155 156 156 ~ 155 fps
126%
GeForce RTX 2080 Max-Q:
144.9 fps
131%
GeForce RTX 2070 Super Mobile:
136 137 141 145 ~ 140 fps
124%
GeForce RTX 2080 Max-Q:
132.2 fps
192%
GeForce RTX 2070 Super Mobile:
111 127 133 135 ~ 127 fps
192%
GeForce RTX 2080 Max-Q:
126.4 fps
214%
GeForce RTX 2070 Super Mobile:
104 122 126 129 ~ 120 fps
214%
GeForce RTX 2080 Max-Q:
119.6 fps
GeForce RTX 2080 Max-Q:
172 fps
GeForce RTX 2080 Max-Q:
161 fps
GeForce RTX 2080 Max-Q:
134 fps
GeForce RTX 2080 Max-Q:
92 fps
100%
GeForce MX330:
34.2 37 ~ 36 fps
100%
GeForce MX330:
11.2 12 ~ 12 fps
GeForce RTX 2070 Super Mobile:
57.6 59.8 ~ 59 fps
GeForce RTX 2080 Max-Q:
39.6 50.6 53 53.3 [X] Acer Triton 500 Intel Core i7-8750H 2.2GHz
GeForce RTX 2080 Max-Q
min:
43 fps
57.6 65.5 ~ 53 fps
GeForce RTX 2070 Super Mobile:
182 [X] MSI GE66 Raider 10SFS Intel Core i9-10980HK 2.4GHz
GeForce RTX 2070 Super Mobile
min:
2.06 fps, P1:
143 fps, max:
272 fps
fps
GeForce RTX 2080 Max-Q:
140 171 ~ 156 fps
GeForce RTX 2070 Super Mobile:
177 [X] MSI GE66 Raider 10SFS Intel Core i9-10980HK 2.4GHz
GeForce RTX 2070 Super Mobile
min:
3.28 fps, P1:
143 fps, max:
351 fps
fps
GeForce RTX 2080 Max-Q:
135.3 166 ~ 151 fps
GeForce RTX 2070 Super Mobile:
163 [X] MSI GE66 Raider 10SFS Intel Core i9-10980HK 2.4GHz
GeForce RTX 2070 Super Mobile
min:
5.5 fps, P1:
100 fps, max:
300 fps
fps
GeForce RTX 2080 Max-Q:
115.4 144 ~ 130 fps
GeForce RTX 2070 Super Mobile:
94 [X] MSI GE66 Raider 10SFS Intel Core i9-10980HK 2.4GHz
GeForce RTX 2070 Super Mobile
min:
22.9 fps, P1:
62.5 fps, max:
186 fps
fps
GeForce RTX 2080 Max-Q:
62.6 77.2 ~ 70 fps
GeForce RTX 2080 Max-Q:
74 fps
100%
GeForce MX330:
173.9 fps
214%
GeForce RTX 2070 Super Mobile:
371.8 fps
100%
GeForce MX330:
113.8 fps
271%
GeForce RTX 2070 Super Mobile:
308.3 fps
100%
GeForce MX330:
96 fps
311%
GeForce RTX 2070 Super Mobile:
299 fps
100%
GeForce MX330:
37.9 fps
458%
GeForce RTX 2070 Super Mobile:
173.4 fps
Average Gaming NVIDIA GeForce MX330 → 100% Average Gaming 30-70 fps → 100%
Average Gaming NVIDIA GeForce RTX 2070 Super Mobile → 687% Average Gaming 30-70 fps → 754%
Average Gaming NVIDIA GeForce RTX 2080 Max-Q → 537% Average Gaming 30-70 fps → 561%
 Deutsch
 English
 Español
 Français
 Italiano
 Nederlands
 Polski
 Português
 Русский
 Türkçe
 Svenska
 Chinese
 Magyar