NVIDIA GeForce MX330 vs NVIDIA GeForce RTX 2060 Max-Q vs NVIDIA GeForce RTX 2070 Super Mobile
NVIDIA GeForce MX330 ► remove from comparison
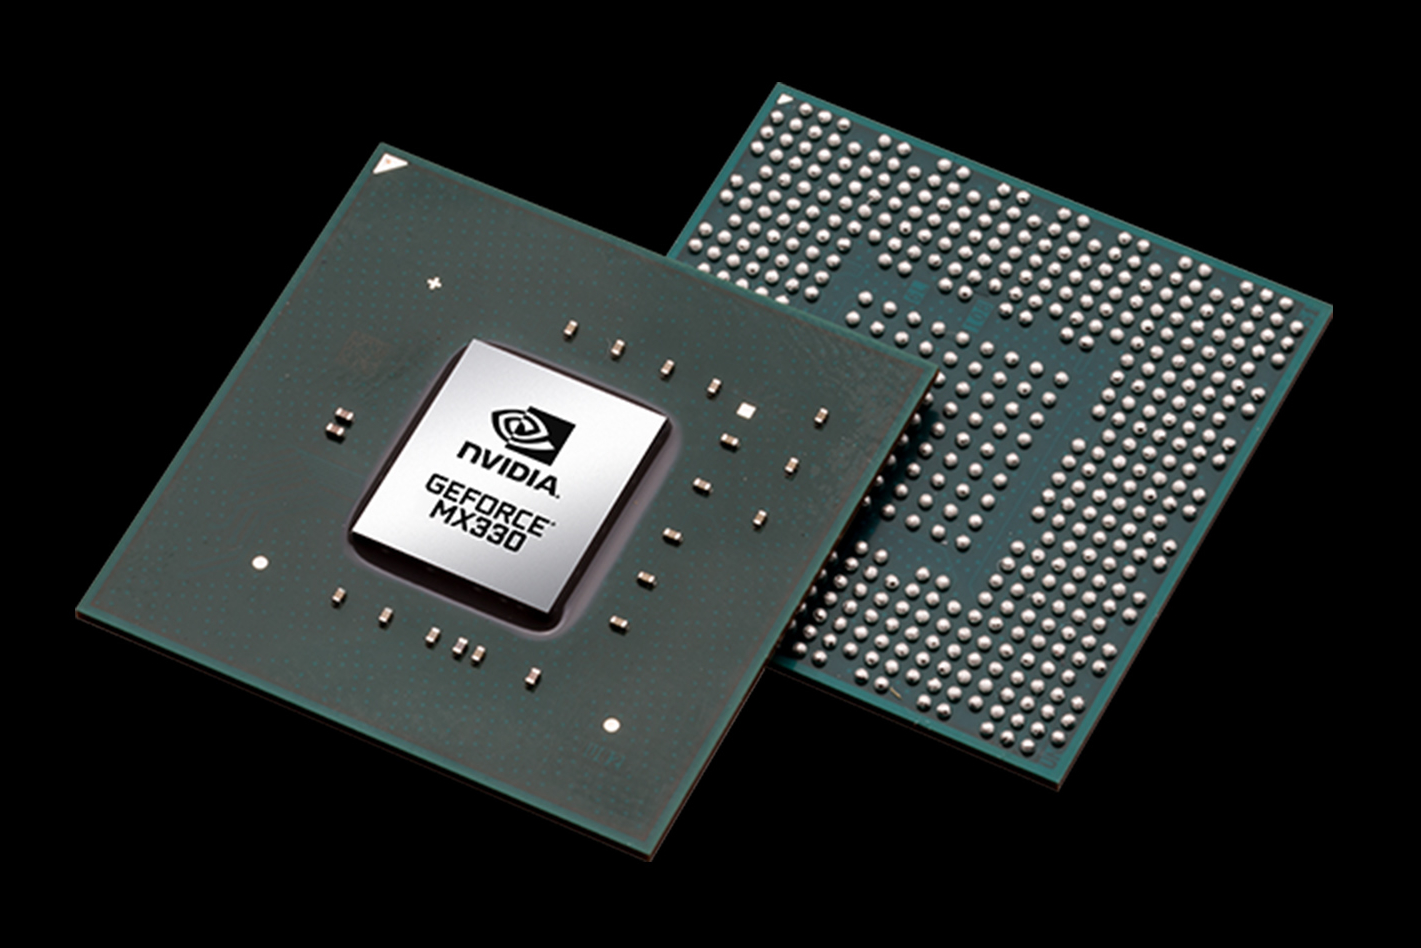
The Nvidia GeForce MX330 is a dedicated entry-level mobile graphics card for laptops . It was released in February 2020 and is basically a renamed Geforce MX250 / GeForce MX150 / desktop GeForce GT 1030 . It uses the same GP108 chip as the MX250 (GP108-655-A1 e.g.). It offers the same 384 CUDA cores as the MX250 and MX150 and also the clock speeds only increased slightly (+12 MHz Boost = 0.8% for the 25 Watt version). The dedicated GDDR5 graphics memory is connected via a 64 Bit memory bus and clocked at 3500 MHz (7000 MHz effective) leading to maximal bandwidth of 56 GB/s. Again there is a 25 Watt and slower 12 Watt (low power) variant.
In Nvidia drivers the GeForce MX330 appeared with the hardware ID 1D16.
The GP108 chip is manufactured in a 16 nm FinFET process and offers a number of new features, including support for DisplayPort 1.4 (ready), HDMI 2.0b, HDR and improved H.265 video de- and encoding (PlayReady 3.0). 4K HDR with Netflix however won't run due to the minimum 3 GB graphics memory that is required. Compared to the bigger Pascal chips, the small GP108 does not support Simultaneous Multi-Projection (SMP) for VR and G-Sync. A full list of improvements and the new Pascal desktop GPUs is available in our dedicated Pascal architecture article .
The performance of the GeForce MX330 should be identical to the MX150 and MX250 of previous years. See our GeForce MX250 page for gaming benchmarks . Nvidia states on the product page that the MX330 offers 2x of the performance of a Intel Iris Plus Graphics G7 in an i7-1065G7 (vs 2.5x of the MX350 ). Therefore, very demanding games like Red Dead Redemption 2 will not run smoothly, older and less demanding games like Fifa 20 or Farming Simulator 19 however should run fine in medium settings (see below for our benchmark results with different laptops). The low power version (see below) will be clearly slower however.
There is a low power version N17S-LP with a TGP of 12 Watt (up 2 Watt from 10 Watt of the LP MX250) and a "normal" 25 Watt N17S-G3. The performance of both variants should clearly differ. The low power variant offers relatively slow clock rates of 746 - 936 MHz (base - Turbo), where the 25 Watt G3 variant is clocked at 1531 - 1594 (similar to the MX250 and +70% boost clock versus the LP variant).
NVIDIA GeForce RTX 2060 Max-Q ► remove from comparison
The NVIDIA GeForce RTX 2060 with Max-Q design is the power saving variant of the mobile GeForce RTX 2060 . Therefore it is a high end gaming graphics card for thin laptops. It is based on the same chip as the RTX 2060 but with reduced clock speeds and a lower power consumption. It was released in 2020 with the Zephyrus G14 gaming laptop.
With the refresh, Nvidia also reworked the Max-Q technologies for more efficiency. Low Voltage GDDR6 (lower clocked but more headroom for the GPU) and improved regulator efficiency should improve the performance per Watt. Two new optional features can also be implemented by the OEM. Max-Q Dynamic Boost is able to shift power from the CPU to the GPU on a per frame basis to increase overall performance. Furthermore, the laptop manufacturer can also implement Advanced Optimus with a dynamic display switch (hardware) to enable Optimus, G-SYNC and high refresh rate displays (up to 4K 120 Hz).
The clock is not the only difference compared to the regular GTX 2060 though. The drivers for the Max-Q version were optimized for efficiency (and not performance; only for Max-Q models), there are optimized voltage converters for 1V operation, high-end cooling methods, and a 40 dB limit for the fan noise (with clock adjustments to ensure this at all times).
The performance should be only slightly below the normal RTX 2060 due to the decreased clock rates. It should be most suited for 1080p gaming at maximum detail level. Raytracing features however may reduce framerates a lot, so using raytracing will be limited to some games.
The chip is specified at a TGP of around 65 Watt and therefore clearly lower than the 80 - 90 Watt of the regular RTX 2060 Mobile.
NVIDIA GeForce RTX 2070 Super Mobile ► remove from comparison
The NVIDIA GeForce RTX 2070 Super Mobile is a high end gaming graphics cards for laptops. It is the 2020 refresh of the GeForce RTX 2070 Mobile and may now also use the TU104 chip with more shaders (as the desktop RTX 2070 Super did). The older mobile RTX 2070 uses the TU106 chip with 2,304 shaders and should be slightly slower than the new Super model.
NVIDIA manufacturers the TU106 and TU104 chips on a 12 nm FinFET process and includes features like Deep Learning Super Sampling (DLSS) and Real-Time Ray Tracing (RTRT), which should combine to create more realistic lighting effects than older GPUs based on the company's Pascal architecture (if the games supports it). The RTX 2070 Super is also DisplayPort 1.4 ready, while there is also support for HDMI 2.0b, HDR, Simultaneous Multi-Projection (SMP) and H.265 video en/decoding (PlayReady 3.0).
NVIDIA GeForce MX330 NVIDIA GeForce RTX 2060 Max-Q NVIDIA GeForce RTX 2070 Super Mobile GeForce RTX 2000 Series GeForce MX450 896 @ 1.4 - 1.58 GHz 64 Bit @ 10000 MHz GeForce MX350 640 @ 1.35 - 1.47 GHz 64 Bit @ 7000 MHz GeForce MX330 384 @ 1.53 - 1.59 GHz 64 Bit @ 7000 MHz
Codename N17S-LP / N17S-G3 N18E-G1 MAX-Q TU106 N18E-G2R Architecture Pascal Turing Turing Pipelines 384 - unified 1920 - unified 2560 - unified TMUs 32 ROPs 16 Core Speed 1531 - 1594 (Boost) MHz 975 - 1185 (Boost) MHz 1140 - 1380 (Boost) MHz Memory Speed 7000 effective = 1752 MHz 11000 MHz 14002 MHz Memory Bus Width 64 Bit 192 Bit 256 Bit Memory Type GDDR5 GDDR6 GDDR6 Shared Memory no no no Memory Bandwidth 56.1 GB/s API DirectX 12_1, OpenGL 4.6 DirectX 12_1, OpenGL 4.6 DirectX 12_1, OpenGL 4.6 Power Consumption 25 Watt (12 - 25 Watt TGP) 65 Watt 115 Watt technology 14 nm 12 nm 12 nm PCIe 3.0 Displays HDMI 2.0b, DisplayPort 1.4 Features Vulkan 1.1, OpenGL 4.6, OpenCL 1.2, GPU Boost 3.0, Multi Monitor, Optimus, GameWorks DLSS, Raytraycing, VR Ready, G-SYNC, Vulkan, Multi Monitor DLSS, Raytraycing, VR Ready, G-SYNC, Vulkan, Multi Monitor, 550 Watt system power recommended Date of Announcement 20.02.2020 06.01.2019 02.04.2020 Link to Manufacturer Page www.nvidia.com Max. Amount of Memory 6 GB 8 GB Notebook Size large large
Benchmarks Performance Rating - 3DMark 11 + Fire Strike + Time Spy - GeForce MX330
1.7 pt (5%)
...
...
max:
Performance Rating - 3DMark 11 + Fire Strike + Time Spy - GeForce RTX 2060 Max-Q
6.8 pt (20%)
...
NVIDIA GeForce RTX 2060 Max-Q
...
max:
3DMark - 3DMark Time Spy Score
min: 1178 avg: 1236 median: 1235.5 (4%) max: 1293 Points
min: 5390 avg: 5813 median: 5844.5 (17%) max: 6171 Points
GPU TDP ? TDP 65 W 75% 100%
min: 7943 avg: 8292 median: 8315.5 (24%) max: 8602 Points
GPU TDP ? TDP 65 W TDP 113 W TDP 115 W 83% 65% 97% 100%
3DMark - 3DMark Time Spy Graphics
min: 1059 avg: 1136 median: 1160 (3%) max: 1190 Points
min: 5357 avg: 5637 median: 5638.5 (15%) max: 5914 Points
GPU TDP ? TDP 65 W 63% 100%
min: 7840 avg: 8238 median: 8272 (22%) max: 8657 Points
GPU TDP ? TDP 65 W TDP 113 W TDP 115 W 78% 66% 100% 100%
3DMark - 3DMark Ice Storm Unlimited Graphics
min: 234893 avg: 243721 median: 243721 (28%) max: 252549 Points
308872 Points (35%)
min: 446705 avg: 471516 median: 481195 (55%) max: 486649 Points
GPU TDP ? TDP 113 W TDP 115 W 64% 99% 100%
3DMark - 3DMark Ice Storm Extreme Graphics
min: 32370 avg: 49651 median: 49651 (6%) max: 66932 Points
95079 Points (12%)
3DMark - 3DMark Cloud Gate Score
min: 12137 avg: 14691 median: 15382 (16%) max: 16555 Points
min: 25407 avg: 31253 median: 30659.5 (33%) max: 38287 Points
GPU TDP ? TDP 65 W 79% 100%
min: 39220 avg: 45009 median: 46745 (50%) max: 50766 Points
GPU TDP ? TDP 65 W TDP 113 W TDP 115 W 85% 73% 98% 100%
3DMark - 3DMark Cloud Gate Graphics
min: 15595 avg: 19968 median: 20729 (5%) max: 23580 Points
min: 38074 avg: 58101 median: 58890 (15%) max: 76551 Points
GPU TDP ? TDP 65 W 47% 100%
min: 75986 avg: 121959 median: 126287 (33%) max: 141778 Points
GPU TDP ? TDP 65 W TDP 113 W TDP 115 W 64% 62% 100% 61%
3DMark - 3DMark Fire Strike Standard Score
min: 3308 avg: 3436 median: 3470 (6%) max: 3530 Points
min: 12716 avg: 13699 median: 13716 (24%) max: 14649 Points
GPU TDP ? TDP 65 W 69% 100%
min: 14771 avg: 18634 median: 18919.5 (33%) max: 19884 Points
GPU TDP ? TDP 65 W TDP 113 W TDP 115 W 82% 70% 100% 91%
3DMark - 3DMark Fire Strike Standard Graphics
min: 3581 avg: 3727 median: 3762 (4%) max: 3838 Points
min: 14129 avg: 14900 median: 14909.5 (17%) max: 15650 Points
GPU TDP ? TDP 65 W 67% 100%
min: 18662 avg: 21824 median: 22016 (25%) max: 23042 Points
GPU TDP ? TDP 65 W TDP 113 W TDP 115 W 80% 66% 100% 93%
3DMark - 3DMark Ice Storm Graphics
min: 21238 avg: 45268 median: 45267.5 (5%) max: 69297 Points
95273 Points (11%)
3DMark - 3DMark Wild Life Unlimited
51350 Points (26%)
3DMark - 3DMark Night Raid
12842 Points (12%)
3DMark - 3DMark Night Raid Graphics Score
15787 Points (6%)
3DMark 11 - 3DM11 Performance Score
min: 4898 avg: 5080 median: 5121.5 (7%) max: 5180 Points
min: 16516 avg: 17896 median: 18065 (25%) max: 18937 Points
GPU TDP ? TDP 65 W 65% 100%
min: 20961 avg: 23775 median: 24028.5 (33%) max: 25360 Points
GPU TDP ? TDP 65 W TDP 113 W TDP 115 W 71% 69% 87% 100%
3DMark 11 - 3DM11 Performance GPU
min: 4616 avg: 4787 median: 4834 (4%) max: 4863 Points
min: 18863 avg: 19881 median: 19778.5 (17%) max: 21105 Points
GPU TDP ? TDP 65 W 60% 100%
min: 28207 avg: 29416 median: 29092.5 (25%) max: 31050 Points
GPU TDP ? TDP 65 W TDP 113 W TDP 115 W 68% 65% 100% 98%
3DMark Vantage + NVIDIA GeForce RTX 2060 Max-Q 3DMark Vantage - 3DM Vant. Perf. total
50957 Points (15%)
3DM Vant. Perf. total + NVIDIA GeForce RTX 2070 Super Mobile
70601 Points (20%)
3DM Vant. Perf. GPU no PhysX + NVIDIA GeForce RTX 2060 Max-Q 3DMark Vantage - 3DM Vant. Perf. GPU no PhysX
49207 Points (28%)
3DM Vant. Perf. GPU no PhysX + NVIDIA GeForce RTX 2070 Super Mobile
75429 Points (43%)
3DMark 06 3DMark 06 - Standard 1280x1024 + NVIDIA GeForce RTX 2060 Max-Q
37332 Points (49%)
3DMark 06 - Standard 1280x1024 + NVIDIA GeForce RTX 2070 Super Mobile
43041 Points (56%)
Unigine Valley 1.0 - Unigine Valley 1.0 DX
18.1 fps (6%)
SPECviewperf 12 + NVIDIA GeForce MX330 SPECviewperf 12 - specvp12 sw-03
26.5 fps (7%)
specvp12 snx-02 + NVIDIA GeForce MX330 SPECviewperf 12 - specvp12 snx-02
3.4 fps (1%)
specvp12 showcase-01 + NVIDIA GeForce MX330 SPECviewperf 12 - specvp12 showcase-01
16.5 fps (4%)
specvp12 mediacal-01 + NVIDIA GeForce MX330 SPECviewperf 12 - specvp12 mediacal-01
10.5 fps (3%)
specvp12 maya-04 + NVIDIA GeForce MX330 SPECviewperf 12 - specvp12 maya-04
27.1 fps (7%)
specvp12 energy-01 + NVIDIA GeForce MX330 SPECviewperf 12 - specvp12 energy-01
0.5 fps (0%)
specvp12 creo-01 + NVIDIA GeForce MX330 SPECviewperf 12 - specvp12 creo-01
12.2 fps (5%)
specvp12 catia-04 + NVIDIA GeForce MX330 SPECviewperf 12 - specvp12 catia-04
17.7 fps (3%)
specvp12 3dsmax-05 + NVIDIA GeForce MX330 SPECviewperf 12 - specvp12 3dsmax-05
27.1 fps (5%)
SPECviewperf 13 specvp13 sw-04 + NVIDIA GeForce MX330 SPECviewperf 13 - specvp13 sw-04
37.3 fps (10%)
specvp13 sw-04 + NVIDIA GeForce RTX 2070 Super Mobile
91.2 fps (24%)
specvp13 snx-03 + NVIDIA GeForce MX330 SPECviewperf 13 - specvp13 snx-03
6.1 fps (1%)
specvp13 snx-03 + NVIDIA GeForce RTX 2070 Super Mobile
20.1 fps (2%)
specvp13 showcase-02 + NVIDIA GeForce MX330 SPECviewperf 13 - specvp13 showcase-02
16.5 fps (4%)
specvp13 showcase-02 + NVIDIA GeForce RTX 2070 Super Mobile
112.1 fps (24%)
specvp13 medical-02 + NVIDIA GeForce MX330 SPECviewperf 13 - specvp13 medical-02
10.9 fps (2%)
specvp13 medical-02 + NVIDIA GeForce RTX 2070 Super Mobile
56.3 fps (12%)
specvp13 maya-05 + NVIDIA GeForce MX330 SPECviewperf 13 - specvp13 maya-05
47.5 fps (5%)
specvp13 maya-05 + NVIDIA GeForce RTX 2070 Super Mobile
225 fps (26%)
specvp13 energy-02 + NVIDIA GeForce MX330 SPECviewperf 13 - specvp13 energy-02
0.5 fps (0%)
specvp13 energy-02 + NVIDIA GeForce RTX 2070 Super Mobile
21.6 fps (7%)
specvp13 creo-02 + NVIDIA GeForce MX330 SPECviewperf 13 - specvp13 creo-02
26.4 fps (4%)
specvp13 creo-02 + NVIDIA GeForce RTX 2070 Super Mobile
177.5 fps (26%)
specvp13 catia-05 + NVIDIA GeForce MX330 SPECviewperf 13 - specvp13 catia-05
25.8 fps (3%)
specvp13 catia-05 + NVIDIA GeForce RTX 2070 Super Mobile
137.6 fps (15%)
specvp13 3dsmax-06 + NVIDIA GeForce MX330 SPECviewperf 13 - specvp13 3dsmax-06
26.8 fps (5%)
specvp13 3dsmax-06 + NVIDIA GeForce RTX 2070 Super Mobile
188.7 fps (33%)
Cinebench R10 Cinebench R10 Shading (32bit) + NVIDIA GeForce RTX 2060 Max-Q Cinebench R10 - Cinebench R10 Shading (32bit)
11800 Points (8%)
Cinebench R11.5 Cinebench R11.5 OpenGL 64 Bit + NVIDIA GeForce RTX 2060 Max-Q Cinebench R11.5 - Cinebench R11.5 OpenGL 64 Bit
76.3 fps (26%)
Cinebench R15 + NVIDIA GeForce MX330 Cinebench R15 - Cinebench R15 OpenGL 64 Bit
min: 93.4 avg: 98.2 median: 98.2 (6%) max: 103 fps
Cinebench R15 OpenGL 64 Bit + NVIDIA GeForce RTX 2060 Max-Q
min: 104.1 avg: 132.3 median: 137 (8%) max: 151 fps
GPU TDP ? TDP 65 W 76% 100%
Cinebench R15 OpenGL 64 Bit + NVIDIA GeForce RTX 2070 Super Mobile
min: 130 avg: 141 median: 142.1 (8%) max: 154 fps
GPU TDP ? TDP 65 W TDP 113 W TDP 115 W 85% 100% 96% 100%
Cinebench R15 OpenGL Ref. Match 64 Bit + NVIDIA GeForce MX330 Cinebench R15 - Cinebench R15 OpenGL Ref. Match 64 Bit
99.6 % (100%)
Cinebench R15 OpenGL Ref. Match 64 Bit + NVIDIA GeForce RTX 2060 Max-Q
99.6 % (100%)
GPU TDP ? TDP 65 W 100% 100%
Cinebench R15 OpenGL Ref. Match 64 Bit + NVIDIA GeForce RTX 2070 Super Mobile
99.6 % (100%)
GPU TDP ? TDP 65 W TDP 113 W TDP 115 W 100% 100% 100% 100%
GFXBench - GFXBench Car Chase Offscreen
273 fps (31%)
402.6 fps (45%)
GFXBench 3.1 - GFXBench Manhattan ES 3.1 Offscreen
411.3 fps (9%)
GFXBench 3.0 - GFXBench 3.0 Manhattan Offscreen
497.9 fps (29%)
GFXBench (DX / GLBenchmark) 2.7 + NVIDIA GeForce RTX 2060 Max-Q GFXBench (DX / GLBenchmark) 2.7 - GFXBench T-Rex HD Offscreen C24Z16
1123 fps (9%)
LuxMark v2.0 64Bit - LuxMark v2.0 Room GPU
735 Samples/s (3%)
2664 Samples/s (12%)
LuxMark v2.0 64Bit - LuxMark v2.0 Sala GPU
1047 Samples/s (2%)
5786 Samples/s (10%)
ComputeMark v2.1 - ComputeMark v2.1 Result
2890 Points (3%)
15586 Points (17%)
Power Consumption - Furmark Stress Test Power Consumption - external Monitor *
min: 45 avg: 49.9 median: 49.9 (7%) max: 54.8 Watt
min: 96.6 avg: 116.3 median: 116.3 (17%) max: 136 Watt
175 Watt (25%)
GPU TDP ? TDP 115 W 117% 100%
Power Consumption - The Witcher 3 Power Consumption - external Monitor *
min: 48.3 avg: 73.6 median: 73.6 (10%) max: 98.8 Watt
min: 107.5 avg: 120.8 median: 120.8 (17%) max: 134 Watt
Power Consumption - Witcher 3 Power Consumption *
min: 53 avg: 57.6 median: 57.6 (13%) max: 62.2 Watt
min: 99.2 avg: 110.6 median: 108.9 (24%) max: 125.5 Watt
GPU TDP ? TDP 65 W 104% 100%
min: 175 avg: 190.3 median: 190.5 (42%) max: 201 Watt
GPU TDP ? TDP 65 W TDP 113 W 117% 130% 100%
Power Consumption - Witcher 3 ultra Power Efficiency
0.2 fps per Watt (20%)
min: 0.4858 avg: 0.5 median: 0.5 (46%) max: 0.566 fps per Watt
GPU TDP ? TDP 65 W 93% 100%
min: 0.4264 avg: 0.4 median: 0.4 (40%) max: 0.472 fps per Watt
GPU TDP ? TDP 65 W TDP 113 W 92% 100% 97%
Power Consumption - Witcher 3 ultra Power Efficiency - external Monitor
0.2 fps per Watt (19%)
min: 0.4694 avg: 0.5 median: 0.5 (42%) max: 0.543 fps per Watt
Emissions Witcher 3 Fan Noise + NVIDIA GeForce MX330 Emissions - Witcher 3 Fan Noise
min: 34.2 avg: 39.1 median: 39.1 (63%) max: 43.9 dB(A)
Witcher 3 Fan Noise + NVIDIA GeForce RTX 2060 Max-Q
min: 41.3 avg: 49.4 median: 51.3 (82%) max: 53.7 dB(A)
GPU TDP ? TDP 65 W 100% 88%
Witcher 3 Fan Noise + NVIDIA GeForce RTX 2070 Super Mobile
min: 50 avg: 53.4 median: 54 (86%) max: 57.5 dB(A)
GPU TDP ? TDP 65 W TDP 113 W 100% 82% 99%
Clock Speed - GPU Clock Witcher 3 ultra
1683 MHz (66%)
1418 MHz (56%)
min: 1425 avg: 1479 median: 1455 (57%) max: 1560 MHz
GPU TDP ? TDP 113 W 99% 100%
Clock Speed - GPU Clock Speed Furmark
1403 MHz (56%)
1171 MHz (46%)
1148 MHz (45%)
GPU TDP ? TDP 115 W 100% 89%
Average Benchmarks NVIDIA GeForce MX330 → 100% n=13 Average Benchmarks NVIDIA GeForce RTX 2060 Max-Q → 272% n=13 Average Benchmarks NVIDIA GeForce RTX 2070 Super Mobile → 393% n=13
- Range of benchmark values for this graphics card
- Average benchmark values for this graphics card
* Smaller numbers mean a higher performance
1 This benchmark is not used for the average calculation
Game Benchmarks The following benchmarks stem from our benchmarks of review laptops. The performance depends on the used graphics memory, clock rate, processor, system settings, drivers, and operating systems. So the results don't have to be representative for all laptops with this GPU. For detailed information on the benchmark results, click on the fps number.
100%
GeForce MX330:
26 [X] MSI Prestige 14 Intel Core i7-10510U 1.8GHz
GeForce MX330
min:
9.35 fps, P0.1:
9.81 fps, P1:
17.3 fps, max:
78 fps
fps
100%
GeForce MX330:
20.9 [X] MSI Prestige 14 Intel Core i7-10510U 1.8GHz
GeForce MX330
min:
4.65 fps, P0.1:
5.59 fps, P1:
12.2 fps, max:
76.4 fps
fps
100%
GeForce MX330:
14.6 [X] MSI Prestige 14 Intel Core i7-10510U 1.8GHz
GeForce MX330
min:
3.31 fps, P0.1:
3.75 fps, P1:
7.26 fps, max:
69.5 fps
fps
100%
GeForce MX330:
18.8 [X] MSI Prestige 14 Intel Core i7-10510U 1.8GHz
GeForce MX330
min:
12 fps
fps
100%
GeForce MX330:
15 [X] MSI Prestige 14 Intel Core i7-10510U 1.8GHz
GeForce MX330
min:
9 fps
fps
100%
GeForce MX330:
14.4 [X] MSI Prestige 14 Intel Core i7-10510U 1.8GHz
GeForce MX330
min:
6 fps
fps
100%
GeForce MX330:
19.7 [X] MSI Prestige 14 Intel Core i7-10510U 1.8GHz
GeForce MX330
min:
14 fps, P0.1:
14.2 fps, P1:
15.2 fps, max:
30.7 fps
fps
100%
GeForce MX330:
9.2 [X] MSI Prestige 14 Intel Core i7-10510U 1.8GHz
GeForce MX330
min:
4.88 fps, P0.1:
5.55 fps, P1:
6.39 fps, max:
15.5 fps
fps
100%
GeForce MX330:
6.2 [X] MSI Prestige 14 Intel Core i7-10510U 1.8GHz
GeForce MX330
min:
2.23 fps, P0.1:
2.83 fps, P1:
3.92 fps, max:
34.9 fps
fps
100%
GeForce MX330:
5.1 [X] MSI Prestige 14 Intel Core i7-10510U 1.8GHz
GeForce MX330
min:
1.875 fps, P0.1:
2.04 fps, P1:
2.69 fps, max:
16 fps
fps
100%
GeForce MX330:
36 [X] MSI Prestige 14 Intel Core i7-10510U 1.8GHz
GeForce MX330
min:
16 fps
fps
100%
GeForce MX330:
15 [X] MSI Prestige 14 Intel Core i7-10510U 1.8GHz
GeForce MX330
min:
9 fps
fps
100%
GeForce MX330:
9 [X] MSI Prestige 14 Intel Core i7-10510U 1.8GHz
GeForce MX330
min:
6 fps
fps
100%
GeForce MX330:
8 [X] MSI Prestige 14 Intel Core i7-10510U 1.8GHz
GeForce MX330
min:
3 fps
fps
100%
GeForce MX330:
44.3 [X] MSI Prestige 14 Intel Core i7-10510U 1.8GHz
GeForce MX330
min:
24.7 fps, P0.1:
24.8 fps, P1:
29.1 fps, max:
96.1 fps
fps
352%
GeForce RTX 2070 Super Mobile:
156 fps
100%
GeForce MX330:
15.7 [X] MSI Prestige 14 Intel Core i7-10510U 1.8GHz
GeForce MX330
min:
9.07 fps, P0.1:
9.09 fps, P1:
9.46 fps, max:
44.6 fps
fps
671%
GeForce RTX 2070 Super Mobile:
105.4 fps
100%
GeForce MX330:
15.4 [X] MSI Prestige 14 Intel Core i7-10510U 1.8GHz
GeForce MX330
min:
7.99 fps, P0.1:
8.3 fps, P1:
8.81 fps, max:
43.2 fps
fps
676%
GeForce RTX 2070 Super Mobile:
104.1 fps
100%
GeForce MX330:
13.4 [X] MSI Prestige 14 Intel Core i7-10510U 1.8GHz
GeForce MX330
min:
6.59 fps, P0.1:
6.62 fps, P1:
7.27 fps, max:
43 fps
fps
688%
GeForce RTX 2070 Super Mobile:
92.2 fps
GeForce RTX 2070 Super Mobile:
61 fps
GeForce RTX 2070 Super Mobile:
31.4 fps
100%
GeForce MX330:
35.3 [X] MSI Prestige 14 Intel Core i7-10510U 1.8GHz
GeForce MX330
min:
20.8 fps, P0.1:
22.7 fps, P1:
25.3 fps, max:
86.4 fps
fps
541%
GeForce RTX 2070 Super Mobile:
191 fps
100%
GeForce MX330:
12.7 [X] MSI Prestige 14 Intel Core i7-10510U 1.8GHz
GeForce MX330
min:
10 fps, P0.1:
10.1 fps, P1:
10.4 fps, max:
19.5 fps
fps
791%
GeForce RTX 2070 Super Mobile:
100.5 fps
100%
GeForce MX330:
8.1 [X] MSI Prestige 14 Intel Core i7-10510U 1.8GHz
GeForce MX330
min:
7.95 fps, P0.1:
7.96 fps, P1:
8.26 fps, max:
13.8 fps
fps
1159%
GeForce RTX 2070 Super Mobile:
93.8 fps
GeForce RTX 2070 Super Mobile:
85.1 fps
GeForce RTX 2070 Super Mobile:
60.6 fps
GeForce RTX 2070 Super Mobile:
35.3 fps
100%
GeForce MX330:
18 [X] MSI Prestige 14 Intel Core i7-10510U 1.8GHz
GeForce MX330
P0.1:
5 fpsP1:
fps
fps
678%
GeForce RTX 2070 Super Mobile:
122 fps
100%
GeForce MX330:
9 [X] MSI Prestige 14 Intel Core i7-10510U 1.8GHz
GeForce MX330
P0.1:
6 fpsP1:
fps
fps
922%
GeForce RTX 2070 Super Mobile:
83 fps
100%
GeForce MX330:
8 [X] MSI Prestige 14 Intel Core i7-10510U 1.8GHz
GeForce MX330
P0.1:
5 fpsP1:
fps
fps
888%
GeForce RTX 2070 Super Mobile:
71 fps
GeForce RTX 2070 Super Mobile:
60 61 [X] SCHENKER XMG Neo 17 Comet Lake Overboost
Intel Core i7-10875H 2.3GHz
GeForce RTX 2070 Super Mobile
min:
18 fps, P0.1:
29 fps, P1:
42 fps, max:
124 fps
93 [X] SCHENKER Compact 17 Leistungsmodus
Intel Core i7-10875H 2.3GHz
GeForce RTX 2070 Super Mobile
min:
35 fps, P0.1:
40 fps, P1:
60 fps, max:
149 fps
~ 71 fps
100%
GeForce MX330:
37.1 [X] MSI Prestige 14 Intel Core i7-10510U 1.8GHz
GeForce MX330
min:
23.6 fps, P0.1:
26.8 fps, P1:
29.4 fps, max:
56.1 fps
fps
434%
GeForce RTX 2070 Super Mobile:
157 165 [X] SCHENKER Compact 17 Intel Core i7-10875H 2.3GHz
GeForce RTX 2070 Super Mobile
min:
112 fps, P0.1:
123.8 fps, P1:
129.7 fps, max:
233.8 fps
~ 161 fps
100%
GeForce MX330:
9.6 [X] MSI Prestige 14 Intel Core i7-10510U 1.8GHz
GeForce MX330
min:
7.1 fps, P0.1:
7.2 fps, P1:
7.7 fps, max:
12.3 fps
fps
969%
GeForce RTX 2070 Super Mobile:
91 91 95.5 [X] SCHENKER Compact 17 Intel Core i7-10875H 2.3GHz
GeForce RTX 2070 Super Mobile
min:
52.2 fps, P0.1:
65.7 fps, P1:
79.8 fps, max:
128.7 fps
~ 93 fps
GeForce RTX 2070 Super Mobile:
73.6 78 [X] SCHENKER Compact 17 Intel Core i7-10875H 2.3GHz
GeForce RTX 2070 Super Mobile
min:
52.6 fps, P0.1:
58.3 fps, P1:
66.9 fps, max:
97 fps
~ 76 fps
GeForce RTX 2070 Super Mobile:
45.5 63.8 [X] SCHENKER Compact 17 Intel Core i7-10875H 2.3GHz
GeForce RTX 2070 Super Mobile
min:
40.1 fps, P0.1:
48.9 fps, P1:
53.5 fps, max:
78.2 fps
68.6 [X] SCHENKER Compact 17 Leistungsmodus
Intel Core i7-10875H 2.3GHz
GeForce RTX 2070 Super Mobile
min:
46.8 fps, P0.1:
51.6 fps, P1:
58.2 fps, max:
125.1 fps
~ 59 fps
GeForce RTX 2070 Super Mobile:
52.3 [X] SCHENKER Compact 17 Intel Core i7-10875H 2.3GHz
GeForce RTX 2070 Super Mobile
min:
36.6 fps, P0.1:
39.1 fps, P1:
44.2 fps, max:
70.7 fps
fps
GeForce RTX 2070 Super Mobile:
34.9 [X] SCHENKER Compact 17 Intel Core i7-10875H 2.3GHz
GeForce RTX 2070 Super Mobile
min:
21.3 fps, P0.1:
24.1 fps, P1:
30.5 fps, max:
42.3 fps
fps
100%
GeForce MX330:
26.2 [X] MSI Prestige 14 Intel Core i7-10510U 1.8GHz
GeForce MX330
min:
13.09 fps, P1:
19.27 fps, max:
64.13 fps
fps
427%
GeForce RTX 2070 Super Mobile:
112 [X] SCHENKER Compact 17 Intel Core i7-10875H 2.3GHz
GeForce RTX 2070 Super Mobile
min:
46 fps, P0.1:
63 fps, P1:
81 fps, max:
162 fps
112.2 ~ 112 fps
100%
GeForce MX330:
13.9 [X] MSI Prestige 14 Intel Core i7-10510U 1.8GHz
GeForce MX330
min:
9.49 fps, P1:
10.84 fps, max:
17.29 fps
fps
748%
GeForce RTX 2070 Super Mobile:
102.7 105 [X] SCHENKER Compact 17 Intel Core i7-10875H 2.3GHz
GeForce RTX 2070 Super Mobile
min:
49 fps, P0.1:
62 fps, P1:
81 fps, max:
141 fps
~ 104 fps
100%
GeForce MX330:
12 [X] MSI Prestige 14 Intel Core i7-10510U 1.8GHz
GeForce MX330
min:
8.11 fps, P1:
9.18 fps, max:
14.75 fps
fps
758%
GeForce RTX 2070 Super Mobile:
90.1 92 [X] SCHENKER Compact 17 Intel Core i7-10875H 2.3GHz
GeForce RTX 2070 Super Mobile
min:
48 fps, P0.1:
58 fps, P1:
70 fps, max:
128 fps
~ 91 fps
GeForce RTX 2070 Super Mobile:
59.3 60 [X] SCHENKER XMG Neo 17 Comet Lake Overboost
Intel Core i7-10875H 2.3GHz
GeForce RTX 2070 Super Mobile
min:
31 fps, P0.1:
42 fps, P1:
47 fps, max:
112 fps
61 [X] SCHENKER Compact 17 Intel Core i7-10875H 2.3GHz
GeForce RTX 2070 Super Mobile
min:
18 fps, P0.1:
40 fps, P1:
50 fps, max:
99 fps
64 [X] SCHENKER Compact 17 Leistungsmodus
Intel Core i7-10875H 2.3GHz
GeForce RTX 2070 Super Mobile
min:
38 fps, P0.1:
47 fps, P1:
53 fps, max:
98 fps
~ 61 fps
GeForce RTX 2070 Super Mobile:
44 [X] SCHENKER Compact 17 Intel Core i7-10875H 2.3GHz
GeForce RTX 2070 Super Mobile
min:
19 fps, P0.1:
20 fps, P1:
22 fps, max:
114 fps
fps
GeForce RTX 2070 Super Mobile:
25 [X] SCHENKER Compact 17 Intel Core i7-10875H 2.3GHz
GeForce RTX 2070 Super Mobile
min:
13 fps, P0.1:
14 fps, P1:
15 fps, max:
85 fps
fps
100%
GeForce MX330:
125 [X] MSI Prestige 14 1.5.4.5
Intel Core i7-10510U 1.8GHz
GeForce MX330
min:
6.74 fps, P1:
82.8 fps, max:
206 fps
fps
100%
GeForce MX330:
79.5 [X] MSI Prestige 14 1.5.4.5
Intel Core i7-10510U 1.8GHz
GeForce MX330
min:
15.4 fps, P1:
52.1 fps, max:
186 fps
fps
100%
GeForce MX330:
75.1 [X] MSI Prestige 14 1.5.4.5
Intel Core i7-10510U 1.8GHz
GeForce MX330
min:
36.6 fps, P1:
49.8 fps, max:
170 fps
fps
100%
GeForce MX330:
63.1 [X] MSI Prestige 14 1.5.4.5
Intel Core i7-10510U 1.8GHz
GeForce MX330
min:
40.1 fps, P1:
47 fps, max:
135 fps
fps
100%
GeForce MX330:
119 [X] MSI Prestige 14 1.5.4.5
Intel Core i7-10510U 1.8GHz
GeForce MX330
min:
21.3 fps, P1:
86.1 fps, max:
242 fps
fps
221%
GeForce RTX 2070 Super Mobile:
263.1 fps
100%
GeForce MX330:
48.6 [X] MSI Prestige 14 1.5.4.5
Intel Core i7-10510U 1.8GHz
GeForce MX330
min:
31.5 fps, P1:
37.9 fps, max:
172 fps
fps
462%
GeForce RTX 2070 Super Mobile:
224.6 fps
100%
GeForce MX330:
40.9 [X] MSI Prestige 14 1.5.4.5
Intel Core i7-10510U 1.8GHz
GeForce MX330
min:
30.9 fps, P1:
33 fps, max:
100 fps
fps
517%
GeForce RTX 2070 Super Mobile:
211.5 fps
100%
GeForce MX330:
21.8 [X] MSI Prestige 14 1.5.4.5
Intel Core i7-10510U 1.8GHz
GeForce MX330
min:
18.3 fps, P1:
19 fps, max:
29.4 fps
fps
928%
GeForce RTX 2070 Super Mobile:
202.4 fps
100%
GeForce MX330:
36.7 [X] MSI Prestige 14 1.5.4.5
Intel Core i7-10510U 1.8GHz
GeForce MX330
min:
20 fps, P1:
27.4 fps, max:
73.8 fps
fps
373%
GeForce RTX 2070 Super Mobile:
123.7 149.5 ~ 137 fps
100%
GeForce MX330:
16.5 [X] MSI Prestige 14 1.5.4.5
Intel Core i7-10510U 1.8GHz
GeForce MX330
min:
12.4 fps, P1:
13.3 fps, max:
24.6 fps
fps
612%
GeForce RTX 2070 Super Mobile:
95.2 106 ~ 101 fps
100%
GeForce MX330:
15.8 [X] MSI Prestige 14 1.5.4.5
Intel Core i7-10510U 1.8GHz
GeForce MX330
min:
12.3 fps, P1:
13.2 fps, max:
23.5 fps
fps
595%
GeForce RTX 2070 Super Mobile:
92 96.6 ~ 94 fps
100%
GeForce MX330:
85.7 [X] MSI Prestige 14 Intel Core i7-10510U 1.8GHz
GeForce MX330
min:
28.9 fps, P1:
60.9 fps, max:
230 fps
fps
152%
GeForce RTX 2070 Super Mobile:
122 124 143 [X] SCHENKER Compact 17 Intel Core i7-10875H 2.3GHz
GeForce RTX 2070 Super Mobile
min:
7.13 fps, P0.1:
24.4 fps, P1:
82.4 fps, max:
271 fps
~ 130 fps
100%
GeForce MX330:
13 [X] MSI Prestige 14 Intel Core i7-10510U 1.8GHz
GeForce MX330
min:
1.896 fps, P1:
4.24 fps, max:
76 fps
fps
746%
GeForce RTX 2070 Super Mobile:
93.7 94 102 [X] SCHENKER Compact 17 Intel Core i7-10875H 2.3GHz
GeForce RTX 2070 Super Mobile
min:
7.57 fps, P0.1:
17.8 fps, P1:
57.4 fps, max:
202 fps
~ 97 fps
100%
GeForce MX330:
8.2 [X] MSI Prestige 14 Intel Core i7-10510U 1.8GHz
GeForce MX330
min:
1.41 fps, P1:
1.734 fps, max:
73.9 fps
fps
1042%
GeForce RTX 2070 Super Mobile:
81.6 86.6 [X] SCHENKER Compact 17 Intel Core i7-10875H 2.3GHz
GeForce RTX 2070 Super Mobile
min:
16.2 fps, P0.1:
22.6 fps, P1:
45.3 fps, max:
185 fps
87.8 ~ 85 fps
GeForce RTX 2070 Super Mobile:
71.1 72.5 78 [X] SCHENKER Compact 17 Intel Core i7-10875H 2.3GHz
GeForce RTX 2070 Super Mobile
min:
4.71 fps, P0.1:
24.4 fps, P1:
46.2 fps, max:
153 fps
82.1 [X] SCHENKER Compact 17 Leistungsmodus
Intel Core i7-10875H 2.3GHz
GeForce RTX 2070 Super Mobile
min:
16.4 fps, P0.1:
30.7 fps, P1:
46.6 fps, max:
143 fps
~ 76 fps
GeForce RTX 2070 Super Mobile:
63.7 [X] SCHENKER Compact 17 Intel Core i7-10875H 2.3GHz
GeForce RTX 2070 Super Mobile
min:
17.5 fps, P0.1:
24.3 fps, P1:
36.7 fps, max:
125 fps
fps
GeForce RTX 2070 Super Mobile:
39.8 [X] SCHENKER Compact 17 Intel Core i7-10875H 2.3GHz
GeForce RTX 2070 Super Mobile
min:
8.15 fps, P0.1:
15.3 fps, P1:
22.5 fps, max:
99.7 fps
fps
100%
GeForce MX330:
61.7 [X] MSI Prestige 14 Intel Core i7-10510U 1.8GHz
GeForce MX330
min:
12.8 fps, P0.1:
13 fps, P1:
13.8 fps, max:
320 fps
fps
100%
GeForce MX330:
22.8 [X] MSI Prestige 14 Intel Core i7-10510U 1.8GHz
GeForce MX330
min:
4.99 fps, P0.1:
5.02 fps, P1:
5.7 fps, max:
231 fps
fps
100%
GeForce MX330:
11.9 [X] MSI Prestige 14 Intel Core i7-10510U 1.8GHz
GeForce MX330
min:
7.5 fps, P0.1:
8.11 fps, P1:
9.5 fps, max:
16.5 fps
fps
100%
GeForce MX330:
8.9 [X] MSI Prestige 14 Intel Core i7-10510U 1.8GHz
GeForce MX330
min:
5.38 fps, P0.1:
5.88 fps, P1:
7 fps, max:
16.8 fps
fps
100%
GeForce MX330:
28.4 [X] MSI Prestige 14 1.5.4.5
Intel Core i7-10510U 1.8GHz
GeForce MX330
min:
8.54 fps, P1:
22.5 fps, max:
49.2 fps
fps
243%
GeForce RTX 2070 Super Mobile:
66.6 71.2 ~ 69 fps
100%
GeForce MX330:
12.1 [X] MSI Prestige 14 1.5.4.5
Intel Core i7-10510U 1.8GHz
GeForce MX330
min:
6.01 fps, P1:
8.2054 fps, max:
33.3 fps
fps
496%
GeForce RTX 2070 Super Mobile:
58 61.7 ~ 60 fps
100%
GeForce MX330:
6.9 [X] MSI Prestige 14 1.5.4.5
Intel Core i7-10510U 1.8GHz
GeForce MX330
min:
4.48 fps, P1:
4.8428 fps, max:
13.9 fps
fps
737%
GeForce RTX 2070 Super Mobile:
48.8 53.3 ~ 51 fps
100%
GeForce MX330:
3.3 [X] MSI Prestige 14 1.5.4.5
Intel Core i7-10510U 1.8GHz
GeForce MX330
min:
0.848 fps, P1:
2.1328 fps, max:
13.6 fps
fps
1228%
GeForce RTX 2070 Super Mobile:
37.8 42.1 43.8 [X] SCHENKER XMG Neo 17 Comet Lake Overboost
Intel Core i7-10875H 2.3GHz
GeForce RTX 2070 Super Mobile
~ 41 fps
100%
GeForce MX330:
27 [X] MSI Prestige 14 Intel Core i7-10510U 1.8GHz
GeForce MX330
min:
10 fps
fps
541%
GeForce RTX 2070 Super Mobile:
139 152 ~ 146 fps
100%
GeForce MX330:
13 [X] MSI Prestige 14 Intel Core i7-10510U 1.8GHz
GeForce MX330
min:
7 fps
fps
908%
GeForce RTX 2070 Super Mobile:
107 129 ~ 118 fps
100%
GeForce MX330:
11 [X] MSI Prestige 14 Intel Core i7-10510U 1.8GHz
GeForce MX330
min:
5 fps
fps
955%
GeForce RTX 2070 Super Mobile:
94 116 ~ 105 fps
100%
GeForce MX330:
9 [X] MSI Prestige 14 Intel Core i7-10510U 1.8GHz
GeForce MX330
min:
4 fps
fps
944%
GeForce RTX 2070 Super Mobile:
77 79 [X] Asus Strix G17 G712LWS Turbo
Intel Core i7-10750H 2.6GHz
GeForce RTX 2070 Super Mobile
98 ~ 85 fps
100%
GeForce MX330:
33.4 [X] MSI Prestige 14 Intel Core i7-10510U 1.8GHz
GeForce MX330
min:
25 fps
fps
422%
GeForce RTX 2070 Super Mobile:
137.5 145 ~ 141 fps
100%
GeForce MX330:
14.7 [X] MSI Prestige 14 Intel Core i7-10510U 1.8GHz
GeForce MX330
min:
9 fps
fps
878%
GeForce RTX 2070 Super Mobile:
128.2 129.2 ~ 129 fps
100%
GeForce MX330:
13.7 [X] MSI Prestige 14 Intel Core i7-10510U 1.8GHz
GeForce MX330
min:
9 fps
fps
861%
GeForce RTX 2070 Super Mobile:
117.8 119.1 ~ 118 fps
100%
GeForce MX330:
13.4 [X] MSI Prestige 14 Intel Core i7-10510U 1.8GHz
GeForce MX330
min:
8 fps
fps
896%
GeForce RTX 2070 Super Mobile:
116.2 116.8 121.6 [X] SCHENKER Compact 17 Leistungsmodus
Intel Core i7-10875H 2.3GHz
GeForce RTX 2070 Super Mobile
123.8 [X] Asus Strix G17 G712LWS Turbo
Intel Core i7-10750H 2.6GHz
GeForce RTX 2070 Super Mobile
~ 120 fps
GeForce RTX 2070 Super Mobile:
81.3 fps
GeForce RTX 2070 Super Mobile:
46.9 fps
100%
GeForce MX330:
81 [X] MSI Prestige 14 Intel Core i7-10510U 1.8GHz
GeForce MX330
min:
73 fps
fps
280%
GeForce RTX 2070 Super Mobile:
227 fps
100%
GeForce MX330:
39 [X] MSI Prestige 14 Intel Core i7-10510U 1.8GHz
GeForce MX330
min:
32 fps
fps
431%
GeForce RTX 2070 Super Mobile:
168 fps
100%
GeForce MX330:
28 [X] MSI Prestige 14 Intel Core i7-10510U 1.8GHz
GeForce MX330
min:
22 fps
fps
525%
GeForce RTX 2070 Super Mobile:
147 fps
100%
GeForce MX330:
16 [X] MSI Prestige 14 Intel Core i7-10510U 1.8GHz
GeForce MX330
min:
12 fps
fps
756%
GeForce RTX 2070 Super Mobile:
118 124 [X] Asus Strix G17 G712LWS Turbo
Intel Core i7-10750H 2.6GHz
GeForce RTX 2070 Super Mobile
min:
108 fps, max:
143 fps
~ 121 fps
100%
GeForce MX330:
147 [X] MSI Prestige 14 Intel Core i7-10510U 1.8GHz
GeForce MX330
min:
135 fps
fps
100%
GeForce MX330:
118 [X] MSI Prestige 14 Intel Core i7-10510U 1.8GHz
GeForce MX330
min:
91 fps
fps
100%
GeForce MX330:
106 [X] MSI Prestige 14 Intel Core i7-10510U 1.8GHz
GeForce MX330
min:
85 fps
fps
100%
GeForce MX330:
94.6 [X] MSI Prestige 14 Intel Core i7-10510U 1.8GHz
GeForce MX330
fps
273%
GeForce RTX 2060 Max-Q:
257.9 fps
263%
GeForce RTX 2070 Super Mobile:
249.1 fps
100%
GeForce MX330:
34.5 [X] MSI Prestige 14 Intel Core i7-10510U 1.8GHz
GeForce MX330
fps
349%
GeForce RTX 2060 Max-Q:
120.4 fps
562%
GeForce RTX 2070 Super Mobile:
172.4 215 ~ 194 fps
100%
GeForce MX330:
22.1 [X] MSI Prestige 14 Intel Core i7-10510U 1.8GHz
GeForce MX330
fps
346%
GeForce RTX 2060 Max-Q:
76.4 fps
602%
GeForce RTX 2070 Super Mobile:
122.2 144 ~ 133 fps
100%
GeForce MX330:
15.9 [X] MSI Prestige 14 Intel Core i7-10510U 1.8GHz
GeForce MX330
fps
358%
GeForce RTX 2060 Max-Q:
56.9 fps
610%
GeForce RTX 2070 Super Mobile:
90 103 ~ 97 fps
GeForce RTX 2070 Super Mobile:
64.5 fps
GeForce RTX 2060 Max-Q:
18.9 fps
GeForce RTX 2070 Super Mobile:
33.3 fps
100%
GeForce MX330:
35.3 [X] MSI Prestige 14 Intel Core i7-10510U 1.8GHz
GeForce MX330
min:
22 fps
fps
499%
GeForce RTX 2060 Max-Q:
176.1 fps
643%
GeForce RTX 2070 Super Mobile:
219.1 234.1 ~ 227 fps
GeForce RTX 2060 Max-Q:
108.7 fps
GeForce RTX 2060 Max-Q:
95.7 fps
GeForce RTX 2060 Max-Q:
93.3 fps
GeForce RTX 2070 Super Mobile:
151 155.4 163.2 [X] Asus Strix G17 G712LWS Turbo
Intel Core i7-10750H 2.6GHz
GeForce RTX 2070 Super Mobile
170 190.4 ~ 166 fps
GeForce RTX 2070 Super Mobile:
118 fps
GeForce RTX 2070 Super Mobile:
61.6 fps
100%
GeForce MX330:
51.6 [X] MSI Prestige 14 Intel Core i7-10510U 1.8GHz
GeForce MX330
min:
49 fps
fps
376%
GeForce RTX 2060 Max-Q:
194.2 fps
100%
GeForce MX330:
19 [X] MSI Prestige 14 Intel Core i7-10510U 1.8GHz
GeForce MX330
min:
17 fps
fps
507%
GeForce RTX 2060 Max-Q:
96.3 fps
716%
GeForce RTX 2070 Super Mobile:
136 fps
100%
GeForce MX330:
15.1 [X] MSI Prestige 14 Intel Core i7-10510U 1.8GHz
GeForce MX330
min:
14 fps
fps
501%
GeForce RTX 2060 Max-Q:
75.7 fps
748%
GeForce RTX 2070 Super Mobile:
113 fps
GeForce RTX 2070 Super Mobile:
74 fps
GeForce RTX 2070 Super Mobile:
34.1 fps
100%
GeForce MX330:
58.2 [X] MSI Prestige 14 Intel Core i7-10510U 1.8GHz
GeForce MX330
min:
54 fps
fps
135%
GeForce RTX 2060 Max-Q:
78.5 fps
100%
GeForce MX330:
33.7 [X] MSI Prestige 14 Intel Core i7-10510U 1.8GHz
GeForce MX330
min:
26 fps
fps
203%
GeForce RTX 2060 Max-Q:
68.5 fps
359%
GeForce RTX 2070 Super Mobile:
121 fps
100%
GeForce MX330:
23.3 [X] MSI Prestige 14 Intel Core i7-10510U 1.8GHz
GeForce MX330
min:
20 fps
fps
293%
GeForce RTX 2060 Max-Q:
68.2 fps
519%
GeForce RTX 2070 Super Mobile:
121 fps
100%
GeForce MX330:
21.6 [X] MSI Prestige 14 Intel Core i7-10510U 1.8GHz
GeForce MX330
min:
19 fps
fps
395%
GeForce RTX 2060 Max-Q:
85.3 fps
560%
GeForce RTX 2070 Super Mobile:
121 fps
GeForce RTX 2070 Super Mobile:
81 fps
GeForce RTX 2070 Super Mobile:
41.4 fps
100%
GeForce MX330:
20.8 [X] MSI Prestige 14 Intel Core i7-10510U 1.8GHz
GeForce MX330
min:
16 fps
fps
100%
GeForce MX330:
15.1 [X] MSI Prestige 14 Intel Core i7-10510U 1.8GHz
GeForce MX330
min:
12 fps
fps
728%
GeForce RTX 2070 Super Mobile:
110 fps
GeForce RTX 2070 Super Mobile:
73.1 fps
GeForce RTX 2070 Super Mobile:
47.6 fps
GeForce RTX 2070 Super Mobile:
38.1 fps
GeForce RTX 2070 Super Mobile:
24.8 fps
100%
GeForce MX330:
25.7 fps
361%
GeForce RTX 2060 Max-Q:
92.9 fps
463%
GeForce RTX 2070 Super Mobile:
119 fps
100%
GeForce MX330:
21.3 fps
413%
GeForce RTX 2060 Max-Q:
88 fps
535%
GeForce RTX 2070 Super Mobile:
114 fps
100%
GeForce MX330:
8.7 fps
892%
GeForce RTX 2060 Max-Q:
77.8 fps
1239%
GeForce RTX 2070 Super Mobile:
108 fps
GeForce RTX 2070 Super Mobile:
84 fps
GeForce RTX 2070 Super Mobile:
42.5 fps
100%
GeForce MX330:
43.1 fps
239%
GeForce RTX 2060 Max-Q:
103.2 fps
100%
GeForce MX330:
22.3 fps
398%
GeForce RTX 2060 Max-Q:
88.7 fps
471%
GeForce RTX 2070 Super Mobile:
105 fps
100%
GeForce MX330:
19.7 fps
417%
GeForce RTX 2060 Max-Q:
82.2 fps
492%
GeForce RTX 2070 Super Mobile:
97 fps
GeForce RTX 2060 Max-Q:
79 fps
GeForce RTX 2070 Super Mobile:
92.4 fps
GeForce RTX 2070 Super Mobile:
81.7 fps
GeForce RTX 2070 Super Mobile:
48.1 fps
100%
GeForce MX330:
42.5 fps
100%
GeForce MX330:
23.2 fps
608%
GeForce RTX 2070 Super Mobile:
141 fps
100%
GeForce MX330:
14.5 fps
924%
GeForce RTX 2070 Super Mobile:
134 fps
100%
GeForce MX330:
13.9 fps
770%
GeForce RTX 2070 Super Mobile:
107 fps
GeForce RTX 2070 Super Mobile:
75.3 fps
GeForce RTX 2070 Super Mobile:
41.6 fps
100%
GeForce MX330:
18.3 fps
860%
GeForce RTX 2060 Max-Q:
157.4 fps
100%
GeForce MX330:
15.7 fps
697%
GeForce RTX 2060 Max-Q:
109.4 fps
1019%
GeForce RTX 2070 Super Mobile:
160 fps
100%
GeForce MX330:
14.7 fps
703%
GeForce RTX 2060 Max-Q:
103.4 fps
810%
GeForce RTX 2070 Super Mobile:
119 fps
100%
GeForce MX330:
7.4 fps
993%
GeForce RTX 2060 Max-Q:
73.5 fps
1091%
GeForce RTX 2070 Super Mobile:
80.7 fps
GeForce RTX 2070 Super Mobile:
70.2 fps
GeForce RTX 2060 Max-Q:
33.1 fps
GeForce RTX 2070 Super Mobile:
47.2 fps
100%
GeForce MX330:
22 fps
559%
GeForce RTX 2060 Max-Q:
123 fps
100%
GeForce MX330:
11 fps
745%
GeForce RTX 2060 Max-Q:
82 fps
1045%
GeForce RTX 2070 Super Mobile:
115 fps
100%
GeForce MX330:
10 fps
750%
GeForce RTX 2060 Max-Q:
75 fps
1010%
GeForce RTX 2070 Super Mobile:
101 fps
1375%
GeForce RTX 2060 Max-Q:
55 fps
1875%
GeForce RTX 2070 Super Mobile:
75 fps
GeForce RTX 2070 Super Mobile:
55 fps
GeForce RTX 2070 Super Mobile:
32 fps
100%
GeForce MX330:
124 fps
100%
GeForce MX330:
72.1 fps
388%
GeForce RTX 2070 Super Mobile:
280 fps
100%
GeForce MX330:
22.3 fps
1197%
GeForce RTX 2070 Super Mobile:
267 fps
100%
GeForce MX330:
21.2 fps
1245%
GeForce RTX 2070 Super Mobile:
264 fps
GeForce RTX 2070 Super Mobile:
262 fps
GeForce RTX 2070 Super Mobile:
211 fps
100%
GeForce MX330:
45.4 fps
258%
GeForce RTX 2060 Max-Q:
117 fps
100%
GeForce MX330:
14.2 fps
630%
GeForce RTX 2060 Max-Q:
89.5 fps
894%
GeForce RTX 2070 Super Mobile:
127 fps
100%
GeForce MX330:
12.1 fps
512%
GeForce RTX 2060 Max-Q:
61.9 fps
761%
GeForce RTX 2070 Super Mobile:
92.1 fps
100%
GeForce MX330:
8.8 fps
549%
GeForce RTX 2060 Max-Q:
48.3 fps
802%
GeForce RTX 2070 Super Mobile:
70.6 fps
GeForce RTX 2070 Super Mobile:
49.8 fps
GeForce RTX 2070 Super Mobile:
26.8 fps
100%
GeForce MX330:
44.4 fps
414%
GeForce RTX 2060 Max-Q:
183.7 fps
100%
GeForce MX330:
13.9 fps
483%
GeForce RTX 2060 Max-Q:
67.1 fps
770%
GeForce RTX 2070 Super Mobile:
107 fps
100%
GeForce MX330:
9.7 fps
519%
GeForce RTX 2060 Max-Q:
50.4 fps
831%
GeForce RTX 2070 Super Mobile:
80.8 fps
GeForce RTX 2070 Super Mobile:
52.6 fps
GeForce RTX 2070 Super Mobile:
25.6 fps
100%
GeForce MX330:
59 73 ~ 66 fps
297%
GeForce RTX 2060 Max-Q:
196 fps
100%
GeForce MX330:
17 31 ~ 24 fps
571%
GeForce RTX 2060 Max-Q:
137 fps
846%
GeForce RTX 2070 Super Mobile:
203 fps
100%
GeForce MX330:
16 24 ~ 20 fps
580%
GeForce RTX 2060 Max-Q:
116 fps
890%
GeForce RTX 2070 Super Mobile:
178 fps
100%
GeForce MX330:
13 19 ~ 16 fps
631%
GeForce RTX 2060 Max-Q:
101 fps
1063%
GeForce RTX 2070 Super Mobile:
170 fps
GeForce RTX 2070 Super Mobile:
116 fps
GeForce RTX 2070 Super Mobile:
73 fps
100%
GeForce MX330:
52.9 fps
380%
GeForce RTX 2060 Max-Q:
201.1 fps
100%
GeForce MX330:
16.1 fps
642%
GeForce RTX 2060 Max-Q:
103.3 fps
GeForce RTX 2060 Max-Q:
69.2 fps
GeForce RTX 2060 Max-Q:
50.7 fps
100%
GeForce MX330:
41.1 fps
100%
GeForce MX330:
14.6 fps
979%
GeForce RTX 2070 Super Mobile:
143 fps
100%
GeForce MX330:
13 fps
931%
GeForce RTX 2070 Super Mobile:
121 fps
100%
GeForce MX330:
12.9 fps
922%
GeForce RTX 2070 Super Mobile:
119 fps
GeForce RTX 2070 Super Mobile:
74.2 fps
GeForce RTX 2070 Super Mobile:
36.7 fps
100%
GeForce MX330:
58.2 fps
140%
GeForce RTX 2060 Max-Q:
81.5 fps
100%
GeForce MX330:
11 fps
742%
GeForce RTX 2060 Max-Q:
81.6 fps
1055%
GeForce RTX 2070 Super Mobile:
116 fps
100%
GeForce MX330:
8.6 fps
711%
GeForce RTX 2060 Max-Q:
61.4 fps
1046%
GeForce RTX 2070 Super Mobile:
90.4 fps
100%
GeForce MX330:
6.1 fps
595%
GeForce RTX 2060 Max-Q:
36.5 fps
832%
GeForce RTX 2070 Super Mobile:
51 fps
GeForce RTX 2070 Super Mobile:
44 fps
GeForce RTX 2070 Super Mobile:
23.9 fps
100%
GeForce MX330:
50 fps
308%
GeForce RTX 2060 Max-Q:
154 fps
100%
GeForce MX330:
19 fps
484%
GeForce RTX 2060 Max-Q:
92 fps
789%
GeForce RTX 2070 Super Mobile:
150 fps
925%
GeForce RTX 2060 Max-Q:
74 fps
1550%
GeForce RTX 2070 Super Mobile:
124 fps
800%
GeForce RTX 2060 Max-Q:
56 fps
1243%
GeForce RTX 2070 Super Mobile:
87 fps
GeForce RTX 2070 Super Mobile:
61 fps
GeForce RTX 2070 Super Mobile:
32 fps
100%
GeForce MX330:
94.5 fps
293%
GeForce RTX 2060 Max-Q:
276.7 fps
100%
GeForce MX330:
29.3 fps
428%
GeForce RTX 2060 Max-Q:
125.3 fps
720%
GeForce RTX 2070 Super Mobile:
211 fps
100%
GeForce MX330:
26.8 fps
393%
GeForce RTX 2060 Max-Q:
105.3 fps
664%
GeForce RTX 2070 Super Mobile:
178 fps
100%
GeForce MX330:
16.1 fps
376%
GeForce RTX 2060 Max-Q:
60.5 fps
607%
GeForce RTX 2070 Super Mobile:
97.7 fps
GeForce RTX 2070 Super Mobile:
72.4 fps
GeForce RTX 2060 Max-Q:
24.4 fps
100%
GeForce MX330:
45 fps
233%
GeForce RTX 2060 Max-Q:
105 fps
100%
GeForce MX330:
24 fps
313%
GeForce RTX 2060 Max-Q:
75 fps
463%
GeForce RTX 2070 Super Mobile:
111 fps
100%
GeForce MX330:
15 fps
467%
GeForce RTX 2060 Max-Q:
70 fps
693%
GeForce RTX 2070 Super Mobile:
104 fps
100%
GeForce MX330:
14 fps
450%
GeForce RTX 2060 Max-Q:
63 fps
671%
GeForce RTX 2070 Super Mobile:
94 fps
GeForce RTX 2070 Super Mobile:
89 fps
GeForce RTX 2070 Super Mobile:
50 fps
100%
GeForce MX330:
34.3 fps
378%
GeForce RTX 2060 Max-Q:
129.6 fps
100%
GeForce MX330:
13.3 fps
547%
GeForce RTX 2060 Max-Q:
72.7 fps
842%
GeForce RTX 2070 Super Mobile:
112 fps
100%
GeForce MX330:
10.4 fps
531%
GeForce RTX 2060 Max-Q:
55.2 fps
795%
GeForce RTX 2070 Super Mobile:
82.7 fps
100%
GeForce MX330:
7.8 fps
562%
GeForce RTX 2060 Max-Q:
43.8 fps
840%
GeForce RTX 2070 Super Mobile:
65.5 fps
GeForce RTX 2070 Super Mobile:
54.4 fps
GeForce RTX 2070 Super Mobile:
31.9 fps
100%
GeForce MX330:
67.2 fps
214%
GeForce RTX 2060 Max-Q:
143.6 fps
100%
GeForce MX330:
26.5 fps
539%
GeForce RTX 2060 Max-Q:
142.8 fps
543%
GeForce RTX 2070 Super Mobile:
144 fps
100%
GeForce MX330:
22.5 fps
561%
GeForce RTX 2060 Max-Q:
126.2 fps
640%
GeForce RTX 2070 Super Mobile:
144 fps
100%
GeForce MX330:
19.4 fps
601%
GeForce RTX 2060 Max-Q:
116.6 fps
742%
GeForce RTX 2070 Super Mobile:
144 fps
GeForce RTX 2070 Super Mobile:
121 fps
GeForce RTX 2070 Super Mobile:
66.6 fps
100%
GeForce MX330:
44.7 [X] MSI Prestige 14 Intel Core i7-10510U 1.8GHz
GeForce MX330
min:
41 fps
fps
100%
GeForce MX330:
27.4 [X] MSI Prestige 14 Intel Core i7-10510U 1.8GHz
GeForce MX330
min:
24 fps
fps
591%
GeForce RTX 2070 Super Mobile:
162 fps
100%
GeForce MX330:
20.6 [X] MSI Prestige 14 Intel Core i7-10510U 1.8GHz
GeForce MX330
min:
18 fps
fps
578%
GeForce RTX 2070 Super Mobile:
119 fps
100%
GeForce MX330:
18.2 [X] MSI Prestige 14 Intel Core i7-10510U 1.8GHz
GeForce MX330
min:
16 fps
fps
577%
GeForce RTX 2070 Super Mobile:
105 fps
GeForce RTX 2070 Super Mobile:
75 fps
GeForce RTX 2070 Super Mobile:
41.2 fps
100%
GeForce MX330:
112 [X] MSI Prestige 14 Intel Core i7-10510U 1.8GHz
GeForce MX330
min:
71 fps
fps
100%
GeForce MX330:
30.1 [X] MSI Prestige 14 Intel Core i7-10510U 1.8GHz
GeForce MX330
min:
25 fps
fps
551%
GeForce RTX 2070 Super Mobile:
166 fps
100%
GeForce MX330:
23.1 [X] MSI Prestige 14 Intel Core i7-10510U 1.8GHz
GeForce MX330
min:
20 fps
fps
610%
GeForce RTX 2070 Super Mobile:
141 fps
100%
GeForce MX330:
20.5 [X] MSI Prestige 14 Intel Core i7-10510U 1.8GHz
GeForce MX330
min:
18 fps
fps
620%
GeForce RTX 2070 Super Mobile:
127 fps
GeForce RTX 2070 Super Mobile:
88.3 fps
GeForce RTX 2070 Super Mobile:
44 fps
100%
GeForce MX330:
59.4 [X] MSI Prestige 14 Intel Core i7-10510U 1.8GHz
GeForce MX330
min:
41 fps
fps
100%
GeForce MX330:
29.4 [X] MSI Prestige 14 Intel Core i7-10510U 1.8GHz
GeForce MX330
min:
22 fps
fps
565%
GeForce RTX 2070 Super Mobile:
166 fps
100%
GeForce MX330:
23.2 [X] MSI Prestige 14 Intel Core i7-10510U 1.8GHz
GeForce MX330
min:
17 fps
fps
655%
GeForce RTX 2070 Super Mobile:
152 fps
100%
GeForce MX330:
18.7 [X] MSI Prestige 14 Intel Core i7-10510U 1.8GHz
GeForce MX330
min:
11 fps
fps
754%
GeForce RTX 2070 Super Mobile:
141 fps
GeForce RTX 2070 Super Mobile:
110 fps
GeForce RTX 2070 Super Mobile:
62.7 fps
100%
GeForce MX330:
164 [X] MSI Prestige 14 Intel Core i7-10510U 1.8GHz
GeForce MX330
min:
136 fps
fps
100%
GeForce MX330:
62.2 [X] MSI Prestige 14 Intel Core i7-10510U 1.8GHz
GeForce MX330
min:
52 fps
fps
100%
GeForce MX330:
37.5 [X] MSI Prestige 14 Intel Core i7-10510U 1.8GHz
GeForce MX330
min:
31 fps
fps
100%
GeForce MX330:
28.3 [X] MSI Prestige 14 Intel Core i7-10510U 1.8GHz
GeForce MX330
min:
23 fps
fps
100%
GeForce MX330:
37.1 [X] MSI Prestige 14 Intel Core i7-10510U 1.8GHz
GeForce MX330
min:
30 fps
fps
100%
GeForce MX330:
23.7 [X] MSI Prestige 14 Intel Core i7-10510U 1.8GHz
GeForce MX330
min:
20 fps
fps
417%
GeForce RTX 2070 Super Mobile:
98.8 fps
100%
GeForce MX330:
13.3 [X] MSI Prestige 14 Intel Core i7-10510U 1.8GHz
GeForce MX330
min:
9 fps
fps
674%
GeForce RTX 2070 Super Mobile:
89.7 fps
100%
GeForce MX330:
11 [X] MSI Prestige 14 Intel Core i7-10510U 1.8GHz
GeForce MX330
min:
5 fps
fps
750%
GeForce RTX 2070 Super Mobile:
82.5 fps
GeForce RTX 2070 Super Mobile:
78.8 fps
GeForce RTX 2070 Super Mobile:
46.4 fps
100%
GeForce MX330:
40 [X] MSI Prestige 14 Intel Core i7-10510U 1.8GHz
GeForce MX330
min:
22 fps
fps
243%
GeForce RTX 2060 Max-Q:
97 fps
100%
GeForce MX330:
19 [X] MSI Prestige 14 Intel Core i7-10510U 1.8GHz
GeForce MX330
min:
12 fps
fps
416%
GeForce RTX 2060 Max-Q:
79 fps
547%
GeForce RTX 2070 Super Mobile:
104 fps
100%
GeForce MX330:
14 [X] MSI Prestige 14 Intel Core i7-10510U 1.8GHz
GeForce MX330
min:
6 fps
fps
464%
GeForce RTX 2060 Max-Q:
65 fps
643%
GeForce RTX 2070 Super Mobile:
90 fps
100%
GeForce MX330:
7 [X] MSI Prestige 14 Intel Core i7-10510U 1.8GHz
GeForce MX330
min:
4 fps
fps
643%
GeForce RTX 2060 Max-Q:
45 fps
900%
GeForce RTX 2070 Super Mobile:
63 fps
GeForce RTX 2070 Super Mobile:
56 fps
GeForce RTX 2070 Super Mobile:
36 fps
100%
GeForce MX330:
62 fps
100%
GeForce MX330:
31 fps
100%
GeForce MX330:
22 fps
100%
GeForce MX330:
16 fps
257%
GeForce RTX 2060 Max-Q:
118 118 ~ 118 fps
298%
GeForce RTX 2070 Super Mobile:
121 153 ~ 137 fps
512%
GeForce RTX 2060 Max-Q:
84 90 ~ 87 fps
694%
GeForce RTX 2070 Super Mobile:
110 120 123 ~ 118 fps
100%
GeForce MX330:
10 12 ~ 11 fps
727%
GeForce RTX 2060 Max-Q:
75 84 ~ 80 fps
1027%
GeForce RTX 2070 Super Mobile:
107 115 118 ~ 113 fps
100%
GeForce MX330:
8 10 ~ 9 fps
778%
GeForce RTX 2060 Max-Q:
65 74 ~ 70 fps
1156%
GeForce RTX 2070 Super Mobile:
100 104 108 ~ 104 fps
GeForce RTX 2070 Super Mobile:
73 fps
GeForce RTX 2060 Max-Q:
20 fps
GeForce RTX 2070 Super Mobile:
37 fps
GeForce RTX 2060 Max-Q:
276 [X] MSI Stealth 15M A11SEK 1.47.22.14 D3D12
Intel Core i7-1185G7 3GHz
GeForce RTX 2060 Max-Q
min:
67.5 fps, P1:
216 fps, max:
474 fps
fps
GeForce RTX 2060 Max-Q:
130 [X] MSI Stealth 15M A11SEK 1.47.22.14 D3D12
Intel Core i7-1185G7 3GHz
GeForce RTX 2060 Max-Q
min:
45.5 fps, P1:
106 fps, max:
249 fps
fps
GeForce RTX 2060 Max-Q:
106 [X] MSI Stealth 15M A11SEK 1.47.22.14 D3D12
Intel Core i7-1185G7 3GHz
GeForce RTX 2060 Max-Q
min:
59.6 fps, P1:
80.8 fps, max:
194 fps
fps
GeForce RTX 2060 Max-Q:
93.1 [X] MSI Stealth 15M A11SEK 1.47.22.14 D3D12
Intel Core i7-1185G7 3GHz
GeForce RTX 2060 Max-Q
min:
26.4 fps, P1:
73.6 fps, max:
189 fps
fps
100%
GeForce MX330:
47.6 [X] MSI Prestige 14 Intel Core i7-10510U 1.8GHz
GeForce MX330
min:
39 fps
fps
220%
GeForce RTX 2060 Max-Q:
104.5 fps
100%
GeForce MX330:
19.7 [X] MSI Prestige 14 Intel Core i7-10510U 1.8GHz
GeForce MX330
min:
17 fps
fps
478%
GeForce RTX 2060 Max-Q:
94.2 fps
660%
GeForce RTX 2070 Super Mobile:
130 fps
100%
GeForce MX330:
16.8 [X] MSI Prestige 14 Intel Core i7-10510U 1.8GHz
GeForce MX330
min:
14 fps
fps
450%
GeForce RTX 2060 Max-Q:
75.6 fps
714%
GeForce RTX 2070 Super Mobile:
120 fps
100%
GeForce MX330:
13.3 [X] MSI Prestige 14 Intel Core i7-10510U 1.8GHz
GeForce MX330
min:
11 fps
fps
478%
GeForce RTX 2060 Max-Q:
63.6 fps
744%
GeForce RTX 2070 Super Mobile:
98.9 fps
GeForce RTX 2070 Super Mobile:
63.9 fps
GeForce RTX 2070 Super Mobile:
32.1 fps
100%
GeForce MX330:
47 fps
100%
GeForce MX330:
23 fps
100%
GeForce MX330:
15 fps
100%
GeForce MX330:
14 fps
750%
GeForce RTX 2070 Super Mobile:
98 112 ~ 105 fps
190%
GeForce RTX 2070 Super Mobile:
107 113 117 118 ~ 114 fps
295%
GeForce RTX 2060 Max-Q:
59.3 63.7 ~ 62 fps
100%
GeForce MX330:
49.8 [X] MSI Prestige 14 Intel Core i7-10510U 1.8GHz
GeForce MX330
min:
39 fps
fps
100%
GeForce MX330:
21.3 [X] MSI Prestige 14 Intel Core i7-10510U 1.8GHz
GeForce MX330
min:
16 fps
fps
685%
GeForce RTX 2070 Super Mobile:
146 fps
100%
GeForce MX330:
18.3 [X] MSI Prestige 14 Intel Core i7-10510U 1.8GHz
GeForce MX330
min:
14 fps
fps
650%
GeForce RTX 2070 Super Mobile:
119 fps
100%
GeForce MX330:
12.3 [X] MSI Prestige 14 Intel Core i7-10510U 1.8GHz
GeForce MX330
min:
9 fps
fps
671%
GeForce RTX 2070 Super Mobile:
82.5 fps
GeForce RTX 2070 Super Mobile:
59.7 fps
GeForce RTX 2070 Super Mobile:
31.1 fps
100%
GeForce MX330:
37.1 [X] MSI Prestige 14 Intel Core i7-10510U 1.8GHz
GeForce MX330
min:
12 fps
fps
364%
GeForce RTX 2060 Max-Q:
126 139 141 ~ 135 fps
100%
GeForce MX330:
18 [X] MSI Prestige 14 Intel Core i7-10510U 1.8GHz
GeForce MX330
min:
10 fps
fps
672%
GeForce RTX 2070 Super Mobile:
121 fps
100%
GeForce MX330:
11.2 [X] MSI Prestige 14 Intel Core i7-10510U 1.8GHz
GeForce MX330
min:
5 fps
fps
759%
GeForce RTX 2070 Super Mobile:
79.7 91.1 ~ 85 fps
GeForce RTX 2060 Max-Q:
43.6 fps
GeForce RTX 2060 Max-Q:
24.9 fps
GeForce RTX 2070 Super Mobile:
37.7 fps
100%
GeForce MX330:
95 [X] MSI Prestige 14 Intel Core i7-10510U 1.8GHz
GeForce MX330
min:
72 fps
fps
131%
GeForce RTX 2060 Max-Q:
124 fps
100%
GeForce MX330:
63.3 [X] MSI Prestige 14 Intel Core i7-10510U 1.8GHz
GeForce MX330
min:
28 fps
fps
174%
GeForce RTX 2060 Max-Q:
110.2 fps
259%
GeForce RTX 2070 Super Mobile:
164 fps
100%
GeForce MX330:
33.7 [X] MSI Prestige 14 Intel Core i7-10510U 1.8GHz
GeForce MX330
min:
26 fps
fps
319%
GeForce RTX 2060 Max-Q:
107.4 fps
463%
GeForce RTX 2070 Super Mobile:
156 fps
100%
GeForce MX330:
21 [X] MSI Prestige 14 Intel Core i7-10510U 1.8GHz
GeForce MX330
min:
16 fps
fps
387%
GeForce RTX 2060 Max-Q:
81.2 fps
614%
GeForce RTX 2070 Super Mobile:
129 fps
GeForce RTX 2070 Super Mobile:
93.4 fps
GeForce RTX 2070 Super Mobile:
47.9 fps
GeForce RTX 2060 Max-Q:
155 fps
GeForce RTX 2060 Max-Q:
123 fps
GeForce RTX 2060 Max-Q:
97 fps
GeForce RTX 2060 Max-Q:
76 fps
100%
GeForce MX330:
178 fps
139%
GeForce RTX 2060 Max-Q:
246.9 fps
100%
GeForce MX330:
59.3 fps
421%
GeForce RTX 2060 Max-Q:
249.7 fps
100%
GeForce MX330:
47.4 fps
463%
GeForce RTX 2060 Max-Q:
219.3 fps
GeForce RTX 2060 Max-Q:
299.9 fps
GeForce RTX 2060 Max-Q:
299.7 fps
GeForce RTX 2060 Max-Q:
229.7 fps
GeForce RTX 2060 Max-Q:
146.9 fps
GeForce RTX 2060 Max-Q:
125 fps
GeForce RTX 2060 Max-Q:
125 fps
GeForce RTX 2060 Max-Q:
118.2 fps
GeForce RTX 2060 Max-Q:
111.5 fps
GeForce RTX 2060 Max-Q:
100.4 fps
GeForce RTX 2060 Max-Q:
72.8 fps
GeForce RTX 2060 Max-Q:
66.8 fps
GeForce RTX 2060 Max-Q:
60 fps
GeForce RTX 2060 Max-Q:
60 fps
GeForce RTX 2060 Max-Q:
60 fps
GeForce RTX 2060 Max-Q:
59.2 fps
135%
GeForce RTX 2070 Super Mobile:
154 155 156 156 ~ 155 fps
131%
GeForce RTX 2070 Super Mobile:
136 137 141 145 ~ 140 fps
192%
GeForce RTX 2070 Super Mobile:
111 127 133 135 ~ 127 fps
214%
GeForce RTX 2070 Super Mobile:
104 122 126 129 ~ 120 fps
329%
GeForce RTX 2060 Max-Q:
75.5 83.2 ~ 79 fps
100%
GeForce MX330:
34.2 37 ~ 36 fps
100%
GeForce MX330:
11.2 12 ~ 12 fps
GeForce RTX 2060 Max-Q:
24.9 45.5 ~ 35 fps
GeForce RTX 2070 Super Mobile:
57.6 59.8 ~ 59 fps
GeForce RTX 2060 Max-Q:
173 fps
GeForce RTX 2070 Super Mobile:
182 [X] MSI GE66 Raider 10SFS Intel Core i9-10980HK 2.4GHz
GeForce RTX 2070 Super Mobile
min:
2.06 fps, P1:
143 fps, max:
272 fps
fps
GeForce RTX 2060 Max-Q:
164 fps
GeForce RTX 2070 Super Mobile:
177 [X] MSI GE66 Raider 10SFS Intel Core i9-10980HK 2.4GHz
GeForce RTX 2070 Super Mobile
min:
3.28 fps, P1:
143 fps, max:
351 fps
fps
GeForce RTX 2060 Max-Q:
119 fps
GeForce RTX 2070 Super Mobile:
163 [X] MSI GE66 Raider 10SFS Intel Core i9-10980HK 2.4GHz
GeForce RTX 2070 Super Mobile
min:
5.5 fps, P1:
100 fps, max:
300 fps
fps
GeForce RTX 2060 Max-Q:
68.2 fps
GeForce RTX 2070 Super Mobile:
94 [X] MSI GE66 Raider 10SFS Intel Core i9-10980HK 2.4GHz
GeForce RTX 2070 Super Mobile
min:
22.9 fps, P1:
62.5 fps, max:
186 fps
fps
100%
GeForce MX330:
173.9 fps
160%
GeForce RTX 2060 Max-Q:
278.3 fps
214%
GeForce RTX 2070 Super Mobile:
371.8 fps
100%
GeForce MX330:
113.8 fps
222%
GeForce RTX 2060 Max-Q:
252.3 fps
271%
GeForce RTX 2070 Super Mobile:
308.3 fps
100%
GeForce MX330:
96 fps
239%
GeForce RTX 2060 Max-Q:
229.5 fps
311%
GeForce RTX 2070 Super Mobile:
299 fps
100%
GeForce MX330:
37.9 fps
333%
GeForce RTX 2060 Max-Q:
126.2 fps
458%
GeForce RTX 2070 Super Mobile:
173.4 fps
GeForce RTX 2060 Max-Q:
130.3 fps
GeForce RTX 2060 Max-Q:
67.3 fps
GeForce RTX 2060 Max-Q:
67.4 fps
Average Gaming NVIDIA GeForce MX330 → 100% Average Gaming 30-70 fps → 100%
Average Gaming NVIDIA GeForce RTX 2060 Max-Q → 445% Average Gaming 30-70 fps → 534%
Average Gaming NVIDIA GeForce RTX 2070 Super Mobile → 687% Average Gaming 30-70 fps → 754%
 Deutsch
 English
 Español
 Français
 Italiano
 Nederlands
 Polski
 Português
 Русский
 Türkçe
 Svenska
 Chinese
 Magyar