NVIDIA GeForce MX330 vs NVIDIA GeForce RTX 2060 (Desktop) vs NVIDIA GeForce RTX 2080 Super Max-Q
NVIDIA GeForce MX330 ► remove from comparison
The Nvidia GeForce MX330 is a dedicated entry-level mobile graphics card for laptops . It was released in February 2020 and is basically a renamed Geforce MX250 / GeForce MX150 / desktop GeForce GT 1030 . It uses the same GP108 chip as the MX250 (GP108-655-A1 e.g.). It offers the same 384 CUDA cores as the MX250 and MX150 and also the clock speeds only increased slightly (+12 MHz Boost = 0.8% for the 25 Watt version). The dedicated GDDR5 graphics memory is connected via a 64 Bit memory bus and clocked at 3500 MHz (7000 MHz effective) leading to maximal bandwidth of 56 GB/s. Again there is a 25 Watt and slower 12 Watt (low power) variant.
In Nvidia drivers the GeForce MX330 appeared with the hardware ID 1D16.
The GP108 chip is manufactured in a 16 nm FinFET process and offers a number of new features, including support for DisplayPort 1.4 (ready), HDMI 2.0b, HDR and improved H.265 video de- and encoding (PlayReady 3.0). 4K HDR with Netflix however won't run due to the minimum 3 GB graphics memory that is required. Compared to the bigger Pascal chips, the small GP108 does not support Simultaneous Multi-Projection (SMP) for VR and G-Sync. A full list of improvements and the new Pascal desktop GPUs is available in our dedicated Pascal architecture article .
The performance of the GeForce MX330 should be identical to the MX150 and MX250 of previous years. See our GeForce MX250 page for gaming benchmarks . Nvidia states on the product page that the MX330 offers 2x of the performance of a Intel Iris Plus Graphics G7 in an i7-1065G7 (vs 2.5x of the MX350 ). Therefore, very demanding games like Red Dead Redemption 2 will not run smoothly, older and less demanding games like Fifa 20 or Farming Simulator 19 however should run fine in medium settings (see below for our benchmark results with different laptops). The low power version (see below) will be clearly slower however.
There is a low power version N17S-LP with a TGP of 12 Watt (up 2 Watt from 10 Watt of the LP MX250) and a "normal" 25 Watt N17S-G3. The performance of both variants should clearly differ. The low power variant offers relatively slow clock rates of 746 - 936 MHz (base - Turbo), where the 25 Watt G3 variant is clocked at 1531 - 1594 (similar to the MX250 and +70% boost clock versus the LP variant).
NVIDIA GeForce RTX 2060 (Desktop) ► remove from comparison
The NVIDIA GeForce RTX 2060 for desktops is a fast mid range graphics card in the GeForce Turing line-up. It uses a TU106 chip with 1,920 shader, 45 ROPs, 120 TMUs, 240 KI-cores and a 192 Bit memory bus that connects 6 GB of GDDR6 (clocked at 7 GHz leading to 14 GHz effective and 336 GB/s).
The mobile variant of the RTX 2060 bears the same name, but offers considerable lower clock speeds (see our RTX 2060 laptop page ).
NVIDIA manufacturers the TU106 chip on a 12 nm FinFET process and includes features like Deep Learning Super Sampling (DLSS) and Real-Time Ray Tracing (RTRT), which should combine to create more realistic lighting effects than older GPUs based on the company's Pascal architecture (if the games supports it). The RTX 2060 is also DisplayPort 1.4 ready, while there is also support for HDMI 2.0b, HDR, Simultaneous Multi-Projection (SMP) and H.265 video en/decoding (PlayReady 3.0).
The average RTX 2060 should be on par with a Radeon RX Vega 64 and between the GeForce GTX 1070 and GTX 1080 / 1070 Ti. Therefore, the RTX 2060 is most suited for 1920x1080 to 2560x1440 in demanding games.
NVIDIA specifies that the RTX 2060 should consume a maximum of 160 W and therefore clearly higher than the old GTX 1060 rated at 120 Watt.
NVIDIA GeForce RTX 2080 Super Max-Q ► remove from comparison
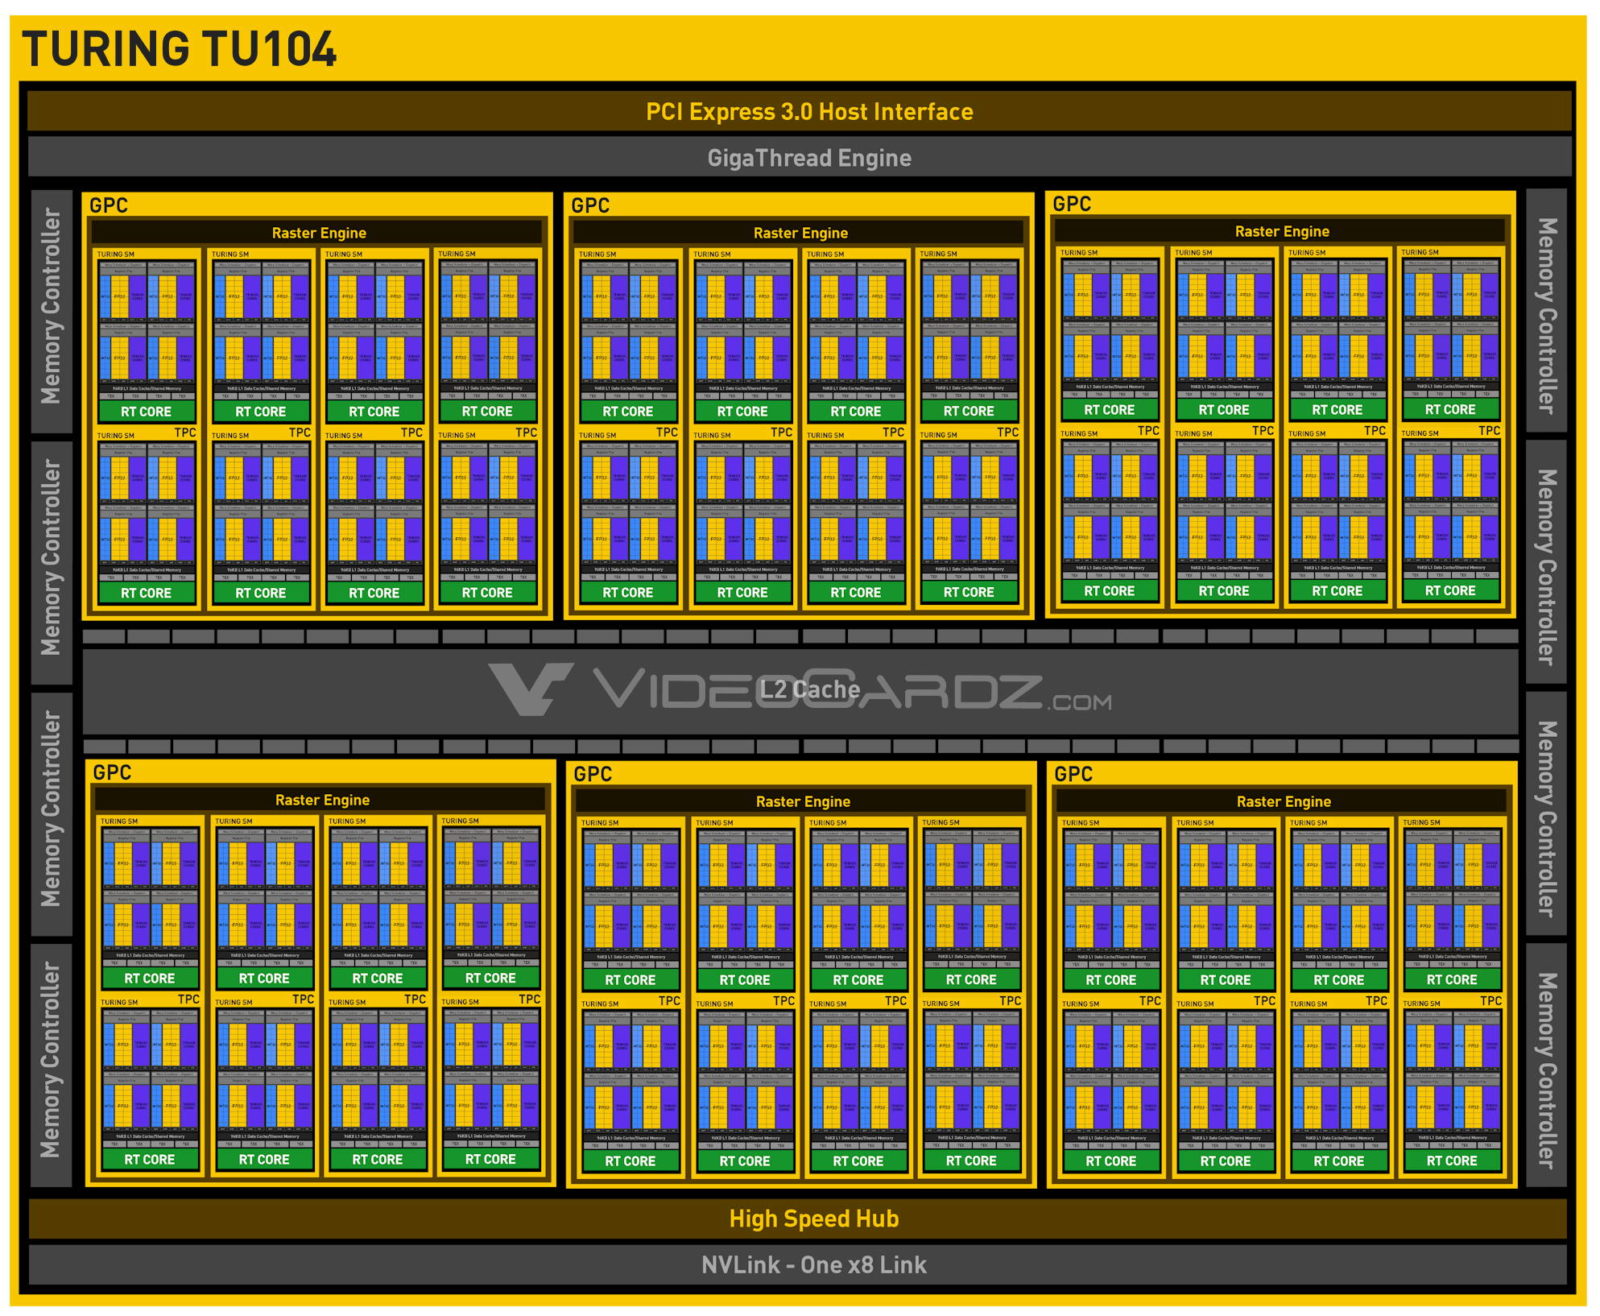
The NVIDIA GeForce RTX 2080 Super with Max-Q design is the power saving variant of the mobile GeForce RTX 2080 Super with reduced clock speeds, performance and of course power consumption. It is intended for thin gaming laptops and based on the same TU104 chip with 3,072 shaders, 8 GB GDDR6 memory and a 256 Bit memory bus.
Currently it looks like there are three variants with a TGP of 80, 85 and 90 Watt. The clock speed ranges from 735 - 975 MHz for the base clock speed and 1080 - 1230 for the boost.
With the refresh, Nvidia also reworked the Max-Q technologies for more efficiency. Low Voltage GDDR6 (lower clocked but more headroom for the GPU) and improved regulator efficiency should improve the performance per Watt. Two new optional features can also be implemented by the OEM. Max-Q Dynamic Boost is able to shift power from the CPU to the GPU on a per frame basis to increase overall performance. Furthermore, the laptop manufacturer can also implement Advanced Optimus with a dynamic display switch (hardware) to enable Optimus, G-SYNC and high refresh rate displays (up to 4K 120 Hz).
NVIDIA manufacturers the TU104 chip on a 12 nm FinFET process and includes features like Deep Learning Super Sampling (DLSS) and Real-Time Ray Tracing (RTRT), which should combine to create more realistic lighting effects than older GPUs based on the company's Pascal architecture (if the games supports it). The RTX 2080 Super Max-Q is also DisplayPort 1.4 ready, while there is also support for HDMI 2.0b, HDR, Simultaneous Multi-Projection (SMP) and H.265 video en/decoding (PlayReady 3.0).
Performance
Due to the lower clock rates, the Max-Q variant is clearly slower than the mobile RTX 2080 Super . In our benchmarks with the first devices, the performance is very similar to the old RTX 2080 Max-Q and only on a level with the non Max-Q RTX 2070 . Therefore, the performance is ideal for 1440p gaming at max details for demanding games like Red Dead Redemption 2, Control or Borderlands 3. Less demanding games like F1 2019 can be played in 4k with maximum settings. Detailed gaming benchmarks can be found at the end of this page.
The power consumption of the card is between 80 - 90 Watt TGP and therefore significantly lower than the RTX 2080 Super Mobile (150 - 200 Watt).
NVIDIA GeForce MX330 NVIDIA GeForce RTX 2060 (Desktop) NVIDIA GeForce RTX 2080 Super Max-Q GeForce RTX 2000 Series GeForce MX450 896 @ 1.4 - 1.58 GHz 64 Bit @ 10000 MHz GeForce MX350 640 @ 1.35 - 1.47 GHz 64 Bit @ 7000 MHz GeForce MX330 384 @ 1.53 - 1.59 GHz 64 Bit @ 7000 MHz
Codename N17S-LP / N17S-G3 Turing TU106 N18E-G3 Architecture Pascal Turing Turing Pipelines 384 - unified 1920 - unified 3072 - unified TMUs 32 ROPs 16 Core Speed 1531 - 1594 (Boost) MHz 1320 - 1620 (Boost) MHz 975 - 1230 (Boost) MHz Memory Speed 7000 effective = 1752 MHz 14000 MHz 11000 MHz Memory Bus Width 64 Bit 192 Bit 256 Bit Memory Type GDDR5 GDDR6 GDDR6 Shared Memory no no no Memory Bandwidth 56.1 GB/s API DirectX 12_1, OpenGL 4.6 DirectX 12_1, Shader 6.4, OpenGL 4.6 DirectX 12_1, OpenGL 4.6 Power Consumption 25 Watt (12 - 25 Watt TGP) 175 Watt 90 Watt technology 14 nm 12 nm 12 nm PCIe 3.0 Displays HDMI 2.0b, DisplayPort 1.4 Features Vulkan 1.1, OpenGL 4.6, OpenCL 1.2, GPU Boost 3.0, Multi Monitor, Optimus, GameWorks DLSS, Raytraycing, VR Ready, G-SYNC, Vulkan, Multi Monitor NVLink, DLSS, Raytraycing, VR Ready, G-SYNC, Vulkan, Multi Monitor, 650 Watt system power recommended Date of Announcement 20.02.2020 06.01.2019 02.04.2020 Link to Manufacturer Page www.nvidia.com Max. Amount of Memory 6 GB 8 GB Transistors 13.6 Billion Notebook Size large
Benchmarks Performance Rating - 3DMark 11 + Fire Strike + Time Spy - GeForce MX330
1.7 pt (5%)
...
...
max:
Performance Rating - 3DMark 11 + Fire Strike + Time Spy - GeForce RTX 2060 (Desktop)
8.8 pt (26%)
...
NVIDIA GeForce RTX 2060 (Desktop)
...
max:
3DMark - 3DMark Time Spy Score
min: 1178 avg: 1236 median: 1235.5 (4%) max: 1293 Points
7878 Points (23%)
min: 7475 avg: 8204 median: 8075 (23%) max: 9051 Points
GPU TDP ? TDP 91 W 82% 100%
3DMark - 3DMark Time Spy Graphics
min: 1059 avg: 1136 median: 1160 (3%) max: 1190 Points
7732 Points (20%)
min: 7372 avg: 8210 median: 8331 (22%) max: 8979 Points
GPU TDP ? TDP 91 W 78% 100%
3DMark - 3DMark Ice Storm Unlimited Graphics
min: 234893 avg: 243721 median: 243721 (28%) max: 252549 Points
424149 Points (48%)
min: 443119 avg: 465029 median: 468363 (53%) max: 483604 Points
3DMark - 3DMark Ice Storm Extreme Graphics
min: 32370 avg: 49651 median: 49651 (6%) max: 66932 Points
305160 Points (39%)
3DMark - 3DMark Cloud Gate Score
min: 12137 avg: 14691 median: 15382 (16%) max: 16555 Points
44523 Points (48%)
min: 32880 avg: 42751 median: 44534 (48%) max: 53680 Points
3DMark - 3DMark Cloud Gate Graphics
min: 15595 avg: 19968 median: 20729 (5%) max: 23580 Points
107083 Points (28%)
min: 101976 avg: 126108 median: 127741 (34%) max: 140750 Points
3DMark - 3DMark Fire Strike Standard Score
min: 3308 avg: 3436 median: 3470 (6%) max: 3530 Points
16267 Points (29%)
min: 17053 avg: 18565 median: 18578.5 (33%) max: 20173 Points
GPU TDP ? TDP 91 W 77% 100%
3DMark - 3DMark Fire Strike Standard Graphics
min: 3581 avg: 3727 median: 3762 (4%) max: 3838 Points
19338 Points (22%)
min: 19655 avg: 21743 median: 21902.5 (25%) max: 23649 Points
GPU TDP ? TDP 91 W 77% 100%
3DMark - 3DMark Ice Storm Graphics
min: 21238 avg: 45268 median: 45267.5 (5%) max: 69297 Points
333335 Points (40%)
3DMark - 3DMark Night Raid
12842 Points (12%)
3DMark - 3DMark Night Raid Graphics Score
15787 Points (6%)
3DMark 11 - 3DM11 Performance Score
min: 4898 avg: 5080 median: 5121.5 (7%) max: 5180 Points
min: 22018 avg: 22982 median: 22982 (32%) max: 23946 Points
min: 20888 avg: 23821 median: 24119 (33%) max: 26066 Points
GPU TDP ? TDP 91 W 71% 100%
3DMark 11 - 3DM11 Performance GPU
min: 4616 avg: 4787 median: 4834 (4%) max: 4863 Points
min: 26413 avg: 27163 median: 27162.5 (23%) max: 27912 Points
min: 26292 avg: 29663 median: 29636.5 (25%) max: 32995 Points
GPU TDP ? TDP 91 W 73% 100%
3DMark Vantage + NVIDIA GeForce RTX 2060 (Desktop) 3DMark Vantage - 3DM Vant. Perf. total
60454 Points (18%)
3DM Vant. Perf. total + NVIDIA GeForce RTX 2080 Super Max-Q
60306 Points (17%)
3DM Vant. Perf. GPU no PhysX + NVIDIA GeForce RTX 2060 (Desktop) 3DMark Vantage - 3DM Vant. Perf. GPU no PhysX
60862 Points (35%)
3DM Vant. Perf. GPU no PhysX + NVIDIA GeForce RTX 2080 Super Max-Q
69467 Points (39%)
3DMark 03 - 3DMark 03 - Standard
125706 Points (66%)
3DMark 05 - 3DMark 05 - Standard
34679 Points (38%)
3DMark 06 3DMark 06 - Standard 1280x1024 + NVIDIA GeForce RTX 2060 (Desktop)
33727 Points (44%)
3DMark 06 - Standard 1280x1024 + NVIDIA GeForce RTX 2080 Super Max-Q
38265 Points (50%)
Unigine Valley 1.0 - Unigine Valley 1.0 DX
18.1 fps (6%)
91.2 fps (30%)
SPECviewperf 12 + NVIDIA GeForce MX330 SPECviewperf 12 - specvp12 sw-03
26.5 fps (7%)
specvp12 sw-03 + NVIDIA GeForce RTX 2060 (Desktop)
57.6 fps (14%)
specvp12 snx-02 + NVIDIA GeForce MX330 SPECviewperf 12 - specvp12 snx-02
3.4 fps (1%)
specvp12 snx-02 + NVIDIA GeForce RTX 2060 (Desktop)
8.4 fps (1%)
specvp12 showcase-01 + NVIDIA GeForce MX330 SPECviewperf 12 - specvp12 showcase-01
16.5 fps (4%)
specvp12 showcase-01 + NVIDIA GeForce RTX 2060 (Desktop)
101 fps (22%)
specvp12 mediacal-01 + NVIDIA GeForce MX330 SPECviewperf 12 - specvp12 mediacal-01
10.5 fps (3%)
specvp12 mediacal-01 + NVIDIA GeForce RTX 2060 (Desktop)
35.2 fps (9%)
specvp12 maya-04 + NVIDIA GeForce MX330 SPECviewperf 12 - specvp12 maya-04
27.1 fps (7%)
specvp12 maya-04 + NVIDIA GeForce RTX 2060 (Desktop)
127.4 fps (35%)
specvp12 energy-01 + NVIDIA GeForce MX330 SPECviewperf 12 - specvp12 energy-01
0.5 fps (0%)
specvp12 energy-01 + NVIDIA GeForce RTX 2060 (Desktop)
9.2 fps (8%)
specvp12 creo-01 + NVIDIA GeForce MX330 SPECviewperf 12 - specvp12 creo-01
12.2 fps (5%)
specvp12 creo-01 + NVIDIA GeForce RTX 2060 (Desktop)
44.5 fps (18%)
specvp12 catia-04 + NVIDIA GeForce MX330 SPECviewperf 12 - specvp12 catia-04
17.7 fps (3%)
specvp12 catia-04 + NVIDIA GeForce RTX 2060 (Desktop)
74.8 fps (12%)
specvp12 3dsmax-05 + NVIDIA GeForce MX330 SPECviewperf 12 - specvp12 3dsmax-05
27.1 fps (5%)
specvp12 3dsmax-05 + NVIDIA GeForce RTX 2060 (Desktop)
183.6 fps (32%)
SPECviewperf 13 specvp13 sw-04 + NVIDIA GeForce MX330 SPECviewperf 13 - specvp13 sw-04
37.3 fps (10%)
specvp13 sw-04 + NVIDIA GeForce RTX 2060 (Desktop)
83.4 fps (22%)
specvp13 sw-04 + NVIDIA GeForce RTX 2080 Super Max-Q
min: 88.7 avg: 88.8 median: 88.8 (24%) max: 88.9 fps
specvp13 snx-03 + NVIDIA GeForce MX330 SPECviewperf 13 - specvp13 snx-03
6.1 fps (1%)
specvp13 snx-03 + NVIDIA GeForce RTX 2060 (Desktop)
15 fps (2%)
specvp13 snx-03 + NVIDIA GeForce RTX 2080 Super Max-Q
min: 20.88 avg: 21.1 median: 21.1 (2%) max: 21.33 fps
specvp13 showcase-02 + NVIDIA GeForce MX330 SPECviewperf 13 - specvp13 showcase-02
16.5 fps (4%)
specvp13 showcase-02 + NVIDIA GeForce RTX 2060 (Desktop)
101.6 fps (22%)
specvp13 showcase-02 + NVIDIA GeForce RTX 2080 Super Max-Q
96.2 fps (21%)
specvp13 medical-02 + NVIDIA GeForce MX330 SPECviewperf 13 - specvp13 medical-02
10.9 fps (2%)
specvp13 medical-02 + NVIDIA GeForce RTX 2060 (Desktop)
49.1 fps (10%)
specvp13 medical-02 + NVIDIA GeForce RTX 2080 Super Max-Q
min: 53.1 avg: 55.5 median: 55.5 (12%) max: 57.9 fps
specvp13 maya-05 + NVIDIA GeForce MX330 SPECviewperf 13 - specvp13 maya-05
47.5 fps (5%)
specvp13 maya-05 + NVIDIA GeForce RTX 2060 (Desktop)
247 fps (28%)
specvp13 maya-05 + NVIDIA GeForce RTX 2080 Super Max-Q
min: 210.2 avg: 212.8 median: 212.8 (24%) max: 215.4 fps
specvp13 energy-02 + NVIDIA GeForce MX330 SPECviewperf 13 - specvp13 energy-02
0.5 fps (0%)
specvp13 energy-02 + NVIDIA GeForce RTX 2060 (Desktop)
7.6 fps (2%)
specvp13 energy-02 + NVIDIA GeForce RTX 2080 Super Max-Q
min: 17.49 avg: 17.7 median: 17.7 (6%) max: 17.92 fps
specvp13 creo-02 + NVIDIA GeForce MX330 SPECviewperf 13 - specvp13 creo-02
26.4 fps (4%)
specvp13 creo-02 + NVIDIA GeForce RTX 2060 (Desktop)
169.8 fps (25%)
specvp13 creo-02 + NVIDIA GeForce RTX 2080 Super Max-Q
min: 170 avg: 173.6 median: 173.6 (25%) max: 177.2 fps
specvp13 catia-05 + NVIDIA GeForce MX330 SPECviewperf 13 - specvp13 catia-05
25.8 fps (3%)
specvp13 catia-05 + NVIDIA GeForce RTX 2060 (Desktop)
108.2 fps (12%)
specvp13 catia-05 + NVIDIA GeForce RTX 2080 Super Max-Q
min: 132.3 avg: 136.4 median: 136.4 (15%) max: 140.4 fps
specvp13 3dsmax-06 + NVIDIA GeForce MX330 SPECviewperf 13 - specvp13 3dsmax-06
26.8 fps (5%)
specvp13 3dsmax-06 + NVIDIA GeForce RTX 2060 (Desktop)
184.4 fps (32%)
specvp13 3dsmax-06 + NVIDIA GeForce RTX 2080 Super Max-Q
min: 175.5 avg: 176.1 median: 176.1 (31%) max: 176.6 fps
Cinebench R10 Cinebench R10 Shading (32bit) + NVIDIA GeForce RTX 2080 Super Max-Q Cinebench R10 - Cinebench R10 Shading (32bit)
13620 Points (10%)
Cinebench R11.5 Cinebench R11.5 OpenGL 64 Bit + NVIDIA GeForce RTX 2080 Super Max-Q Cinebench R11.5 - Cinebench R11.5 OpenGL 64 Bit
82.1 fps (28%)
Cinebench R15 + NVIDIA GeForce MX330 Cinebench R15 - Cinebench R15 OpenGL 64 Bit
min: 93.4 avg: 98.2 median: 98.2 (6%) max: 103 fps
Cinebench R15 OpenGL 64 Bit + NVIDIA GeForce RTX 2080 Super Max-Q
min: 114 avg: 140.1 median: 142 (8%) max: 152.1 fps
GPU TDP ? TDP 91 W 96% 100%
Cinebench R15 OpenGL Ref. Match 64 Bit + NVIDIA GeForce MX330 Cinebench R15 - Cinebench R15 OpenGL Ref. Match 64 Bit
99.6 % (100%)
Cinebench R15 OpenGL Ref. Match 64 Bit + NVIDIA GeForce RTX 2080 Super Max-Q
99.6 % (100%)
GPU TDP ? TDP 91 W 100% 100%
GFXBench - GFXBench Car Chase Offscreen
368.4 fps (41%)
LuxMark v2.0 64Bit - LuxMark v2.0 Room GPU
735 Samples/s (3%)
2586 Samples/s (12%)
LuxMark v2.0 64Bit - LuxMark v2.0 Sala GPU
1047 Samples/s (2%)
5655 Samples/s (10%)
ComputeMark v2.1 - ComputeMark v2.1 Result
2890 Points (3%)
14375 Points (16%)
16221 Points (18%)
Power Consumption - Furmark Stress Test Power Consumption - external Monitor *
min: 45 avg: 49.9 median: 49.9 (7%) max: 54.8 Watt
295.2 Watt (42%)
161 Watt (23%)
GPU TDP ? TDP 91 W 105% 100%
Power Consumption - The Witcher 3 Power Consumption - external Monitor *
min: 48.3 avg: 73.6 median: 73.6 (10%) max: 98.8 Watt
288.8 Watt (40%)
149 Watt (21%)
GPU TDP ? TDP 91 W 101% 100%
Power Consumption - Witcher 3 Power Consumption *
min: 53 avg: 57.6 median: 57.6 (13%) max: 62.2 Watt
min: 140 avg: 150.1 median: 146.1 (32%) max: 170 Watt
GPU TDP ? TDP 91 W 110% 100%
Power Consumption - Witcher 3 ultra Power Efficiency
0.2 fps per Watt (20%)
min: 0.4418 avg: 0.6 median: 0.6 (51%) max: 0.635 fps per Watt
GPU TDP ? TDP 91 W 91% 100%
Power Consumption - Witcher 3 ultra Power Efficiency - external Monitor
0.2 fps per Watt (19%)
0.3 fps per Watt (21%)
0.6 fps per Watt (49%)
GPU TDP ? TDP 91 W 41% 100%
Emissions Witcher 3 Fan Noise + NVIDIA GeForce MX330 Emissions - Witcher 3 Fan Noise
min: 34.2 avg: 39.1 median: 39.1 (63%) max: 43.9 dB(A)
Witcher 3 Fan Noise + NVIDIA GeForce RTX 2080 Super Max-Q
min: 41 avg: 48.1 median: 48 (77%) max: 54 dB(A)
GPU TDP ? TDP 91 W 84% 100%
Clock Speed - GPU Clock Witcher 3 ultra
1683 MHz (66%)
min: 1215 avg: 1371 median: 1387.5 (54%) max: 1506 MHz
GPU TDP ? TDP 91 W 93% 100%
Clock Speed - GPU Clock Speed Furmark
1403 MHz (56%)
819 MHz (32%)
GPU TDP ? TDP 91 W 100% 58%
Average Benchmarks NVIDIA GeForce MX330 → 100% n=19 Average Benchmarks NVIDIA GeForce RTX 2060 (Desktop) → 534% n=19 Average Benchmarks NVIDIA GeForce RTX 2080 Super Max-Q → 674% n=19
- Range of benchmark values for this graphics card
- Average benchmark values for this graphics card
* Smaller numbers mean a higher performance
1 This benchmark is not used for the average calculation
Game Benchmarks The following benchmarks stem from our benchmarks of review laptops. The performance depends on the used graphics memory, clock rate, processor, system settings, drivers, and operating systems. So the results don't have to be representative for all laptops with this GPU. For detailed information on the benchmark results, click on the fps number.
100%
GeForce MX330:
26 [X] MSI Prestige 14 Intel Core i7-10510U 1.8GHz
GeForce MX330
min:
9.35 fps, P0.1:
9.81 fps, P1:
17.3 fps, max:
78 fps
fps
100%
GeForce MX330:
20.9 [X] MSI Prestige 14 Intel Core i7-10510U 1.8GHz
GeForce MX330
min:
4.65 fps, P0.1:
5.59 fps, P1:
12.2 fps, max:
76.4 fps
fps
100%
GeForce MX330:
14.6 [X] MSI Prestige 14 Intel Core i7-10510U 1.8GHz
GeForce MX330
min:
3.31 fps, P0.1:
3.75 fps, P1:
7.26 fps, max:
69.5 fps
fps
100%
GeForce MX330:
18.8 [X] MSI Prestige 14 Intel Core i7-10510U 1.8GHz
GeForce MX330
min:
12 fps
fps
100%
GeForce MX330:
15 [X] MSI Prestige 14 Intel Core i7-10510U 1.8GHz
GeForce MX330
min:
9 fps
fps
100%
GeForce MX330:
14.4 [X] MSI Prestige 14 Intel Core i7-10510U 1.8GHz
GeForce MX330
min:
6 fps
fps
100%
GeForce MX330:
19.7 [X] MSI Prestige 14 Intel Core i7-10510U 1.8GHz
GeForce MX330
min:
14 fps, P0.1:
14.2 fps, P1:
15.2 fps, max:
30.7 fps
fps
100%
GeForce MX330:
9.2 [X] MSI Prestige 14 Intel Core i7-10510U 1.8GHz
GeForce MX330
min:
4.88 fps, P0.1:
5.55 fps, P1:
6.39 fps, max:
15.5 fps
fps
100%
GeForce MX330:
6.2 [X] MSI Prestige 14 Intel Core i7-10510U 1.8GHz
GeForce MX330
min:
2.23 fps, P0.1:
2.83 fps, P1:
3.92 fps, max:
34.9 fps
fps
100%
GeForce MX330:
5.1 [X] MSI Prestige 14 Intel Core i7-10510U 1.8GHz
GeForce MX330
min:
1.875 fps, P0.1:
2.04 fps, P1:
2.69 fps, max:
16 fps
fps
100%
GeForce MX330:
36 [X] MSI Prestige 14 Intel Core i7-10510U 1.8GHz
GeForce MX330
min:
16 fps
fps
100%
GeForce MX330:
15 [X] MSI Prestige 14 Intel Core i7-10510U 1.8GHz
GeForce MX330
min:
9 fps
fps
100%
GeForce MX330:
9 [X] MSI Prestige 14 Intel Core i7-10510U 1.8GHz
GeForce MX330
min:
6 fps
fps
100%
GeForce MX330:
8 [X] MSI Prestige 14 Intel Core i7-10510U 1.8GHz
GeForce MX330
min:
3 fps
fps
100%
GeForce MX330:
44.3 [X] MSI Prestige 14 Intel Core i7-10510U 1.8GHz
GeForce MX330
min:
24.7 fps, P0.1:
24.8 fps, P1:
29.1 fps, max:
96.1 fps
fps
100%
GeForce MX330:
15.7 [X] MSI Prestige 14 Intel Core i7-10510U 1.8GHz
GeForce MX330
min:
9.07 fps, P0.1:
9.09 fps, P1:
9.46 fps, max:
44.6 fps
fps
625%
GeForce RTX 2060 (Desktop):
98.1 [X] MSI GeForce RTX 2060 Intel Core i9-9900K 3.6GHz
GeForce RTX 2060 (Desktop)
min:
49.4 fps, P0.1:
54.4 fps, P1:
64.7 fps, max:
162 fps
fps
100%
GeForce MX330:
15.4 [X] MSI Prestige 14 Intel Core i7-10510U 1.8GHz
GeForce MX330
min:
7.99 fps, P0.1:
8.3 fps, P1:
8.81 fps, max:
43.2 fps
fps
620%
GeForce RTX 2060 (Desktop):
95.5 [X] MSI GeForce RTX 2060 Intel Core i9-9900K 3.6GHz
GeForce RTX 2060 (Desktop)
min:
16.7 fps, P0.1:
55.2 fps, P1:
61.8 fps, max:
167 fps
fps
100%
GeForce MX330:
13.4 [X] MSI Prestige 14 Intel Core i7-10510U 1.8GHz
GeForce MX330
min:
6.59 fps, P0.1:
6.62 fps, P1:
7.27 fps, max:
43 fps
fps
601%
GeForce RTX 2060 (Desktop):
80.5 [X] MSI GeForce RTX 2060 Intel Core i9-9900K 3.6GHz
GeForce RTX 2060 (Desktop)
min:
42.4 fps, P0.1:
47.5 fps, P1:
50.8 fps, max:
148 fps
fps
GeForce RTX 2060 (Desktop):
54.2 [X] MSI GeForce RTX 2060 Intel Core i9-9900K 3.6GHz
GeForce RTX 2060 (Desktop)
min:
28.4 fps, P0.1:
34.5 fps, P1:
36.8 fps, max:
105 fps
fps
GeForce RTX 2060 (Desktop):
27.8 [X] MSI GeForce RTX 2060 Intel Core i9-9900K 3.6GHz
GeForce RTX 2060 (Desktop)
min:
15.3 fps, P0.1:
15.5 fps, P1:
16.3 fps, max:
79.5 fps
fps
100%
GeForce MX330:
35.3 [X] MSI Prestige 14 Intel Core i7-10510U 1.8GHz
GeForce MX330
min:
20.8 fps, P0.1:
22.7 fps, P1:
25.3 fps, max:
86.4 fps
fps
100%
GeForce MX330:
12.7 [X] MSI Prestige 14 Intel Core i7-10510U 1.8GHz
GeForce MX330
min:
10 fps, P0.1:
10.1 fps, P1:
10.4 fps, max:
19.5 fps
fps
751%
GeForce RTX 2060 (Desktop):
95.4 [X] MSI GeForce RTX 2060 Intel Core i9-9900K 3.6GHz
GeForce RTX 2060 (Desktop)
min:
53.1 fps, P0.1:
66 fps, P1:
75.6 fps, max:
321 fps
fps
100%
GeForce MX330:
8.1 [X] MSI Prestige 14 Intel Core i7-10510U 1.8GHz
GeForce MX330
min:
7.95 fps, P0.1:
7.96 fps, P1:
8.26 fps, max:
13.8 fps
fps
998%
GeForce RTX 2060 (Desktop):
80.7 [X] MSI GeForce RTX 2060 Intel Core i9-9900K 3.6GHz
GeForce RTX 2060 (Desktop)
min:
41.9 fps, P0.1:
60.2 fps, P1:
64.2 fps, max:
278 fps
fps
GeForce RTX 2060 (Desktop):
67.1 [X] MSI GeForce RTX 2060 Intel Core i9-9900K 3.6GHz
GeForce RTX 2060 (Desktop)
min:
28 fps, P0.1:
46.2 fps, P1:
51.4 fps, max:
229 fps
fps
GeForce RTX 2060 (Desktop):
46.9 [X] MSI GeForce RTX 2060 Intel Core i9-9900K 3.6GHz
GeForce RTX 2060 (Desktop)
min:
26.3 fps, P0.1:
35 fps, P1:
38.3 fps, max:
112 fps
fps
GeForce RTX 2060 (Desktop):
21.5 [X] MSI GeForce RTX 2060 Intel Core i9-9900K 3.6GHz
GeForce RTX 2060 (Desktop)
min:
15.7 fps, P0.1:
16.2 fps, P1:
16.9 fps, max:
28.9 fps
fps
100%
GeForce MX330:
18 [X] MSI Prestige 14 Intel Core i7-10510U 1.8GHz
GeForce MX330
P0.1:
5 fpsP1:
fps
fps
100%
GeForce MX330:
9 [X] MSI Prestige 14 Intel Core i7-10510U 1.8GHz
GeForce MX330
P0.1:
6 fpsP1:
fps
fps
878%
GeForce RTX 2060 (Desktop):
79 [X] MSI GeForce RTX 2060 Intel Core i9-9900K 3.6GHz
GeForce RTX 2060 (Desktop)
P0.1:
44 fpsP1:
fps
fps
100%
GeForce MX330:
8 [X] MSI Prestige 14 Intel Core i7-10510U 1.8GHz
GeForce MX330
P0.1:
5 fpsP1:
fps
fps
800%
GeForce RTX 2060 (Desktop):
64 [X] MSI GeForce RTX 2060 Intel Core i9-9900K 3.6GHz
GeForce RTX 2060 (Desktop)
P0.1:
9 fpsP1:
fps
fps
GeForce RTX 2060 (Desktop):
55 [X] MSI GeForce RTX 2060 Intel Core i9-9900K 3.6GHz
GeForce RTX 2060 (Desktop)
P0.1:
38 fpsP1:
fps
fps
GeForce RTX 2060 (Desktop):
42 [X] MSI GeForce RTX 2060 Intel Core i9-9900K 3.6GHz
GeForce RTX 2060 (Desktop)
P0.1:
26 fpsP1:
fps
fps
GeForce RTX 2060 (Desktop):
24 [X] MSI GeForce RTX 2060 Intel Core i9-9900K 3.6GHz
GeForce RTX 2060 (Desktop)
P0.1:
17 fpsP1:
fps
fps
100%
GeForce MX330:
37.1 [X] MSI Prestige 14 Intel Core i7-10510U 1.8GHz
GeForce MX330
min:
23.6 fps, P0.1:
26.8 fps, P1:
29.4 fps, max:
56.1 fps
fps
100%
GeForce MX330:
9.6 [X] MSI Prestige 14 Intel Core i7-10510U 1.8GHz
GeForce MX330
min:
7.1 fps, P0.1:
7.2 fps, P1:
7.7 fps, max:
12.3 fps
fps
896%
GeForce RTX 2060 (Desktop):
86 [X] MSI GeForce RTX 2060 Intel Core i9-9900K 3.6GHz
GeForce RTX 2060 (Desktop)
min:
20.7 fps, P0.1:
63.1 fps, P1:
73.7 fps, max:
147.6 fps
fps
GeForce RTX 2060 (Desktop):
68.9 [X] MSI GeForce RTX 2060 Intel Core i9-9900K 3.6GHz
GeForce RTX 2060 (Desktop)
min:
20.1 fps, P0.1:
50.2 fps, P1:
60.4 fps, max:
122.5 fps
fps
GeForce RTX 2060 (Desktop):
40.6 [X] MSI GeForce RTX 2060 Intel Core i9-9900K 3.6GHz
GeForce RTX 2060 (Desktop)
min:
19.8 fps, P0.1:
31 fps, P1:
33.7 fps, max:
50.9 fps
fps
GeForce RTX 2060 (Desktop):
35.2 [X] MSI GeForce RTX 2060 Intel Core i9-9900K 3.6GHz
GeForce RTX 2060 (Desktop)
min:
19.4 fps, P0.1:
27.4 fps, P1:
29.7 fps, max:
42.9 fps
fps
GeForce RTX 2060 (Desktop):
26.4 [X] MSI GeForce RTX 2060 Intel Core i9-9900K 3.6GHz
GeForce RTX 2060 (Desktop)
min:
18.8 fps, P0.1:
19.8 fps, P1:
22.7 fps, max:
30.6 fps
fps
100%
GeForce MX330:
26.2 [X] MSI Prestige 14 Intel Core i7-10510U 1.8GHz
GeForce MX330
min:
13.09 fps, P1:
19.27 fps, max:
64.13 fps
fps
100%
GeForce MX330:
13.9 [X] MSI Prestige 14 Intel Core i7-10510U 1.8GHz
GeForce MX330
min:
9.49 fps, P1:
10.84 fps, max:
17.29 fps
fps
727%
GeForce RTX 2060 (Desktop):
101 [X] MSI GeForce RTX 2060 Intel Core i9-9900K 3.6GHz
GeForce RTX 2060 (Desktop)
min:
24.46 fps, P1:
76.42 fps, max:
146.37 fps
fps
100%
GeForce MX330:
12 [X] MSI Prestige 14 Intel Core i7-10510U 1.8GHz
GeForce MX330
min:
8.11 fps, P1:
9.18 fps, max:
14.75 fps
fps
728%
GeForce RTX 2060 (Desktop):
87.4 [X] MSI GeForce RTX 2060 Intel Core i9-9900K 3.6GHz
GeForce RTX 2060 (Desktop)
min:
31.57 fps, P1:
65.79 fps, max:
133.96 fps
fps
GeForce RTX 2060 (Desktop):
45.3 [X] MSI GeForce RTX 2060 Intel Core i9-9900K 3.6GHz
GeForce RTX 2060 (Desktop)
min:
14.9 fps, P1:
18.44 fps, max:
121.44 fps
fps
GeForce RTX 2060 (Desktop):
30.3 [X] MSI GeForce RTX 2060 Intel Core i9-9900K 3.6GHz
GeForce RTX 2060 (Desktop)
min:
12.85 fps, P1:
14.85 fps, max:
97.52 fps
fps
GeForce RTX 2060 (Desktop):
17.4 [X] MSI GeForce RTX 2060 Intel Core i9-9900K 3.6GHz
GeForce RTX 2060 (Desktop)
min:
9.45 fps, P1:
10.44 fps, max:
60.75 fps
fps
100%
GeForce MX330:
125 [X] MSI Prestige 14 1.5.4.5
Intel Core i7-10510U 1.8GHz
GeForce MX330
min:
6.74 fps, P1:
82.8 fps, max:
206 fps
fps
208%
GeForce RTX 2060 (Desktop):
260 [X] MSI GeForce RTX 2060 1.5.4.5
Intel Core i9-9900K 3.6GHz
GeForce RTX 2060 (Desktop)
min:
10.2 fps, P1:
182 fps, max:
363 fps
fps
100%
GeForce MX330:
79.5 [X] MSI Prestige 14 1.5.4.5
Intel Core i7-10510U 1.8GHz
GeForce MX330
min:
15.4 fps, P1:
52.1 fps, max:
186 fps
fps
319%
GeForce RTX 2060 (Desktop):
254 [X] MSI GeForce RTX 2060 1.5.4.5
Intel Core i9-9900K 3.6GHz
GeForce RTX 2060 (Desktop)
min:
14.2 fps, P1:
178 fps, max:
354 fps
fps
100%
GeForce MX330:
75.1 [X] MSI Prestige 14 1.5.4.5
Intel Core i7-10510U 1.8GHz
GeForce MX330
min:
36.6 fps, P1:
49.8 fps, max:
170 fps
fps
325%
GeForce RTX 2060 (Desktop):
244 [X] MSI GeForce RTX 2060 1.5.4.5
Intel Core i9-9900K 3.6GHz
GeForce RTX 2060 (Desktop)
min:
51.6 fps, P1:
171 fps, max:
335 fps
fps
100%
GeForce MX330:
63.1 [X] MSI Prestige 14 1.5.4.5
Intel Core i7-10510U 1.8GHz
GeForce MX330
min:
40.1 fps, P1:
47 fps, max:
135 fps
fps
380%
GeForce RTX 2060 (Desktop):
240 [X] MSI GeForce RTX 2060 1.5.4.5
Intel Core i9-9900K 3.6GHz
GeForce RTX 2060 (Desktop)
min:
18 fps, P1:
171 fps, max:
329 fps
fps
GeForce RTX 2060 (Desktop):
236 [X] MSI GeForce RTX 2060 1.5.4.5
Intel Core i9-9900K 3.6GHz
GeForce RTX 2060 (Desktop)
min:
98.6 fps, P1:
165 fps, max:
314 fps
fps
GeForce RTX 2060 (Desktop):
171 [X] MSI GeForce RTX 2060 1.5.4.5
Intel Core i9-9900K 3.6GHz
GeForce RTX 2060 (Desktop)
min:
78.7 fps, P1:
124 fps, max:
267 fps
fps
100%
GeForce MX330:
119 [X] MSI Prestige 14 1.5.4.5
Intel Core i7-10510U 1.8GHz
GeForce MX330
min:
21.3 fps, P1:
86.1 fps, max:
242 fps
fps
313%
GeForce RTX 2060 (Desktop):
373 [X] MSI GeForce RTX 2060 1.5.4.5
Intel Core i9-9900K 3.6GHz
GeForce RTX 2060 (Desktop)
min:
131 fps, P1:
244 fps, max:
564 fps
fps
100%
GeForce MX330:
48.6 [X] MSI Prestige 14 1.5.4.5
Intel Core i7-10510U 1.8GHz
GeForce MX330
min:
31.5 fps, P1:
37.9 fps, max:
172 fps
fps
553%
GeForce RTX 2060 (Desktop):
269 [X] MSI GeForce RTX 2060 1.5.4.5
Intel Core i9-9900K 3.6GHz
GeForce RTX 2060 (Desktop)
min:
140 fps, P1:
211 fps, max:
399 fps
fps
100%
GeForce MX330:
40.9 [X] MSI Prestige 14 1.5.4.5
Intel Core i7-10510U 1.8GHz
GeForce MX330
min:
30.9 fps, P1:
33 fps, max:
100 fps
fps
555%
GeForce RTX 2060 (Desktop):
227 [X] MSI GeForce RTX 2060 1.5.4.5
Intel Core i9-9900K 3.6GHz
GeForce RTX 2060 (Desktop)
min:
152 fps, P1:
179 fps, max:
329 fps
fps
100%
GeForce MX330:
21.8 [X] MSI Prestige 14 1.5.4.5
Intel Core i7-10510U 1.8GHz
GeForce MX330
min:
18.3 fps, P1:
19 fps, max:
29.4 fps
fps
982%
GeForce RTX 2060 (Desktop):
214 [X] MSI GeForce RTX 2060 1.5.4.5
Intel Core i9-9900K 3.6GHz
GeForce RTX 2060 (Desktop)
min:
145 fps, P1:
170 fps, max:
292 fps
fps
GeForce RTX 2060 (Desktop):
137 [X] MSI GeForce RTX 2060 1.5.4.5
Intel Core i9-9900K 3.6GHz
GeForce RTX 2060 (Desktop)
min:
88.9 fps, P1:
104 fps, max:
214 fps
fps
GeForce RTX 2060 (Desktop):
78.2 [X] MSI GeForce RTX 2060 1.5.4.5
Intel Core i9-9900K 3.6GHz
GeForce RTX 2060 (Desktop)
min:
55 fps, P1:
65.8 fps, max:
114 fps
fps
100%
GeForce MX330:
36.7 [X] MSI Prestige 14 1.5.4.5
Intel Core i7-10510U 1.8GHz
GeForce MX330
min:
20 fps, P1:
27.4 fps, max:
73.8 fps
fps
401%
GeForce RTX 2060 (Desktop):
147 [X] MSI GeForce RTX 2060 1.5.4.5
Intel Core i9-9900K 3.6GHz
GeForce RTX 2060 (Desktop)
min:
71 fps, P1:
104 fps, max:
233 fps
fps
100%
GeForce MX330:
16.5 [X] MSI Prestige 14 1.5.4.5
Intel Core i7-10510U 1.8GHz
GeForce MX330
min:
12.4 fps, P1:
13.3 fps, max:
24.6 fps
fps
593%
GeForce RTX 2060 (Desktop):
97.9 [X] MSI GeForce RTX 2060 1.5.4.5
Intel Core i9-9900K 3.6GHz
GeForce RTX 2060 (Desktop)
min:
54.2 fps, P1:
70.7 fps, max:
203 fps
fps
100%
GeForce MX330:
15.8 [X] MSI Prestige 14 1.5.4.5
Intel Core i7-10510U 1.8GHz
GeForce MX330
min:
12.3 fps, P1:
13.2 fps, max:
23.5 fps
fps
577%
GeForce RTX 2060 (Desktop):
91.1 [X] MSI GeForce RTX 2060 1.5.4.5
Intel Core i9-9900K 3.6GHz
GeForce RTX 2060 (Desktop)
min:
58.6 fps, P1:
67.1 fps, max:
170 fps
fps
GeForce RTX 2060 (Desktop):
61.1 [X] MSI GeForce RTX 2060 1.5.4.5
Intel Core i9-9900K 3.6GHz
GeForce RTX 2060 (Desktop)
min:
47 fps, P1:
50.6 fps, max:
104 fps
fps
GeForce RTX 2060 (Desktop):
31.7 [X] MSI GeForce RTX 2060 1.5.4.5
Intel Core i9-9900K 3.6GHz
GeForce RTX 2060 (Desktop)
min:
27.6 fps, P1:
28.6 fps, max:
39.4 fps
fps
100%
GeForce MX330:
85.7 [X] MSI Prestige 14 Intel Core i7-10510U 1.8GHz
GeForce MX330
min:
28.9 fps, P1:
60.9 fps, max:
230 fps
fps
210%
GeForce RTX 2060 (Desktop):
180 [X] MSI GeForce RTX 2060 Intel Core i9-9900K 3.6GHz
GeForce RTX 2060 (Desktop)
min:
4.6 fps, P1:
119 fps, max:
418 fps
fps
100%
GeForce MX330:
13 [X] MSI Prestige 14 Intel Core i7-10510U 1.8GHz
GeForce MX330
min:
1.896 fps, P1:
4.24 fps, max:
76 fps
fps
769%
GeForce RTX 2060 (Desktop):
100 [X] MSI GeForce RTX 2060 Intel Core i9-9900K 3.6GHz
GeForce RTX 2060 (Desktop)
min:
3.66 fps, P1:
36.5 fps, max:
205 fps
fps
100%
GeForce MX330:
8.2 [X] MSI Prestige 14 Intel Core i7-10510U 1.8GHz
GeForce MX330
min:
1.41 fps, P1:
1.734 fps, max:
73.9 fps
fps
1275%
GeForce RTX 2060 (Desktop):
104 [X] MSI GeForce RTX 2060 Intel Core i9-9900K 3.6GHz
GeForce RTX 2060 (Desktop)
min:
5.26 fps, P1:
57.5 fps, max:
175 fps
fps
GeForce RTX 2060 (Desktop):
70 [X] MSI GeForce RTX 2060 Intel Core i9-9900K 3.6GHz
GeForce RTX 2060 (Desktop)
min:
8.11 fps, P1:
36.6 fps, max:
129 fps
fps
GeForce RTX 2060 (Desktop):
57.6 [X] MSI GeForce RTX 2060 Intel Core i9-9900K 3.6GHz
GeForce RTX 2060 (Desktop)
min:
21.3 fps, P1:
36.5 fps, max:
103 fps
fps
GeForce RTX 2060 (Desktop):
36.6 [X] MSI GeForce RTX 2060 Intel Core i9-9900K 3.6GHz
GeForce RTX 2060 (Desktop)
min:
14.8 fps, P1:
23.1 fps, max:
79.6 fps
fps
100%
GeForce MX330:
61.7 [X] MSI Prestige 14 Intel Core i7-10510U 1.8GHz
GeForce MX330
min:
12.8 fps, P0.1:
13 fps, P1:
13.8 fps, max:
320 fps
fps
100%
GeForce MX330:
22.8 [X] MSI Prestige 14 Intel Core i7-10510U 1.8GHz
GeForce MX330
min:
4.99 fps, P0.1:
5.02 fps, P1:
5.7 fps, max:
231 fps
fps
605%
GeForce RTX 2060 (Desktop):
138 [X] MSI GeForce RTX 2060 Intel Core i9-9900K 3.6GHz
GeForce RTX 2060 (Desktop)
min:
61.5 fps, P0.1:
66.9 fps, P1:
104 fps, max:
272 fps
fps
100%
GeForce MX330:
11.9 [X] MSI Prestige 14 Intel Core i7-10510U 1.8GHz
GeForce MX330
min:
7.5 fps, P0.1:
8.11 fps, P1:
9.5 fps, max:
16.5 fps
fps
595%
GeForce RTX 2060 (Desktop):
70.8 [X] MSI GeForce RTX 2060 Intel Core i9-9900K 3.6GHz
GeForce RTX 2060 (Desktop)
min:
27.1 fps, P0.1:
38.1 fps, P1:
49 fps, max:
133 fps
fps
100%
GeForce MX330:
8.9 [X] MSI Prestige 14 Intel Core i7-10510U 1.8GHz
GeForce MX330
min:
5.38 fps, P0.1:
5.88 fps, P1:
7 fps, max:
16.8 fps
fps
560%
GeForce RTX 2060 (Desktop):
49.6 [X] MSI GeForce RTX 2060 Intel Core i9-9900K 3.6GHz
GeForce RTX 2060 (Desktop)
min:
33.6 fps, P0.1:
34.9 fps, P1:
40.1 fps, max:
74.1 fps
fps
GeForce RTX 2060 (Desktop):
27.8 [X] MSI GeForce RTX 2060 Intel Core i9-9900K 3.6GHz
GeForce RTX 2060 (Desktop)
min:
6.33 fps, P0.1:
11 fps, P1:
22.8 fps, max:
37.9 fps
fps
GeForce RTX 2060 (Desktop):
17.6 [X] MSI GeForce RTX 2060 Intel Core i9-9900K 3.6GHz
GeForce RTX 2060 (Desktop)
min:
5.02 fps, P0.1:
5.49 fps, P1:
9.06 fps, max:
75 fps
fps
100%
GeForce MX330:
28.4 [X] MSI Prestige 14 1.5.4.5
Intel Core i7-10510U 1.8GHz
GeForce MX330
min:
8.54 fps, P1:
22.5 fps, max:
49.2 fps
fps
279%
GeForce RTX 2060 (Desktop):
79.1 [X] MSI GeForce RTX 2060 1.5.4.5
Intel Core i9-9900K 3.6GHz
GeForce RTX 2060 (Desktop)
min:
8.43 fps, P1:
59.856 fps, max:
97.8 fps
fps
100%
GeForce MX330:
12.1 [X] MSI Prestige 14 1.5.4.5
Intel Core i7-10510U 1.8GHz
GeForce MX330
min:
6.01 fps, P1:
8.2054 fps, max:
33.3 fps
fps
567%
GeForce RTX 2060 (Desktop):
68.6 [X] MSI GeForce RTX 2060 1.5.4.5
Intel Core i9-9900K 3.6GHz
GeForce RTX 2060 (Desktop)
min:
4.83 fps, P1:
51.935 fps, max:
81 fps
fps
100%
GeForce MX330:
6.9 [X] MSI Prestige 14 1.5.4.5
Intel Core i7-10510U 1.8GHz
GeForce MX330
min:
4.48 fps, P1:
4.8428 fps, max:
13.9 fps
fps
746%
GeForce RTX 2060 (Desktop):
51.6 [X] MSI GeForce RTX 2060 1.5.4.5
Intel Core i9-9900K 3.6GHz
GeForce RTX 2060 (Desktop)
min:
6.21 fps, P1:
41.962 fps, max:
63.4 fps
fps
100%
GeForce MX330:
3.3 [X] MSI Prestige 14 1.5.4.5
Intel Core i7-10510U 1.8GHz
GeForce MX330
min:
0.848 fps, P1:
2.1328 fps, max:
13.6 fps
fps
1075%
GeForce RTX 2060 (Desktop):
35.9 [X] MSI GeForce RTX 2060 1.5.4.5
Intel Core i9-9900K 3.6GHz
GeForce RTX 2060 (Desktop)
min:
7.81 fps, P1:
28.35 fps, max:
47.2 fps
fps
GeForce RTX 2060 (Desktop):
26.4 [X] MSI GeForce RTX 2060 1.5.4.5
Intel Core i9-9900K 3.6GHz
GeForce RTX 2060 (Desktop)
min:
10.7 fps, P1:
18.1 fps, max:
45.8 fps
fps
GeForce RTX 2060 (Desktop):
15.5 [X] MSI GeForce RTX 2060 1.5.4.5
Intel Core i9-9900K 3.6GHz
GeForce RTX 2060 (Desktop)
min:
7.23 fps, P1:
9.94 fps, max:
34.7 fps
fps
100%
GeForce MX330:
27 [X] MSI Prestige 14 Intel Core i7-10510U 1.8GHz
GeForce MX330
min:
10 fps
fps
541%
GeForce RTX 2060 (Desktop):
146 [X] MSI GeForce RTX 2060 Intel Core i9-9900K 3.6GHz
GeForce RTX 2060 (Desktop)
min:
57 fps
fps
548%
GeForce RTX 2080 Super Max-Q:
148 fps
100%
GeForce MX330:
13 [X] MSI Prestige 14 Intel Core i7-10510U 1.8GHz
GeForce MX330
min:
7 fps
fps
777%
GeForce RTX 2060 (Desktop):
101 [X] MSI GeForce RTX 2060 Intel Core i9-9900K 3.6GHz
GeForce RTX 2060 (Desktop)
min:
43 fps
fps
838%
GeForce RTX 2080 Super Max-Q:
109 fps
100%
GeForce MX330:
11 [X] MSI Prestige 14 Intel Core i7-10510U 1.8GHz
GeForce MX330
min:
5 fps
fps
782%
GeForce RTX 2060 (Desktop):
86 [X] MSI GeForce RTX 2060 Intel Core i9-9900K 3.6GHz
GeForce RTX 2060 (Desktop)
min:
40 fps
fps
818%
GeForce RTX 2080 Super Max-Q:
90 fps
100%
GeForce MX330:
9 [X] MSI Prestige 14 Intel Core i7-10510U 1.8GHz
GeForce MX330
min:
4 fps
fps
767%
GeForce RTX 2060 (Desktop):
69 [X] MSI GeForce RTX 2060 Intel Core i9-9900K 3.6GHz
GeForce RTX 2060 (Desktop)
min:
41 fps
fps
833%
GeForce RTX 2080 Super Max-Q:
74 76 [X] SCHENKER Key 15 Comet Lake Leistungsmodus
Intel Core i7-10875H 2.3GHz
GeForce RTX 2080 Super Max-Q
~ 75 fps
GeForce RTX 2060 (Desktop):
52 [X] MSI GeForce RTX 2060 Intel Core i9-9900K 3.6GHz
GeForce RTX 2060 (Desktop)
min:
30 fps
fps
GeForce RTX 2060 (Desktop):
30 [X] MSI GeForce RTX 2060 Intel Core i9-9900K 3.6GHz
GeForce RTX 2060 (Desktop)
min:
18 fps
fps
100%
GeForce MX330:
33.4 [X] MSI Prestige 14 Intel Core i7-10510U 1.8GHz
GeForce MX330
min:
25 fps
fps
518%
GeForce RTX 2060 (Desktop):
173 [X] MSI GeForce RTX 2060 Intel Core i9-9900K 3.6GHz
GeForce RTX 2060 (Desktop)
min:
101 fps
fps
458%
GeForce RTX 2080 Super Max-Q:
139.8 166.1 ~ 153 fps
100%
GeForce MX330:
14.7 [X] MSI Prestige 14 Intel Core i7-10510U 1.8GHz
GeForce MX330
min:
9 fps
fps
803%
GeForce RTX 2060 (Desktop):
118 [X] MSI GeForce RTX 2060 Intel Core i9-9900K 3.6GHz
GeForce RTX 2060 (Desktop)
min:
93 fps
fps
823%
GeForce RTX 2080 Super Max-Q:
118.7 123.5 ~ 121 fps
100%
GeForce MX330:
13.7 [X] MSI Prestige 14 Intel Core i7-10510U 1.8GHz
GeForce MX330
min:
9 fps
fps
810%
GeForce RTX 2060 (Desktop):
111 [X] MSI GeForce RTX 2060 Intel Core i9-9900K 3.6GHz
GeForce RTX 2060 (Desktop)
min:
91 fps
fps
818%
GeForce RTX 2080 Super Max-Q:
108.6 114.5 ~ 112 fps
100%
GeForce MX330:
13.4 [X] MSI Prestige 14 Intel Core i7-10510U 1.8GHz
GeForce MX330
min:
8 fps
fps
799%
GeForce RTX 2060 (Desktop):
107 [X] MSI GeForce RTX 2060 Intel Core i9-9900K 3.6GHz
GeForce RTX 2060 (Desktop)
min:
88 fps
fps
813%
GeForce RTX 2080 Super Max-Q:
104.5 112.8 ~ 109 fps
GeForce RTX 2060 (Desktop):
76.4 [X] MSI GeForce RTX 2060 Intel Core i9-9900K 3.6GHz
GeForce RTX 2060 (Desktop)
min:
65 fps
fps
GeForce RTX 2060 (Desktop):
42.3 [X] MSI GeForce RTX 2060 Intel Core i9-9900K 3.6GHz
GeForce RTX 2060 (Desktop)
min:
36 fps
fps
100%
GeForce MX330:
81 [X] MSI Prestige 14 Intel Core i7-10510U 1.8GHz
GeForce MX330
min:
73 fps
fps
356%
GeForce RTX 2060 (Desktop):
288 [X] MSI GeForce RTX 2060 Intel Core i9-9900K 3.6GHz
GeForce RTX 2060 (Desktop)
min:
225 fps
fps
305%
GeForce RTX 2080 Super Max-Q:
219 253 268 ~ 247 fps
100%
GeForce MX330:
39 [X] MSI Prestige 14 Intel Core i7-10510U 1.8GHz
GeForce MX330
min:
32 fps
fps
541%
GeForce RTX 2060 (Desktop):
211 [X] MSI GeForce RTX 2060 Intel Core i9-9900K 3.6GHz
GeForce RTX 2060 (Desktop)
min:
181 fps
fps
449%
GeForce RTX 2080 Super Max-Q:
167 174 184 ~ 175 fps
100%
GeForce MX330:
28 [X] MSI Prestige 14 Intel Core i7-10510U 1.8GHz
GeForce MX330
min:
22 fps
fps
614%
GeForce RTX 2060 (Desktop):
172 [X] MSI GeForce RTX 2060 Intel Core i9-9900K 3.6GHz
GeForce RTX 2060 (Desktop)
min:
149 fps
fps
546%
GeForce RTX 2080 Super Max-Q:
149 150 161 ~ 153 fps
100%
GeForce MX330:
16 [X] MSI Prestige 14 Intel Core i7-10510U 1.8GHz
GeForce MX330
min:
12 fps
fps
750%
GeForce RTX 2060 (Desktop):
120 [X] MSI GeForce RTX 2060 Intel Core i9-9900K 3.6GHz
GeForce RTX 2060 (Desktop)
min:
98 fps
fps
725%
GeForce RTX 2080 Super Max-Q:
102 115 118 119 [X] Razer Blade 15 RTX 2080 Super Max-Q GPU: Hoch
Intel Core i7-10875H 2.3GHz
GeForce RTX 2080 Super Max-Q
min:
99 fps, max:
137 fps
126 [X] SCHENKER Key 15 Comet Lake Leistungsmodus
Intel Core i7-10875H 2.3GHz
GeForce RTX 2080 Super Max-Q
min:
108 fps, max:
148 fps
~ 116 fps
GeForce RTX 2060 (Desktop):
89 [X] MSI GeForce RTX 2060 Intel Core i9-9900K 3.6GHz
GeForce RTX 2060 (Desktop)
min:
75 fps
fps
GeForce RTX 2080 Super Max-Q:
89 fps
GeForce RTX 2060 (Desktop):
52 [X] MSI GeForce RTX 2060 Intel Core i9-9900K 3.6GHz
GeForce RTX 2060 (Desktop)
min:
44 fps
fps
GeForce RTX 2080 Super Max-Q:
51 fps
100%
GeForce MX330:
147 [X] MSI Prestige 14 Intel Core i7-10510U 1.8GHz
GeForce MX330
min:
135 fps
fps
180%
GeForce RTX 2060 (Desktop):
264 [X] MSI GeForce RTX 2060 Intel Core i9-9900K 3.6GHz
GeForce RTX 2060 (Desktop)
min:
202 fps
fps
100%
GeForce MX330:
118 [X] MSI Prestige 14 Intel Core i7-10510U 1.8GHz
GeForce MX330
min:
91 fps
fps
210%
GeForce RTX 2060 (Desktop):
248 [X] MSI GeForce RTX 2060 Intel Core i9-9900K 3.6GHz
GeForce RTX 2060 (Desktop)
min:
198 fps
fps
100%
GeForce MX330:
106 [X] MSI Prestige 14 Intel Core i7-10510U 1.8GHz
GeForce MX330
min:
85 fps
fps
233%
GeForce RTX 2060 (Desktop):
247 [X] MSI GeForce RTX 2060 Intel Core i9-9900K 3.6GHz
GeForce RTX 2060 (Desktop)
min:
192 fps
fps
GeForce RTX 2060 (Desktop):
241 [X] MSI GeForce RTX 2060 Intel Core i9-9900K 3.6GHz
GeForce RTX 2060 (Desktop)
min:
189 fps
fps
GeForce RTX 2060 (Desktop):
208 [X] MSI GeForce RTX 2060 Intel Core i9-9900K 3.6GHz
GeForce RTX 2060 (Desktop)
min:
189 fps
fps
100%
GeForce MX330:
94.6 [X] MSI Prestige 14 Intel Core i7-10510U 1.8GHz
GeForce MX330
fps
327%
GeForce RTX 2060 (Desktop):
309 [X] MSI GeForce RTX 2060 Intel Core i9-9900K 3.6GHz
GeForce RTX 2060 (Desktop)
fps
100%
GeForce MX330:
34.5 [X] MSI Prestige 14 Intel Core i7-10510U 1.8GHz
GeForce MX330
fps
559%
GeForce RTX 2060 (Desktop):
193 [X] MSI GeForce RTX 2060 Intel Core i9-9900K 3.6GHz
GeForce RTX 2060 (Desktop)
fps
100%
GeForce MX330:
22.1 [X] MSI Prestige 14 Intel Core i7-10510U 1.8GHz
GeForce MX330
fps
543%
GeForce RTX 2060 (Desktop):
120 [X] MSI GeForce RTX 2060 Intel Core i9-9900K 3.6GHz
GeForce RTX 2060 (Desktop)
fps
100%
GeForce MX330:
15.9 [X] MSI Prestige 14 Intel Core i7-10510U 1.8GHz
GeForce MX330
fps
521%
GeForce RTX 2060 (Desktop):
82.9 [X] MSI GeForce RTX 2060 Intel Core i9-9900K 3.6GHz
GeForce RTX 2060 (Desktop)
fps
541%
GeForce RTX 2080 Super Max-Q:
78.4 82.9 84.3 89.7 92.7 [X] SCHENKER Key 15 Comet Lake Leistungsmodus
Intel Core i7-10875H 2.3GHz
GeForce RTX 2080 Super Max-Q
~ 86 fps
GeForce RTX 2060 (Desktop):
57.1 [X] MSI GeForce RTX 2060 Intel Core i9-9900K 3.6GHz
GeForce RTX 2060 (Desktop)
fps
GeForce RTX 2080 Super Max-Q:
54 57.9 ~ 56 fps
GeForce RTX 2060 (Desktop):
31.1 [X] MSI GeForce RTX 2060 Intel Core i9-9900K 3.6GHz
GeForce RTX 2060 (Desktop)
fps
GeForce RTX 2080 Super Max-Q:
28.1 30.3 ~ 29 fps
100%
GeForce MX330:
35.3 [X] MSI Prestige 14 Intel Core i7-10510U 1.8GHz
GeForce MX330
min:
22 fps
fps
796%
GeForce RTX 2060 (Desktop):
281 [X] MSI GeForce RTX 2060 Intel Core i9-9900K 3.6GHz
GeForce RTX 2060 (Desktop)
min:
132 fps
fps
GeForce RTX 2060 (Desktop):
185 [X] MSI GeForce RTX 2060 Intel Core i9-9900K 3.6GHz
GeForce RTX 2060 (Desktop)
min:
123 fps
fps
GeForce RTX 2060 (Desktop):
167 [X] MSI GeForce RTX 2060 Intel Core i9-9900K 3.6GHz
GeForce RTX 2060 (Desktop)
min:
122 fps
fps
GeForce RTX 2060 (Desktop):
162 [X] MSI GeForce RTX 2060 Intel Core i9-9900K 3.6GHz
GeForce RTX 2060 (Desktop)
min:
115 fps
fps
GeForce RTX 2080 Super Max-Q:
140 144.4 147 152.1 155.1 163.7 [X] SCHENKER Key 15 Comet Lake Leistungsmodus
Intel Core i7-10875H 2.3GHz
GeForce RTX 2080 Super Max-Q
165.2 [X] Asus ROG Zephyrus Duo 15 GX550LXS Turbo
Intel Core i9-10980HK 2.4GHz
GeForce RTX 2080 Super Max-Q
177.7 ~ 156 fps
GeForce RTX 2060 (Desktop):
102 [X] MSI GeForce RTX 2060 Intel Core i9-9900K 3.6GHz
GeForce RTX 2060 (Desktop)
min:
71 fps
fps
GeForce RTX 2080 Super Max-Q:
108 116.7 131.2 [X] Asus ROG Zephyrus Duo 15 GX550LXS Intel Core i9-10980HK 2.4GHz
GeForce RTX 2080 Super Max-Q
~ 119 fps
GeForce RTX 2060 (Desktop):
45.9 [X] MSI GeForce RTX 2060 Intel Core i9-9900K 3.6GHz
GeForce RTX 2060 (Desktop)
min:
31 fps
fps
GeForce RTX 2080 Super Max-Q:
58 64 73.3 [X] Asus ROG Zephyrus Duo 15 GX550LXS Intel Core i9-10980HK 2.4GHz
GeForce RTX 2080 Super Max-Q
~ 65 fps
100%
GeForce MX330:
51.6 [X] MSI Prestige 14 Intel Core i7-10510U 1.8GHz
GeForce MX330
min:
49 fps
fps
442%
GeForce RTX 2060 (Desktop):
228 [X] MSI GeForce RTX 2060 Intel Core i9-9900K 3.6GHz
GeForce RTX 2060 (Desktop)
min:
202 fps
fps
402%
GeForce RTX 2080 Super Max-Q:
207.4 fps
100%
GeForce MX330:
19 [X] MSI Prestige 14 Intel Core i7-10510U 1.8GHz
GeForce MX330
min:
17 fps
fps
632%
GeForce RTX 2060 (Desktop):
120 [X] MSI GeForce RTX 2060 Intel Core i9-9900K 3.6GHz
GeForce RTX 2060 (Desktop)
min:
112 fps
fps
632%
GeForce RTX 2080 Super Max-Q:
119 121.4 ~ 120 fps
100%
GeForce MX330:
15.1 [X] MSI Prestige 14 Intel Core i7-10510U 1.8GHz
GeForce MX330
min:
14 fps
fps
689%
GeForce RTX 2060 (Desktop):
104 [X] MSI GeForce RTX 2060 Intel Core i9-9900K 3.6GHz
GeForce RTX 2060 (Desktop)
min:
95 fps
fps
675%
GeForce RTX 2080 Super Max-Q:
101 102 ~ 102 fps
GeForce RTX 2060 (Desktop):
63.8 [X] MSI GeForce RTX 2060 Intel Core i9-9900K 3.6GHz
GeForce RTX 2060 (Desktop)
min:
60 fps
fps
GeForce RTX 2080 Super Max-Q:
68.8 fps
GeForce RTX 2060 (Desktop):
30.3 [X] MSI GeForce RTX 2060 Intel Core i9-9900K 3.6GHz
GeForce RTX 2060 (Desktop)
min:
28 fps
fps
GeForce RTX 2080 Super Max-Q:
32.4 fps
100%
GeForce MX330:
58.2 [X] MSI Prestige 14 Intel Core i7-10510U 1.8GHz
GeForce MX330
min:
54 fps
fps
208%
GeForce RTX 2060 (Desktop):
121 [X] MSI GeForce RTX 2060 Intel Core i9-9900K 3.6GHz
GeForce RTX 2060 (Desktop)
min:
119 fps
fps
208%
GeForce RTX 2080 Super Max-Q:
121 fps
100%
GeForce MX330:
33.7 [X] MSI Prestige 14 Intel Core i7-10510U 1.8GHz
GeForce MX330
min:
26 fps
fps
359%
GeForce RTX 2060 (Desktop):
121 [X] MSI GeForce RTX 2060 Intel Core i9-9900K 3.6GHz
GeForce RTX 2060 (Desktop)
min:
117 fps
fps
359%
GeForce RTX 2080 Super Max-Q:
121 121 ~ 121 fps
100%
GeForce MX330:
23.3 [X] MSI Prestige 14 Intel Core i7-10510U 1.8GHz
GeForce MX330
min:
20 fps
fps
519%
GeForce RTX 2060 (Desktop):
121 [X] MSI GeForce RTX 2060 Intel Core i9-9900K 3.6GHz
GeForce RTX 2060 (Desktop)
min:
113 fps
fps
519%
GeForce RTX 2080 Super Max-Q:
120 121 ~ 121 fps
100%
GeForce MX330:
21.6 [X] MSI Prestige 14 Intel Core i7-10510U 1.8GHz
GeForce MX330
min:
19 fps
fps
551%
GeForce RTX 2060 (Desktop):
119 [X] MSI GeForce RTX 2060 Intel Core i9-9900K 3.6GHz
GeForce RTX 2060 (Desktop)
min:
111 fps
fps
556%
GeForce RTX 2080 Super Max-Q:
119 120 ~ 120 fps
GeForce RTX 2060 (Desktop):
86.2 [X] MSI GeForce RTX 2060 Intel Core i9-9900K 3.6GHz
GeForce RTX 2060 (Desktop)
min:
81 fps
fps
GeForce RTX 2080 Super Max-Q:
83.1 fps
GeForce RTX 2060 (Desktop):
39.8 [X] MSI GeForce RTX 2060 Intel Core i9-9900K 3.6GHz
GeForce RTX 2060 (Desktop)
min:
34 fps
fps
GeForce RTX 2080 Super Max-Q:
39.7 fps
100%
GeForce MX330:
20.8 [X] MSI Prestige 14 Intel Core i7-10510U 1.8GHz
GeForce MX330
min:
16 fps
fps
740%
GeForce RTX 2060 (Desktop):
154 [X] MSI GeForce RTX 2060 Intel Core i9-9900K 3.6GHz
GeForce RTX 2060 (Desktop)
min:
13 fps
fps
100%
GeForce MX330:
15.1 [X] MSI Prestige 14 Intel Core i7-10510U 1.8GHz
GeForce MX330
min:
12 fps
fps
675%
GeForce RTX 2060 (Desktop):
102 [X] MSI GeForce RTX 2060 Intel Core i9-9900K 3.6GHz
GeForce RTX 2060 (Desktop)
min:
14 fps
fps
GeForce RTX 2060 (Desktop):
68.5 [X] MSI GeForce RTX 2060 Intel Core i9-9900K 3.6GHz
GeForce RTX 2060 (Desktop)
min:
6 fps
fps
GeForce RTX 2060 (Desktop):
43.6 [X] MSI GeForce RTX 2060 Intel Core i9-9900K 3.6GHz
GeForce RTX 2060 (Desktop)
min:
6 fps
fps
GeForce RTX 2060 (Desktop):
35.1 [X] MSI GeForce RTX 2060 Intel Core i9-9900K 3.6GHz
GeForce RTX 2060 (Desktop)
min:
7 fps
fps
GeForce RTX 2080 Super Max-Q:
35 36.2 37 ~ 36 fps
GeForce RTX 2060 (Desktop):
24 [X] MSI GeForce RTX 2060 Intel Core i9-9900K 3.6GHz
GeForce RTX 2060 (Desktop)
min:
7 fps
fps
100%
GeForce MX330:
25.7 fps
424%
GeForce RTX 2060 (Desktop):
109 [X] MSI GeForce RTX 2060 Intel Core i9-9900K 3.6GHz
GeForce RTX 2060 (Desktop)
min:
68 fps
fps
100%
GeForce MX330:
21.3 fps
493%
GeForce RTX 2060 (Desktop):
105 [X] MSI GeForce RTX 2060 Intel Core i9-9900K 3.6GHz
GeForce RTX 2060 (Desktop)
min:
66 fps
fps
100%
GeForce MX330:
8.7 fps
1101%
GeForce RTX 2060 (Desktop):
96 [X] MSI GeForce RTX 2060 Intel Core i9-9900K 3.6GHz
GeForce RTX 2060 (Desktop)
min:
63 fps
fps
GeForce RTX 2060 (Desktop):
74.2 [X] MSI GeForce RTX 2060 Intel Core i9-9900K 3.6GHz
GeForce RTX 2060 (Desktop)
min:
61 fps
fps
GeForce RTX 2080 Super Max-Q:
72.2 76.2 ~ 74 fps
GeForce RTX 2060 (Desktop):
38.4 [X] MSI GeForce RTX 2060 Intel Core i9-9900K 3.6GHz
GeForce RTX 2060 (Desktop)
min:
35 fps
fps
GeForce RTX 2080 Super Max-Q:
36.8 42.7 ~ 40 fps
100%
GeForce MX330:
43.1 fps
283%
GeForce RTX 2060 (Desktop):
122 [X] MSI GeForce RTX 2060 Intel Core i9-9900K 3.6GHz
GeForce RTX 2060 (Desktop)
min:
99 fps
fps
236%
GeForce RTX 2080 Super Max-Q:
101.9 [X] MSI GS66 10SGS Intel Core i7-10750H 2.6GHz
GeForce RTX 2080 Super Max-Q
min:
86 fps, max:
118 fps
fps
100%
GeForce MX330:
22.3 fps
507%
GeForce RTX 2060 (Desktop):
113 [X] MSI GeForce RTX 2060 Intel Core i9-9900K 3.6GHz
GeForce RTX 2060 (Desktop)
min:
97 fps
fps
417%
GeForce RTX 2080 Super Max-Q:
92 [X] MSI GS66 10SGS Intel Core i7-10750H 2.6GHz
GeForce RTX 2080 Super Max-Q
min:
66 fps, max:
110 fps
93 ~ 93 fps
100%
GeForce MX330:
19.7 fps
523%
GeForce RTX 2060 (Desktop):
103 [X] MSI GeForce RTX 2060 Intel Core i9-9900K 3.6GHz
GeForce RTX 2060 (Desktop)
min:
89 fps
fps
431%
GeForce RTX 2080 Super Max-Q:
84 [X] MSI GS66 10SGS Intel Core i7-10750H 2.6GHz
GeForce RTX 2080 Super Max-Q
min:
66 fps, max:
107 fps
86.6 ~ 85 fps
GeForce RTX 2060 (Desktop):
86.9 [X] MSI GeForce RTX 2060 Intel Core i9-9900K 3.6GHz
GeForce RTX 2060 (Desktop)
min:
69 fps
fps
GeForce RTX 2080 Super Max-Q:
76.9 [X] MSI GS66 10SGS Intel Core i7-10750H 2.6GHz
GeForce RTX 2080 Super Max-Q
min:
59 fps, max:
89 fps
83.3 ~ 80 fps
GeForce RTX 2060 (Desktop):
64.1 [X] MSI GeForce RTX 2060 Intel Core i9-9900K 3.6GHz
GeForce RTX 2060 (Desktop)
min:
56 fps
fps
GeForce RTX 2080 Super Max-Q:
66.9 fps
GeForce RTX 2060 (Desktop):
36.7 [X] MSI GeForce RTX 2060 Intel Core i9-9900K 3.6GHz
GeForce RTX 2060 (Desktop)
min:
29 fps
fps
GeForce RTX 2080 Super Max-Q:
40.9 fps
100%
GeForce MX330:
42.5 fps
478%
GeForce RTX 2060 (Desktop):
203 [X] MSI GeForce RTX 2060 Intel Core i9-9900K 3.6GHz
GeForce RTX 2060 (Desktop)
min:
145 fps
fps
398%
GeForce RTX 2080 Super Max-Q:
165.5 172.3 ~ 169 fps
100%
GeForce MX330:
23.2 fps
582%
GeForce RTX 2060 (Desktop):
135 [X] MSI GeForce RTX 2060 Intel Core i9-9900K 3.6GHz
GeForce RTX 2060 (Desktop)
min:
97 fps
fps
100%
GeForce MX330:
14.5 fps
897%
GeForce RTX 2060 (Desktop):
130 [X] MSI GeForce RTX 2060 Intel Core i9-9900K 3.6GHz
GeForce RTX 2060 (Desktop)
min:
95 fps
fps
100%
GeForce MX330:
13.9 fps
755%
GeForce RTX 2060 (Desktop):
105 [X] MSI GeForce RTX 2060 Intel Core i9-9900K 3.6GHz
GeForce RTX 2060 (Desktop)
min:
81 fps
fps
GeForce RTX 2060 (Desktop):
76 [X] MSI GeForce RTX 2060 Intel Core i9-9900K 3.6GHz
GeForce RTX 2060 (Desktop)
min:
63 fps
fps
GeForce RTX 2060 (Desktop):
43.1 [X] MSI GeForce RTX 2060 Intel Core i9-9900K 3.6GHz
GeForce RTX 2060 (Desktop)
min:
35 fps
fps
100%
GeForce MX330:
18.3 fps
1180%
GeForce RTX 2060 (Desktop):
216 [X] MSI GeForce RTX 2060 Intel Core i9-9900K 3.6GHz
GeForce RTX 2060 (Desktop)
min:
174 fps
fps
955%
GeForce RTX 2080 Super Max-Q:
174.8 fps
100%
GeForce MX330:
15.7 fps
924%
GeForce RTX 2060 (Desktop):
145 [X] MSI GeForce RTX 2060 Intel Core i9-9900K 3.6GHz
GeForce RTX 2060 (Desktop)
min:
120 fps
fps
669%
GeForce RTX 2080 Super Max-Q:
85.9 125 ~ 105 fps
100%
GeForce MX330:
14.7 fps
755%
GeForce RTX 2060 (Desktop):
111 [X] MSI GeForce RTX 2060 Intel Core i9-9900K 3.6GHz
GeForce RTX 2060 (Desktop)
min:
92 fps
fps
639%
GeForce RTX 2080 Super Max-Q:
77.7 111 ~ 94 fps
100%
GeForce MX330:
7.4 fps
1074%
GeForce RTX 2060 (Desktop):
79.5 [X] MSI GeForce RTX 2060 Intel Core i9-9900K 3.6GHz
GeForce RTX 2060 (Desktop)
min:
58 fps
fps
986%
GeForce RTX 2080 Super Max-Q:
72 74 ~ 73 fps
GeForce RTX 2060 (Desktop):
64.5 [X] MSI GeForce RTX 2060 Intel Core i9-9900K 3.6GHz
GeForce RTX 2060 (Desktop)
min:
46 fps
fps
GeForce RTX 2080 Super Max-Q:
66.4 fps
GeForce RTX 2060 (Desktop):
41.4 [X] MSI GeForce RTX 2060 Intel Core i9-9900K 3.6GHz
GeForce RTX 2060 (Desktop)
min:
30 fps
fps
GeForce RTX 2080 Super Max-Q:
46.9 fps
100%
GeForce MX330:
22 fps
705%
GeForce RTX 2060 (Desktop):
155 [X] MSI GeForce RTX 2060 Intel Core i9-9900K 3.6GHz
GeForce RTX 2060 (Desktop)
min:
59 fps
fps
568%
GeForce RTX 2080 Super Max-Q:
117 [X] MSI GS66 10SGS Intel Core i7-10750H 2.6GHz
GeForce RTX 2080 Super Max-Q
min:
60 fps, max:
199 fps
128 130 ~ 125 fps
100%
GeForce MX330:
11 fps
964%
GeForce RTX 2060 (Desktop):
106 [X] MSI GeForce RTX 2060 Intel Core i9-9900K 3.6GHz
GeForce RTX 2060 (Desktop)
min:
60 fps
fps
882%
GeForce RTX 2080 Super Max-Q:
93 95 96 [X] MSI GS66 10SGS Intel Core i7-10750H 2.6GHz
GeForce RTX 2080 Super Max-Q
min:
62 fps, max:
148 fps
102 ~ 97 fps
100%
GeForce MX330:
10 fps
960%
GeForce RTX 2060 (Desktop):
96 [X] MSI GeForce RTX 2060 Intel Core i9-9900K 3.6GHz
GeForce RTX 2060 (Desktop)
min:
58 fps
fps
880%
GeForce RTX 2080 Super Max-Q:
86 [X] MSI GS66 10SGS Intel Core i7-10750H 2.6GHz
GeForce RTX 2080 Super Max-Q
min:
60 fps, max:
133 fps
87 88 92 ~ 88 fps
1775%
GeForce RTX 2060 (Desktop):
71 [X] MSI GeForce RTX 2060 Intel Core i9-9900K 3.6GHz
GeForce RTX 2060 (Desktop)
min:
54 fps
fps
1675%
GeForce RTX 2080 Super Max-Q:
65 [X] MSI GS66 10SGS Intel Core i7-10750H 2.6GHz
GeForce RTX 2080 Super Max-Q
min:
51 fps, max:
96 fps
65 66 70 ~ 67 fps
GeForce RTX 2060 (Desktop):
51 [X] MSI GeForce RTX 2060 Intel Core i9-9900K 3.6GHz
GeForce RTX 2060 (Desktop)
min:
40 fps
fps
GeForce RTX 2080 Super Max-Q:
49 53 ~ 51 fps
GeForce RTX 2060 (Desktop):
28 [X] MSI GeForce RTX 2060 Intel Core i9-9900K 3.6GHz
GeForce RTX 2060 (Desktop)
min:
23 fps
fps
GeForce RTX 2080 Super Max-Q:
29 31 ~ 30 fps
100%
GeForce MX330:
124 fps
234%
GeForce RTX 2060 (Desktop):
290 [X] MSI GeForce RTX 2060 Intel Core i9-9900K 3.6GHz
GeForce RTX 2060 (Desktop)
min:
227 fps
fps
100%
GeForce MX330:
72.1 fps
401%
GeForce RTX 2060 (Desktop):
289 [X] MSI GeForce RTX 2060 Intel Core i9-9900K 3.6GHz
GeForce RTX 2060 (Desktop)
min:
222 fps
fps
348%
GeForce RTX 2080 Super Max-Q:
251 fps
100%
GeForce MX330:
22.3 fps
1206%
GeForce RTX 2060 (Desktop):
269 [X] MSI GeForce RTX 2060 Intel Core i9-9900K 3.6GHz
GeForce RTX 2060 (Desktop)
min:
208 fps
fps
1027%
GeForce RTX 2080 Super Max-Q:
217 241 ~ 229 fps
100%
GeForce MX330:
21.2 fps
1259%
GeForce RTX 2060 (Desktop):
267 [X] MSI GeForce RTX 2060 Intel Core i9-9900K 3.6GHz
GeForce RTX 2060 (Desktop)
min:
207 fps
fps
1071%
GeForce RTX 2080 Super Max-Q:
213 240 ~ 227 fps
GeForce RTX 2060 (Desktop):
254 [X] MSI GeForce RTX 2060 Intel Core i9-9900K 3.6GHz
GeForce RTX 2060 (Desktop)
min:
196 fps
fps
GeForce RTX 2080 Super Max-Q:
189 239 ~ 214 fps
GeForce RTX 2060 (Desktop):
179 [X] MSI GeForce RTX 2060 Intel Core i9-9900K 3.6GHz
GeForce RTX 2060 (Desktop)
min:
143 fps
fps
GeForce RTX 2080 Super Max-Q:
114 190 ~ 152 fps
100%
GeForce MX330:
45.4 fps
306%
GeForce RTX 2060 (Desktop):
139 [X] MSI GeForce RTX 2060 Intel Core i9-9900K 3.6GHz
GeForce RTX 2060 (Desktop)
fps
286%
GeForce RTX 2080 Super Max-Q:
128.3 132.5 ~ 130 fps
100%
GeForce MX330:
14.2 fps
817%
GeForce RTX 2060 (Desktop):
116 [X] MSI GeForce RTX 2060 Intel Core i9-9900K 3.6GHz
GeForce RTX 2060 (Desktop)
fps
100%
GeForce MX330:
12.1 fps
684%
GeForce RTX 2060 (Desktop):
82.8 [X] MSI GeForce RTX 2060 Intel Core i9-9900K 3.6GHz
GeForce RTX 2060 (Desktop)
fps
100%
GeForce MX330:
8.8 fps
727%
GeForce RTX 2060 (Desktop):
64 [X] MSI GeForce RTX 2060 Intel Core i9-9900K 3.6GHz
GeForce RTX 2060 (Desktop)
fps
GeForce RTX 2060 (Desktop):
44.1 [X] MSI GeForce RTX 2060 Intel Core i9-9900K 3.6GHz
GeForce RTX 2060 (Desktop)
fps
GeForce RTX 2080 Super Max-Q:
49.1 51.7 ~ 50 fps
GeForce RTX 2060 (Desktop):
19.5 [X] MSI GeForce RTX 2060 Intel Core i9-9900K 3.6GHz
GeForce RTX 2060 (Desktop)
fps
GeForce RTX 2080 Super Max-Q:
26.6 26.9 ~ 27 fps
100%
GeForce MX330:
44.4 fps
534%
GeForce RTX 2060 (Desktop):
237 [X] MSI GeForce RTX 2060 Intel Core i9-9900K 3.6GHz
GeForce RTX 2060 (Desktop)
min:
217 fps
fps
499%
GeForce RTX 2080 Super Max-Q:
221.7 fps
100%
GeForce MX330:
13.9 fps
692%
GeForce RTX 2060 (Desktop):
96.2 [X] MSI GeForce RTX 2060 Intel Core i9-9900K 3.6GHz
GeForce RTX 2060 (Desktop)
min:
84 fps
fps
734%
GeForce RTX 2080 Super Max-Q:
96.6 107 ~ 102 fps
100%
GeForce MX330:
9.7 fps
748%
GeForce RTX 2060 (Desktop):
72.7 [X] MSI GeForce RTX 2060 Intel Core i9-9900K 3.6GHz
GeForce RTX 2060 (Desktop)
min:
64 fps
fps
761%
GeForce RTX 2080 Super Max-Q:
71 71.1 79.8 ~ 74 fps
GeForce RTX 2060 (Desktop):
47 [X] MSI GeForce RTX 2060 Intel Core i9-9900K 3.6GHz
GeForce RTX 2060 (Desktop)
min:
40 fps
fps
GeForce RTX 2080 Super Max-Q:
46.1 48.4 ~ 47 fps
GeForce RTX 2060 (Desktop):
22.7 [X] MSI GeForce RTX 2060 Intel Core i9-9900K 3.6GHz
GeForce RTX 2060 (Desktop)
min:
19 fps
fps
GeForce RTX 2080 Super Max-Q:
22 24.9 ~ 23 fps
100%
GeForce MX330:
59 73 ~ 66 fps
336%
GeForce RTX 2060 (Desktop):
222 [X] MSI GeForce RTX 2060 Intel Core i9-9900K 3.6GHz
GeForce RTX 2060 (Desktop)
min:
174 fps
fps
311%
GeForce RTX 2080 Super Max-Q:
205 [X] MSI GS66 10SGS Intel Core i7-10750H 2.6GHz
GeForce RTX 2080 Super Max-Q
min:
167 fps, max:
228 fps
fps
100%
GeForce MX330:
17 31 ~ 24 fps
850%
GeForce RTX 2060 (Desktop):
204 [X] MSI GeForce RTX 2060 Intel Core i9-9900K 3.6GHz
GeForce RTX 2060 (Desktop)
min:
164 fps
fps
713%
GeForce RTX 2080 Super Max-Q:
168 [X] MSI GS66 10SGS Intel Core i7-10750H 2.6GHz
GeForce RTX 2080 Super Max-Q
min:
139 fps, max:
183 fps
174 ~ 171 fps
100%
GeForce MX330:
16 24 ~ 20 fps
770%
GeForce RTX 2060 (Desktop):
154 [X] MSI GeForce RTX 2060 Intel Core i9-9900K 3.6GHz
GeForce RTX 2060 (Desktop)
min:
130 fps
fps
720%
GeForce RTX 2080 Super Max-Q:
141 147 [X] MSI GS66 10SGS Intel Core i7-10750H 2.6GHz
GeForce RTX 2080 Super Max-Q
min:
122 fps, max:
160 fps
~ 144 fps
100%
GeForce MX330:
13 19 ~ 16 fps
794%
GeForce RTX 2060 (Desktop):
127 [X] MSI GeForce RTX 2060 Intel Core i9-9900K 3.6GHz
GeForce RTX 2060 (Desktop)
min:
121 fps
fps
875%
GeForce RTX 2080 Super Max-Q:
138 142 [X] MSI GS66 10SGS Intel Core i7-10750H 2.6GHz
GeForce RTX 2080 Super Max-Q
min:
123 fps, max:
154 fps
~ 140 fps
GeForce RTX 2060 (Desktop):
99 [X] MSI GeForce RTX 2060 Intel Core i9-9900K 3.6GHz
GeForce RTX 2060 (Desktop)
min:
91 fps
fps
GeForce RTX 2080 Super Max-Q:
122 fps
GeForce RTX 2060 (Desktop):
55 [X] MSI GeForce RTX 2060 Intel Core i9-9900K 3.6GHz
GeForce RTX 2060 (Desktop)
min:
51 fps
fps
GeForce RTX 2080 Super Max-Q:
74 fps
100%
GeForce MX330:
52.9 fps
100%
GeForce MX330:
16.1 fps
GeForce RTX 2080 Super Max-Q:
61 62.5 64.1 [X] MSI GS66 10SGS Intel Core i7-10750H 2.6GHz
GeForce RTX 2080 Super Max-Q
min:
56 fps, max:
78 fps
69 ~ 64 fps
GeForce RTX 2080 Super Max-Q:
39.9 fps
GeForce RTX 2080 Super Max-Q:
19.6 fps
100%
GeForce MX330:
41.1 fps
513%
GeForce RTX 2060 (Desktop):
211 [X] AMD Ryzen 7 2700X 3.7GHz
GeForce RTX 2060 (Desktop)
P1:
81.4 fps
fps
100%
GeForce MX330:
14.6 fps
753%
GeForce RTX 2060 (Desktop):
110 [X] AMD Ryzen 7 2700X 3.7GHz
GeForce RTX 2060 (Desktop)
P1:
60.4 fps
fps
863%
GeForce RTX 2080 Super Max-Q:
126 fps
100%
GeForce MX330:
13 fps
754%
GeForce RTX 2060 (Desktop):
98 [X] AMD Ryzen 7 2700X 3.7GHz
GeForce RTX 2060 (Desktop)
P1:
49.3 fps
fps
800%
GeForce RTX 2080 Super Max-Q:
102 106 ~ 104 fps
100%
GeForce MX330:
12.9 fps
729%
GeForce RTX 2060 (Desktop):
94 [X] AMD Ryzen 7 2700X 3.7GHz
GeForce RTX 2060 (Desktop)
P1:
47.1 fps
fps
791%
GeForce RTX 2080 Super Max-Q:
101 103 ~ 102 fps
GeForce RTX 2060 (Desktop):
64 [X] AMD Ryzen 7 2700X 3.7GHz
GeForce RTX 2060 (Desktop)
P1:
51.8 fps
fps
GeForce RTX 2080 Super Max-Q:
63.8 68.4 ~ 66 fps
GeForce RTX 2060 (Desktop):
29.8 [X] AMD Ryzen 7 2700X 3.7GHz
GeForce RTX 2060 (Desktop)
P1:
23.8 fps
fps
GeForce RTX 2080 Super Max-Q:
30.9 34.1 ~ 33 fps
100%
GeForce MX330:
58.2 fps
149%
GeForce RTX 2060 (Desktop):
87 [X] AMD Ryzen 7 2700X 3.7GHz
GeForce RTX 2060 (Desktop)
min:
80 fps, max:
99 fps
fps
273%
GeForce RTX 2080 Super Max-Q:
159 fps
100%
GeForce MX330:
11 fps
791%
GeForce RTX 2060 (Desktop):
87 [X] AMD Ryzen 7 2700X 3.7GHz
GeForce RTX 2060 (Desktop)
min:
80 fps, max:
96 fps
fps
873%
GeForce RTX 2080 Super Max-Q:
94 98.2 ~ 96 fps
100%
GeForce MX330:
8.6 fps
833%
GeForce RTX 2060 (Desktop):
72 [X] AMD Ryzen 7 2700X 3.7GHz
GeForce RTX 2060 (Desktop)
min:
66 fps, max:
81 fps
fps
880%
GeForce RTX 2080 Super Max-Q:
74.4 76.7 ~ 76 fps
100%
GeForce MX330:
6.1 fps
657%
GeForce RTX 2060 (Desktop):
40.3 [X] AMD Ryzen 7 2700X 3.7GHz
GeForce RTX 2060 (Desktop)
min:
36 fps, max:
46 fps
fps
734%
GeForce RTX 2080 Super Max-Q:
44.4 44.9 ~ 45 fps
GeForce RTX 2060 (Desktop):
34 [X] AMD Ryzen 7 2700X 3.7GHz
GeForce RTX 2060 (Desktop)
min:
27 fps, max:
38 fps
fps
GeForce RTX 2080 Super Max-Q:
38.8 fps
GeForce RTX 2060 (Desktop):
19.8 [X] AMD Ryzen 7 2700X 3.7GHz
GeForce RTX 2060 (Desktop)
min:
16 fps, max:
23 fps
fps
GeForce RTX 2080 Super Max-Q:
23.2 fps
100%
GeForce MX330:
50 fps
356%
GeForce RTX 2060 (Desktop):
178 [X] AMD Ryzen 7 2700X 3.7GHz
GeForce RTX 2060 (Desktop)
fps
330%
GeForce RTX 2080 Super Max-Q:
165 fps
100%
GeForce MX330:
19 fps
711%
GeForce RTX 2060 (Desktop):
135 [X] AMD Ryzen 7 2700X 3.7GHz
GeForce RTX 2060 (Desktop)
fps
647%
GeForce RTX 2080 Super Max-Q:
117 129 ~ 123 fps
1350%
GeForce RTX 2060 (Desktop):
108 [X] AMD Ryzen 7 2700X 3.7GHz
GeForce RTX 2060 (Desktop)
fps
1300%
GeForce RTX 2080 Super Max-Q:
96 112 ~ 104 fps
1214%
GeForce RTX 2060 (Desktop):
85 [X] AMD Ryzen 7 2700X 3.7GHz
GeForce RTX 2060 (Desktop)
fps
1100%
GeForce RTX 2080 Super Max-Q:
73 80 ~ 77 fps
GeForce RTX 2060 (Desktop):
60 [X] AMD Ryzen 7 2700X 3.7GHz
GeForce RTX 2060 (Desktop)
fps
GeForce RTX 2080 Super Max-Q:
59 fps
GeForce RTX 2060 (Desktop):
33 [X] AMD Ryzen 7 2700X 3.7GHz
GeForce RTX 2060 (Desktop)
fps
GeForce RTX 2080 Super Max-Q:
31 fps
100%
GeForce MX330:
94.5 fps
243%
GeForce RTX 2060 (Desktop):
229.3 [X] AMD Ryzen 7 2700X 3.7GHz
GeForce RTX 2060 (Desktop)
min:
218 fps, max:
240 fps
fps
267%
GeForce RTX 2080 Super Max-Q:
252 [X] MSI GS66 10SGS Intel Core i7-10750H 2.6GHz
GeForce RTX 2080 Super Max-Q
min:
246 fps, max:
259 fps
fps
100%
GeForce MX330:
29.3 fps
520%
GeForce RTX 2060 (Desktop):
152.4 [X] AMD Ryzen 7 2700X 3.7GHz
GeForce RTX 2060 (Desktop)
min:
134 fps, max:
163 fps
fps
570%
GeForce RTX 2080 Super Max-Q:
166 168.4 [X] MSI GS66 10SGS Intel Core i7-10750H 2.6GHz
GeForce RTX 2080 Super Max-Q
min:
143 fps, max:
192 fps
~ 167 fps
100%
GeForce MX330:
26.8 fps
516%
GeForce RTX 2060 (Desktop):
138.2 [X] AMD Ryzen 7 2700X 3.7GHz
GeForce RTX 2060 (Desktop)
min:
125 fps, max:
155 fps
fps
597%
GeForce RTX 2080 Super Max-Q:
158.5 [X] MSI GS66 10SGS Intel Core i7-10750H 2.6GHz
GeForce RTX 2080 Super Max-Q
min:
133 fps, max:
176 fps
162 ~ 160 fps
100%
GeForce MX330:
16.1 fps
524%
GeForce RTX 2060 (Desktop):
84.4 [X] AMD Ryzen 7 2700X 3.7GHz
GeForce RTX 2060 (Desktop)
min:
77 fps, max:
93 fps
fps
584%
GeForce RTX 2080 Super Max-Q:
90 [X] MSI GS66 10SGS Intel Core i7-10750H 2.6GHz
GeForce RTX 2080 Super Max-Q
min:
72 fps, max:
105 fps
98.8 ~ 94 fps
GeForce RTX 2060 (Desktop):
64.9 [X] AMD Ryzen 7 2700X 3.7GHz
GeForce RTX 2060 (Desktop)
min:
60 fps, max:
72 fps
fps
GeForce RTX 2080 Super Max-Q:
76.4 fps
GeForce RTX 2060 (Desktop):
39.9 [X] AMD Ryzen 7 2700X 3.7GHz
GeForce RTX 2060 (Desktop)
min:
37 fps, max:
44 fps
fps
GeForce RTX 2060 (Desktop):
114 [X] AMD Ryzen 7 2700X 3.7GHz
GeForce RTX 2060 (Desktop)
min:
88 fps, max:
146 fps
fps
GeForce RTX 2060 (Desktop):
103 [X] AMD Ryzen 7 2700X 3.7GHz
GeForce RTX 2060 (Desktop)
min:
80 fps, max:
136 fps
fps
GeForce RTX 2060 (Desktop):
95 [X] AMD Ryzen 7 2700X 3.7GHz
GeForce RTX 2060 (Desktop)
min:
66 fps, max:
119 fps
fps
GeForce RTX 2060 (Desktop):
88 [X] AMD Ryzen 7 2700X 3.7GHz
GeForce RTX 2060 (Desktop)
min:
56 fps, max:
109 fps
fps
GeForce RTX 2060 (Desktop):
66 [X] AMD Ryzen 7 2700X 3.7GHz
GeForce RTX 2060 (Desktop)
min:
57 fps, max:
79 fps
fps
GeForce RTX 2060 (Desktop):
34.6 [X] AMD Ryzen 7 2700X 3.7GHz
GeForce RTX 2060 (Desktop)
min:
29 fps, max:
40 fps
fps
100%
GeForce MX330:
45 fps
258%
GeForce RTX 2060 (Desktop):
116 [X] AMD Ryzen 7 2700X 3.7GHz
GeForce RTX 2060 (Desktop)
min:
82 fps, max:
168 fps
fps
100%
GeForce MX330:
24 fps
421%
GeForce RTX 2060 (Desktop):
101 [X] AMD Ryzen 7 2700X 3.7GHz
GeForce RTX 2060 (Desktop)
min:
82 fps, max:
137 fps
fps
429%
GeForce RTX 2080 Super Max-Q:
103 fps
100%
GeForce MX330:
15 fps
647%
GeForce RTX 2060 (Desktop):
97 [X] AMD Ryzen 7 2700X 3.7GHz
GeForce RTX 2060 (Desktop)
min:
80 fps, max:
131 fps
fps
653%
GeForce RTX 2080 Super Max-Q:
97 98 ~ 98 fps
100%
GeForce MX330:
14 fps
629%
GeForce RTX 2060 (Desktop):
88 [X] AMD Ryzen 7 2700X 3.7GHz
GeForce RTX 2060 (Desktop)
min:
66 fps, max:
125 fps
fps
643%
GeForce RTX 2080 Super Max-Q:
87 92 ~ 90 fps
GeForce RTX 2060 (Desktop):
76 [X] AMD Ryzen 7 2700X 3.7GHz
GeForce RTX 2060 (Desktop)
min:
61 fps, max:
95 fps
fps
GeForce RTX 2080 Super Max-Q:
71 78 ~ 75 fps
GeForce RTX 2060 (Desktop):
42 [X] AMD Ryzen 7 2700X 3.7GHz
GeForce RTX 2060 (Desktop)
min:
35 fps, max:
52 fps
fps
GeForce RTX 2080 Super Max-Q:
43 48 ~ 46 fps
100%
GeForce MX330:
34.3 fps
373%
GeForce RTX 2060 (Desktop):
127.8 [X] AMD Ryzen 7 2700X 3.7GHz
GeForce RTX 2060 (Desktop)
min:
72 fps, max:
189 fps
fps
399%
GeForce RTX 2080 Super Max-Q:
131 143.3 [X] MSI GS66 10SGS Intel Core i7-10750H 2.6GHz
GeForce RTX 2080 Super Max-Q
min:
79.8 fps, max:
209.6 fps
~ 137 fps
100%
GeForce MX330:
13.3 fps
642%
GeForce RTX 2060 (Desktop):
85.4 [X] AMD Ryzen 7 2700X 3.7GHz
GeForce RTX 2060 (Desktop)
min:
41 fps, max:
145 fps
fps
729%
GeForce RTX 2080 Super Max-Q:
93.2 96.2 [X] MSI GS66 10SGS Intel Core i7-10750H 2.6GHz
GeForce RTX 2080 Super Max-Q
min:
46.1 fps, max:
169 fps
101 ~ 97 fps
100%
GeForce MX330:
10.4 fps
614%
GeForce RTX 2060 (Desktop):
63.9 [X] AMD Ryzen 7 2700X 3.7GHz
GeForce RTX 2060 (Desktop)
min:
33 fps, max:
104 fps
fps
712%
GeForce RTX 2080 Super Max-Q:
70.3 74.4 [X] MSI GS66 10SGS Intel Core i7-10750H 2.6GHz
GeForce RTX 2080 Super Max-Q
min:
34.6 fps, max:
131.1 fps
77.8 ~ 74 fps
100%
GeForce MX330:
7.8 fps
676%
GeForce RTX 2060 (Desktop):
52.7 [X] AMD Ryzen 7 2700X 3.7GHz
GeForce RTX 2060 (Desktop)
min:
29 fps, max:
82 fps
fps
769%
GeForce RTX 2080 Super Max-Q:
57.2 59 [X] MSI GS66 10SGS Intel Core i7-10750H 2.6GHz
GeForce RTX 2080 Super Max-Q
min:
30.4 fps, max:
106.3 fps
63.4 ~ 60 fps
GeForce RTX 2060 (Desktop):
41.5 [X] AMD Ryzen 7 2700X 3.7GHz
GeForce RTX 2060 (Desktop)
min:
25 fps, max:
61 fps
fps
GeForce RTX 2080 Super Max-Q:
51.2 fps
GeForce RTX 2060 (Desktop):
26.3 [X] AMD Ryzen 7 2700X 3.7GHz
GeForce RTX 2060 (Desktop)
min:
17 fps, max:
38 fps
fps
GeForce RTX 2080 Super Max-Q:
31.6 fps
100%
GeForce MX330:
67.2 fps
214%
GeForce RTX 2060 (Desktop):
144 [X] AMD Ryzen 7 2700X 3.7GHz
GeForce RTX 2060 (Desktop)
min:
143 fps, max:
145 fps
fps
445%
GeForce RTX 2080 Super Max-Q:
299 [X] MSI GS66 10SGS Intel Core i7-10750H 2.6GHz
GeForce RTX 2080 Super Max-Q
min:
296 fps, max:
301 fps
fps
100%
GeForce MX330:
26.5 fps
543%
GeForce RTX 2060 (Desktop):
144 [X] AMD Ryzen 7 2700X 3.7GHz
GeForce RTX 2060 (Desktop)
min:
143 fps, max:
145 fps
fps
736%
GeForce RTX 2080 Super Max-Q:
194 196 [X] MSI GS66 10SGS Intel Core i7-10750H 2.6GHz
GeForce RTX 2080 Super Max-Q
min:
180 fps, max:
219 fps
~ 195 fps
100%
GeForce MX330:
22.5 fps
627%
GeForce RTX 2060 (Desktop):
141 [X] AMD Ryzen 7 2700X 3.7GHz
GeForce RTX 2060 (Desktop)
min:
135 fps, max:
145 fps
fps
698%
GeForce RTX 2080 Super Max-Q:
148.8 [X] MSI GS66 10SGS Intel Core i7-10750H 2.6GHz
GeForce RTX 2080 Super Max-Q
min:
139 fps, max:
162 fps
165 ~ 157 fps
100%
GeForce MX330:
19.4 fps
716%
GeForce RTX 2060 (Desktop):
139 [X] AMD Ryzen 7 2700X 3.7GHz
GeForce RTX 2060 (Desktop)
min:
126 fps, max:
145 fps
fps
799%
GeForce RTX 2080 Super Max-Q:
147.6 [X] MSI GS66 10SGS Intel Core i7-10750H 2.6GHz
GeForce RTX 2080 Super Max-Q
min:
136 fps, max:
161 fps
163 ~ 155 fps
GeForce RTX 2060 (Desktop):
98 [X] AMD Ryzen 7 2700X 3.7GHz
GeForce RTX 2060 (Desktop)
min:
91 fps, max:
110 fps
fps
GeForce RTX 2080 Super Max-Q:
118 fps
GeForce RTX 2060 (Desktop):
52 [X] AMD Ryzen 7 2700X 3.7GHz
GeForce RTX 2060 (Desktop)
min:
48 fps, max:
60 fps
fps
GeForce RTX 2080 Super Max-Q:
65 fps
100%
GeForce MX330:
44.7 [X] MSI Prestige 14 Intel Core i7-10510U 1.8GHz
GeForce MX330
min:
41 fps
fps
389%
GeForce RTX 2060 (Desktop):
174 [X] AMD Ryzen 7 2700X 3.7GHz
GeForce RTX 2060 (Desktop)
min:
162 fps, max:
184 fps
fps
100%
GeForce MX330:
27.4 [X] MSI Prestige 14 Intel Core i7-10510U 1.8GHz
GeForce MX330
min:
24 fps
fps
467%
GeForce RTX 2060 (Desktop):
128 [X] AMD Ryzen 7 2700X 3.7GHz
GeForce RTX 2060 (Desktop)
min:
118 fps, max:
138 fps
fps
555%
GeForce RTX 2080 Super Max-Q:
152 fps
100%
GeForce MX330:
20.6 [X] MSI Prestige 14 Intel Core i7-10510U 1.8GHz
GeForce MX330
min:
18 fps
fps
466%
GeForce RTX 2060 (Desktop):
96 [X] AMD Ryzen 7 2700X 3.7GHz
GeForce RTX 2060 (Desktop)
min:
90 fps, max:
102 fps
fps
549%
GeForce RTX 2080 Super Max-Q:
113 fps
100%
GeForce MX330:
18.2 [X] MSI Prestige 14 Intel Core i7-10510U 1.8GHz
GeForce MX330
min:
16 fps
fps
511%
GeForce RTX 2060 (Desktop):
93 [X] AMD Ryzen 7 2700X 3.7GHz
GeForce RTX 2060 (Desktop)
min:
86 fps, max:
103 fps
fps
577%
GeForce RTX 2080 Super Max-Q:
105 fps
GeForce RTX 2080 Super Max-Q:
73.9 fps
GeForce RTX 2060 (Desktop):
37.4 [X] AMD Ryzen 7 2700X 3.7GHz
GeForce RTX 2060 (Desktop)
min:
30 fps, max:
41 fps
fps
GeForce RTX 2080 Super Max-Q:
41.3 fps
100%
GeForce MX330:
112 [X] MSI Prestige 14 Intel Core i7-10510U 1.8GHz
GeForce MX330
min:
71 fps
fps
202%
GeForce RTX 2060 (Desktop):
226 [X] AMD Ryzen 7 2700X 3.7GHz
GeForce RTX 2060 (Desktop)
min:
97 fps, max:
300 fps
fps
100%
GeForce MX330:
30.1 [X] MSI Prestige 14 Intel Core i7-10510U 1.8GHz
GeForce MX330
min:
25 fps
fps
472%
GeForce RTX 2060 (Desktop):
142 [X] AMD Ryzen 7 2700X 3.7GHz
GeForce RTX 2060 (Desktop)
min:
77 fps, max:
174 fps
fps
372%
GeForce RTX 2080 Super Max-Q:
112 fps
100%
GeForce MX330:
23.1 [X] MSI Prestige 14 Intel Core i7-10510U 1.8GHz
GeForce MX330
min:
20 fps
fps
550%
GeForce RTX 2060 (Desktop):
127 [X] AMD Ryzen 7 2700X 3.7GHz
GeForce RTX 2060 (Desktop)
min:
73 fps, max:
146 fps
fps
472%
GeForce RTX 2080 Super Max-Q:
109 fps
100%
GeForce MX330:
20.5 [X] MSI Prestige 14 Intel Core i7-10510U 1.8GHz
GeForce MX330
min:
18 fps
fps
537%
GeForce RTX 2060 (Desktop):
110 [X] AMD Ryzen 7 2700X 3.7GHz
GeForce RTX 2060 (Desktop)
min:
71 fps, max:
125 fps
fps
502%
GeForce RTX 2080 Super Max-Q:
103 fps
GeForce RTX 2080 Super Max-Q:
82.1 fps
GeForce RTX 2060 (Desktop):
34.9 [X] AMD Ryzen 7 2700X 3.7GHz
GeForce RTX 2060 (Desktop)
min:
31 fps, max:
40 fps
fps
GeForce RTX 2080 Super Max-Q:
43.2 fps
100%
GeForce MX330:
59.4 [X] MSI Prestige 14 Intel Core i7-10510U 1.8GHz
GeForce MX330
min:
41 fps
fps
285%
GeForce RTX 2060 (Desktop):
169 [X] AMD Ryzen 7 2700X 3.7GHz
GeForce RTX 2060 (Desktop)
fps
276%
GeForce RTX 2080 Super Max-Q:
154.3 173 ~ 164 fps
100%
GeForce MX330:
29.4 [X] MSI Prestige 14 Intel Core i7-10510U 1.8GHz
GeForce MX330
min:
22 fps
fps
493%
GeForce RTX 2060 (Desktop):
145 [X] AMD Ryzen 7 2700X 3.7GHz
GeForce RTX 2060 (Desktop)
min:
113 fps, max:
178 fps
fps
466%
GeForce RTX 2080 Super Max-Q:
124.7 139 148 ~ 137 fps
100%
GeForce MX330:
23.2 [X] MSI Prestige 14 Intel Core i7-10510U 1.8GHz
GeForce MX330
min:
17 fps
fps
556%
GeForce RTX 2060 (Desktop):
129 [X] AMD Ryzen 7 2700X 3.7GHz
GeForce RTX 2060 (Desktop)
min:
100 fps, max:
177 fps
fps
100%
GeForce MX330:
18.7 [X] MSI Prestige 14 Intel Core i7-10510U 1.8GHz
GeForce MX330
min:
11 fps
fps
637%
GeForce RTX 2060 (Desktop):
119.1 [X] AMD Ryzen 7 2700X 3.7GHz
GeForce RTX 2060 (Desktop)
min:
94 fps, max:
167 fps
fps
GeForce RTX 2080 Super Max-Q:
95.4 96.1 ~ 96 fps
GeForce RTX 2060 (Desktop):
53.1 [X] AMD Ryzen 7 2700X 3.7GHz
GeForce RTX 2060 (Desktop)
min:
43 fps, max:
80 fps
fps
GeForce RTX 2080 Super Max-Q:
52.6 58.7 ~ 56 fps
100%
GeForce MX330:
164 [X] MSI Prestige 14 Intel Core i7-10510U 1.8GHz
GeForce MX330
min:
136 fps
fps
117%
GeForce RTX 2060 (Desktop):
191.1 [X] AMD Ryzen 7 2700X 3.7GHz
GeForce RTX 2060 (Desktop)
min:
160 fps, max:
256 fps
fps
100%
GeForce MX330:
62.2 [X] MSI Prestige 14 Intel Core i7-10510U 1.8GHz
GeForce MX330
min:
52 fps
fps
238%
GeForce RTX 2060 (Desktop):
147.9 [X] AMD Ryzen 7 2700X 3.7GHz
GeForce RTX 2060 (Desktop)
min:
131 fps, max:
201 fps
fps
100%
GeForce MX330:
37.5 [X] MSI Prestige 14 Intel Core i7-10510U 1.8GHz
GeForce MX330
min:
31 fps
fps
354%
GeForce RTX 2060 (Desktop):
132.7 [X] AMD Ryzen 7 2700X 3.7GHz
GeForce RTX 2060 (Desktop)
min:
117 fps, max:
181 fps
fps
100%
GeForce MX330:
28.3 [X] MSI Prestige 14 Intel Core i7-10510U 1.8GHz
GeForce MX330
min:
23 fps
fps
433%
GeForce RTX 2060 (Desktop):
122.4 [X] AMD Ryzen 7 2700X 3.7GHz
GeForce RTX 2060 (Desktop)
min:
108 fps, max:
163 fps
fps
GeForce RTX 2060 (Desktop):
54.9 [X] AMD Ryzen 7 2700X 3.7GHz
GeForce RTX 2060 (Desktop)
min:
42 fps, max:
98 fps
fps
GeForce RTX 2060 (Desktop):
60 [X] AMD Ryzen 7 2700X 3.7GHz
GeForce RTX 2060 (Desktop)
fps
GeForce RTX 2060 (Desktop):
60 [X] AMD Ryzen 7 2700X 3.7GHz
GeForce RTX 2060 (Desktop)
fps
GeForce RTX 2060 (Desktop):
60 [X] AMD Ryzen 7 2700X 3.7GHz
GeForce RTX 2060 (Desktop)
fps
GeForce RTX 2060 (Desktop):
60 [X] AMD Ryzen 7 2700X 3.7GHz
GeForce RTX 2060 (Desktop)
fps
GeForce RTX 2060 (Desktop):
60 [X] AMD Ryzen 7 2700X 3.7GHz
GeForce RTX 2060 (Desktop)
fps
GeForce RTX 2060 (Desktop):
50.6 [X] AMD Ryzen 7 2700X 3.7GHz
GeForce RTX 2060 (Desktop)
fps
100%
GeForce MX330:
37.1 [X] MSI Prestige 14 Intel Core i7-10510U 1.8GHz
GeForce MX330
min:
30 fps
fps
252%
GeForce RTX 2060 (Desktop):
93.4 [X] AMD Ryzen 7 2700X 3.7GHz
GeForce RTX 2060 (Desktop)
min:
73 fps, max:
125 fps
fps
100%
GeForce MX330:
23.7 [X] MSI Prestige 14 Intel Core i7-10510U 1.8GHz
GeForce MX330
min:
20 fps
fps
378%
GeForce RTX 2060 (Desktop):
89.7 [X] AMD Ryzen 7 2700X 3.7GHz
GeForce RTX 2060 (Desktop)
min:
66 fps, max:
122 fps
fps
366%
GeForce RTX 2080 Super Max-Q:
86.7 fps
100%
GeForce MX330:
13.3 [X] MSI Prestige 14 Intel Core i7-10510U 1.8GHz
GeForce MX330
min:
9 fps
fps
634%
GeForce RTX 2060 (Desktop):
84.3 [X] AMD Ryzen 7 2700X 3.7GHz
GeForce RTX 2060 (Desktop)
min:
61 fps, max:
116 fps
fps
591%
GeForce RTX 2080 Super Max-Q:
78.6 fps
100%
GeForce MX330:
11 [X] MSI Prestige 14 Intel Core i7-10510U 1.8GHz
GeForce MX330
min:
5 fps
fps
726%
GeForce RTX 2060 (Desktop):
79.9 [X] AMD Ryzen 7 2700X 3.7GHz
GeForce RTX 2060 (Desktop)
min:
61 fps, max:
117 fps
fps
700%
GeForce RTX 2080 Super Max-Q:
77 fps
GeForce RTX 2080 Super Max-Q:
76 fps
GeForce RTX 2060 (Desktop):
40.7 [X] AMD Ryzen 7 2700X 3.7GHz
GeForce RTX 2060 (Desktop)
min:
35 fps, max:
50 fps
fps
GeForce RTX 2080 Super Max-Q:
46.1 fps
GeForce RTX 2060 (Desktop):
223 [X] AMD Ryzen 7 2700X 3.7GHz
GeForce RTX 2060 (Desktop)
min:
195 fps, max:
254 fps
fps
GeForce RTX 2060 (Desktop):
157 [X] AMD Ryzen 7 2700X 3.7GHz
GeForce RTX 2060 (Desktop)
min:
110 fps, max:
191 fps
fps
GeForce RTX 2060 (Desktop):
147 [X] AMD Ryzen 7 2700X 3.7GHz
GeForce RTX 2060 (Desktop)
min:
109 fps, max:
185 fps
fps
GeForce RTX 2060 (Desktop):
133 [X] AMD Ryzen 7 2700X 3.7GHz
GeForce RTX 2060 (Desktop)
min:
60 fps, max:
170 fps
fps
GeForce RTX 2060 (Desktop):
39.7 [X] AMD Ryzen 7 2700X 3.7GHz
GeForce RTX 2060 (Desktop)
min:
25 fps, max:
55 fps
fps
100%
GeForce MX330:
40 [X] MSI Prestige 14 Intel Core i7-10510U 1.8GHz
GeForce MX330
min:
22 fps
fps
270%
GeForce RTX 2060 (Desktop):
108 [X] AMD Ryzen 7 2700X 3.7GHz
GeForce RTX 2060 (Desktop)
fps
255%
GeForce RTX 2080 Super Max-Q:
102 [X] MSI GS66 10SGS Intel Core i7-10750H 2.6GHz
GeForce RTX 2080 Super Max-Q
min:
48 fps, max:
161 fps
fps
100%
GeForce MX330:
19 [X] MSI Prestige 14 Intel Core i7-10510U 1.8GHz
GeForce MX330
min:
12 fps
fps
484%
GeForce RTX 2060 (Desktop):
92 [X] AMD Ryzen 7 2700X 3.7GHz
GeForce RTX 2060 (Desktop)
fps
474%
GeForce RTX 2080 Super Max-Q:
87 [X] MSI GS66 10SGS Intel Core i7-10750H 2.6GHz
GeForce RTX 2080 Super Max-Q
min:
39 fps, max:
143 fps
92 ~ 90 fps
100%
GeForce MX330:
14 [X] MSI Prestige 14 Intel Core i7-10510U 1.8GHz
GeForce MX330
min:
6 fps
fps
557%
GeForce RTX 2060 (Desktop):
78 [X] AMD Ryzen 7 2700X 3.7GHz
GeForce RTX 2060 (Desktop)
fps
550%
GeForce RTX 2080 Super Max-Q:
75 [X] MSI GS66 10SGS Intel Core i7-10750H 2.6GHz
GeForce RTX 2080 Super Max-Q
min:
33 fps, max:
139 fps
78 ~ 77 fps
100%
GeForce MX330:
7 [X] MSI Prestige 14 Intel Core i7-10510U 1.8GHz
GeForce MX330
min:
4 fps
fps
800%
GeForce RTX 2060 (Desktop):
56 [X] AMD Ryzen 7 2700X 3.7GHz
GeForce RTX 2060 (Desktop)
fps
800%
GeForce RTX 2080 Super Max-Q:
54 [X] MSI GS66 10SGS Intel Core i7-10750H 2.6GHz
GeForce RTX 2080 Super Max-Q
min:
35 fps, max:
89 fps
58 ~ 56 fps
GeForce RTX 2080 Super Max-Q:
53 fps
GeForce RTX 2060 (Desktop):
28 [X] AMD Ryzen 7 2700X 3.7GHz
GeForce RTX 2060 (Desktop)
fps
GeForce RTX 2080 Super Max-Q:
32 fps
100%
GeForce MX330:
62 fps
287%
GeForce RTX 2060 (Desktop):
178 [X] AMD Ryzen 7 2700X 3.7GHz
GeForce RTX 2060 (Desktop)
fps
100%
GeForce MX330:
31 fps
452%
GeForce RTX 2060 (Desktop):
140 [X] AMD Ryzen 7 2700X 3.7GHz
GeForce RTX 2060 (Desktop)
fps
100%
GeForce MX330:
22 fps
595%
GeForce RTX 2060 (Desktop):
131 [X] AMD Ryzen 7 2700X 3.7GHz
GeForce RTX 2060 (Desktop)
fps
100%
GeForce MX330:
16 fps
656%
GeForce RTX 2060 (Desktop):
105 [X] AMD Ryzen 7 2700X 3.7GHz
GeForce RTX 2060 (Desktop)
fps
GeForce RTX 2060 (Desktop):
59 [X] AMD Ryzen 7 2700X 3.7GHz
GeForce RTX 2060 (Desktop)
fps
GeForce RTX 2060 (Desktop):
234.5 [X] AMD Ryzen 7 2700X 3.7GHz
GeForce RTX 2060 (Desktop)
min:
222 fps, max:
242 fps
fps
GeForce RTX 2060 (Desktop):
205.4 [X] AMD Ryzen 7 2700X 3.7GHz
GeForce RTX 2060 (Desktop)
min:
191 fps, max:
218 fps
fps
GeForce RTX 2060 (Desktop):
194 [X] AMD Ryzen 7 2700X 3.7GHz
GeForce RTX 2060 (Desktop)
min:
186 fps, max:
206 fps
fps
GeForce RTX 2060 (Desktop):
186.2 [X] AMD Ryzen 7 2700X 3.7GHz
GeForce RTX 2060 (Desktop)
min:
176 fps, max:
203 fps
fps
GeForce RTX 2060 (Desktop):
151.2 [X] AMD Ryzen 7 2700X 3.7GHz
GeForce RTX 2060 (Desktop)
min:
146 fps, max:
155 fps
fps
289%
GeForce RTX 2060 (Desktop):
133 [X] AMD Ryzen 7 2700X 3.7GHz
GeForce RTX 2060 (Desktop)
fps
280%
GeForce RTX 2080 Super Max-Q:
103 117 138 [X] MSI GS66 10SGS Intel Core i7-10750H 2.6GHz
GeForce RTX 2080 Super Max-Q
min:
101 fps, max:
175 fps
139 150 ~ 129 fps
629%
GeForce RTX 2060 (Desktop):
107 [X] AMD Ryzen 7 2700X 3.7GHz
GeForce RTX 2060 (Desktop)
fps
100%
GeForce MX330:
10 12 ~ 11 fps
918%
GeForce RTX 2060 (Desktop):
101 [X] AMD Ryzen 7 2700X 3.7GHz
GeForce RTX 2060 (Desktop)
fps
100%
GeForce MX330:
8 10 ~ 9 fps
1000%
GeForce RTX 2060 (Desktop):
90 [X] AMD Ryzen 7 2700X 3.7GHz
GeForce RTX 2060 (Desktop)
fps
1067%
GeForce RTX 2080 Super Max-Q:
89 91 [X] Asus ROG Zephyrus Duo 15 GX550LXS Turbo
Intel Core i9-10980HK 2.4GHz
GeForce RTX 2080 Super Max-Q
92 92 [X] Razer Blade 15 RTX 2080 Super Max-Q GPU: Hoch
Intel Core i7-10875H 2.3GHz
GeForce RTX 2080 Super Max-Q
93 96 [X] MSI GS66 10SGS Intel Core i7-10750H 2.6GHz
GeForce RTX 2080 Super Max-Q
min:
81 fps, max:
156 fps
97 99 103 [X] SCHENKER Key 15 Comet Lake Leistungsmodus
Intel Core i7-10875H 2.3GHz
GeForce RTX 2080 Super Max-Q
106 ~ 96 fps
GeForce RTX 2080 Super Max-Q:
63 67 72 75 [X] Asus ROG Zephyrus Duo 15 GX550LXS Intel Core i9-10980HK 2.4GHz
GeForce RTX 2080 Super Max-Q
~ 69 fps
GeForce RTX 2060 (Desktop):
32 [X] AMD Ryzen 7 2700X 3.7GHz
GeForce RTX 2060 (Desktop)
fps
GeForce RTX 2080 Super Max-Q:
32 36 39 41 [X] Asus ROG Zephyrus Duo 15 GX550LXS Intel Core i9-10980HK 2.4GHz
GeForce RTX 2080 Super Max-Q
~ 37 fps
GeForce RTX 2060 (Desktop):
241 [X] AMD Ryzen 7 2700X 3.7GHz
GeForce RTX 2060 (Desktop)
min:
182 fps, max:
263 fps
fps
GeForce RTX 2060 (Desktop):
191 [X] AMD Ryzen 7 2700X 3.7GHz
GeForce RTX 2060 (Desktop)
min:
91 fps, max:
213 fps
fps
GeForce RTX 2060 (Desktop):
154 [X] AMD Ryzen 7 2700X 3.7GHz
GeForce RTX 2060 (Desktop)
min:
129 fps, max:
169 fps
fps
GeForce RTX 2060 (Desktop):
112 [X] AMD Ryzen 7 2700X 3.7GHz
GeForce RTX 2060 (Desktop)
min:
103 fps, max:
124 fps
fps
GeForce RTX 2060 (Desktop):
55 [X] AMD Ryzen 7 2700X 3.7GHz
GeForce RTX 2060 (Desktop)
min:
49 fps, max:
61 fps
fps
100%
GeForce MX330:
47.6 [X] MSI Prestige 14 Intel Core i7-10510U 1.8GHz
GeForce MX330
min:
39 fps
fps
303%
GeForce RTX 2060 (Desktop):
144 [X] AMD Ryzen 7 2700X 3.7GHz
GeForce RTX 2060 (Desktop)
min:
110 fps, max:
159 fps
fps
100%
GeForce MX330:
19.7 [X] MSI Prestige 14 Intel Core i7-10510U 1.8GHz
GeForce MX330
min:
17 fps
fps
579%
GeForce RTX 2060 (Desktop):
114 [X] AMD Ryzen 7 2700X 3.7GHz
GeForce RTX 2060 (Desktop)
min:
84 fps, max:
136 fps
fps
533%
GeForce RTX 2080 Super Max-Q:
105 fps
100%
GeForce MX330:
16.8 [X] MSI Prestige 14 Intel Core i7-10510U 1.8GHz
GeForce MX330
min:
14 fps
fps
649%
GeForce RTX 2060 (Desktop):
109 [X] AMD Ryzen 7 2700X 3.7GHz
GeForce RTX 2060 (Desktop)
min:
86 fps, max:
130 fps
fps
582%
GeForce RTX 2080 Super Max-Q:
97.7 fps
100%
GeForce MX330:
13.3 [X] MSI Prestige 14 Intel Core i7-10510U 1.8GHz
GeForce MX330
min:
11 fps
fps
647%
GeForce RTX 2060 (Desktop):
86 [X] AMD Ryzen 7 2700X 3.7GHz
GeForce RTX 2060 (Desktop)
min:
67 fps, max:
105 fps
fps
677%
GeForce RTX 2080 Super Max-Q:
90 fps
GeForce RTX 2080 Super Max-Q:
63.3 fps
GeForce RTX 2060 (Desktop):
27.5 [X] AMD Ryzen 7 2700X 3.7GHz
GeForce RTX 2060 (Desktop)
min:
24 fps, max:
32 fps
fps
GeForce RTX 2080 Super Max-Q:
31.9 fps
GeForce RTX 2060 (Desktop):
60 [X] AMD Ryzen 7 2700X 3.7GHz
GeForce RTX 2060 (Desktop)
fps
GeForce RTX 2060 (Desktop):
60 [X] AMD Ryzen 7 2700X 3.7GHz
GeForce RTX 2060 (Desktop)
fps
GeForce RTX 2060 (Desktop):
60 [X] AMD Ryzen 7 2700X 3.7GHz
GeForce RTX 2060 (Desktop)
fps
GeForce RTX 2060 (Desktop):
60 [X] AMD Ryzen 7 2700X 3.7GHz
GeForce RTX 2060 (Desktop)
fps
GeForce RTX 2060 (Desktop):
35.3 [X] AMD Ryzen 7 2700X 3.7GHz
GeForce RTX 2060 (Desktop)
fps
100%
GeForce MX330:
47 fps
249%
GeForce RTX 2060 (Desktop):
117 [X] AMD Ryzen 7 2700X 3.7GHz
GeForce RTX 2060 (Desktop)
min:
75 fps, max:
158 fps
fps
289%
GeForce RTX 2080 Super Max-Q:
111 143 154 ~ 136 fps
100%
GeForce MX330:
23 fps
448%
GeForce RTX 2060 (Desktop):
103 [X] AMD Ryzen 7 2700X 3.7GHz
GeForce RTX 2060 (Desktop)
min:
74 fps, max:
135 fps
fps
487%
GeForce RTX 2080 Super Max-Q:
100 115 122 ~ 112 fps
100%
GeForce MX330:
15 fps
660%
GeForce RTX 2060 (Desktop):
99 [X] AMD Ryzen 7 2700X 3.7GHz
GeForce RTX 2060 (Desktop)
min:
80 fps, max:
129 fps
fps
713%
GeForce RTX 2080 Super Max-Q:
96 108 116 ~ 107 fps
100%
GeForce MX330:
14 fps
671%
GeForce RTX 2060 (Desktop):
94 [X] AMD Ryzen 7 2700X 3.7GHz
GeForce RTX 2060 (Desktop)
min:
72 fps, max:
124 fps
fps
721%
GeForce RTX 2080 Super Max-Q:
91 101 102 110 ~ 101 fps
GeForce RTX 2080 Super Max-Q:
77 fps
GeForce RTX 2060 (Desktop):
41 [X] AMD Ryzen 7 2700X 3.7GHz
GeForce RTX 2060 (Desktop)
min:
37 fps, max:
49 fps
fps
GeForce RTX 2080 Super Max-Q:
42 fps
319%
GeForce RTX 2080 Super Max-Q:
67 fps
100%
GeForce MX330:
49.8 [X] MSI Prestige 14 Intel Core i7-10510U 1.8GHz
GeForce MX330
min:
39 fps
fps
257%
GeForce RTX 2060 (Desktop):
128 [X] AMD Ryzen 7 2700X 3.7GHz
GeForce RTX 2060 (Desktop)
min:
61 fps, max:
162 fps
fps
100%
GeForce MX330:
21.3 [X] MSI Prestige 14 Intel Core i7-10510U 1.8GHz
GeForce MX330
min:
16 fps
fps
535%
GeForce RTX 2060 (Desktop):
114 [X] AMD Ryzen 7 2700X 3.7GHz
GeForce RTX 2060 (Desktop)
min:
61 fps, max:
139 fps
fps
559%
GeForce RTX 2080 Super Max-Q:
119 fps
100%
GeForce MX330:
18.3 [X] MSI Prestige 14 Intel Core i7-10510U 1.8GHz
GeForce MX330
min:
14 fps
fps
497%
GeForce RTX 2060 (Desktop):
91 [X] AMD Ryzen 7 2700X 3.7GHz
GeForce RTX 2060 (Desktop)
min:
62 fps, max:
112 fps
fps
546%
GeForce RTX 2080 Super Max-Q:
100 fps
100%
GeForce MX330:
12.3 [X] MSI Prestige 14 Intel Core i7-10510U 1.8GHz
GeForce MX330
min:
9 fps
fps
569%
GeForce RTX 2060 (Desktop):
70 [X] AMD Ryzen 7 2700X 3.7GHz
GeForce RTX 2060 (Desktop)
min:
50 fps, max:
83 fps
fps
585%
GeForce RTX 2080 Super Max-Q:
72 fps
GeForce RTX 2080 Super Max-Q:
56.1 fps
GeForce RTX 2060 (Desktop):
25 [X] AMD Ryzen 7 2700X 3.7GHz
GeForce RTX 2060 (Desktop)
min:
21 fps, max:
29 fps
fps
GeForce RTX 2080 Super Max-Q:
31.9 fps
100%
GeForce MX330:
37.1 [X] MSI Prestige 14 Intel Core i7-10510U 1.8GHz
GeForce MX330
min:
12 fps
fps
409%
GeForce RTX 2060 (Desktop):
151.9 [X] AMD Ryzen 7 2700X 3.7GHz
GeForce RTX 2060 (Desktop)
min:
95 fps, max:
175 fps
fps
100%
GeForce MX330:
18 [X] MSI Prestige 14 Intel Core i7-10510U 1.8GHz
GeForce MX330
min:
10 fps
fps
553%
GeForce RTX 2060 (Desktop):
99.6 [X] AMD Ryzen 7 2700X 3.7GHz
GeForce RTX 2060 (Desktop)
min:
73 fps, max:
132 fps
fps
572%
GeForce RTX 2080 Super Max-Q:
103 fps
100%
GeForce MX330:
11.2 [X] MSI Prestige 14 Intel Core i7-10510U 1.8GHz
GeForce MX330
min:
5 fps
fps
648%
GeForce RTX 2060 (Desktop):
72.6 [X] AMD Ryzen 7 2700X 3.7GHz
GeForce RTX 2060 (Desktop)
min:
31 fps, max:
114 fps
fps
661%
GeForce RTX 2080 Super Max-Q:
67 80.8 ~ 74 fps
GeForce RTX 2060 (Desktop):
30.8 [X] AMD Ryzen 7 2700X 3.7GHz
GeForce RTX 2060 (Desktop)
min:
13 fps, max:
45 fps
fps
GeForce RTX 2080 Super Max-Q:
37.6 fps
100%
GeForce MX330:
95 [X] MSI Prestige 14 Intel Core i7-10510U 1.8GHz
GeForce MX330
min:
72 fps
fps
226%
GeForce RTX 2060 (Desktop):
214.4 [X] AMD Ryzen 7 2700X 3.7GHz
GeForce RTX 2060 (Desktop)
min:
159 fps, max:
274 fps
fps
100%
GeForce MX330:
63.3 [X] MSI Prestige 14 Intel Core i7-10510U 1.8GHz
GeForce MX330
min:
28 fps
fps
283%
GeForce RTX 2060 (Desktop):
179.2 [X] AMD Ryzen 7 2700X 3.7GHz
GeForce RTX 2060 (Desktop)
min:
128 fps, max:
238 fps
fps
191%
GeForce RTX 2080 Super Max-Q:
121 fps
100%
GeForce MX330:
33.7 [X] MSI Prestige 14 Intel Core i7-10510U 1.8GHz
GeForce MX330
min:
26 fps
fps
460%
GeForce RTX 2060 (Desktop):
155 [X] AMD Ryzen 7 2700X 3.7GHz
GeForce RTX 2060 (Desktop)
min:
124 fps, max:
198 fps
fps
338%
GeForce RTX 2080 Super Max-Q:
114 fps
100%
GeForce MX330:
21 [X] MSI Prestige 14 Intel Core i7-10510U 1.8GHz
GeForce MX330
min:
16 fps
fps
671%
GeForce RTX 2060 (Desktop):
141 [X] AMD Ryzen 7 2700X 3.7GHz
GeForce RTX 2060 (Desktop)
min:
118 fps, max:
156 fps
fps
474%
GeForce RTX 2080 Super Max-Q:
99.5 fps
GeForce RTX 2080 Super Max-Q:
80.3 fps
GeForce RTX 2060 (Desktop):
38 [X] AMD Ryzen 7 2700X 3.7GHz
GeForce RTX 2060 (Desktop)
min:
32 fps, max:
42 fps
fps
GeForce RTX 2080 Super Max-Q:
44.5 fps
GeForce RTX 2060 (Desktop):
243 [X] AMD Ryzen 7 2700X 3.7GHz
GeForce RTX 2060 (Desktop)
min:
149 fps, max:
361 fps
fps
GeForce RTX 2060 (Desktop):
231 [X] AMD Ryzen 7 2700X 3.7GHz
GeForce RTX 2060 (Desktop)
min:
152 fps, max:
335 fps
fps
GeForce RTX 2060 (Desktop):
155 [X] AMD Ryzen 7 2700X 3.7GHz
GeForce RTX 2060 (Desktop)
min:
116 fps, max:
205 fps
fps
GeForce RTX 2060 (Desktop):
128 [X] AMD Ryzen 7 2700X 3.7GHz
GeForce RTX 2060 (Desktop)
min:
62 fps, max:
161 fps
fps
GeForce RTX 2060 (Desktop):
68 [X] AMD Ryzen 7 2700X 3.7GHz
GeForce RTX 2060 (Desktop)
min:
39 fps, max:
83 fps
fps
GeForce RTX 2060 (Desktop):
113 [X] AMD Ryzen 7 2700X 3.7GHz
GeForce RTX 2060 (Desktop)
fps
GeForce RTX 2060 (Desktop):
97 [X] AMD Ryzen 7 2700X 3.7GHz
GeForce RTX 2060 (Desktop)
fps
GeForce RTX 2060 (Desktop):
92 [X] AMD Ryzen 7 2700X 3.7GHz
GeForce RTX 2060 (Desktop)
fps
GeForce RTX 2060 (Desktop):
78 [X] AMD Ryzen 7 2700X 3.7GHz
GeForce RTX 2060 (Desktop)
fps
GeForce RTX 2060 (Desktop):
39 [X] AMD Ryzen 7 2700X 3.7GHz
GeForce RTX 2060 (Desktop)
fps
GeForce RTX 2060 (Desktop):
137 [X] AMD Ryzen 7 2700X 3.7GHz
GeForce RTX 2060 (Desktop)
P1:
86.1 fps
fps
GeForce RTX 2060 (Desktop):
135 [X] AMD Ryzen 7 2700X 3.7GHz
GeForce RTX 2060 (Desktop)
P1:
85.8 fps
fps
GeForce RTX 2060 (Desktop):
136 [X] AMD Ryzen 7 2700X 3.7GHz
GeForce RTX 2060 (Desktop)
P1:
84.9 fps
fps
GeForce RTX 2060 (Desktop):
103 [X] AMD Ryzen 7 2700X 3.7GHz
GeForce RTX 2060 (Desktop)
P1:
42.1 fps
fps
GeForce RTX 2060 (Desktop):
49.7 [X] AMD Ryzen 7 2700X 3.7GHz
GeForce RTX 2060 (Desktop)
P1:
38.2 fps
fps
GeForce RTX 2060 (Desktop):
189.5 [X] AMD Ryzen 7 2700X 3.7GHz
GeForce RTX 2060 (Desktop)
min:
161 fps, max:
207 fps
fps
GeForce RTX 2060 (Desktop):
166.7 [X] AMD Ryzen 7 2700X 3.7GHz
GeForce RTX 2060 (Desktop)
min:
147 fps, max:
188 fps
fps
GeForce RTX 2060 (Desktop):
158.7 [X] AMD Ryzen 7 2700X 3.7GHz
GeForce RTX 2060 (Desktop)
min:
126 fps, max:
184 fps
fps
GeForce RTX 2060 (Desktop):
121.6 [X] AMD Ryzen 7 2700X 3.7GHz
GeForce RTX 2060 (Desktop)
min:
110 fps, max:
134 fps
fps
GeForce RTX 2060 (Desktop):
44.3 [X] AMD Ryzen 7 2700X 3.7GHz
GeForce RTX 2060 (Desktop)
min:
37 fps, max:
52 fps
fps
GeForce RTX 2060 (Desktop):
312 [X] AMD Ryzen 7 2700X 3.7GHz
GeForce RTX 2060 (Desktop)
min:
297 fps, max:
328 fps
fps
GeForce RTX 2060 (Desktop):
196 [X] AMD Ryzen 7 2700X 3.7GHz
GeForce RTX 2060 (Desktop)
min:
177 fps, max:
210 fps
fps
GeForce RTX 2060 (Desktop):
117 [X] AMD Ryzen 7 2700X 3.7GHz
GeForce RTX 2060 (Desktop)
min:
104 fps, max:
139 fps
fps
GeForce RTX 2060 (Desktop):
68 [X] AMD Ryzen 7 2700X 3.7GHz
GeForce RTX 2060 (Desktop)
min:
61 fps, max:
80 fps
fps
100%
GeForce MX330:
178 fps
138%
GeForce RTX 2060 (Desktop):
246 [X] AMD Ryzen 7 2700X 3.7GHz
GeForce RTX 2060 (Desktop)
min:
225 fps, max:
252 fps
fps
100%
GeForce MX330:
59.3 fps
418%
GeForce RTX 2060 (Desktop):
248 [X] AMD Ryzen 7 2700X 3.7GHz
GeForce RTX 2060 (Desktop)
min:
235 fps, max:
251 fps
fps
100%
GeForce MX330:
47.4 fps
466%
GeForce RTX 2060 (Desktop):
221 [X] AMD Ryzen 7 2700X 3.7GHz
GeForce RTX 2060 (Desktop)
min:
183 fps, max:
251 fps
fps
GeForce RTX 2060 (Desktop):
115 [X] AMD Ryzen 7 2700X 3.7GHz
GeForce RTX 2060 (Desktop)
min:
96 fps, max:
160 fps
fps
GeForce RTX 2060 (Desktop):
149 [X] AMD Ryzen 7 2700X 3.7GHz
GeForce RTX 2060 (Desktop)
min:
127 fps, max:
167 fps
fps
GeForce RTX 2060 (Desktop):
103 [X] AMD Ryzen 7 2700X 3.7GHz
GeForce RTX 2060 (Desktop)
min:
90 fps, max:
115 fps
fps
GeForce RTX 2060 (Desktop):
97 [X] AMD Ryzen 7 2700X 3.7GHz
GeForce RTX 2060 (Desktop)
min:
85 fps, max:
108 fps
fps
GeForce RTX 2060 (Desktop):
56 [X] AMD Ryzen 7 2700X 3.7GHz
GeForce RTX 2060 (Desktop)
min:
49 fps, max:
63 fps
fps
GeForce RTX 2060 (Desktop):
38 [X] AMD Ryzen 7 2700X 3.7GHz
GeForce RTX 2060 (Desktop)
min:
29 fps, max:
44 fps
fps
GeForce RTX 2060 (Desktop):
265 [X] AMD Ryzen 7 2700X 3.7GHz
GeForce RTX 2060 (Desktop)
min:
55 fps, max:
380 fps
fps
GeForce RTX 2060 (Desktop):
163 [X] AMD Ryzen 7 2700X 3.7GHz
GeForce RTX 2060 (Desktop)
min:
79 fps, max:
207 fps
fps
GeForce RTX 2060 (Desktop):
157 [X] AMD Ryzen 7 2700X 3.7GHz
GeForce RTX 2060 (Desktop)
min:
86 fps, max:
201 fps
fps
GeForce RTX 2060 (Desktop):
122 [X] AMD Ryzen 7 2700X 3.7GHz
GeForce RTX 2060 (Desktop)
min:
72 fps, max:
171 fps
fps
GeForce RTX 2060 (Desktop):
53 [X] AMD Ryzen 7 2700X 3.7GHz
GeForce RTX 2060 (Desktop)
min:
39 fps, max:
63 fps
fps
GeForce RTX 2060 (Desktop):
139.2 [X] AMD Ryzen 7 2700X 3.7GHz
GeForce RTX 2060 (Desktop)
min:
107 fps, max:
171 fps
fps
GeForce RTX 2060 (Desktop):
126 [X] AMD Ryzen 7 2700X 3.7GHz
GeForce RTX 2060 (Desktop)
min:
97 fps, max:
158 fps
fps
GeForce RTX 2060 (Desktop):
94.6 [X] AMD Ryzen 7 2700X 3.7GHz
GeForce RTX 2060 (Desktop)
min:
80 fps, max:
106 fps
fps
GeForce RTX 2060 (Desktop):
66 [X] AMD Ryzen 7 2700X 3.7GHz
GeForce RTX 2060 (Desktop)
min:
51 fps, max:
75 fps
fps
GeForce RTX 2060 (Desktop):
38.5 [X] AMD Ryzen 7 2700X 3.7GHz
GeForce RTX 2060 (Desktop)
min:
35 fps, max:
43 fps
fps
GeForce RTX 2060 (Desktop):
179 [X] AMD Ryzen 7 2700X 3.7GHz
GeForce RTX 2060 (Desktop)
min:
151 fps, max:
195 fps
fps
GeForce RTX 2060 (Desktop):
162 [X] AMD Ryzen 7 2700X 3.7GHz
GeForce RTX 2060 (Desktop)
min:
147 fps, max:
177 fps
fps
GeForce RTX 2060 (Desktop):
143 [X] AMD Ryzen 7 2700X 3.7GHz
GeForce RTX 2060 (Desktop)
min:
126 fps, max:
154 fps
fps
GeForce RTX 2060 (Desktop):
133 [X] AMD Ryzen 7 2700X 3.7GHz
GeForce RTX 2060 (Desktop)
min:
120 fps, max:
147 fps
fps
GeForce RTX 2060 (Desktop):
59.8 [X] AMD Ryzen 7 2700X 3.7GHz
GeForce RTX 2060 (Desktop)
min:
56 fps, max:
63 fps
fps
GeForce RTX 2060 (Desktop):
149.9 [X] AMD Ryzen 7 2700X 3.7GHz
GeForce RTX 2060 (Desktop)
min:
44 fps, max:
214 fps
fps
GeForce RTX 2060 (Desktop):
140 [X] AMD Ryzen 7 2700X 3.7GHz
GeForce RTX 2060 (Desktop)
min:
91 fps, max:
204 fps
fps
GeForce RTX 2060 (Desktop):
103.5 [X] AMD Ryzen 7 2700X 3.7GHz
GeForce RTX 2060 (Desktop)
min:
82 fps, max:
135 fps
fps
GeForce RTX 2060 (Desktop):
75.7 [X] AMD Ryzen 7 2700X 3.7GHz
GeForce RTX 2060 (Desktop)
min:
56 fps, max:
100 fps
fps
GeForce RTX 2060 (Desktop):
37.3 [X] AMD Ryzen 7 2700X 3.7GHz
GeForce RTX 2060 (Desktop)
min:
32 fps, max:
46 fps
fps
GeForce RTX 2060 (Desktop):
279.9 [X] AMD Ryzen 7 2700X 3.7GHz
GeForce RTX 2060 (Desktop)
min:
274 fps, max:
284 fps
fps
GeForce RTX 2060 (Desktop):
275.2 [X] AMD Ryzen 7 2700X 3.7GHz
GeForce RTX 2060 (Desktop)
min:
263 fps, max:
283 fps
fps
GeForce RTX 2060 (Desktop):
266.8 [X] AMD Ryzen 7 2700X 3.7GHz
GeForce RTX 2060 (Desktop)
min:
216 fps, max:
282 fps
fps
GeForce RTX 2060 (Desktop):
110.2 [X] AMD Ryzen 7 2700X 3.7GHz
GeForce RTX 2060 (Desktop)
min:
92 fps, max:
126 fps
fps
GeForce RTX 2060 (Desktop):
102.2 [X] AMD Ryzen 7 2700X 3.7GHz
GeForce RTX 2060 (Desktop)
min:
86 fps, max:
119 fps
fps
GeForce RTX 2060 (Desktop):
164.4 [X] AMD Ryzen 7 2700X 3.7GHz
GeForce RTX 2060 (Desktop)
min:
84 fps, max:
201 fps
fps
GeForce RTX 2060 (Desktop):
149.2 [X] AMD Ryzen 7 2700X 3.7GHz
GeForce RTX 2060 (Desktop)
min:
114 fps, max:
191 fps
fps
GeForce RTX 2060 (Desktop):
141.3 [X] AMD Ryzen 7 2700X 3.7GHz
GeForce RTX 2060 (Desktop)
min:
97 fps, max:
198 fps
fps
GeForce RTX 2060 (Desktop):
139.5 [X] AMD Ryzen 7 2700X 3.7GHz
GeForce RTX 2060 (Desktop)
min:
94 fps, max:
195 fps
fps
GeForce RTX 2060 (Desktop):
78.7 [X] AMD Ryzen 7 2700X 3.7GHz
GeForce RTX 2060 (Desktop)
min:
66 fps, max:
98 fps
fps
GeForce RTX 2060 (Desktop):
278 [X] AMD Ryzen 7 2700X 3.7GHz
GeForce RTX 2060 (Desktop)
fps
GeForce RTX 2060 (Desktop):
218 [X] AMD Ryzen 7 2700X 3.7GHz
GeForce RTX 2060 (Desktop)
fps
GeForce RTX 2060 (Desktop):
120 [X] AMD Ryzen 7 2700X 3.7GHz
GeForce RTX 2060 (Desktop)
fps
GeForce RTX 2060 (Desktop):
95 [X] AMD Ryzen 7 2700X 3.7GHz
GeForce RTX 2060 (Desktop)
fps
GeForce RTX 2060 (Desktop):
49 [X] AMD Ryzen 7 2700X 3.7GHz
GeForce RTX 2060 (Desktop)
fps
GeForce RTX 2060 (Desktop):
119 [X] AMD Ryzen 7 2700X 3.7GHz
GeForce RTX 2060 (Desktop)
min:
93 fps, max:
136 fps
fps
GeForce RTX 2060 (Desktop):
107 [X] AMD Ryzen 7 2700X 3.7GHz
GeForce RTX 2060 (Desktop)
min:
81 fps, max:
126 fps
fps
GeForce RTX 2060 (Desktop):
97 [X] AMD Ryzen 7 2700X 3.7GHz
GeForce RTX 2060 (Desktop)
min:
74 fps, max:
112 fps
fps
GeForce RTX 2060 (Desktop):
91 [X] AMD Ryzen 7 2700X 3.7GHz
GeForce RTX 2060 (Desktop)
min:
66 fps, max:
109 fps
fps
GeForce RTX 2060 (Desktop):
50 [X] AMD Ryzen 7 2700X 3.7GHz
GeForce RTX 2060 (Desktop)
min:
46 fps, max:
55 fps
fps
GeForce RTX 2060 (Desktop):
268 [X] AMD Ryzen 7 2700X 3.7GHz
GeForce RTX 2060 (Desktop)
min:
254 fps, max:
281 fps
fps
GeForce RTX 2060 (Desktop):
189 [X] AMD Ryzen 7 2700X 3.7GHz
GeForce RTX 2060 (Desktop)
min:
151 fps, max:
201 fps
fps
GeForce RTX 2060 (Desktop):
136 [X] AMD Ryzen 7 2700X 3.7GHz
GeForce RTX 2060 (Desktop)
min:
127 fps, max:
149 fps
fps
GeForce RTX 2060 (Desktop):
113 [X] AMD Ryzen 7 2700X 3.7GHz
GeForce RTX 2060 (Desktop)
min:
102 fps, max:
124 fps
fps
GeForce RTX 2060 (Desktop):
47.3 [X] AMD Ryzen 7 2700X 3.7GHz
GeForce RTX 2060 (Desktop)
min:
43 fps, max:
55 fps
fps
GeForce RTX 2060 (Desktop):
244 [X] AMD Ryzen 7 2700X 3.7GHz
GeForce RTX 2060 (Desktop)
min:
80 fps, max:
509 fps
fps
GeForce RTX 2060 (Desktop):
297 [X] AMD Ryzen 7 2700X 3.7GHz
GeForce RTX 2060 (Desktop)
min:
62 fps, max:
456 fps
fps
GeForce RTX 2060 (Desktop):
238 [X] AMD Ryzen 7 2700X 3.7GHz
GeForce RTX 2060 (Desktop)
min:
73 fps, max:
319 fps
fps
GeForce RTX 2060 (Desktop):
223 [X] AMD Ryzen 7 2700X 3.7GHz
GeForce RTX 2060 (Desktop)
min:
40 fps, max:
277 fps
fps
GeForce RTX 2060 (Desktop):
97 [X] AMD Ryzen 7 2700X 3.7GHz
GeForce RTX 2060 (Desktop)
min:
78 fps, max:
112 fps
fps
425%
GeForce RTX 2080 Super Max-Q:
102 fps
448%
GeForce RTX 2060 (Desktop):
286.7 [X] AMD Ryzen 7 2700X 3.7GHz
GeForce RTX 2060 (Desktop)
min:
265 fps, max:
336 fps
fps
100%
GeForce MX330:
34.2 37 ~ 36 fps
568%
GeForce RTX 2060 (Desktop):
204.5 [X] AMD Ryzen 7 2700X 3.7GHz
GeForce RTX 2060 (Desktop)
min:
163 fps, max:
231 fps
fps
714%
GeForce RTX 2060 (Desktop):
135.7 [X] AMD Ryzen 7 2700X 3.7GHz
GeForce RTX 2060 (Desktop)
min:
113 fps, max:
150 fps
fps
100%
GeForce MX330:
11.2 12 ~ 12 fps
606%
GeForce RTX 2060 (Desktop):
72.7 [X] AMD Ryzen 7 2700X 3.7GHz
GeForce RTX 2060 (Desktop)
min:
61 fps, max:
82 fps
fps
708%
GeForce RTX 2080 Super Max-Q:
74.3 75.1 75.8 82.6 83.4 87.7 88.6 [X] Razer Blade 15 RTX 2080 Super Max-Q GPU: Hoch
Intel Core i7-10875H 2.3GHz
GeForce RTX 2080 Super Max-Q
88.8 90.2 95.8 [X] Asus ROG Zephyrus Duo 15 GX550LXS Turbo
Intel Core i9-10980HK 2.4GHz
GeForce RTX 2080 Super Max-Q
96 [X] SCHENKER Key 15 Comet Lake Leistungsmodus
Intel Core i7-10875H 2.3GHz
GeForce RTX 2080 Super Max-Q
~ 85 fps
GeForce RTX 2060 (Desktop):
51.3 [X] AMD Ryzen 7 2700X 3.7GHz
GeForce RTX 2060 (Desktop)
min:
44 fps, max:
58 fps
fps
GeForce RTX 2080 Super Max-Q:
49.8 53.5 54.3 [X] Asus ROG Zephyrus Duo 15 GX550LXS Turbo
Intel Core i9-10980HK 2.4GHz
GeForce RTX 2080 Super Max-Q
58.2 ~ 54 fps
GeForce RTX 2060 (Desktop):
174.4 [X] AMD Ryzen 7 2700X 3.7GHz
GeForce RTX 2060 (Desktop)
fps
GeForce RTX 2080 Super Max-Q:
179 180 [X] MSI Creator 17 A10SGS Intel Core i7-10875H 2.3GHz
GeForce RTX 2080 Super Max-Q
min:
3.47 fps, P1:
143 fps, max:
253 fps
~ 180 fps
GeForce RTX 2060 (Desktop):
166.4 [X] AMD Ryzen 7 2700X 3.7GHz
GeForce RTX 2060 (Desktop)
fps
GeForce RTX 2080 Super Max-Q:
172 174 [X] MSI Creator 17 A10SGS Intel Core i7-10875H 2.3GHz
GeForce RTX 2080 Super Max-Q
min:
5.72 fps, P1:
125 fps, max:
348 fps
~ 173 fps
GeForce RTX 2060 (Desktop):
148.4 [X] AMD Ryzen 7 2700X 3.7GHz
GeForce RTX 2060 (Desktop)
fps
GeForce RTX 2080 Super Max-Q:
153 157 [X] MSI Creator 17 A10SGS Intel Core i7-10875H 2.3GHz
GeForce RTX 2080 Super Max-Q
min:
7.17 fps, P1:
100 fps, max:
309 fps
~ 155 fps
GeForce RTX 2060 (Desktop):
100.5 [X] AMD Ryzen 7 2700X 3.7GHz
GeForce RTX 2060 (Desktop)
fps
GeForce RTX 2080 Super Max-Q:
85.3 85.8 ~ 86 fps
GeForce RTX 2060 (Desktop):
66.7 [X] AMD Ryzen 7 2700X 3.7GHz
GeForce RTX 2060 (Desktop)
fps
GeForce RTX 2080 Super Max-Q:
71.5 [X] MSI Creator 17 A10SGS Intel Core i7-10875H 2.3GHz
GeForce RTX 2080 Super Max-Q
min:
26.5 fps, P1:
52.6 fps, max:
150 fps
fps
GeForce RTX 2060 (Desktop):
199.4 [X] AMD Ryzen 7 2700X 3.7GHz
GeForce RTX 2060 (Desktop)
min:
185 fps, max:
202 fps
fps
GeForce RTX 2060 (Desktop):
199.6 [X] AMD Ryzen 7 2700X 3.7GHz
GeForce RTX 2060 (Desktop)
min:
184.201 fps
fps
GeForce RTX 2060 (Desktop):
199.8 [X] AMD Ryzen 7 2700X 3.7GHz
GeForce RTX 2060 (Desktop)
min:
188 fps, max:
201 fps
fps
GeForce RTX 2060 (Desktop):
163.9 [X] AMD Ryzen 7 2700X 3.7GHz
GeForce RTX 2060 (Desktop)
min:
149 fps, max:
194 fps
fps
GeForce RTX 2060 (Desktop):
55.4 [X] AMD Ryzen 7 2700X 3.7GHz
GeForce RTX 2060 (Desktop)
min:
48 fps, max:
67 fps
fps
100%
GeForce MX330:
173.9 fps
230%
GeForce RTX 2080 Super Max-Q:
347.4 400 [X] Asus ROG Zephyrus Duo 15 GX550LXS Turbo
Intel Core i9-10980HK 2.4GHz
GeForce RTX 2080 Super Max-Q
425.1 426.3 ~ 400 fps
100%
GeForce MX330:
113.8 fps
305%
GeForce RTX 2080 Super Max-Q:
330.2 344.4 [X] Asus ROG Zephyrus Duo 15 GX550LXS Turbo
Intel Core i9-10980HK 2.4GHz
GeForce RTX 2080 Super Max-Q
349.2 364.5 ~ 347 fps
100%
GeForce MX330:
96 fps
330%
GeForce RTX 2080 Super Max-Q:
300.5 319.9 [X] Asus ROG Zephyrus Duo 15 GX550LXS Turbo
Intel Core i9-10980HK 2.4GHz
GeForce RTX 2080 Super Max-Q
323.7 324.2 ~ 317 fps
100%
GeForce MX330:
37.9 fps
459%
GeForce RTX 2080 Super Max-Q:
170.2 173 173.1 181.1 [X] Asus ROG Zephyrus Duo 15 GX550LXS Turbo
Intel Core i9-10980HK 2.4GHz
GeForce RTX 2080 Super Max-Q
~ 174 fps
Average Gaming NVIDIA GeForce MX330 → 100% Average Gaming 30-70 fps → 100%
Average Gaming NVIDIA GeForce RTX 2060 (Desktop) → 591% Average Gaming 30-70 fps → 726%
Average Gaming NVIDIA GeForce RTX 2080 Super Max-Q → 587% Average Gaming 30-70 fps → 841%
 Deutsch
 English
 Español
 Français
 Italiano
 Nederlands
 Polski
 Português
 Русский
 Türkçe
 Svenska
 Chinese
 Magyar