NVIDIA GeForce GTX 560M vs NVIDIA GeForce RTX 4070 Ti SUPER
NVIDIA GeForce GTX 560M ► remove from comparison
The NVIDIA GeForce GTX 560M is a high-end laptop graphics card that was announced at Computex 2011. It is based on the new GF116 core as part of the Fermi architecture. Therefore, it supports DirectX 11 and OpenGL 4.0. Compared to its predecessor, the GeForce GTX 460M, the 560M offers higher clock speeds without a large increase in power demand.
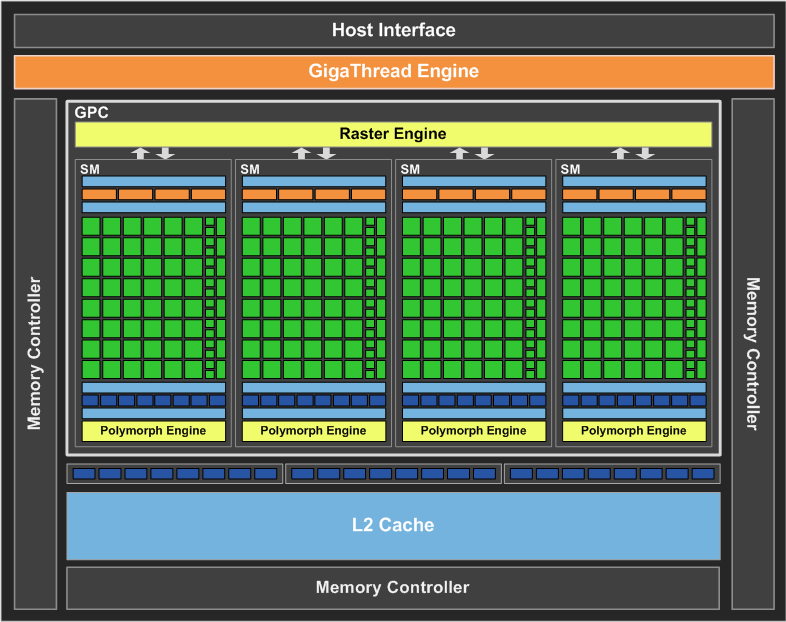
The GF116 core is essentially an optimized GF106 core with the same features. The chip offers 192 shaders and a 192 Bit memory bus for GDDR5. More details on the GF106 architecture can be found in the GeForce GTX 460M article.
The performance of the GeForce GTX 560M is compareable to the older GeForce GTX 480M . In our tests (see benchmarks below), the GTX 560M was on average 13% faster than the old GTX 460M. As a result, only very demanding games (e.g., Crysis 1, Crysis 2, Dirt 3 and Metro 2033) are not fluently playable at highest settings and Full HD resolution with Anti Aliasing. Most other current and older games can be played with maxed out settings as of 2011. See at the end of this page for detailled gaming benchmarks of many current games.
As the GeForce GTX 460M, the 560M supports Bitstream HD Audio (Blu-Ray) output via HDMI. Similar to the Radeon HD 5850, the GTX 460M can transfer Dolby True HD and DTS-HD bitstream-wise without quality loss to a HiFi receiver.
The GTX560M offers PureVideo HD technology for video decoding. The included Video Processor 4 (VP4) supports feature set C and therefore the GPU is able to fully decode MPEG-1, MPEG-2, MPEG-4 Part 2 (MPEG-4 ASP - e.g., DivX or Xvid), VC-1/WMV9, and H.264 (VLD, IDCT, Motion Compensation, and Deblocking). The X500 tester was able to decode the VC-1 encoded Elephants Dream video with about 3-6% CPU load (according to the task manager). The H.264 coded Big Buck Bunny video was played back with 1-3% CPU load (both 1080p videos).
Furthermore, the GPU is able to decode two 1080p streams simultaneously (e.g., Blu-Ray Picture-in-Picture).
Through CUDA , OpenCL and DirectCompute 2.1 support, the GeForce GTX 560M can be of use in general calculations. For example, the stream processor can encode videos considerably faster than can many modern CPUs.
3D Vision enables the laptop to send 3D content (3D games, 3D Web Streaming, 3D photos, 3D Blu-Rays) to a built-in 3D-enabled screen or an external 3D TV if supported by the laptop manufacturer.
The power consumption of the GeForce GTX 560M should be about 75 Watt (TDP including the MXM board and memory), which is about the same level of the Mobility Radeon HD 5850 - 5870. If not under load, the chip is clocked at 50/100 MHz (chip/shader) and 200/400 MHz in 2D mode and 3D mode, respectively, to save power. Furthermore, the 500M series supports Optimus to automatically switch between the integrated graphics card from Intel and the Nvidia GPU. However, whether this feature is included or not is dependent on the notebook manufacturer.
The similarly named desktop GeForce GTX 560Ti is based on the GF114 chip and offers more shader cores and significantly higher performance than the GTX 560M. The GTX 550Ti is based on the GF116 and is closer to the 560M in terms of performance, but it still features relatively higher clock speeds. Therefore, the performance of the 560M is more on par with the older desktop GeForce GTS 450.
NVIDIA GeForce RTX 4070 Ti SUPER ► remove from comparison
The Nvidia GeForce RTX 4070 Ti SUPER is a high-end desktop graphics card based on the Ada Lovelace architecture. It uses the AD103 chip and offers 8.448 cores and 16 GB GDDR6X graphics memory (256-bit bus with 22.4 Gbits).
The gaming performance is still sufficient for 4k with ultra settings, even in demanding games such as Cyberpunk, but 60 fps is no longer always achieved. With ray tracing, the use of DLSS and possibly reducing the resolution is recommended. In a competitive comparison, the SUPER variant ranks, as expected, between the RTX 4080 and the old 4070 Ti in a competitive comparison.
The AD103 chip is produced at TSMC in 5nm (4N with EUV) and is specified with a TGP (Total Graphics Power) of 285 watts.
NVIDIA GeForce GTX 560M NVIDIA GeForce RTX 4070 Ti SUPER GeForce RTX 4000 Series Codename N12E-GS AD103-275 Architecture Fermi Ada Lovelace Pipelines 192 - unified 8448 - unified Core Speed 775 MHz 2340 - 2610 (Boost) MHz Shader Speed 1550 MHz Memory Speed 1250 MHz 21000 effective = 1400 MHz Memory Bus Width 192 Bit 256 Bit Memory Type GDDR5 GDDR6X Max. Amount of Memory 1536 MB 16 GB Shared Memory no no API DirectX 11, Shader 5.0 DirectX 12 Ultimate, Shader 6.7, OpenGL 4.6, OpenCL 3.0, Vulkan 1.3 Transistors 1.2 Billion 45.9 Billion technology 40 nm 5 nm Features CUDA, PhysX, PureVideo HD VP4 Notebook Size large Date of Announcement 30.05.2011 24.01.2024 TMUs 264 ROPs 96 Raytracing Cores 66 Tensor / AI Cores 264 Theoretical Performance 40.1 TFLOPS FP16, 40.1 TFLOPS FP32, 0.63 TFLOPS FP64 Cache L2: 48 MB Power Consumption 285 Watt Die Size 379 mm² PCIe 4.0 x16 Displays 4 Displays (max.), HDMI 2.1, DisplayPort 1.4a Predecessor NVIDIA GeForce RTX 4070 Ti
Benchmarks Performance Rating - 3DMark 11 + Fire Strike + Time Spy - NVIDIA GeForce RTX 4070 Ti SUPER
24 pt (72%)
...
NVIDIA GeForce RTX 4070 Ti SUPER
...
max:
3DMark - 3DMark Time Spy Score
23540 Points (68%)
3DMark - 3DMark Time Spy Graphics
23695 Points (63%)
3DMark - 3DMark Ice Storm Unlimited Graphics
759135 Points (86%)
3DMark - 3DMark Cloud Gate Score
79438 Points (85%)
3DMark - 3DMark Cloud Gate Graphics
165604 Points (44%)
3DMark - 3DMark Fire Strike Standard Score
42631 Points (75%)
3DMark - 3DMark Fire Strike Standard Graphics
52738 Points (60%)
3DMark - 3DMark Ice Storm Graphics
587810 Points (71%)
3DMark - 3DMark Night Raid
91419 Points (86%)
3DMark - 3DMark Night Raid Graphics Score
209177 Points (80%)
3DMark 11 - 3DM11 Performance Score
min: 1924 avg: 2052 median: 2031 (3%) max: 2255 Points
54278 Points (75%)
3DMark 11 - 3DM11 Performance GPU
min: 1777 avg: 1843 median: 1820 (2%) max: 2009 Points
74834 Points (64%)
3DMark Vantage + NVIDIA GeForce GTX 560M 3DMark Vantage - 3DM Vant. Perf. total
min: 8223 avg: 9230 median: 9300 (3%) max: 10013 Points
3DM Vant. Perf. GPU no PhysX + NVIDIA GeForce GTX 560M 3DMark Vantage - 3DM Vant. Perf. GPU no PhysX
min: 7802 avg: 7999 median: 8003.5 (5%) max: 8096 Points
3DMark 2001SE - 3DMark 2001 - Standard
41315 Points (43%)
3DMark 03 - 3DMark 03 - Standard
min: 37816 avg: 38532 median: 38157 (20%) max: 40369 Points
3DMark 05 - 3DMark 05 - Standard
min: 21436 avg: 22649 median: 22198 (24%) max: 24374 Points
3DMark 06 3DMark 06 - Score Unknown Settings + NVIDIA GeForce GTX 560M
16591 Points (22%)
Model CPU GPU RAM Value 3DMark 06 - Score Unknown Settings MSI GT683R Presample 2630QM GeForce GTX 560M 1.5 GB 16 GB 16591
3DMark 06 - Standard 1280x1024 + NVIDIA GeForce GTX 560M
min: 13838 avg: 15141 median: 15327 (20%) max: 15844 Points
Unigine Valley 1.0 - Unigine Valley 1.0 DX
242.6 fps (79%)
Unigine Heaven 2.1 - Heaven 2.1 high
min: 26.9 avg: 27.6 median: 27.5 (5%) max: 29.3 fps
Blender - Blender 3.3 Classroom CUDA *
17 Seconds (3%)
Blender - Blender 3.3 Classroom OPTIX *
10 Seconds (4%)
SPECviewperf 11 + NVIDIA GeForce GTX 560M SPECviewperf 11 - specvp11 snx-01
min: 2.32 avg: 2.3 median: 2.3 (1%) max: 2.34 fps
specvp11 tcvis-02 + NVIDIA GeForce GTX 560M SPECviewperf 11 - specvp11 tcvis-02
min: 0.81 avg: 0.8 median: 0.8 (0%) max: 0.82 fps
specvp11 sw-02 + NVIDIA GeForce GTX 560M SPECviewperf 11 - specvp11 sw-02
min: 5.9 avg: 6 median: 6 (5%) max: 6.03 fps
specvp11 proe-05 + NVIDIA GeForce GTX 560M SPECviewperf 11 - specvp11 proe-05
min: 1.05 avg: 1.1 median: 1.1 (1%) max: 1.06 fps
specvp11 maya-03 + NVIDIA GeForce GTX 560M SPECviewperf 11 - specvp11 maya-03
min: 6.47 avg: 7.3 median: 7.2 (5%) max: 8.17 fps
specvp11 lightwave-01 + NVIDIA GeForce GTX 560M SPECviewperf 11 - specvp11 lightwave-01
min: 8.96 avg: 9.3 median: 9.2 (10%) max: 9.71 fps
specvp11 ensight-04 + NVIDIA GeForce GTX 560M SPECviewperf 11 - specvp11 ensight-04
min: 19 avg: 19.3 median: 19.4 (9%) max: 19.38 fps
specvp11 catia-03 + NVIDIA GeForce GTX 560M SPECviewperf 11 - specvp11 catia-03
min: 4.86 avg: 5 median: 4.9 (3%) max: 5.29 fps
Windows 7 Experience Index - Win7 Gaming graphics
min: 7.1 avg: 7.2 median: 7.2 (91%) max: 7.2 Points
Windows 7 Experience Index - Win7 Graphics
min: 5.7 avg: 6.9 median: 7.2 (91%) max: 7.2 Points
Cinebench R10 Cinebench R10 Shading (32bit) + NVIDIA GeForce GTX 560M Cinebench R10 - Cinebench R10 Shading (32bit)
min: 4971 avg: 5457 median: 5407 (4%) max: 6028 Points
Cinebench R11.5 Cinebench R11.5 OpenGL 64 Bit + NVIDIA GeForce GTX 560M Cinebench R11.5 - Cinebench R11.5 OpenGL 64 Bit
min: 37.6 avg: 40.8 median: 40 (14%) max: 45.18 fps
Cinebench R15 + NVIDIA GeForce RTX 4070 Ti SUPER Cinebench R15 - Cinebench R15 OpenGL 64 Bit
min: 289 avg: 311 median: 317 (18%) max: 327 fps
Cinebench R15 OpenGL Ref. Match 64 Bit + NVIDIA GeForce RTX 4070 Ti SUPER Cinebench R15 - Cinebench R15 OpenGL Ref. Match 64 Bit
99.6 % (100%)
LuxMark v2.0 64Bit - LuxMark v2.0 Room GPU
9355 Samples/s (42%)
LuxMark v2.0 64Bit - LuxMark v2.0 Sala GPU
19620 Samples/s (34%)
ComputeMark v2.1 - ComputeMark v2.1 Result
54675 Points (59%)
Power Consumption - Furmark Stress Test Power Consumption - external Monitor *
min: 395 avg: 410.5 median: 410.5 (58%) max: 426 Watt
Power Consumption - The Witcher 3 Power Consumption - external Monitor *
min: 393 avg: 395.5 median: 395.5 (55%) max: 398 Watt
Power Consumption - Witcher 3 ultra Power Efficiency - external Monitor
0.5 fps per Watt (44%)
Average Benchmarks NVIDIA GeForce GTX 560M → 100% n=2 Average Benchmarks NVIDIA GeForce RTX 4070 Ti SUPER → 3392% n=2
- Range of benchmark values for this graphics card
- Average benchmark values for this graphics card
* Smaller numbers mean a higher performance
1 This benchmark is not used for the average calculation
Game Benchmarks The following benchmarks stem from our benchmarks of review laptops. The performance depends on the used graphics memory, clock rate, processor, system settings, drivers, and operating systems. So the results don't have to be representative for all laptops with this GPU. For detailed information on the benchmark results, click on the fps number.
NVIDIA GeForce RTX 4070 Ti SUPER:
163 fps
NVIDIA GeForce RTX 4070 Ti SUPER:
141.8 fps
NVIDIA GeForce RTX 4070 Ti SUPER:
113.2 fps
NVIDIA GeForce RTX 4070 Ti SUPER:
76.6 fps
NVIDIA GeForce RTX 4070 Ti SUPER:
39.8 fps
NVIDIA GeForce RTX 4070 Ti SUPER:
68.9 fps
NVIDIA GeForce RTX 4070 Ti SUPER:
227 fps
NVIDIA GeForce RTX 4070 Ti SUPER:
184 fps
NVIDIA GeForce RTX 4070 Ti SUPER:
179 fps
NVIDIA GeForce RTX 4070 Ti SUPER:
133 fps
NVIDIA GeForce RTX 4070 Ti SUPER:
84 fps
NVIDIA GeForce RTX 4070 Ti SUPER:
112 fps
NVIDIA GeForce RTX 4070 Ti SUPER:
124.7 fps
NVIDIA GeForce RTX 4070 Ti SUPER:
114.4 fps
NVIDIA GeForce RTX 4070 Ti SUPER:
82.5 fps
NVIDIA GeForce RTX 4070 Ti SUPER:
44.7 fps
NVIDIA GeForce RTX 4070 Ti SUPER:
63.7 fps
NVIDIA GeForce RTX 4070 Ti SUPER:
221 fps
NVIDIA GeForce RTX 4070 Ti SUPER:
206 fps
NVIDIA GeForce RTX 4070 Ti SUPER:
170 fps
NVIDIA GeForce RTX 4070 Ti SUPER:
136 fps
NVIDIA GeForce RTX 4070 Ti SUPER:
84 fps
NVIDIA GeForce RTX 4070 Ti SUPER:
112 fps
NVIDIA GeForce RTX 4070 Ti SUPER:
188.5 fps
NVIDIA GeForce RTX 4070 Ti SUPER:
188.5 fps
NVIDIA GeForce RTX 4070 Ti SUPER:
170.8 fps
NVIDIA GeForce RTX 4070 Ti SUPER:
150.3 fps
NVIDIA GeForce RTX 4070 Ti SUPER:
94.9 fps
NVIDIA GeForce RTX 4070 Ti SUPER:
42.3 fps
NVIDIA GeForce RTX 4070 Ti SUPER:
246 fps
NVIDIA GeForce RTX 4070 Ti SUPER:
223 fps
NVIDIA GeForce RTX 4070 Ti SUPER:
218 fps
NVIDIA GeForce RTX 4070 Ti SUPER:
157.8 fps
NVIDIA GeForce RTX 4070 Ti SUPER:
117.2 fps
NVIDIA GeForce RTX 4070 Ti SUPER:
133.9 fps
NVIDIA GeForce RTX 4070 Ti SUPER:
385 fps
NVIDIA GeForce RTX 4070 Ti SUPER:
402 fps
NVIDIA GeForce RTX 4070 Ti SUPER:
363 fps
NVIDIA GeForce RTX 4070 Ti SUPER:
138.2 fps
NVIDIA GeForce RTX 4070 Ti SUPER:
90 fps
NVIDIA GeForce RTX 4070 Ti SUPER:
45.1 fps
NVIDIA GeForce RTX 4070 Ti SUPER:
77.4 fps
NVIDIA GeForce RTX 4070 Ti SUPER:
210.6 fps
NVIDIA GeForce RTX 4070 Ti SUPER:
202.9 fps
NVIDIA GeForce RTX 4070 Ti SUPER:
149.4 fps
NVIDIA GeForce RTX 4070 Ti SUPER:
114.8 fps
NVIDIA GeForce RTX 4070 Ti SUPER:
70 fps
NVIDIA GeForce RTX 4070 Ti SUPER:
371 fps
NVIDIA GeForce RTX 4070 Ti SUPER:
384 fps
NVIDIA GeForce RTX 4070 Ti SUPER:
336 fps
NVIDIA GeForce RTX 4070 Ti SUPER:
144.9 fps
NVIDIA GeForce RTX 4070 Ti SUPER:
95.1 fps
NVIDIA GeForce RTX 4070 Ti SUPER:
48.9 fps
NVIDIA GeForce RTX 4070 Ti SUPER:
278 fps
NVIDIA GeForce RTX 4070 Ti SUPER:
282 fps
NVIDIA GeForce RTX 4070 Ti SUPER:
283 fps
NVIDIA GeForce RTX 4070 Ti SUPER:
217 fps
NVIDIA GeForce RTX 4070 Ti SUPER:
99.2 fps
NVIDIA GeForce RTX 4070 Ti SUPER:
196.9 fps
NVIDIA GeForce RTX 4070 Ti SUPER:
195.9 fps
NVIDIA GeForce RTX 4070 Ti SUPER:
172.3 fps
NVIDIA GeForce RTX 4070 Ti SUPER:
157.5 fps
NVIDIA GeForce RTX 4070 Ti SUPER:
103.6 fps
NVIDIA GeForce RTX 4070 Ti SUPER:
49.7 fps
NVIDIA GeForce RTX 4070 Ti SUPER:
213 fps
NVIDIA GeForce RTX 4070 Ti SUPER:
162.2 fps
NVIDIA GeForce RTX 4070 Ti SUPER:
121.5 fps
NVIDIA GeForce RTX 4070 Ti SUPER:
63.7 fps
NVIDIA GeForce RTX 4070 Ti SUPER:
209 fps
NVIDIA GeForce RTX 4070 Ti SUPER:
191 fps
NVIDIA GeForce RTX 4070 Ti SUPER:
169 fps
NVIDIA GeForce RTX 4070 Ti SUPER:
154 fps
NVIDIA GeForce RTX 4070 Ti SUPER:
91 fps
NVIDIA GeForce RTX 4070 Ti SUPER:
171.2 fps
NVIDIA GeForce RTX 4070 Ti SUPER:
159.3 fps
NVIDIA GeForce RTX 4070 Ti SUPER:
144.2 fps
NVIDIA GeForce RTX 4070 Ti SUPER:
115.9 fps
NVIDIA GeForce RTX 4070 Ti SUPER:
68.6 fps
NVIDIA GeForce RTX 4070 Ti SUPER:
239 fps
NVIDIA GeForce RTX 4070 Ti SUPER:
231 fps
NVIDIA GeForce RTX 4070 Ti SUPER:
181 fps
NVIDIA GeForce RTX 4070 Ti SUPER:
96.6 fps
NVIDIA GeForce RTX 4070 Ti SUPER:
192.1 fps
NVIDIA GeForce RTX 4070 Ti SUPER:
176.8 fps
NVIDIA GeForce RTX 4070 Ti SUPER:
169.6 fps
NVIDIA GeForce RTX 4070 Ti SUPER:
143.6 fps
NVIDIA GeForce RTX 4070 Ti SUPER:
79.4 fps
NVIDIA GeForce RTX 4070 Ti SUPER:
226 fps
NVIDIA GeForce RTX 4070 Ti SUPER:
196.9 fps
NVIDIA GeForce RTX 4070 Ti SUPER:
130.3 fps
NVIDIA GeForce RTX 4070 Ti SUPER:
66.4 fps
NVIDIA GeForce RTX 4070 Ti SUPER:
78.9 fps
NVIDIA GeForce RTX 4070 Ti SUPER:
236 fps
NVIDIA GeForce RTX 4070 Ti SUPER:
193.5 fps
NVIDIA GeForce RTX 4070 Ti SUPER:
158.3 fps
NVIDIA GeForce RTX 4070 Ti SUPER:
130.9 fps
NVIDIA GeForce RTX 4070 Ti SUPER:
84.4 fps
NVIDIA GeForce RTX 4070 Ti SUPER:
273 fps
NVIDIA GeForce RTX 4070 Ti SUPER:
269 fps
NVIDIA GeForce RTX 4070 Ti SUPER:
256 fps
NVIDIA GeForce RTX 4070 Ti SUPER:
205 fps
NVIDIA GeForce RTX 4070 Ti SUPER:
109.5 fps
NVIDIA GeForce RTX 4070 Ti SUPER:
568 fps
NVIDIA GeForce RTX 4070 Ti SUPER:
467 fps
NVIDIA GeForce RTX 4070 Ti SUPER:
442 fps
NVIDIA GeForce RTX 4070 Ti SUPER:
407 fps
NVIDIA GeForce RTX 4070 Ti SUPER:
306 fps
NVIDIA GeForce RTX 4070 Ti SUPER:
161.9 fps
NVIDIA GeForce RTX 4070 Ti SUPER:
203 fps
NVIDIA GeForce RTX 4070 Ti SUPER:
197 fps
NVIDIA GeForce RTX 4070 Ti SUPER:
188 fps
NVIDIA GeForce RTX 4070 Ti SUPER:
187 fps
NVIDIA GeForce RTX 4070 Ti SUPER:
119 fps
NVIDIA GeForce RTX 4070 Ti SUPER:
224 fps
NVIDIA GeForce RTX 4070 Ti SUPER:
196.7 fps
NVIDIA GeForce RTX 4070 Ti SUPER:
150 fps
NVIDIA GeForce RTX 4070 Ti SUPER:
127.8 fps
NVIDIA GeForce RTX 4070 Ti SUPER:
235 fps
NVIDIA GeForce RTX 4070 Ti SUPER:
235 fps
NVIDIA GeForce RTX 4070 Ti SUPER:
209 fps
NVIDIA GeForce RTX 4070 Ti SUPER:
168.8 fps
NVIDIA GeForce RTX 4070 Ti SUPER:
98.9 fps
NVIDIA GeForce RTX 4070 Ti SUPER:
245 fps
NVIDIA GeForce RTX 4070 Ti SUPER:
228 fps
NVIDIA GeForce RTX 4070 Ti SUPER:
226 fps
NVIDIA GeForce RTX 4070 Ti SUPER:
202 fps
NVIDIA GeForce RTX 4070 Ti SUPER:
203 fps
NVIDIA GeForce RTX 4070 Ti SUPER:
558 fps
NVIDIA GeForce RTX 4070 Ti SUPER:
430 fps
NVIDIA GeForce RTX 4070 Ti SUPER:
210 fps
NVIDIA GeForce RTX 4070 Ti SUPER:
159.3 fps
NVIDIA GeForce RTX 4070 Ti SUPER:
187.6 fps
NVIDIA GeForce RTX 4070 Ti SUPER:
187.6 fps
NVIDIA GeForce RTX 4070 Ti SUPER:
187.4 fps
NVIDIA GeForce RTX 4070 Ti SUPER:
160.1 fps
NVIDIA GeForce RTX 4070 Ti SUPER:
155.3 fps
NVIDIA GeForce RTX 4070 Ti SUPER:
182.1 fps
100%
GeForce GTX 560M:
62.1 [X] Schenker XMG P501 Intel Core i7-2630QM 2GHz
GeForce GTX 560M
fps
100%
GeForce GTX 560M:
58.4 [X] Schenker XMG P501 Intel Core i7-2630QM 2GHz
GeForce GTX 560M
fps
100%
GeForce GTX 560M:
18.8 [X] Schenker XMG P501 Intel Core i7-2630QM 2GHz
GeForce GTX 560M
fps
100%
GeForce GTX 560M:
15 [X] Schenker XMG P501 Intel Core i7-2630QM 2GHz
GeForce GTX 560M
fps
100%
GeForce GTX 560M:
67.8 [X] Schenker XMG P501 Intel Core i7-2630QM 2GHz
GeForce GTX 560M
fps
100%
GeForce GTX 560M:
63 [X] Schenker XMG P501 Intel Core i7-2630QM 2GHz
GeForce GTX 560M
fps
100%
GeForce GTX 560M:
60.5 [X] Schenker XMG P501 Intel Core i7-2630QM 2GHz
GeForce GTX 560M
fps
100%
GeForce GTX 560M:
23 [X] Schenker XMG P501 Intel Core i7-2630QM 2GHz
GeForce GTX 560M
fps
100%
GeForce GTX 560M:
172.3 [X] Schenker XMG P501 Intel Core i7-2630QM 2GHz
GeForce GTX 560M
fps
100%
GeForce GTX 560M:
99.9 [X] Schenker XMG P501 Intel Core i7-2630QM 2GHz
GeForce GTX 560M
fps
100%
GeForce GTX 560M:
61.3 [X] Schenker XMG P501 Intel Core i7-2630QM 2GHz
GeForce GTX 560M
fps
100%
GeForce GTX 560M:
44.2 [X] Schenker XMG P501 Intel Core i7-2630QM 2GHz
GeForce GTX 560M
fps
100%
GeForce GTX 560M:
69.9 [X] Schenker XMG P501 Intel Core i7-2630QM 2GHz
GeForce GTX 560M
fps
100%
GeForce GTX 560M:
45.6 [X] Schenker XMG P501 Intel Core i7-2630QM 2GHz
GeForce GTX 560M
fps
100%
GeForce GTX 560M:
37.9 [X] Schenker XMG P501 Intel Core i7-2630QM 2GHz
GeForce GTX 560M
fps
100%
GeForce GTX 560M:
17.5 [X] Schenker XMG P501 Intel Core i7-2630QM 2GHz
GeForce GTX 560M
fps
100%
GeForce GTX 560M:
60 [X] Schenker XMG P501 Intel Core i7-2630QM 2GHz
GeForce GTX 560M
fps
100%
GeForce GTX 560M:
59.8 [X] Schenker XMG P501 Intel Core i7-2630QM 2GHz
GeForce GTX 560M
fps
100%
GeForce GTX 560M:
44 [X] Schenker XMG P501 Intel Core i7-2630QM 2GHz
GeForce GTX 560M
fps
100%
GeForce GTX 560M:
64.9 [X] Schenker XMG P501 Intel Core i7-2630QM 2GHz
GeForce GTX 560M
fps
100%
GeForce GTX 560M:
42.2 [X] Schenker XMG P501 Intel Core i7-2630QM 2GHz
GeForce GTX 560M
fps
100%
GeForce GTX 560M:
16.2 [X] Schenker XMG P501 Intel Core i7-2630QM 2GHz
GeForce GTX 560M
fps
100%
GeForce GTX 560M:
70.2 [X] Schenker XMG P501 Intel Core i7-2630QM 2GHz
GeForce GTX 560M
fps
100%
GeForce GTX 560M:
48.5 [X] Schenker XMG P501 Intel Core i7-2630QM 2GHz
GeForce GTX 560M
fps
100%
GeForce GTX 560M:
32 [X] Schenker XMG P501 Intel Core i7-2630QM 2GHz
GeForce GTX 560M
fps
100%
GeForce GTX 560M:
156.3 [X] Medion Erazer X7813-MD97895 Intel Core i7-2670QM 2.2GHz
GeForce GTX 560M
fps
100%
GeForce GTX 560M:
65.7 [X] Medion Erazer X7813-MD97895 Intel Core i7-2670QM 2.2GHz
GeForce GTX 560M
fps
100%
GeForce GTX 560M:
41.2 [X] Medion Erazer X7813-MD97895 Intel Core i7-2670QM 2.2GHz
GeForce GTX 560M
fps
100%
GeForce GTX 560M:
20.1 [X] Medion Erazer X7813-MD97895 Intel Core i7-2670QM 2.2GHz
GeForce GTX 560M
fps
100%
GeForce GTX 560M:
59 [X] Schenker XMG P501 Intel Core i7-2630QM 2GHz
GeForce GTX 560M
fps
100%
GeForce GTX 560M:
55.4 [X] Schenker XMG P501 Intel Core i7-2630QM 2GHz
GeForce GTX 560M
fps
100%
GeForce GTX 560M:
40.8 [X] Schenker XMG P501 Intel Core i7-2630QM 2GHz
GeForce GTX 560M
fps
100%
GeForce GTX 560M:
21.3 [X] Schenker XMG P501 Intel Core i7-2630QM 2GHz
GeForce GTX 560M
fps
100%
GeForce GTX 560M:
208.6 [X] Schenker XMG P501 Intel Core i7-2630QM 2GHz
GeForce GTX 560M
fps
100%
GeForce GTX 560M:
111.3 [X] Schenker XMG P501 Intel Core i7-2630QM 2GHz
GeForce GTX 560M
fps
100%
GeForce GTX 560M:
72.1 [X] Schenker XMG P501 Intel Core i7-2630QM 2GHz
GeForce GTX 560M
fps
100%
GeForce GTX 560M:
44.5 [X] Schenker XMG P501 Intel Core i7-2630QM 2GHz
GeForce GTX 560M
fps
100%
GeForce GTX 560M:
72 [X] Medion Erazer X7813-MD97895 Intel Core i7-2670QM 2.2GHz
GeForce GTX 560M
74.5 ~ 73 fps
100%
GeForce GTX 560M:
48.3 [X] Medion Erazer X7813-MD97895 Intel Core i7-2670QM 2.2GHz
GeForce GTX 560M
49.3 ~ 49 fps
100%
GeForce GTX 560M:
37 [X] Medion Erazer X7813-MD97895 Intel Core i7-2670QM 2.2GHz
GeForce GTX 560M
37.9 ~ 37 fps
100%
GeForce GTX 560M:
15.5 [X] Medion Erazer X7813-MD97895 Intel Core i7-2670QM 2.2GHz
GeForce GTX 560M
19.2 ~ 17 fps
100%
GeForce GTX 560M:
129 [X] Schenker XMG P501 Intel Core i7-2630QM 2GHz
GeForce GTX 560M
fps
100%
GeForce GTX 560M:
111 [X] Schenker XMG P501 Intel Core i7-2630QM 2GHz
GeForce GTX 560M
fps
100%
GeForce GTX 560M:
51 [X] Schenker XMG P501 Intel Core i7-2630QM 2GHz
GeForce GTX 560M
fps
100%
GeForce GTX 560M:
21 [X] Schenker XMG P501 Intel Core i7-2630QM 2GHz
GeForce GTX 560M
fps
100%
GeForce GTX 560M:
402.3 [X] Medion Erazer X6817 (MD97892) Intel Core i7-2670QM 2.2GHz
GeForce GTX 560M
fps
100%
GeForce GTX 560M:
282.6 [X] Medion Erazer X6817 (MD97892) Intel Core i7-2670QM 2.2GHz
GeForce GTX 560M
fps
100%
GeForce GTX 560M:
208.3 [X] Medion Erazer X7813-MD97895 Intel Core i7-2670QM 2.2GHz
GeForce GTX 560M
218.2 220.1 [X] Medion Erazer X6817 (MD97892) Intel Core i7-2670QM 2.2GHz
GeForce GTX 560M
~ 216 fps
100%
GeForce GTX 560M:
140.8 [X] Medion Erazer X7813-MD97895 Intel Core i7-2670QM 2.2GHz
GeForce GTX 560M
143.7 [X] Medion Erazer X6817 (MD97892) Intel Core i7-2670QM 2.2GHz
GeForce GTX 560M
145.5 ~ 143 fps
100%
GeForce GTX 560M:
139 [X] Medion Erazer X6817 (MD97892) Intel Core i7-2670QM 2.2GHz
GeForce GTX 560M
fps
100%
GeForce GTX 560M:
101 [X] Medion Erazer X6817 (MD97892) Intel Core i7-2670QM 2.2GHz
GeForce GTX 560M
fps
100%
GeForce GTX 560M:
76 78 [X] Medion Erazer X6817 (MD97892) Intel Core i7-2670QM 2.2GHz
GeForce GTX 560M
80 [X] Medion Erazer X7813-MD97895 Intel Core i7-2670QM 2.2GHz
GeForce GTX 560M
~ 78 fps
100%
GeForce GTX 560M:
32 [X] Medion Erazer X6817 (MD97892) Intel Core i7-2670QM 2.2GHz
GeForce GTX 560M
32 34 [X] Medion Erazer X7813-MD97895 Intel Core i7-2670QM 2.2GHz
GeForce GTX 560M
~ 33 fps
100%
GeForce GTX 560M:
165.9 176.8 [X] Medion Erazer X6817 (MD97892) Intel Core i7-2670QM 2.2GHz
GeForce GTX 560M
~ 171 fps
100%
GeForce GTX 560M:
71.4 71.7 72.8 [X] Medion Erazer X6817 (MD97892) Intel Core i7-2670QM 2.2GHz
GeForce GTX 560M
~ 72 fps
100%
GeForce GTX 560M:
27 27.2 [X] Medion Erazer X6817 (MD97892) Intel Core i7-2670QM 2.2GHz
GeForce GTX 560M
27.4 ~ 27 fps
100%
GeForce GTX 560M:
115.6 [X] MSI GT780R Intel Core i7-2630QM 2GHz
GeForce GTX 560M
min:
83 fps, max:
142 fps
fps
100%
GeForce GTX 560M:
79.3 [X] MSI GT780R Intel Core i7-2630QM 2GHz
GeForce GTX 560M
min:
56 fps, max:
101 fps
fps
100%
GeForce GTX 560M:
58.2 [X] MSI GT780R Intel Core i7-2630QM 2GHz
GeForce GTX 560M
min:
42 fps, max:
75 fps
59.4 60.9 ~ 60 fps
100%
GeForce GTX 560M:
123.4 [X] MSI GT780R Intel Core i7-2630QM 2GHz
GeForce GTX 560M
min:
56 fps, max:
299 fps
fps
100%
GeForce GTX 560M:
100.1 [X] MSI GT780R Intel Core i7-2630QM 2GHz
GeForce GTX 560M
min:
29 fps, max:
239 fps
fps
100%
GeForce GTX 560M:
85.4 90 [X] MSI GT780R Intel Core i7-2630QM 2GHz
GeForce GTX 560M
min:
31 fps, max:
186 fps
~ 88 fps
100%
GeForce GTX 560M:
61.2 64 [X] MSI GT780R Intel Core i7-2630QM 2GHz
GeForce GTX 560M
min:
26 fps, max:
96 fps
64.5 ~ 63 fps
100%
GeForce GTX 560M:
369.9 461.7 629 [X] MSI GT683-280XPL Intel Core i5-2410M 2.3GHz
GeForce GTX 560M
~ 487 fps
100%
GeForce GTX 560M:
281.6 308 320.8 [X] MSI GT683-280XPL Intel Core i5-2410M 2.3GHz
GeForce GTX 560M
~ 303 fps
100%
GeForce GTX 560M:
227.7 238.7 [X] MSI GT683-280XPL Intel Core i5-2410M 2.3GHz
GeForce GTX 560M
241 ~ 236 fps
100%
GeForce GTX 560M:
108.5 fps
100%
GeForce GTX 560M:
83 fps
100%
GeForce GTX 560M:
68.3 fps
100%
GeForce GTX 560M:
40.6 [X] ASUS G74Sx Intel Core i7-2630QM 2GHz
GeForce GTX 560M
41.6 41.7 49 ~ 43 fps
100%
GeForce GTX 560M:
234.9 [X] MSI GT780R Intel Core i7-2630QM 2GHz
GeForce GTX 560M
min:
192 fps, max:
345 fps
fps
100%
GeForce GTX 560M:
86.2 [X] MSI GT780R Intel Core i7-2630QM 2GHz
GeForce GTX 560M
min:
72 fps, max:
129 fps
fps
100%
GeForce GTX 560M:
67.9 [X] MSI GT780R Intel Core i7-2630QM 2GHz
GeForce GTX 560M
min:
55 fps, max:
105 fps
fps
100%
GeForce GTX 560M:
34.7 35 35.2 [X] MSI GT780R Intel Core i7-2630QM 2GHz
GeForce GTX 560M
min:
22 fps, max:
50 fps
~ 35 fps
100%
GeForce GTX 560M:
96.6 [X] MSI GT780R Intel Core i7-2630QM 2GHz
GeForce GTX 560M
min:
41 fps, max:
174 fps
136 [X] MSI GT683-280XPL Intel Core i5-2410M 2.3GHz
GeForce GTX 560M
~ 116 fps
100%
GeForce GTX 560M:
58.2 [X] MSI GT780R Intel Core i7-2630QM 2GHz
GeForce GTX 560M
min:
30 fps, max:
132 fps
85.2 [X] MSI GT683-280XPL Intel Core i5-2410M 2.3GHz
GeForce GTX 560M
~ 72 fps
100%
GeForce GTX 560M:
28.2 [X] MSI GT780R Intel Core i7-2630QM 2GHz
GeForce GTX 560M
min:
16 fps, max:
47 fps
30.6 35.3 [X] MSI GT683-280XPL Intel Core i5-2410M 2.3GHz
GeForce GTX 560M
~ 31 fps
100%
GeForce GTX 560M:
10.9 11 [X] MSI GT780R Intel Core i7-2630QM 2GHz
GeForce GTX 560M
min:
5 fps, max:
17 fps
14.2 [X] MSI GT683-280XPL Intel Core i5-2410M 2.3GHz
GeForce GTX 560M
~ 12 fps
100%
GeForce GTX 560M:
118.1 [X] MSI GT780R Intel Core i7-2630QM 2GHz
GeForce GTX 560M
min:
49 fps, max:
201 fps
fps
100%
GeForce GTX 560M:
90.7 [X] MSI GT780R Intel Core i7-2630QM 2GHz
GeForce GTX 560M
min:
67 fps, max:
165 fps
fps
100%
GeForce GTX 560M:
66 67.5 [X] MSI GT780R Intel Core i7-2630QM 2GHz
GeForce GTX 560M
min:
51 fps, max:
118 fps
69.8 ~ 68 fps
100%
GeForce GTX 560M:
32 34.3 [X] MSI GT780R Intel Core i7-2630QM 2GHz
GeForce GTX 560M
min:
27 fps, max:
52 fps
34.4 35 ~ 34 fps
100%
GeForce GTX 560M:
194.9 fps
100%
GeForce GTX 560M:
95.4 fps
100%
GeForce GTX 560M:
78.3 fps
100%
GeForce GTX 560M:
51.2 51.8 ~ 52 fps
100%
GeForce GTX 560M:
118.6 122.6 [X] MSI GT683-280XPL Intel Core i5-2410M 2.3GHz
GeForce GTX 560M
~ 121 fps
100%
GeForce GTX 560M:
65.6 [X] MSI GT683-280XPL Intel Core i5-2410M 2.3GHz
GeForce GTX 560M
75.8 ~ 71 fps
100%
GeForce GTX 560M:
45.5 [X] MSI GT683-280XPL Intel Core i5-2410M 2.3GHz
GeForce GTX 560M
50.1 ~ 48 fps
100%
GeForce GTX 560M:
30.3 [X] MSI GT683-280XPL Intel Core i5-2410M 2.3GHz
GeForce GTX 560M
31 33.4 34.4 ~ 32 fps
100%
GeForce GTX 560M:
102.4 fps
100%
GeForce GTX 560M:
80.1 [X] MSI GT683-280XPL Intel Core i5-2410M 2.3GHz
GeForce GTX 560M
fps
100%
GeForce GTX 560M:
68.9 [X] MSI GT683-280XPL Intel Core i5-2410M 2.3GHz
GeForce GTX 560M
107.7 ~ 88 fps
100%
GeForce GTX 560M:
47.4 [X] MSI GT683-280XPL Intel Core i5-2410M 2.3GHz
GeForce GTX 560M
81.2 ~ 64 fps
100%
GeForce GTX 560M:
49 49.2 ~ 49 fps
100%
GeForce GTX 560M:
71.6 [X] MSI GT683-280XPL Intel Core i5-2410M 2.3GHz
GeForce GTX 560M
135.1 ~ 103 fps
100%
GeForce GTX 560M:
65.3 [X] MSI GT683-280XPL Intel Core i5-2410M 2.3GHz
GeForce GTX 560M
105.1 ~ 85 fps
100%
GeForce GTX 560M:
57.9 [X] MSI GT683-280XPL Intel Core i5-2410M 2.3GHz
GeForce GTX 560M
68 ~ 63 fps
100%
GeForce GTX 560M:
38.5 47 48.2 [X] MSI GT683-280XPL Intel Core i5-2410M 2.3GHz
GeForce GTX 560M
~ 45 fps
100%
GeForce GTX 560M:
52 fps
100%
GeForce GTX 560M:
78 fps
100%
GeForce GTX 560M:
137.1 [X] MSI GT683-280XPL Intel Core i5-2410M 2.3GHz
GeForce GTX 560M
fps
100%
GeForce GTX 560M:
109.2 [X] MSI GT683-280XPL Intel Core i5-2410M 2.3GHz
GeForce GTX 560M
fps
100%
GeForce GTX 560M:
98.6 [X] MSI GT683-280XPL Intel Core i5-2410M 2.3GHz
GeForce GTX 560M
fps
100%
GeForce GTX 560M:
235.6 [X] MSI GT683-280XPL Intel Core i5-2410M 2.3GHz
GeForce GTX 560M
fps
100%
GeForce GTX 560M:
157.7 [X] MSI GT683-280XPL Intel Core i5-2410M 2.3GHz
GeForce GTX 560M
fps
100%
GeForce GTX 560M:
127.8 [X] MSI GT683-280XPL Intel Core i5-2410M 2.3GHz
GeForce GTX 560M
fps
100%
GeForce GTX 560M:
43.3 fps
100%
GeForce GTX 560M:
127 fps
100%
GeForce GTX 560M:
89.5 fps
100%
GeForce GTX 560M:
62.2 64.5 ~ 63 fps
100%
GeForce GTX 560M:
14.8 14.9 ~ 15 fps
100%
GeForce GTX 560M:
144.3 fps
100%
GeForce GTX 560M:
94 fps
100%
GeForce GTX 560M:
60.1 fps
100%
GeForce GTX 560M:
14.1 fps
100%
GeForce GTX 560M:
32 fps
100%
GeForce GTX 560M:
70.7 [X] MSI GT683-280XPL Intel Core i5-2410M 2.3GHz
GeForce GTX 560M
fps
100%
GeForce GTX 560M:
228.5 fps
Average Gaming NVIDIA GeForce GTX 560M → 100% Average Gaming 30-70 fps → 100%
NVIDIA GeForce RTX 4070 Ti SUPER low med. high ultra QHD 4K Avatar Frontiers of Pandora 163 141.8 113.2 76.6 39.8 Call of Duty Modern Warfare 3 2023 227 184 179 133 84 Alan Wake 2 124.7 114.4 82.5 44.7 Assassin's Creed Mirage 221 206 170 136 84 Cyberpunk 2077 2.1 Phantom Liberty 188.5 188.5 170.8 150.3 94.9 42.3 Baldur's Gate 3 246 223 218 157.8 117.2 F1 23 385 402 363 138.2 90 45.1 The Callisto Protocol 210.62 202.94 149.39 114.82 70.04 F1 22 371 384 336 144.9 95.1 48.9 Ghostwire Tokyo 278 282 283 217 99.2 Cyberpunk 2077 1.6 196.9 195.9 172.3 157.5 103.6 49.7 Dying Light 2 213 162.2 121.5 63.7 Far Cry 6 209 191 169 154 91 Watch Dogs Legion 171.2 159.3 144.2 115.9 68.6 Mafia Definitive Edition 239 231 181 96.6 Borderlands 3 192.1 176.8 169.6 143.6 79.4 Control 226 196.9 130.3 66.4 Metro Exodus 236 193.5 158.3 130.9 84.4 Shadow of the Tomb Raider 273 269 256 205 109.5 Strange Brigade 568 467 442 407 306 161.9 Far Cry 5 203 197 188 187 119 X-Plane 11.11 224 196.7 150 127.8 Final Fantasy XV Benchmark 235 235 209 168.8 98.9 Dota 2 Reborn 245 228 226 202 203 The Witcher 3 558 430 210 159.3 GTA V 187.6 187.6 187.4 160.1 155.3 182.1 < 30 fps < 60 fps < 120 fps ≥ 120 fps 9 26 1 25 1 19 8 16 6 15 4
For more games that might be playable and a list of all games and graphics cards visit our Gaming List
v1.28
log 04. 05:30:13
#0 checking url part for id 2481 +0s ... 0s
#1 checking url part for id 12305 +0s ... 0s
#2 redirected to Ajax server, took 1720063813 +0s ... 0s
#3 did not recreate cache, as it is less than 5 days old! Created at Thu, 04 Jul 2024 05:15:44 +0200 +0s ... 0s
#4 composed specs +0.053s ... 0.053s
#5 did output specs +0s ... 0.053s
#6 start showIntegratedCPUs +0s ... 0.053s
#7 getting avg benchmarks for device 2481 +0.017s ... 0.071s
#8 got single benchmarks 2481 +0.015s ... 0.085s
#9 getting avg benchmarks for device 12305 +0.004s ... 0.089s
#10 got single benchmarks 12305 +0.004s ... 0.092s
#11 got avg benchmarks for devices +0s ... 0.092s
#12 min, max, avg, median took s +0.02s ... 0.113s
#13 before gaming benchmark output +0s ... 0.113s
#14 Got 362 rows for game benchmarks. +0.015s ... 0.128s
#15 composed SQL query for gamebenchmarks +0s ... 0.128s
#16 got data and put it in $dataArray +0.004s ... 0.131s
#17 benchmarks composed for output. +0.02s ... 0.151s
#18 calculated avg scores. +0s ... 0.151s
#19 return log +0.002s ... 0.153s
Please share our article, every link counts!
Redaktion, 2017-09- 8 (Update: 2023-07- 1)
 Deutsch
 English
 Español
 Français
 Italiano
 Nederlands
 Polski
 Português
 Русский
 Türkçe
 Svenska
 Chinese
 Magyar