NVIDIA GeForce GTX 1650 Ti Max-Q vs AMD Radeon RX Vega 56
NVIDIA GeForce GTX 1650 Ti Max-Q ► remove from comparison
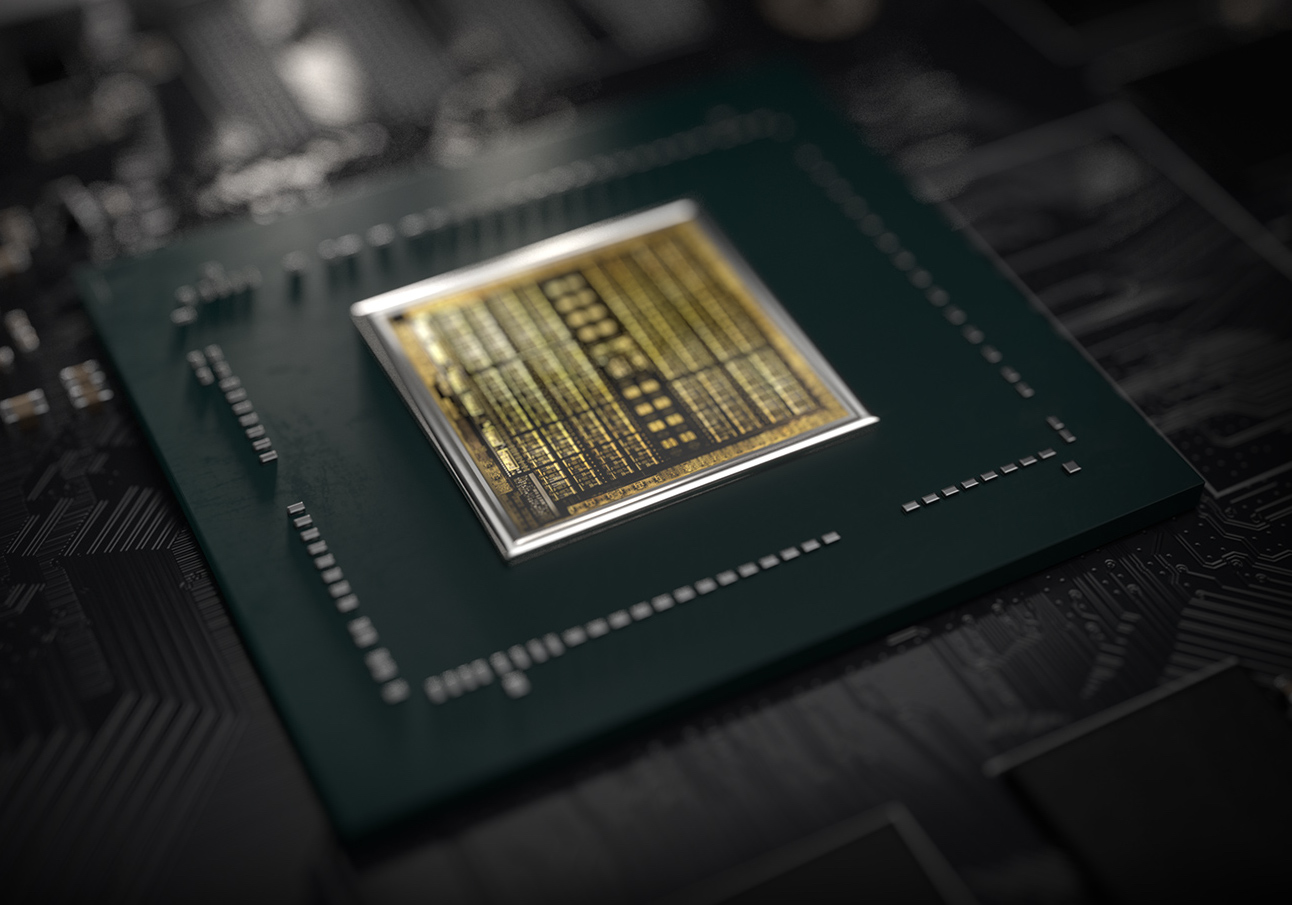
The Nvidia GeForce GTX 1650 Ti Max-Q (N18P-G62) is a dedicated mid range graphics card for laptops based on the Turing architecture. The Max-Q variant is the power saving version of the mobile GTX 1650Ti with reduced clock speeds, performance and of course power consumption. It is using the same TU117 chip with 1,024 shaders. Therefore, it is intended for thin and light gaming laptops. Compared to the faster RTX 2000 GPUs (e.g. RTX 2060 ), the 1650 Ti integrates no Raytracing or Tensor cores.
There are two variants of the 1650Ti Max-Q, one with 35 Watt and 1035 - 1200 MHz and a faster 40 Watt version with a clock speed of 1200 - 1365 MHz. Both however are significantly lower clocked than the normal Max-P version with 50 / 55 Watt and 1350-1385 MHz. The memory is most likely clocked at 1250 MHz = 10,000 MHz effective (Gbps) in most laptops, although there might be versions with 1500 MHz = 12,000 Gbps.
The Turing generation did not only introduce raytracing for the RTX cards, but also optimized the architecture of the cores and caches. According to Nvidia the CUDA cores offer now a concurrent execution of floating point and integer operations for increased performance in compute-heavy workloads of modern games. Furthermore, the caches were reworked (new unified memory architecture with twice the cache compared to Pascal). This leads to 50% more instructions per clock and a 40% more power efficient usage compared to Pascal.
Compared to the bigger Turing chips (like the TU116 of the GTX 1660 Ti and the RTX lineup), the TU117 does not include the new NVENC encoder but an older one similar to the one used in Pascal and Volta.
The power consumption of the 1650 Ti Max-Q laptops is specified at 35 Watt TGP (Total Graphics Power) by Nvidia and therefore 25 Watt lower than the mobile GTX 1650 Ti in the same package (other variants can reach up to 80 Watt).
AMD Radeon RX Vega 56 ► remove from comparison
AMD’s Radeon RX Vega 56 is a high-end desktop GPU that was first introduced in August of 2017. It is based on the Vega architecture (Vega 10) and equipped with fast HBM2 VRAM. When it was first introduced, it was the second fastest AMD GPU available, only bested by the RX Vega 64 that launched on the very same day. At the time of writing, both GPUs have been replaced by their respective Radeon VII successors.
The RX Vega 56 reference design features 56 CUs running at 1,138-1,474 MHz (Boost) and 8 GB of HBM2 VRAM running at 800 MHz connected via a 2,048-bit memory bus resulting in a memory bandwidth of 409.6 GB/s.
Features
Vega 10 is still produced in a 10-nm manufacturing process. The die consists of roughly 12.5 billion transistors and measures 495 mm2 in size. The newer Vega 20 chip, which AMD’s current Radeon VII is based on, features around 13.2 billion transistors. Applications have access to a total of 3,584 shaders, but the GPU lacks the dedicated Raytracing and Tensor cores that can be found on Nvidia’s latest RTX generation of GPUs.
Performance
Performance-wise, the RX Vega 56 is comparable to an Nvidia GeForce GTX 1070, and thus best categorized as upper middle-class. Games released in 2018 and 2019 should run perfectly fine and smooth in high details on WQHD (2560 x 1440).
Power Consumption
According to AMD, the RX Vega 56’s maximum power consumption is 210 W. Given the GTX 1070’s power consumption of just 150 W, the Vega 56 cannot keep up with its direct competitor in regards to performance-per-watt ratio.
NVIDIA GeForce GTX 1650 Ti Max-Q AMD Radeon RX Vega 56 AMD Radeon RX Vega Series Codename N18P-G62 Max-Q Vega Architecture Turing Vega Pipelines 1024 - unified 3584 - unified Core Speed 1035 - 1200 (Boost) MHz 1138 - 1474 (Boost) MHz Memory Speed 10000 MHz 800 MHz Memory Bus Width 128 Bit 409.6 Bit Memory Type GDDR6 HBM2 Max. Amount of Memory 4 GB 8 GB Shared Memory no no API DirectX 12_1, OpenGL 4.6 DirectX 12_1, Shader 6.2, OpenGL 4.6 Power Consumption 35 Watt 210 Watt technology 12 nm 14 nm Notebook Size medium sized Date of Announcement 02.04.2020 14.08.2017 Link to Manufacturer Page www.nvidia.com Transistors 12.5 Billion Features 64 ROPs, 224 TMUs
Benchmarks Performance Rating - 3DMark 11 + Fire Strike + Time Spy - RX Vega 56
9.5 pt (28%)
...
...
max:
3DMark - 3DMark Time Spy Score
min: 3015 avg: 3309 median: 3235.5 (9%) max: 3709 Points
GPU TDP ? TDP 21 W TDP 35 W 95% 92% 100%
6746 Points (19%)
GPU TDP ? TDP 21 W TDP 35 W 100% 85% 93%
3DMark - 3DMark Time Spy Graphics
min: 2886 avg: 3139 median: 3098 (8%) max: 3526 Points
GPU TDP ? TDP 21 W TDP 35 W 97% 92% 100%
6482 Points (17%)
GPU TDP ? TDP 21 W TDP 35 W 100% 83% 90%
3DMark - 3DMark Ice Storm Unlimited Graphics
421834 Points (48%)
412820 Points (47%)
GPU TDP ? TDP 35 W 98% 100%
3DMark - 3DMark Ice Storm Extreme Graphics
34142 Points (4%)
332764 Points (43%)
3DMark - 3DMark Cloud Gate Score
min: 18333 avg: 22116 median: 22895 (24%) max: 26161 Points
GPU TDP ? TDP 21 W TDP 35 W 85% 95% 100%
47018 Points (50%)
GPU TDP ? TDP 21 W TDP 35 W 100% 94% 98%
3DMark - 3DMark Cloud Gate Graphics
min: 29035 avg: 42978 median: 47657 (13%) max: 53539 Points
GPU TDP ? TDP 21 W TDP 35 W 74% 98% 100%
125359 Points (33%)
GPU TDP ? TDP 21 W TDP 35 W 100% 97% 98%
3DMark - 3DMark Fire Strike Standard Score
min: 7292 avg: 7764 median: 7700 (14%) max: 8659 Points
GPU TDP ? TDP 21 W TDP 35 W 96% 92% 100%
17098 Points (30%)
GPU TDP ? TDP 21 W TDP 35 W 100% 85% 93%
3DMark - 3DMark Fire Strike Standard Graphics
min: 8024 avg: 8542 median: 8564 (10%) max: 9573 Points
GPU TDP ? TDP 21 W TDP 35 W 96% 92% 100%
20759 Points (23%)
GPU TDP ? TDP 21 W TDP 35 W 100% 82% 89%
3DMark - 3DMark Ice Storm Graphics
369880 Points (44%)
3DMark - 3DMark Wild Life Unlimited
21348 Points (11%)
3DMark 11 - 3DM11 Performance Score
min: 10610 avg: 11524 median: 11398 (16%) max: 13121 Points
GPU TDP ? TDP 21 W TDP 35 W 98% 93% 100%
22937 Points (32%)
GPU TDP ? TDP 21 W TDP 35 W 100% 83% 90%
3DMark 11 - 3DM11 Performance GPU
min: 11055 avg: 11796 median: 11538 (10%) max: 13343 Points
GPU TDP ? TDP 21 W TDP 35 W 98% 91% 100%
29086 Points (25%)
GPU TDP ? TDP 21 W TDP 35 W 100% 77% 85%
3DMark Vantage + NVIDIA GeForce GTX 1650 Ti Max-Q 3DMark Vantage - 3DM Vant. Perf. total
31116 Points (9%)
3DM Vant. Perf. total + AMD Radeon RX Vega 56
54586 Points (16%)
3DM Vant. Perf. GPU no PhysX + NVIDIA GeForce GTX 1650 Ti Max-Q 3DMark Vantage - 3DM Vant. Perf. GPU no PhysX
33179 Points (19%)
3DM Vant. Perf. GPU no PhysX + AMD Radeon RX Vega 56
54416 Points (31%)
3DMark 03 - 3DMark 03 - Standard
134946 Points (71%)
3DMark 05 - 3DMark 05 - Standard
34785 Points (38%)
3DMark 06 3DMark 06 - Standard 1280x1024 + NVIDIA GeForce GTX 1650 Ti Max-Q
30266 Points (40%)
3DMark 06 - Standard 1280x1024 + AMD Radeon RX Vega 56
36286 Points (47%)
Unigine Valley 1.0 - Unigine Valley 1.0 DX
76.4 fps (25%)
SPECviewperf 12 + AMD Radeon RX Vega 56 SPECviewperf 12 - specvp12 sw-03
74.1 fps (18%)
specvp12 snx-02 + AMD Radeon RX Vega 56 SPECviewperf 12 - specvp12 snx-02
22.6 fps (3%)
specvp12 mediacal-01 + AMD Radeon RX Vega 56 SPECviewperf 12 - specvp12 mediacal-01
45.6 fps (12%)
specvp12 maya-04 + AMD Radeon RX Vega 56 SPECviewperf 12 - specvp12 maya-04
85.5 fps (23%)
specvp12 energy-01 + AMD Radeon RX Vega 56 SPECviewperf 12 - specvp12 energy-01
11.2 fps (10%)
specvp12 creo-01 + AMD Radeon RX Vega 56 SPECviewperf 12 - specvp12 creo-01
53.1 fps (21%)
specvp12 catia-04 + AMD Radeon RX Vega 56 SPECviewperf 12 - specvp12 catia-04
141.1 fps (23%)
specvp12 3dsmax-05 + AMD Radeon RX Vega 56 SPECviewperf 12 - specvp12 3dsmax-05
144.8 fps (25%)
SPECviewperf 13 specvp13 sw-04 + AMD Radeon RX Vega 56 SPECviewperf 13 - specvp13 sw-04
91 fps (24%)
specvp13 snx-03 + AMD Radeon RX Vega 56 SPECviewperf 13 - specvp13 snx-03
40.8 fps (5%)
specvp13 medical-02 + AMD Radeon RX Vega 56 SPECviewperf 13 - specvp13 medical-02
66.5 fps (14%)
specvp13 maya-05 + AMD Radeon RX Vega 56 SPECviewperf 13 - specvp13 maya-05
182.1 fps (21%)
specvp13 energy-02 + AMD Radeon RX Vega 56 SPECviewperf 13 - specvp13 energy-02
22.8 fps (7%)
specvp13 creo-02 + AMD Radeon RX Vega 56 SPECviewperf 13 - specvp13 creo-02
104.3 fps (15%)
specvp13 catia-05 + AMD Radeon RX Vega 56 SPECviewperf 13 - specvp13 catia-05
209.1 fps (23%)
specvp13 3dsmax-06 + AMD Radeon RX Vega 56 SPECviewperf 13 - specvp13 3dsmax-06
145.2 fps (25%)
Cinebench R11.5 Cinebench R11.5 OpenGL 64 Bit + NVIDIA GeForce GTX 1650 Ti Max-Q Cinebench R11.5 - Cinebench R11.5 OpenGL 64 Bit
64.9 fps (22%)
Cinebench R15 + NVIDIA GeForce GTX 1650 Ti Max-Q Cinebench R15 - Cinebench R15 OpenGL 64 Bit
min: 83.9 avg: 132.8 median: 140 (8%) max: 145 fps
GPU TDP ? TDP 21 W TDP 35 W 98% 94% 100%
Cinebench R15 OpenGL Ref. Match 64 Bit + NVIDIA GeForce GTX 1650 Ti Max-Q Cinebench R15 - Cinebench R15 OpenGL Ref. Match 64 Bit
99.6 % (100%)
GPU TDP ? TDP 21 W TDP 35 W 100% 100% 100%
LuxMark v2.0 64Bit - LuxMark v2.0 Room GPU
9546 Samples/s (43%)
2384 Samples/s (11%)
LuxMark v2.0 64Bit - LuxMark v2.0 Sala GPU
10809 Samples/s (19%)
5459 Samples/s (10%)
ComputeMark v2.1 - ComputeMark v2.1 Result
6297 Points (7%)
17030 Points (18%)
Power Consumption - Furmark Stress Test Power Consumption - external Monitor *
min: 61.5 avg: 66.7 median: 65.2 (9%) max: 75 Watt
329.4 Watt (47%)
Power Consumption - The Witcher 3 Power Consumption - external Monitor *
min: 59.8 avg: 63.3 median: 63 (9%) max: 67.3 Watt
345.6 Watt (48%)
Power Consumption - Witcher 3 Power Consumption *
min: 60.6 avg: 72 median: 68.6 (15%) max: 94 Watt
GPU TDP ? TDP 21 W TDP 35 W 102% 105% 100%
Power Consumption - Witcher 3 ultra Power Efficiency
min: 0.3568 avg: 0.4 median: 0.4 (40%) max: 0.522 fps per Watt
GPU TDP ? TDP 21 W TDP 35 W 83% 100% 86%
Power Consumption - Witcher 3 ultra Power Efficiency - external Monitor
min: 0.4161 avg: 0.4 median: 0.4 (37%) max: 0.4716 fps per Watt
0.2 fps per Watt (18%)
Emissions Witcher 3 Fan Noise + NVIDIA GeForce GTX 1650 Ti Max-Q Emissions - Witcher 3 Fan Noise
min: 34.5 avg: 40.9 median: 42 (67%) max: 47 dB(A)
GPU TDP ? TDP 21 W TDP 35 W 100% 81% 90%
Clock Speed - GPU Clock Witcher 3 ultra
min: 1340 avg: 1405 median: 1405 (55%) max: 1470 MHz
GPU TDP ? TDP 35 W 91% 100%
Clock Speed - GPU Clock Speed Furmark
998 MHz (40%)
Average Benchmarks NVIDIA GeForce GTX 1650 Ti Max-Q → 100% n=16 Average Benchmarks AMD Radeon RX Vega 56 → 230% n=16
- Range of benchmark values for this graphics card
- Average benchmark values for this graphics card
* Smaller numbers mean a higher performance
1 This benchmark is not used for the average calculation
Game Benchmarks The following benchmarks stem from our benchmarks of review laptops. The performance depends on the used graphics memory, clock rate, processor, system settings, drivers, and operating systems. So the results don't have to be representative for all laptops with this GPU. For detailed information on the benchmark results, click on the fps number.
100%
GeForce GTX 1650 Ti Max-Q:
63.7 fps
100%
GeForce GTX 1650 Ti Max-Q:
33 fps
100%
GeForce GTX 1650 Ti Max-Q:
26.8 fps
100%
GeForce GTX 1650 Ti Max-Q:
22.2 fps
100%
GeForce GTX 1650 Ti Max-Q:
70 77 ~ 74 fps
100%
GeForce GTX 1650 Ti Max-Q:
45 48 ~ 47 fps
100%
GeForce GTX 1650 Ti Max-Q:
32 36 [X] MSI Summit E15 A11SCST High Performance
Intel Core i7-1185G7 3GHz
GeForce GTX 1650 Ti Max-Q
min:
9 fps, max:
78 fps
37 ~ 35 fps
100%
GeForce GTX 1650 Ti Max-Q:
28 29 ~ 29 fps
100%
GeForce GTX 1650 Ti Max-Q:
24 fps
100%
GeForce GTX 1650 Ti Max-Q:
14 fps
100%
GeForce GTX 1650 Ti Max-Q:
97.5 105.1 ~ 101 fps
100%
GeForce GTX 1650 Ti Max-Q:
42.5 46.9 ~ 45 fps
100%
GeForce GTX 1650 Ti Max-Q:
40.5 44.8 ~ 43 fps
100%
GeForce GTX 1650 Ti Max-Q:
35.7 39.6 ~ 38 fps
100%
GeForce GTX 1650 Ti Max-Q:
25.4 fps
100%
GeForce GTX 1650 Ti Max-Q:
12.4 fps
100%
GeForce GTX 1650 Ti Max-Q:
100 fps
100%
GeForce GTX 1650 Ti Max-Q:
55.6 fps
100%
GeForce GTX 1650 Ti Max-Q:
44.1 fps
100%
GeForce GTX 1650 Ti Max-Q:
40.2 fps
100%
GeForce GTX 1650 Ti Max-Q:
25.8 fps
100%
GeForce GTX 1650 Ti Max-Q:
10.6 fps
100%
GeForce GTX 1650 Ti Max-Q:
47 63 [X] MSI Summit E15 A11SCST Intel Core i7-1185G7 3GHz
GeForce GTX 1650 Ti Max-Q
min:
14 fps, P0.1:
28 fps, P1:
44 fps, max:
115 fps
74 ~ 61 fps
100%
GeForce GTX 1650 Ti Max-Q:
30 38 [X] MSI Summit E15 A11SCST Intel Core i7-1185G7 3GHz
GeForce GTX 1650 Ti Max-Q
min:
18 fps, P0.1:
22 fps, P1:
26 fps, max:
92 fps
45 ~ 38 fps
100%
GeForce GTX 1650 Ti Max-Q:
19 24 [X] MSI Summit E15 A11SCST Intel Core i7-1185G7 3GHz
GeForce GTX 1650 Ti Max-Q
min:
10 fps, P0.1:
12 fps, P1:
16 fps, max:
88 fps
32 ~ 25 fps
100%
GeForce GTX 1650 Ti Max-Q:
5 12 14 ~ 10 fps
100%
GeForce GTX 1650 Ti Max-Q:
12 fps
100%
GeForce GTX 1650 Ti Max-Q:
5 fps
100%
GeForce GTX 1650 Ti Max-Q:
70 [X] MSI Summit E15 A11SCST Intel Core i7-1185G7 3GHz
GeForce GTX 1650 Ti Max-Q
min:
31 fps, P0.1:
43 fps, P1:
51 fps, max:
108 fps
89 ~ 80 fps
100%
GeForce GTX 1650 Ti Max-Q:
43 [X] MSI Summit E15 A11SCST Intel Core i7-1185G7 3GHz
GeForce GTX 1650 Ti Max-Q
min:
19 fps, P0.1:
25 fps, P1:
33 fps, max:
59 fps
54 ~ 49 fps
100%
GeForce GTX 1650 Ti Max-Q:
37 [X] MSI Summit E15 A11SCST Intel Core i7-1185G7 3GHz
GeForce GTX 1650 Ti Max-Q
min:
19 fps, P0.1:
22 fps, P1:
29 fps, max:
54 fps
39 [X] MSI Summit E15 A11SCST High Performance
Intel Core i7-1185G7 3GHz
GeForce GTX 1650 Ti Max-Q
min:
14 fps, P0.1:
17 fps, P1:
30 fps, max:
39 fps
47 ~ 41 fps
100%
GeForce GTX 1650 Ti Max-Q:
11 21 ~ 16 fps
100%
GeForce GTX 1650 Ti Max-Q:
14 fps
100%
GeForce GTX 1650 Ti Max-Q:
210 fps
100%
GeForce GTX 1650 Ti Max-Q:
202 fps
100%
GeForce GTX 1650 Ti Max-Q:
192.9 fps
100%
GeForce GTX 1650 Ti Max-Q:
165.2 fps
100%
GeForce GTX 1650 Ti Max-Q:
129.6 fps
100%
GeForce GTX 1650 Ti Max-Q:
79.6 fps
100%
GeForce GTX 1650 Ti Max-Q:
222 fps
100%
GeForce GTX 1650 Ti Max-Q:
124 fps
100%
GeForce GTX 1650 Ti Max-Q:
112.9 fps
100%
GeForce GTX 1650 Ti Max-Q:
103.4 fps
100%
GeForce GTX 1650 Ti Max-Q:
70 fps
100%
GeForce GTX 1650 Ti Max-Q:
30.7 fps
100%
GeForce GTX 1650 Ti Max-Q:
93.9 fps
100%
GeForce GTX 1650 Ti Max-Q:
46.2 fps
100%
GeForce GTX 1650 Ti Max-Q:
43 fps
100%
GeForce GTX 1650 Ti Max-Q:
27.9 fps
100%
GeForce GTX 1650 Ti Max-Q:
14.1 fps
100%
GeForce GTX 1650 Ti Max-Q:
94.8 [X] MSI Summit E15 A11SCST Intel Core i7-1185G7 3GHz
GeForce GTX 1650 Ti Max-Q
min:
6.8 fps, P0.1:
19 fps, P1:
48.4 fps, max:
187 fps
115.7 ~ 105 fps
100%
GeForce GTX 1650 Ti Max-Q:
47.5 [X] MSI Summit E15 A11SCST Intel Core i7-1185G7 3GHz
GeForce GTX 1650 Ti Max-Q
min:
7.4 fps, P0.1:
10.4 fps, P1:
23.4 fps, max:
86.8 fps
51.9 ~ 50 fps
100%
GeForce GTX 1650 Ti Max-Q:
36.8 [X] MSI Summit E15 A11SCST Intel Core i7-1185G7 3GHz
GeForce GTX 1650 Ti Max-Q
min:
12.2 fps, P0.1:
12.7 fps, P1:
19.3 fps, max:
92.5 fps
40.8 ~ 39 fps
100%
GeForce GTX 1650 Ti Max-Q:
20.9 [X] MSI Summit E15 A11SCST Intel Core i7-1185G7 3GHz
GeForce GTX 1650 Ti Max-Q
min:
6.91 fps, P0.1:
8.01 fps, P1:
9.96 fps, max:
62.5 fps
30.5 ~ 26 fps
100%
GeForce GTX 1650 Ti Max-Q:
22.3 fps
100%
GeForce GTX 1650 Ti Max-Q:
154.1 fps
100%
GeForce GTX 1650 Ti Max-Q:
59.8 fps
100%
GeForce GTX 1650 Ti Max-Q:
31.9 fps
100%
GeForce GTX 1650 Ti Max-Q:
23.6 fps
100%
GeForce GTX 1650 Ti Max-Q:
80 99 ~ 90 fps
100%
GeForce GTX 1650 Ti Max-Q:
42 58 ~ 50 fps
100%
GeForce GTX 1650 Ti Max-Q:
35 36 [X] MSI Summit E15 A11SCST High Performance
Intel Core i7-1185G7 3GHz
GeForce GTX 1650 Ti Max-Q
min:
24 fps, max:
57 fps
48 ~ 40 fps
100%
GeForce GTX 1650 Ti Max-Q:
32 40 ~ 36 fps
100%
GeForce GTX 1650 Ti Max-Q:
30 fps
100%
GeForce GTX 1650 Ti Max-Q:
8 fps
100%
GeForce GTX 1650 Ti Max-Q:
85.6 99.6 ~ 93 fps
100%
GeForce GTX 1650 Ti Max-Q:
53.6 60.9 ~ 57 fps
100%
GeForce GTX 1650 Ti Max-Q:
50.7 56.4 ~ 54 fps
100%
GeForce GTX 1650 Ti Max-Q:
49.5 54.4 ~ 52 fps
100%
GeForce GTX 1650 Ti Max-Q:
35.9 fps
100%
GeForce GTX 1650 Ti Max-Q:
16.8 fps
100%
GeForce GTX 1650 Ti Max-Q:
211 fps
100%
GeForce GTX 1650 Ti Max-Q:
107 fps
100%
GeForce GTX 1650 Ti Max-Q:
82 fps
100%
GeForce GTX 1650 Ti Max-Q:
57 fps
100%
GeForce GTX 1650 Ti Max-Q:
41 fps
100%
GeForce GTX 1650 Ti Max-Q:
22 fps
100%
GeForce GTX 1650 Ti Max-Q:
162.9 fps
100%
GeForce GTX 1650 Ti Max-Q:
73.7 fps
100%
GeForce GTX 1650 Ti Max-Q:
44.4 fps
100%
GeForce GTX 1650 Ti Max-Q:
33.4 fps
100%
GeForce GTX 1650 Ti Max-Q:
23.5 fps
100%
GeForce GTX 1650 Ti Max-Q:
13.5 fps
100%
GeForce GTX 1650 Ti Max-Q:
145.1 fps
100%
GeForce GTX 1650 Ti Max-Q:
91.2 fps
100%
GeForce GTX 1650 Ti Max-Q:
52.6 fps
100%
GeForce GTX 1650 Ti Max-Q:
115.7 fps
100%
GeForce GTX 1650 Ti Max-Q:
50.1 fps
100%
GeForce GTX 1650 Ti Max-Q:
41.8 fps
100%
GeForce GTX 1650 Ti Max-Q:
120.7 fps
100%
GeForce GTX 1650 Ti Max-Q:
71.2 fps
100%
GeForce GTX 1650 Ti Max-Q:
52.8 fps
100%
GeForce GTX 1650 Ti Max-Q:
47 fps
100%
GeForce GTX 1650 Ti Max-Q:
63.3 fps
100%
GeForce GTX 1650 Ti Max-Q:
53.2 fps
100%
GeForce GTX 1650 Ti Max-Q:
46 fps
100%
GeForce GTX 1650 Ti Max-Q:
61.8 fps
100%
GeForce GTX 1650 Ti Max-Q:
49.3 fps
100%
GeForce GTX 1650 Ti Max-Q:
45.8 fps
100%
GeForce GTX 1650 Ti Max-Q:
33.9 fps
100%
GeForce GTX 1650 Ti Max-Q:
114 fps
100%
GeForce GTX 1650 Ti Max-Q:
76.9 fps
100%
GeForce GTX 1650 Ti Max-Q:
64.3 fps
100%
GeForce GTX 1650 Ti Max-Q:
27.5 fps
100%
GeForce GTX 1650 Ti Max-Q:
74 fps
100%
GeForce GTX 1650 Ti Max-Q:
45 fps
100%
GeForce GTX 1650 Ti Max-Q:
34 fps
100%
GeForce GTX 1650 Ti Max-Q:
22 fps
100%
GeForce GTX 1650 Ti Max-Q:
102.8 fps
100%
GeForce GTX 1650 Ti Max-Q:
52.6 fps
100%
GeForce GTX 1650 Ti Max-Q:
34.7 fps
100%
GeForce GTX 1650 Ti Max-Q:
26.1 fps
100%
GeForce GTX 1650 Ti Max-Q:
104.7 fps
100%
GeForce GTX 1650 Ti Max-Q:
39.2 fps
100%
GeForce GTX 1650 Ti Max-Q:
29.1 fps
100%
GeForce GTX 1650 Ti Max-Q:
171 fps
100%
GeForce GTX 1650 Ti Max-Q:
89 fps
100%
GeForce GTX 1650 Ti Max-Q:
71 fps
100%
GeForce GTX 1650 Ti Max-Q:
62 fps
100%
GeForce GTX 1650 Ti Max-Q:
56 57.5 60.3 ~ 58 fps
100%
GeForce GTX 1650 Ti Max-Q:
33.4 36 36.5 ~ 35 fps
100%
GeForce GTX 1650 Ti Max-Q:
89.4 fps
100%
GeForce GTX 1650 Ti Max-Q:
65.8 fps
100%
GeForce GTX 1650 Ti Max-Q:
41.1 fps
100%
GeForce GTX 1650 Ti Max-Q:
21.5 fps
100%
GeForce GTX 1650 Ti Max-Q:
93 fps
175%
RX Vega 56:
163 [X] AMD Ryzen 7 2700X 3.7GHz
RX Vega 56
fps
100%
GeForce GTX 1650 Ti Max-Q:
51 fps
241%
RX Vega 56:
123 [X] AMD Ryzen 7 2700X 3.7GHz
RX Vega 56
fps
100%
GeForce GTX 1650 Ti Max-Q:
41 fps
232%
RX Vega 56:
95 [X] AMD Ryzen 7 2700X 3.7GHz
RX Vega 56
fps
100%
GeForce GTX 1650 Ti Max-Q:
30 fps
250%
RX Vega 56:
75 [X] AMD Ryzen 7 2700X 3.7GHz
RX Vega 56
fps
RX Vega 56:
58 [X] AMD Ryzen 7 2700X 3.7GHz
RX Vega 56
fps
RX Vega 56:
30 [X] AMD Ryzen 7 2700X 3.7GHz
RX Vega 56
fps
100%
GeForce GTX 1650 Ti Max-Q:
195.9 fps
126%
RX Vega 56:
247 [X] AMD Ryzen 7 2700X 3.7GHz
RX Vega 56
min:
230 fps, max:
269 fps
fps
100%
GeForce GTX 1650 Ti Max-Q:
63.1 fps
304%
RX Vega 56:
192 [X] AMD Ryzen 7 2700X 3.7GHz
RX Vega 56
min:
174 fps, max:
208 fps
fps
100%
GeForce GTX 1650 Ti Max-Q:
55.1 fps
314%
RX Vega 56:
173 [X] AMD Ryzen 7 2700X 3.7GHz
RX Vega 56
min:
160 fps, max:
186 fps
fps
100%
GeForce GTX 1650 Ti Max-Q:
38.1 fps
249%
RX Vega 56:
95 [X] AMD Ryzen 7 2700X 3.7GHz
RX Vega 56
min:
88 fps, max:
107 fps
fps
RX Vega 56:
71 [X] AMD Ryzen 7 2700X 3.7GHz
RX Vega 56
min:
66 fps, max:
79 fps
fps
RX Vega 56:
40.5 [X] AMD Ryzen 7 2700X 3.7GHz
RX Vega 56
min:
37 fps, max:
45 fps
fps
RX Vega 56:
108 [X] AMD Ryzen 7 2700X 3.7GHz
RX Vega 56
min:
85 fps, max:
140 fps
fps
RX Vega 56:
101 [X] AMD Ryzen 7 2700X 3.7GHz
RX Vega 56
min:
82 fps, max:
136 fps
fps
RX Vega 56:
96 [X] AMD Ryzen 7 2700X 3.7GHz
RX Vega 56
min:
76 fps, max:
123 fps
fps
RX Vega 56:
89 [X] AMD Ryzen 7 2700X 3.7GHz
RX Vega 56
min:
72 fps, max:
116 fps
fps
RX Vega 56:
66 [X] AMD Ryzen 7 2700X 3.7GHz
RX Vega 56
min:
54 fps, max:
80 fps
fps
RX Vega 56:
36.6 [X] AMD Ryzen 7 2700X 3.7GHz
RX Vega 56
min:
32 fps, max:
42 fps
fps
100%
GeForce GTX 1650 Ti Max-Q:
89 fps
115%
RX Vega 56:
102 [X] AMD Ryzen 7 2700X 3.7GHz
RX Vega 56
min:
82 fps, max:
151 fps
fps
100%
GeForce GTX 1650 Ti Max-Q:
56 fps
171%
RX Vega 56:
96 [X] AMD Ryzen 7 2700X 3.7GHz
RX Vega 56
min:
76 fps, max:
137 fps
fps
100%
GeForce GTX 1650 Ti Max-Q:
53 fps
175%
RX Vega 56:
93 [X] AMD Ryzen 7 2700X 3.7GHz
RX Vega 56
min:
73 fps, max:
131 fps
fps
100%
GeForce GTX 1650 Ti Max-Q:
49 fps
171%
RX Vega 56:
84 [X] AMD Ryzen 7 2700X 3.7GHz
RX Vega 56
min:
61 fps, max:
126 fps
fps
RX Vega 56:
74 [X] AMD Ryzen 7 2700X 3.7GHz
RX Vega 56
min:
59 fps, max:
98 fps
fps
RX Vega 56:
42 [X] AMD Ryzen 7 2700X 3.7GHz
RX Vega 56
min:
35 fps, max:
54 fps
fps
100%
GeForce GTX 1650 Ti Max-Q:
83.1 fps
164%
RX Vega 56:
136.3 [X] AMD Ryzen 7 2700X 3.7GHz
RX Vega 56
min:
75 fps, max:
225 fps
fps
100%
GeForce GTX 1650 Ti Max-Q:
40.1 fps
236%
RX Vega 56:
94.8 [X] AMD Ryzen 7 2700X 3.7GHz
RX Vega 56
min:
44 fps, max:
95 fps
fps
100%
GeForce GTX 1650 Ti Max-Q:
29.8 fps
210%
RX Vega 56:
62.6 [X] AMD Ryzen 7 2700X 3.7GHz
RX Vega 56
min:
32 fps, max:
102 fps
fps
100%
GeForce GTX 1650 Ti Max-Q:
23.2 fps
224%
RX Vega 56:
52 [X] AMD Ryzen 7 2700X 3.7GHz
RX Vega 56
min:
28 fps, max:
82 fps
fps
RX Vega 56:
41.8 [X] AMD Ryzen 7 2700X 3.7GHz
RX Vega 56
min:
24 fps, max:
61 fps
fps
RX Vega 56:
26.7 [X] AMD Ryzen 7 2700X 3.7GHz
RX Vega 56
min:
18 fps, max:
35 fps
fps
100%
GeForce GTX 1650 Ti Max-Q:
143.7 fps
100%
RX Vega 56:
143 [X] AMD Ryzen 7 2700X 3.7GHz
RX Vega 56
min:
135 fps, max:
146 fps
fps
100%
GeForce GTX 1650 Ti Max-Q:
86.2 fps
167%
RX Vega 56:
144 [X] AMD Ryzen 7 2700X 3.7GHz
RX Vega 56
min:
138 fps, max:
145 fps
fps
100%
GeForce GTX 1650 Ti Max-Q:
68.7 fps
173%
RX Vega 56:
119 [X] AMD Ryzen 7 2700X 3.7GHz
RX Vega 56
min:
111 fps, max:
135 fps
fps
100%
GeForce GTX 1650 Ti Max-Q:
62.9 fps
188%
RX Vega 56:
118 [X] AMD Ryzen 7 2700X 3.7GHz
RX Vega 56
min:
102 fps, max:
135 fps
fps
RX Vega 56:
84 [X] AMD Ryzen 7 2700X 3.7GHz
RX Vega 56
min:
75 fps, max:
100 fps
fps
RX Vega 56:
45.5 [X] AMD Ryzen 7 2700X 3.7GHz
RX Vega 56
min:
40 fps, max:
57 fps
fps
RX Vega 56:
121 [X] AMD Ryzen 7 2700X 3.7GHz
RX Vega 56
min:
110 fps, max:
140 fps
fps
RX Vega 56:
114 [X] AMD Ryzen 7 2700X 3.7GHz
RX Vega 56
min:
104 fps, max:
125 fps
fps
RX Vega 56:
90 [X] AMD Ryzen 7 2700X 3.7GHz
RX Vega 56
min:
82 fps, max:
96 fps
fps
RX Vega 56:
86 [X] AMD Ryzen 7 2700X 3.7GHz
RX Vega 56
min:
79 fps, max:
91 fps
fps
RX Vega 56:
59.6 [X] AMD Ryzen 7 2700X 3.7GHz
RX Vega 56
min:
55 fps, max:
63 fps
fps
RX Vega 56:
32.1 [X] AMD Ryzen 7 2700X 3.7GHz
RX Vega 56
min:
29 fps, max:
35 fps
fps
RX Vega 56:
185 [X] AMD Ryzen 7 2700X 3.7GHz
RX Vega 56
min:
55 fps, max:
256 fps
fps
RX Vega 56:
128 [X] AMD Ryzen 7 2700X 3.7GHz
RX Vega 56
min:
54 fps, max:
167 fps
fps
RX Vega 56:
123 [X] AMD Ryzen 7 2700X 3.7GHz
RX Vega 56
min:
63 fps, max:
156 fps
fps
RX Vega 56:
93 [X] AMD Ryzen 7 2700X 3.7GHz
RX Vega 56
min:
52 fps, max:
106 fps
fps
RX Vega 56:
64 [X] AMD Ryzen 7 2700X 3.7GHz
RX Vega 56
min:
44 fps, max:
72 fps
fps
RX Vega 56:
32.8 [X] AMD Ryzen 7 2700X 3.7GHz
RX Vega 56
min:
27 fps, max:
38 fps
fps
RX Vega 56:
182 [X] AMD Ryzen 7 2700X 3.7GHz
RX Vega 56
min:
133 fps, max:
201 fps
fps
RX Vega 56:
151 [X] AMD Ryzen 7 2700X 3.7GHz
RX Vega 56
min:
127 fps, max:
192 fps
fps
RX Vega 56:
140 [X] AMD Ryzen 7 2700X 3.7GHz
RX Vega 56
min:
105 fps, max:
201 fps
fps
RX Vega 56:
131 [X] AMD Ryzen 7 2700X 3.7GHz
RX Vega 56
min:
101 fps, max:
201 fps
fps
RX Vega 56:
99 [X] AMD Ryzen 7 2700X 3.7GHz
RX Vega 56
min:
77 fps, max:
158 fps
fps
RX Vega 56:
54.7 [X] AMD Ryzen 7 2700X 3.7GHz
RX Vega 56
min:
44 fps, max:
89 fps
fps
RX Vega 56:
174 [X] AMD Ryzen 7 2700X 3.7GHz
RX Vega 56
min:
148 fps, max:
226 fps
fps
RX Vega 56:
132 [X] AMD Ryzen 7 2700X 3.7GHz
RX Vega 56
min:
116 fps, max:
172 fps
fps
RX Vega 56:
116 [X] AMD Ryzen 7 2700X 3.7GHz
RX Vega 56
min:
102 fps, max:
152 fps
fps
RX Vega 56:
99 [X] AMD Ryzen 7 2700X 3.7GHz
RX Vega 56
min:
82 fps, max:
141 fps
fps
RX Vega 56:
71 [X] AMD Ryzen 7 2700X 3.7GHz
RX Vega 56
min:
56 fps, max:
120 fps
fps
RX Vega 56:
39.1 [X] AMD Ryzen 7 2700X 3.7GHz
RX Vega 56
min:
30 fps, max:
72 fps
fps
RX Vega 56:
60 [X] AMD Ryzen 7 2700X 3.7GHz
RX Vega 56
fps
RX Vega 56:
60 [X] AMD Ryzen 7 2700X 3.7GHz
RX Vega 56
fps
RX Vega 56:
60 [X] AMD Ryzen 7 2700X 3.7GHz
RX Vega 56
fps
RX Vega 56:
60 [X] AMD Ryzen 7 2700X 3.7GHz
RX Vega 56
fps
RX Vega 56:
59.9 [X] AMD Ryzen 7 2700X 3.7GHz
RX Vega 56
fps
RX Vega 56:
44.8 [X] AMD Ryzen 7 2700X 3.7GHz
RX Vega 56
fps
RX Vega 56:
93 [X] AMD Ryzen 7 2700X 3.7GHz
RX Vega 56
min:
71 fps, max:
123 fps
fps
RX Vega 56:
88 [X] AMD Ryzen 7 2700X 3.7GHz
RX Vega 56
min:
58 fps, max:
117 fps
fps
RX Vega 56:
86 [X] AMD Ryzen 7 2700X 3.7GHz
RX Vega 56
min:
63 fps, max:
119 fps
fps
RX Vega 56:
80 [X] AMD Ryzen 7 2700X 3.7GHz
RX Vega 56
min:
59 fps, max:
113 fps
fps
RX Vega 56:
67 [X] AMD Ryzen 7 2700X 3.7GHz
RX Vega 56
min:
55 fps, max:
82 fps
fps
RX Vega 56:
34.5 [X] AMD Ryzen 7 2700X 3.7GHz
RX Vega 56
min:
30 fps, max:
42 fps
fps
RX Vega 56:
235 [X] AMD Ryzen 7 2700X 3.7GHz
RX Vega 56
min:
192 fps, max:
265 fps
fps
RX Vega 56:
164 [X] AMD Ryzen 7 2700X 3.7GHz
RX Vega 56
min:
120 fps, max:
202 fps
fps
RX Vega 56:
156 [X] AMD Ryzen 7 2700X 3.7GHz
RX Vega 56
min:
117 fps, max:
200 fps
fps
RX Vega 56:
150 [X] AMD Ryzen 7 2700X 3.7GHz
RX Vega 56
min:
110 fps, max:
203 fps
fps
RX Vega 56:
98 [X] AMD Ryzen 7 2700X 3.7GHz
RX Vega 56
min:
75 fps, max:
128 fps
fps
RX Vega 56:
46.2 [X] AMD Ryzen 7 2700X 3.7GHz
RX Vega 56
min:
32 fps, max:
68 fps
fps
100%
GeForce GTX 1650 Ti Max-Q:
63 fps
132%
RX Vega 56:
83 [X] AMD Ryzen 7 2700X 3.7GHz
RX Vega 56
fps
100%
GeForce GTX 1650 Ti Max-Q:
49 fps
157%
RX Vega 56:
77 [X] AMD Ryzen 7 2700X 3.7GHz
RX Vega 56
fps
100%
GeForce GTX 1650 Ti Max-Q:
41 fps
171%
RX Vega 56:
70 [X] AMD Ryzen 7 2700X 3.7GHz
RX Vega 56
fps
100%
GeForce GTX 1650 Ti Max-Q:
19 fps
274%
RX Vega 56:
52 [X] AMD Ryzen 7 2700X 3.7GHz
RX Vega 56
fps
RX Vega 56:
44 [X] AMD Ryzen 7 2700X 3.7GHz
RX Vega 56
fps
RX Vega 56:
27 [X] AMD Ryzen 7 2700X 3.7GHz
RX Vega 56
fps
RX Vega 56:
195 [X] AMD Ryzen 7 2700X 3.7GHz
RX Vega 56
fps
RX Vega 56:
141 [X] AMD Ryzen 7 2700X 3.7GHz
RX Vega 56
fps
RX Vega 56:
134 [X] AMD Ryzen 7 2700X 3.7GHz
RX Vega 56
fps
RX Vega 56:
109 [X] AMD Ryzen 7 2700X 3.7GHz
RX Vega 56
fps
RX Vega 56:
88 [X] AMD Ryzen 7 2700X 3.7GHz
RX Vega 56
fps
RX Vega 56:
59 [X] AMD Ryzen 7 2700X 3.7GHz
RX Vega 56
fps
RX Vega 56:
292 [X] AMD Ryzen 7 2700X 3.7GHz
RX Vega 56
min:
278 fps, max:
322 fps
fps
RX Vega 56:
293 [X] AMD Ryzen 7 2700X 3.7GHz
RX Vega 56
min:
269 fps, max:
319 fps
fps
RX Vega 56:
272 [X] AMD Ryzen 7 2700X 3.7GHz
RX Vega 56
min:
261 fps, max:
290 fps
fps
RX Vega 56:
272 [X] AMD Ryzen 7 2700X 3.7GHz
RX Vega 56
min:
258 fps, max:
290 fps
fps
RX Vega 56:
268 [X] AMD Ryzen 7 2700X 3.7GHz
RX Vega 56
min:
256 fps, max:
288 fps
fps
RX Vega 56:
195 [X] AMD Ryzen 7 2700X 3.7GHz
RX Vega 56
min:
191 fps, max:
201 fps
fps
129%
RX Vega 56:
137 [X] AMD Ryzen 7 2700X 3.7GHz
RX Vega 56
fps
184%
RX Vega 56:
105 [X] AMD Ryzen 7 2700X 3.7GHz
RX Vega 56
fps
200%
RX Vega 56:
96 [X] AMD Ryzen 7 2700X 3.7GHz
RX Vega 56
fps
213%
RX Vega 56:
85 [X] AMD Ryzen 7 2700X 3.7GHz
RX Vega 56
fps
RX Vega 56:
58 [X] AMD Ryzen 7 2700X 3.7GHz
RX Vega 56
fps
100%
GeForce GTX 1650 Ti Max-Q:
15 15 ~ 15 fps
207%
RX Vega 56:
31 [X] AMD Ryzen 7 2700X 3.7GHz
RX Vega 56
fps
100%
GeForce GTX 1650 Ti Max-Q:
167 [X] MSI Summit E14 A11SCS 1.47.22.14 D3D12
Intel Core i7-1185G7 3GHz
GeForce GTX 1650 Ti Max-Q
min:
117 fps, P1:
124 fps, max:
279 fps
188 [X] HP Envy 14-eb0010nr 1.47.22.14 D3D12
Intel Core i5-1135G7 2.4GHz
GeForce GTX 1650 Ti Max-Q
min:
61.8 fps, P1:
146 fps, max:
283 fps
196 ~ 184 fps
100%
GeForce GTX 1650 Ti Max-Q:
68.6 [X] MSI Summit E14 A11SCS 1.47.22.14 D3D12
Intel Core i7-1185G7 3GHz
GeForce GTX 1650 Ti Max-Q
min:
51.8 fps, P1:
56.2 fps, max:
105 fps
76.5 [X] HP Envy 14-eb0010nr 1.47.22.14 D3D12
Intel Core i5-1135G7 2.4GHz
GeForce GTX 1650 Ti Max-Q
min:
46.5 fps, P1:
66.4 fps, max:
168 fps
81.5 ~ 76 fps
100%
GeForce GTX 1650 Ti Max-Q:
54.9 [X] MSI Summit E14 A11SCS 1.47.22.14 D3D12
Intel Core i7-1185G7 3GHz
GeForce GTX 1650 Ti Max-Q
min:
40.1 fps, P1:
41.6 fps, max:
82.2 fps
62.2 [X] HP Envy 14-eb0010nr 1.47.22.14 D3D12
Intel Core i5-1135G7 2.4GHz
GeForce GTX 1650 Ti Max-Q
min:
48.5 fps, P1:
50 fps, max:
86.8 fps
65.6 ~ 61 fps
100%
GeForce GTX 1650 Ti Max-Q:
47.9 [X] MSI Summit E14 A11SCS 1.47.22.14 D3D12
Intel Core i7-1185G7 3GHz
GeForce GTX 1650 Ti Max-Q
min:
35.1 fps, P1:
36.4 fps, max:
68.6 fps
53.6 [X] HP Envy 14-eb0010nr 1.47.22.14 D3D12
Intel Core i5-1135G7 2.4GHz
GeForce GTX 1650 Ti Max-Q
min:
27 fps, P1:
43 fps, max:
125 fps
55.2 ~ 52 fps
100%
GeForce GTX 1650 Ti Max-Q:
35 [X] MSI Summit E14 A11SCS 1.47.22.14 D3D12
Intel Core i7-1185G7 3GHz
GeForce GTX 1650 Ti Max-Q
min:
29.2 fps, P1:
29.8 fps, max:
48 fps
fps
100%
GeForce GTX 1650 Ti Max-Q:
21.4 [X] MSI Summit E14 A11SCS 1.47.22.14 D3D12
Intel Core i7-1185G7 3GHz
GeForce GTX 1650 Ti Max-Q
min:
18.1 fps, P1:
18.5 fps, max:
26.5 fps
fps
RX Vega 56:
222 [X] AMD Ryzen 7 2700X 3.7GHz
RX Vega 56
min:
172 fps, max:
251 fps
fps
RX Vega 56:
184 [X] AMD Ryzen 7 2700X 3.7GHz
RX Vega 56
min:
144 fps, max:
214 fps
fps
RX Vega 56:
146 [X] AMD Ryzen 7 2700X 3.7GHz
RX Vega 56
min:
121 fps, max:
163 fps
fps
RX Vega 56:
111 [X] AMD Ryzen 7 2700X 3.7GHz
RX Vega 56
min:
101 fps, max:
128 fps
fps
RX Vega 56:
87 [X] AMD Ryzen 7 2700X 3.7GHz
RX Vega 56
min:
76 fps, max:
102 fps
fps
RX Vega 56:
51 [X] AMD Ryzen 7 2700X 3.7GHz
RX Vega 56
min:
45 fps, max:
59 fps
fps
RX Vega 56:
125 [X] AMD Ryzen 7 2700X 3.7GHz
RX Vega 56
min:
94 fps, max:
138 fps
fps
RX Vega 56:
100 [X] AMD Ryzen 7 2700X 3.7GHz
RX Vega 56
min:
81 fps, max:
120 fps
fps
RX Vega 56:
94 [X] AMD Ryzen 7 2700X 3.7GHz
RX Vega 56
min:
79 fps, max:
112 fps
fps
RX Vega 56:
74 [X] AMD Ryzen 7 2700X 3.7GHz
RX Vega 56
min:
61 fps, max:
91 fps
fps
RX Vega 56:
50.3 [X] AMD Ryzen 7 2700X 3.7GHz
RX Vega 56
min:
42 fps, max:
66 fps
fps
RX Vega 56:
25.4 [X] AMD Ryzen 7 2700X 3.7GHz
RX Vega 56
min:
22 fps, max:
30 fps
fps
RX Vega 56:
60 [X] AMD Ryzen 7 2700X 3.7GHz
RX Vega 56
fps
RX Vega 56:
60 [X] AMD Ryzen 7 2700X 3.7GHz
RX Vega 56
fps
RX Vega 56:
60 [X] AMD Ryzen 7 2700X 3.7GHz
RX Vega 56
fps
RX Vega 56:
60 [X] AMD Ryzen 7 2700X 3.7GHz
RX Vega 56
fps
RX Vega 56:
60 [X] AMD Ryzen 7 2700X 3.7GHz
RX Vega 56
fps
RX Vega 56:
33.4 [X] AMD Ryzen 7 2700X 3.7GHz
RX Vega 56
fps
100%
GeForce GTX 1650 Ti Max-Q:
90 102 115 ~ 102 fps
115%
RX Vega 56:
117 [X] AMD Ryzen 7 2700X 3.7GHz
RX Vega 56
min:
96 fps, max:
156 fps
fps
100%
GeForce GTX 1650 Ti Max-Q:
46 56 64 ~ 55 fps
178%
RX Vega 56:
98 [X] AMD Ryzen 7 2700X 3.7GHz
RX Vega 56
min:
81 fps, max:
127 fps
fps
100%
GeForce GTX 1650 Ti Max-Q:
42 51 60 ~ 51 fps
182%
RX Vega 56:
93 [X] AMD Ryzen 7 2700X 3.7GHz
RX Vega 56
min:
75 fps, max:
117 fps
fps
100%
GeForce GTX 1650 Ti Max-Q:
39 47 48 [X] MSI Summit E15 A11SCST High Performance
Intel Core i7-1185G7 3GHz
GeForce GTX 1650 Ti Max-Q
min:
41 fps, max:
56 fps
56 ~ 48 fps
185%
RX Vega 56:
89 [X] AMD Ryzen 7 2700X 3.7GHz
RX Vega 56
min:
71 fps, max:
111 fps
fps
100%
GeForce GTX 1650 Ti Max-Q:
27 38 ~ 33 fps
224%
RX Vega 56:
74 [X] AMD Ryzen 7 2700X 3.7GHz
RX Vega 56
min:
65 fps, max:
90 fps
fps
100%
GeForce GTX 1650 Ti Max-Q:
14 17 ~ 16 fps
244%
RX Vega 56:
39 [X] AMD Ryzen 7 2700X 3.7GHz
RX Vega 56
min:
34 fps, max:
51 fps
fps
100%
GeForce GTX 1650 Ti Max-Q:
79 80.2 85.9 86.6 86.8 91.2 92.6 93.9 96.4 97.5 [X] MSI Summit E15 A11SCST High Performance
Intel Core i7-1185G7 3GHz
GeForce GTX 1650 Ti Max-Q
98 [X] MSI Summit E15 A11SCST High Performance, Cooler Boost
Intel Core i7-1185G7 3GHz
GeForce GTX 1650 Ti Max-Q
~ 90 fps
100%
GeForce GTX 1650 Ti Max-Q:
71.5 71.9 72.8 73.5 78.2 79.2 79.4 80.7 83.5 [X] MSI Summit E15 A11SCST High Performance
Intel Core i7-1185G7 3GHz
GeForce GTX 1650 Ti Max-Q
83.9 [X] MSI Summit E15 A11SCST High Performance, Cooler Boost
Intel Core i7-1185G7 3GHz
GeForce GTX 1650 Ti Max-Q
87.5 ~ 78 fps
100%
GeForce GTX 1650 Ti Max-Q:
60.5 62.6 62.7 63.1 66.4 66.7 67.5 69.7 70.6 [X] MSI Summit E15 A11SCST High Performance
Intel Core i7-1185G7 3GHz
GeForce GTX 1650 Ti Max-Q
70.8 [X] MSI Summit E15 A11SCST High Performance, Cooler Boost
Intel Core i7-1185G7 3GHz
GeForce GTX 1650 Ti Max-Q
72.3 ~ 67 fps
RX Vega 56:
139 [X] AMD Ryzen 7 2700X 3.7GHz
RX Vega 56
min:
61 fps, max:
172 fps
fps
RX Vega 56:
115 [X] AMD Ryzen 7 2700X 3.7GHz
RX Vega 56
min:
61 fps, max:
132 fps
fps
RX Vega 56:
92 [X] AMD Ryzen 7 2700X 3.7GHz
RX Vega 56
min:
64 fps, max:
110 fps
fps
RX Vega 56:
69 [X] AMD Ryzen 7 2700X 3.7GHz
RX Vega 56
min:
54 fps, max:
81 fps
fps
RX Vega 56:
45.6 [X] AMD Ryzen 7 2700X 3.7GHz
RX Vega 56
min:
37 fps, max:
52 fps
fps
RX Vega 56:
22.8 [X] AMD Ryzen 7 2700X 3.7GHz
RX Vega 56
min:
18 fps, max:
26 fps
fps
100%
GeForce GTX 1650 Ti Max-Q:
72 90.1 94 ~ 85 fps
100%
GeForce GTX 1650 Ti Max-Q:
19.3 fps
100%
GeForce GTX 1650 Ti Max-Q:
10.1 fps
RX Vega 56:
167 [X] AMD Ryzen 7 2700X 3.7GHz
RX Vega 56
min:
7 fps, max:
308 fps
fps
RX Vega 56:
150 [X] AMD Ryzen 7 2700X 3.7GHz
RX Vega 56
min:
102 fps, max:
280 fps
fps
RX Vega 56:
139 [X] AMD Ryzen 7 2700X 3.7GHz
RX Vega 56
min:
126 fps, max:
153 fps
fps
RX Vega 56:
108 [X] AMD Ryzen 7 2700X 3.7GHz
RX Vega 56
min:
96 fps, max:
125 fps
fps
RX Vega 56:
74 [X] AMD Ryzen 7 2700X 3.7GHz
RX Vega 56
min:
70 fps, max:
81 fps
fps
RX Vega 56:
36.7 [X] AMD Ryzen 7 2700X 3.7GHz
RX Vega 56
min:
28 fps, max:
41 fps
fps
RX Vega 56:
201 [X] AMD Ryzen 7 2700X 3.7GHz
RX Vega 56
min:
112 fps, max:
341 fps
fps
RX Vega 56:
201 [X] AMD Ryzen 7 2700X 3.7GHz
RX Vega 56
min:
109 fps, max:
328 fps
fps
RX Vega 56:
140 [X] AMD Ryzen 7 2700X 3.7GHz
RX Vega 56
min:
85 fps, max:
198 fps
fps
RX Vega 56:
118 [X] AMD Ryzen 7 2700X 3.7GHz
RX Vega 56
min:
81 fps, max:
146 fps
fps
RX Vega 56:
95 [X] AMD Ryzen 7 2700X 3.7GHz
RX Vega 56
min:
78 fps, max:
110 fps
fps
RX Vega 56:
57.6 [X] AMD Ryzen 7 2700X 3.7GHz
RX Vega 56
min:
49 fps, max:
66 fps
fps
RX Vega 56:
71 [X] AMD Ryzen 7 2700X 3.7GHz
RX Vega 56
fps
RX Vega 56:
66 [X] AMD Ryzen 7 2700X 3.7GHz
RX Vega 56
fps
RX Vega 56:
64 [X] AMD Ryzen 7 2700X 3.7GHz
RX Vega 56
fps
RX Vega 56:
59 [X] AMD Ryzen 7 2700X 3.7GHz
RX Vega 56
fps
RX Vega 56:
52 [X] AMD Ryzen 7 2700X 3.7GHz
RX Vega 56
fps
RX Vega 56:
33 [X] AMD Ryzen 7 2700X 3.7GHz
RX Vega 56
fps
RX Vega 56:
150 [X] AMD Ryzen 7 2700X 3.7GHz
RX Vega 56
P1:
113.2 fps
fps
RX Vega 56:
141 [X] AMD Ryzen 7 2700X 3.7GHz
RX Vega 56
P1:
109 fps
fps
RX Vega 56:
134 [X] AMD Ryzen 7 2700X 3.7GHz
RX Vega 56
P1:
102.1 fps
fps
RX Vega 56:
115 [X] AMD Ryzen 7 2700X 3.7GHz
RX Vega 56
P1:
93.8 fps
fps
RX Vega 56:
80 [X] AMD Ryzen 7 2700X 3.7GHz
RX Vega 56
P1:
69.9 fps
fps
RX Vega 56:
43.2 [X] AMD Ryzen 7 2700X 3.7GHz
RX Vega 56
P1:
39.1 fps
fps
RX Vega 56:
167 [X] AMD Ryzen 7 2700X 3.7GHz
RX Vega 56
min:
123 fps, max:
232 fps
fps
RX Vega 56:
153 [X] AMD Ryzen 7 2700X 3.7GHz
RX Vega 56
min:
118 fps, max:
180 fps
fps
RX Vega 56:
137 [X] AMD Ryzen 7 2700X 3.7GHz
RX Vega 56
min:
104 fps, max:
166 fps
fps
RX Vega 56:
120 [X] AMD Ryzen 7 2700X 3.7GHz
RX Vega 56
min:
89 fps, max:
136 fps
fps
RX Vega 56:
44.3 [X] AMD Ryzen 7 2700X 3.7GHz
RX Vega 56
min:
30 fps, max:
50 fps
fps
RX Vega 56:
324 [X] AMD Ryzen 7 2700X 3.7GHz
RX Vega 56
min:
305 fps, max:
348 fps
fps
RX Vega 56:
251 [X] AMD Ryzen 7 2700X 3.7GHz
RX Vega 56
min:
237 fps, max:
267 fps
fps
RX Vega 56:
176 [X] AMD Ryzen 7 2700X 3.7GHz
RX Vega 56
min:
158 fps, max:
201 fps
fps
RX Vega 56:
112 [X] AMD Ryzen 7 2700X 3.7GHz
RX Vega 56
min:
97 fps, max:
136 fps
fps
RX Vega 56:
63 [X] AMD Ryzen 7 2700X 3.7GHz
RX Vega 56
min:
56 fps, max:
74 fps
fps
RX Vega 56:
129.7 [X] AMD Ryzen 7 2700X 3.7GHz
RX Vega 56
min:
108 fps, max:
148 fps
fps
RX Vega 56:
94.3 [X] AMD Ryzen 7 2700X 3.7GHz
RX Vega 56
min:
82 fps, max:
106 fps
fps
RX Vega 56:
88.8 [X] AMD Ryzen 7 2700X 3.7GHz
RX Vega 56
min:
74 fps, max:
100 fps
fps
RX Vega 56:
52.1 [X] AMD Ryzen 7 2700X 3.7GHz
RX Vega 56
min:
42 fps, max:
59 fps
fps
RX Vega 56:
35.8 [X] AMD Ryzen 7 2700X 3.7GHz
RX Vega 56
min:
26 fps, max:
41 fps
fps
RX Vega 56:
299.8 [X] AMD Ryzen 7 2700X 3.7GHz
RX Vega 56
min:
149 fps, max:
393 fps
fps
RX Vega 56:
147.2 [X] AMD Ryzen 7 2700X 3.7GHz
RX Vega 56
min:
103 fps, max:
194 fps
fps
RX Vega 56:
140.6 [X] AMD Ryzen 7 2700X 3.7GHz
RX Vega 56
min:
114 fps, max:
172 fps
fps
RX Vega 56:
111 [X] AMD Ryzen 7 2700X 3.7GHz
RX Vega 56
min:
81 fps, max:
146 fps
fps
RX Vega 56:
45.5 [X] AMD Ryzen 7 2700X 3.7GHz
RX Vega 56
min:
36 fps, max:
57 fps
fps
RX Vega 56:
107 [X] AMD Ryzen 7 2700X 3.7GHz
RX Vega 56
min:
82 fps, max:
138 fps
fps
RX Vega 56:
98 [X] AMD Ryzen 7 2700X 3.7GHz
RX Vega 56
min:
73 fps, max:
124 fps
fps
RX Vega 56:
87 [X] AMD Ryzen 7 2700X 3.7GHz
RX Vega 56
min:
66 fps, max:
105 fps
fps
RX Vega 56:
60 [X] AMD Ryzen 7 2700X 3.7GHz
RX Vega 56
min:
50 fps, max:
69 fps
fps
RX Vega 56:
32.7 [X] AMD Ryzen 7 2700X 3.7GHz
RX Vega 56
min:
29 fps, max:
36 fps
fps
RX Vega 56:
195 [X] AMD Ryzen 7 2700X 3.7GHz
RX Vega 56
min:
181 fps, max:
201 fps
fps
RX Vega 56:
182 [X] AMD Ryzen 7 2700X 3.7GHz
RX Vega 56
min:
171 fps, max:
194 fps
fps
RX Vega 56:
150 [X] AMD Ryzen 7 2700X 3.7GHz
RX Vega 56
min:
141 fps, max:
175 fps
fps
RX Vega 56:
136 [X] AMD Ryzen 7 2700X 3.7GHz
RX Vega 56
min:
124 fps, max:
143 fps
fps
RX Vega 56:
62 [X] AMD Ryzen 7 2700X 3.7GHz
RX Vega 56
min:
57 fps, max:
69 fps
fps
RX Vega 56:
132.2 [X] AMD Ryzen 7 2700X 3.7GHz
RX Vega 56
min:
62 fps, max:
198 fps
fps
RX Vega 56:
124.1 [X] AMD Ryzen 7 2700X 3.7GHz
RX Vega 56
min:
82 fps, max:
190 fps
fps
RX Vega 56:
96.3 [X] AMD Ryzen 7 2700X 3.7GHz
RX Vega 56
min:
77 fps, max:
128 fps
fps
RX Vega 56:
49.4 [X] AMD Ryzen 7 2700X 3.7GHz
RX Vega 56
min:
39 fps, max:
64 fps
fps
RX Vega 56:
33.7 [X] AMD Ryzen 7 2700X 3.7GHz
RX Vega 56
min:
28 fps, max:
42 fps
fps
RX Vega 56:
300 [X] AMD Ryzen 7 2700X 3.7GHz
RX Vega 56
min:
297 fps, max:
301 fps
fps
RX Vega 56:
300 [X] AMD Ryzen 7 2700X 3.7GHz
RX Vega 56
min:
296 fps, max:
301 fps
fps
RX Vega 56:
189 [X] AMD Ryzen 7 2700X 3.7GHz
RX Vega 56
min:
152 fps, max:
221 fps
fps
RX Vega 56:
101 [X] AMD Ryzen 7 2700X 3.7GHz
RX Vega 56
min:
82 fps, max:
117 fps
fps
RX Vega 56:
107 [X] AMD Ryzen 7 2700X 3.7GHz
RX Vega 56
min:
90 fps, max:
127 fps
fps
RX Vega 56:
91 [X] AMD Ryzen 7 2700X 3.7GHz
RX Vega 56
min:
75 fps, max:
111 fps
fps
RX Vega 56:
84 [X] AMD Ryzen 7 2700X 3.7GHz
RX Vega 56
min:
68 fps, max:
96 fps
fps
RX Vega 56:
83 [X] AMD Ryzen 7 2700X 3.7GHz
RX Vega 56
min:
66 fps, max:
104 fps
fps
RX Vega 56:
83 [X] AMD Ryzen 7 2700X 3.7GHz
RX Vega 56
min:
65 fps, max:
103 fps
fps
RX Vega 56:
52.6 [X] AMD Ryzen 7 2700X 3.7GHz
RX Vega 56
min:
43 fps, max:
70 fps
fps
RX Vega 56:
226.4 [X] AMD Ryzen 7 2700X 3.7GHz
RX Vega 56
fps
RX Vega 56:
181.4 [X] AMD Ryzen 7 2700X 3.7GHz
RX Vega 56
fps
RX Vega 56:
119.4 [X] AMD Ryzen 7 2700X 3.7GHz
RX Vega 56
fps
RX Vega 56:
94.8 [X] AMD Ryzen 7 2700X 3.7GHz
RX Vega 56
fps
RX Vega 56:
47.7 [X] AMD Ryzen 7 2700X 3.7GHz
RX Vega 56
fps
RX Vega 56:
124 [X] AMD Ryzen 7 2700X 3.7GHz
RX Vega 56
min:
96 fps, max:
146 fps
fps
RX Vega 56:
111 [X] AMD Ryzen 7 2700X 3.7GHz
RX Vega 56
min:
82 fps, max:
131 fps
fps
RX Vega 56:
101 [X] AMD Ryzen 7 2700X 3.7GHz
RX Vega 56
min:
77 fps, max:
119 fps
fps
RX Vega 56:
94 [X] AMD Ryzen 7 2700X 3.7GHz
RX Vega 56
min:
67 fps, max:
112 fps
fps
RX Vega 56:
40 [X] AMD Ryzen 7 2700X 3.7GHz
RX Vega 56
min:
35 fps, max:
45 fps
fps
100%
GeForce GTX 1650 Ti Max-Q:
89.7 163.4 ~ 127 fps
198%
RX Vega 56:
251 [X] AMD Ryzen 7 2700X 3.7GHz
RX Vega 56
min:
238 fps, max:
262 fps
fps
100%
GeForce GTX 1650 Ti Max-Q:
84.7 107.4 ~ 96 fps
180%
RX Vega 56:
173 [X] AMD Ryzen 7 2700X 3.7GHz
RX Vega 56
fps
100%
GeForce GTX 1650 Ti Max-Q:
58.1 60.5 ~ 59 fps
181%
RX Vega 56:
107 [X] AMD Ryzen 7 2700X 3.7GHz
RX Vega 56
min:
98 fps, max:
117 fps
fps
100%
GeForce GTX 1650 Ti Max-Q:
48.9 49.1 ~ 49 fps
176%
RX Vega 56:
86 [X] AMD Ryzen 7 2700X 3.7GHz
RX Vega 56
min:
73 fps, max:
100 fps
fps
100%
GeForce GTX 1650 Ti Max-Q:
19.9 22.9 ~ 21 fps
213%
RX Vega 56:
44.7 [X] AMD Ryzen 7 2700X 3.7GHz
RX Vega 56
min:
39 fps, max:
51 fps
fps
RX Vega 56:
319.5 [X] AMD Ryzen 7 2700X 3.7GHz
RX Vega 56
min:
65 fps, max:
512 fps
fps
RX Vega 56:
271.8 [X] AMD Ryzen 7 2700X 3.7GHz
RX Vega 56
min:
63 fps, max:
447 fps
fps
RX Vega 56:
233.2 [X] AMD Ryzen 7 2700X 3.7GHz
RX Vega 56
min:
60 fps, max:
372 fps
fps
RX Vega 56:
201.6 [X] AMD Ryzen 7 2700X 3.7GHz
RX Vega 56
min:
67 fps, max:
297 fps
fps
RX Vega 56:
89.2 [X] AMD Ryzen 7 2700X 3.7GHz
RX Vega 56
min:
68 fps, max:
112 fps
fps
100%
GeForce GTX 1650 Ti Max-Q:
118 128 130 137 140 [X] MSI Summit E15 A11SCST High Performance, Cooler Boost
Intel Core i7-1185G7 3GHz
GeForce GTX 1650 Ti Max-Q
min:
123.5 fps, max:
-1 fps
140 142 143 [X] MSI Summit E15 A11SCST High Performance
Intel Core i7-1185G7 3GHz
GeForce GTX 1650 Ti Max-Q
min:
125.9 fps, max:
-1 fps
143 144 147 ~ 137 fps
100%
GeForce GTX 1650 Ti Max-Q:
112 116 117 118 118 119 121 124 [X] MSI Summit E15 A11SCST High Performance
Intel Core i7-1185G7 3GHz
GeForce GTX 1650 Ti Max-Q
min:
109 fps, max:
-1 fps
124 [X] MSI Summit E15 A11SCST High Performance, Cooler Boost
Intel Core i7-1185G7 3GHz
GeForce GTX 1650 Ti Max-Q
min:
107.8 fps, max:
-1 fps
127 129 ~ 120 fps
100%
GeForce GTX 1650 Ti Max-Q:
107 107 109 111 111 112 113 115 117 [X] MSI Summit E15 A11SCST High Performance
Intel Core i7-1185G7 3GHz
GeForce GTX 1650 Ti Max-Q
min:
100.4 fps, max:
-1 fps
117 [X] MSI Summit E15 A11SCST High Performance, Cooler Boost
Intel Core i7-1185G7 3GHz
GeForce GTX 1650 Ti Max-Q
min:
100.7 fps, max:
-1 fps
121 ~ 113 fps
100%
GeForce GTX 1650 Ti Max-Q:
101 103 104 104 105 106 107 108 [X] MSI Summit E15 A11SCST High Performance
Intel Core i7-1185G7 3GHz
GeForce GTX 1650 Ti Max-Q
min:
89.9 fps, max:
-1 fps
108 [X] MSI Summit E15 A11SCST High Performance, Cooler Boost
Intel Core i7-1185G7 3GHz
GeForce GTX 1650 Ti Max-Q
min:
91.3 fps, max:
-1 fps
109 110 ~ 106 fps
174%
RX Vega 56:
293 [X] AMD Ryzen 7 2700X 3.7GHz
RX Vega 56
min:
245 fps, max:
320 fps
fps
203%
RX Vega 56:
207 [X] AMD Ryzen 7 2700X 3.7GHz
RX Vega 56
min:
191 fps, max:
235 fps
fps
225%
RX Vega 56:
124 [X] AMD Ryzen 7 2700X 3.7GHz
RX Vega 56
min:
113 fps, max:
140 fps
fps
231%
RX Vega 56:
74 [X] AMD Ryzen 7 2700X 3.7GHz
RX Vega 56
min:
66 fps, max:
81 fps
fps
222%
RX Vega 56:
44.4 [X] AMD Ryzen 7 2700X 3.7GHz
RX Vega 56
min:
41 fps, max:
49 fps
fps
100%
GeForce GTX 1650 Ti Max-Q:
156 [X] HP Envy 14-eb0010nr Intel Core i5-1135G7 2.4GHz
GeForce GTX 1650 Ti Max-Q
min:
4.62 fps, P1:
90.9 fps, max:
263 fps
167 171 ~ 165 fps
86%
RX Vega 56:
142 [X] AMD Ryzen 7 2700X 3.7GHz
RX Vega 56
min:
20.6 fps, P1:
100 fps, max:
192 fps
fps
100%
GeForce GTX 1650 Ti Max-Q:
145 [X] HP Envy 14-eb0010nr Intel Core i5-1135G7 2.4GHz
GeForce GTX 1650 Ti Max-Q
min:
4.59 fps, P1:
83.3 fps, max:
250 fps
157 164 ~ 155 fps
83%
RX Vega 56:
128 [X] AMD Ryzen 7 2700X 3.7GHz
RX Vega 56
min:
18.8 fps, P1:
90.9 fps, max:
163 fps
fps
100%
GeForce GTX 1650 Ti Max-Q:
73.2 88.1 [X] HP Envy 14-eb0010nr Intel Core i5-1135G7 2.4GHz
GeForce GTX 1650 Ti Max-Q
min:
15.1 fps, P1:
62.5 fps, max:
150 fps
91.5 ~ 84 fps
131%
RX Vega 56:
110 [X] AMD Ryzen 7 2700X 3.7GHz
RX Vega 56
min:
11.7 fps, P1:
83.3 fps, max:
130 fps
fps
100%
GeForce GTX 1650 Ti Max-Q:
37.1 45.3 [X] HP Envy 14-eb0010nr Intel Core i5-1135G7 2.4GHz
GeForce GTX 1650 Ti Max-Q
min:
17.6 fps, P1:
29.4 fps, max:
102 fps
45.4 ~ 43 fps
181%
RX Vega 56:
78 [X] AMD Ryzen 7 2700X 3.7GHz
RX Vega 56
min:
7.59 fps, P1:
62.5 fps, max:
128 fps
fps
100%
GeForce GTX 1650 Ti Max-Q:
26 fps
100%
GeForce GTX 1650 Ti Max-Q:
24.8 fps
203%
RX Vega 56:
50.4 [X] AMD Ryzen 7 2700X 3.7GHz
RX Vega 56
min:
40.7 fps, P1:
41.7 fps, max:
134 fps
fps
RX Vega 56:
199 [X] AMD Ryzen 7 2700X 3.7GHz
RX Vega 56
min:
187 fps, max:
202 fps
fps
RX Vega 56:
200 [X] AMD Ryzen 7 2700X 3.7GHz
RX Vega 56
min:
197 fps, max:
202 fps
fps
RX Vega 56:
200 [X] AMD Ryzen 7 2700X 3.7GHz
RX Vega 56
min:
197 fps, max:
201 fps
fps
RX Vega 56:
130 [X] AMD Ryzen 7 2700X 3.7GHz
RX Vega 56
min:
121 fps, max:
158 fps
fps
RX Vega 56:
71 [X] AMD Ryzen 7 2700X 3.7GHz
RX Vega 56
min:
63 fps, max:
85 fps
fps
Average Gaming NVIDIA GeForce GTX 1650 Ti Max-Q → 100% Average Gaming 30-70 fps → 100%
Average Gaming AMD Radeon RX Vega 56 → 189% Average Gaming 30-70 fps → 225%
 Deutsch
 English
 Español
 Français
 Italiano
 Nederlands
 Polski
 Português
 Русский
 Türkçe
 Svenska
 Chinese
 Magyar