NVIDIA GeForce GTX 1070 Ti (Desktop) vs Intel HD Graphics (Haswell)
NVIDIA GeForce GTX 1070 Ti (Desktop) ► remove from comparison
The Nvidia GeForce GTX 1070 Ti is the second fastest Pascal based graphics card in November 2017. It is a high-end desktop graphics card based on a cut down GP104 chip as the GTX 1080 and manufactured in 16 nm FinFET at TSMC. Compared to the GTX 1080, it uses the more available GDDR5 graphics memory, and compared to the GTX 1070 it offers more shaders (2432 versus 1920). More details on the Pascal architecture including all features and comparisons to Maxwell, can be found here .
The performance of the GTX 1070 Ti was in our tests right between the GTX 1070 and GTX 1080. However, the powerefficiency was worse than the GTX 1070 and near the GTX 1080. Nvidia also specifies the 1070 Ti and 1080 at 180W.
Intel HD Graphics (Haswell) ► remove from comparison
The Intel HD Graphics (Haswell) is an integrated graphics card in the Haswell codenamed processors (Celeron and Pentium). It is the successor the the Intel HD Graphics in the Ivy Bridge CPUs and performs slightly better. Depending on the processor model, the base and turbo clock rates may differ, resulting in varying graphics performance between CPU models.
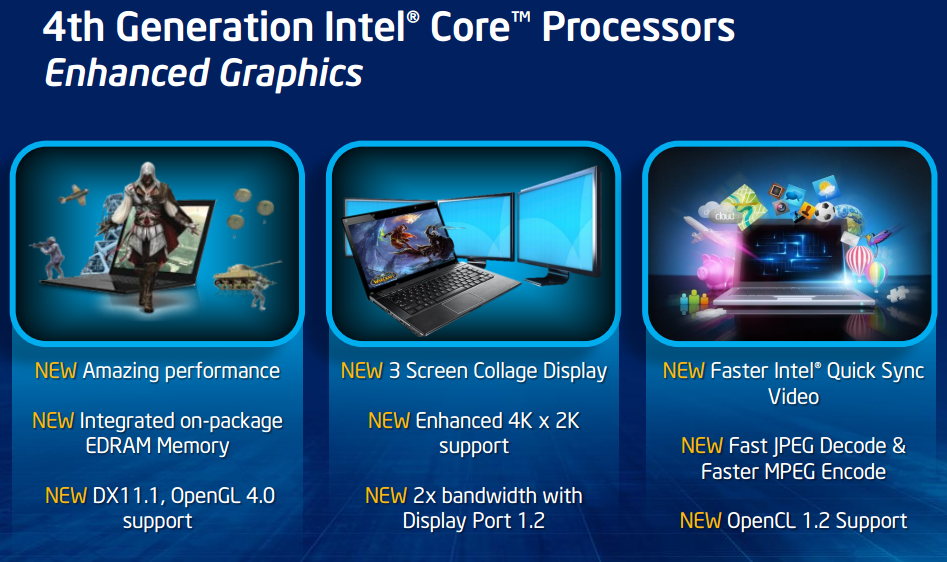
In comparison to the HD 4000, the graphics core has been modified extensively. The GPU supports DirectX 11.1, OpenCL 1.2 and OpenGL 4.0. It also features an improved decoder for 4K videos and the fast Quick Sync encoder (deactivated in many entry level models).
The Performance of the HD Graphics (Haswell) is similar to the old HD Graphics 3000 or the AMD Radeon HD 8250 . Only a few modern games like Dota 2 can be played fluently in very low details and resolutions.
Due to the 22nm 3D Tri-Gate production process, the power consumption should be relatively low (the development was focused on performance per Watt). The GPU can be found in ULV models and regular (37 W) dual core CPUs.
NVIDIA GeForce GTX 1070 Ti (Desktop) Intel HD Graphics (Haswell) HD Graphics Series Codename Pascal GP104 Haswell GT1 Architecture Pascal Gen. 7.5 Haswell Pipelines 2432 - unified 10 - unified Core Speed 1607 - 1683 (Boost) MHz 200 - 1000 (Boost) MHz Memory Speed 8000 MHz Memory Bus Width 256 Bit 64/128 Bit Memory Type GDDR5 Max. Amount of Memory 8 GB Shared Memory no yes API DirectX 12_1, OpenGL 4.5 DirectX 11.1, Shader 5.0 Power Consumption 180 Watt Transistors 7.2 Billion technology 16 nm 22 nm Features Multi-Projection, VR Ready, G-SYNC, Vulkan, Multi Monitor Date of Announcement 02.11.2017 01.10.2012 Link to Manufacturer Page www.nvidia.at
CPU in HD Graphics (Haswell) GPU Base Speed GPU Boost / Turbo Intel Pentium 3560M 2 x 2400 MHz, 37 W 400 MHz 1100 MHz Intel Pentium 3550M 2 x 2300 MHz, 37 W 400 MHz 1100 MHz Intel Celeron 2970M 2 x 2200 MHz, 37 W 400 MHz 1100 MHz » show 10 more Intel Celeron 2950M 2 x 2000 MHz, 37 W 400 MHz 1100 MHz Intel Pentium 3558U 2 x 1700 MHz, 15 W 200 MHz 1000 MHz Intel Pentium 3556U 2 x 1700 MHz, 15 W 200 MHz 1000 MHz Intel Celeron 2981U 2 x 1600 MHz, 15 W 200 MHz 1000 MHz Intel Celeron 2980U 2 x 1600 MHz, 15 W 200 MHz 1000 MHz Intel Celeron 2957U 2 x 1400 MHz, 15 W 200 MHz 1000 MHz Intel Celeron 2955U 2 x 1400 MHz, 15 W 200 MHz 1000 MHz Intel Pentium 3561Y 2 x 1200 MHz, 11.5 W 200 MHz 850 MHz Intel Pentium 3560Y 2 x 1200 MHz, 11.5 W 200 MHz 850 MHz Intel Celeron 2961Y 2 x 1100 MHz, 11.5 W 200 MHz 850 MHz min. - max. 200 - 400 MHz 850 - 1100 MHz
Benchmarks Performance Rating - 3DMark 11 + Fire Strike + Time Spy - HD Graphics (Haswell)
0.2 pt (0%)
...
Intel HD Graphics (Haswell)
...
3DMark - 3DMark Time Spy Score
6177 Points (18%)
3DMark - 3DMark Time Spy Graphics
6531 Points (17%)
3DMark - 3DMark Ice Storm Unlimited Graphics
442105 Points (50%)
43493 Points (5%)
3DMark - 3DMark Cloud Gate Score
29364 Points (31%)
min: 2141 avg: 2403 median: 2335.5 (2%) max: 3011 Points
3DMark - 3DMark Cloud Gate Graphics
88161 Points (23%)
min: 3111 avg: 3415 median: 3278 (1%) max: 4199 Points
3DMark - 3DMark Fire Strike Standard Score
15061 Points (27%)
min: 300 avg: 323.8 median: 314 (1%) max: 383 Points
3DMark - 3DMark Fire Strike Standard Graphics
18405 Points (21%)
min: 340 avg: 370.8 median: 362.5 (0%) max: 433 Points
3DMark - 3DMark Ice Storm Graphics
min: 29291 avg: 34138 median: 34675 (4%) max: 40515 Points
3DMark 11 - 3DM11 Performance Score
20106 Points (28%)
min: 435 avg: 543 median: 544 (1%) max: 688 Points
3DMark 11 - 3DM11 Performance GPU
27503 Points (24%)
min: 384 avg: 479.6 median: 484 (0%) max: 602 Points
3DMark Vantage + Intel HD Graphics (Haswell) 3DMark Vantage - 3DM Vant. Perf. total
min: 2146 avg: 2163 median: 2163 (1%) max: 2180 Points
3DM Vant. Perf. GPU no PhysX + Intel HD Graphics (Haswell) 3DMark Vantage - 3DM Vant. Perf. GPU no PhysX
min: 1848 avg: 1859 median: 1859 (1%) max: 1870 Points
3DMark 06 3DMark 06 - Standard 1280x1024 + NVIDIA GeForce GTX 1070 Ti (Desktop)
36475 Points (48%)
3DMark 06 - Standard 1280x1024 + Intel HD Graphics (Haswell)
min: 2917 avg: 3274 median: 3357.5 (4%) max: 3463 Points
Windows 7 Experience Index - Win7 Gaming graphics
6.3 Points (80%)
Windows 7 Experience Index - Win7 Graphics
4.7 Points (59%)
Cinebench R10 Cinebench R10 Shading (32bit) + Intel HD Graphics (Haswell) Cinebench R10 - Cinebench R10 Shading (32bit)
min: 3867 avg: 4235 median: 4215.5 (3%) max: 4642 Points
Cinebench R11.5 Cinebench R11.5 OpenGL 64 Bit + Intel HD Graphics (Haswell) Cinebench R11.5 - Cinebench R11.5 OpenGL 64 Bit
min: 9.38 avg: 11.4 median: 11.6 (4%) max: 12.78 fps
Cinebench R15 + Intel HD Graphics (Haswell) Cinebench R15 - Cinebench R15 OpenGL 64 Bit
min: 10.28 avg: 13.2 median: 13.9 (1%) max: 14.59 fps
Cinebench R15 OpenGL Ref. Match 64 Bit + Intel HD Graphics (Haswell) Cinebench R15 - Cinebench R15 OpenGL Ref. Match 64 Bit
98 % (98%)
GFXBench - GFXBench Car Chase Offscreen
11.6 fps (1%)
GFXBench 3.1 - GFXBench Manhattan ES 3.1 Offscreen
20.1 fps (0%)
GFXBench 3.0 - GFXBench 3.0 Manhattan Offscreen
28.7 fps (2%)
GFXBench (DX / GLBenchmark) 2.7 + Intel HD Graphics (Haswell) GFXBench (DX / GLBenchmark) 2.7 - GFXBench T-Rex HD Offscreen C24Z16
53.5 fps (0%)
LuxMark v2.0 64Bit - LuxMark v2.0 Room GPU
2542 Samples/s (11%)
min: 77 avg: 93 median: 93 (0%) max: 109 Samples/s
LuxMark v2.0 64Bit - LuxMark v2.0 Sala GPU
5159 Samples/s (9%)
min: 115 avg: 140 median: 140 (0%) max: 165 Samples/s
ComputeMark v2.1 - ComputeMark v2.1 Result
15488 Points (17%)
min: 355 avg: 370 median: 370 (0%) max: 385 Points
Power Consumption - Furmark Stress Test Power Consumption - external Monitor *
291 Watt (41%)
43.7 Watt (6%)
Power Consumption - The Witcher 3 Power Consumption - external Monitor *
290 Watt (41%)
30.5 Watt (4%)
Power Consumption - Witcher 3 ultra Power Efficiency - external Monitor
0.2 fps per Watt (21%)
Clock Speed - GPU Clock Witcher 3 ultra
1810 MHz (71%)
Clock Speed - GPU Clock Speed Furmark
1677 MHz (66%)
Average Benchmarks NVIDIA GeForce GTX 1070 Ti (Desktop) → 100% n=11 Average Benchmarks Intel HD Graphics (Haswell) → 4% n=11
- Range of benchmark values for this graphics card
- Average benchmark values for this graphics card
* Smaller numbers mean a higher performance
1 This benchmark is not used for the average calculation
Game Benchmarks The following benchmarks stem from our benchmarks of review laptops. The performance depends on the used graphics memory, clock rate, processor, system settings, drivers, and operating systems. So the results don't have to be representative for all laptops with this GPU. For detailed information on the benchmark results, click on the fps number.
100%
GeForce GTX 1070 Ti (Desktop):
200 [X] i7-7740X Asus X299 Prime Intel Core i7-7740X 4.3GHz
GeForce GTX 1070 Ti (Desktop)
min:
173 fps, max:
219 fps
fps
100%
GeForce GTX 1070 Ti (Desktop):
78 [X] i7-7740X Asus X299 Prime Intel Core i7-7740X 4.3GHz
GeForce GTX 1070 Ti (Desktop)
min:
68 fps, max:
88 fps
fps
100%
GeForce GTX 1070 Ti (Desktop):
58.5 [X] i7-7740X Asus X299 Prime Intel Core i7-7740X 4.3GHz
GeForce GTX 1070 Ti (Desktop)
min:
50 fps, max:
67 fps
fps
100%
GeForce GTX 1070 Ti (Desktop):
37.1 [X] i7-7740X Asus X299 Prime Intel Core i7-7740X 4.3GHz
GeForce GTX 1070 Ti (Desktop)
min:
31 fps, max:
43 fps
fps
100%
GeForce GTX 1070 Ti (Desktop):
17.9 [X] i7-7740X Asus X299 Prime Intel Core i7-7740X 4.3GHz
GeForce GTX 1070 Ti (Desktop)
min:
15 fps, max:
21 fps
fps
100%
GeForce GTX 1070 Ti (Desktop):
244 [X] i7-7740X Asus X299 Prime Intel Core i7-7740X 4.3GHz
GeForce GTX 1070 Ti (Desktop)
min:
195 fps, max:
269 fps
fps
100%
GeForce GTX 1070 Ti (Desktop):
183 [X] i7-7740X Asus X299 Prime Intel Core i7-7740X 4.3GHz
GeForce GTX 1070 Ti (Desktop)
min:
155 fps, max:
196 fps
fps
100%
GeForce GTX 1070 Ti (Desktop):
164 [X] i7-7740X Asus X299 Prime Intel Core i7-7740X 4.3GHz
GeForce GTX 1070 Ti (Desktop)
min:
145 fps, max:
176 fps
fps
100%
GeForce GTX 1070 Ti (Desktop):
120 [X] i7-7740X Asus X299 Prime Intel Core i7-7740X 4.3GHz
GeForce GTX 1070 Ti (Desktop)
min:
112 fps, max:
129 fps
fps
100%
GeForce GTX 1070 Ti (Desktop):
94 [X] i7-7740X Asus X299 Prime Intel Core i7-7740X 4.3GHz
GeForce GTX 1070 Ti (Desktop)
min:
86 fps, max:
98 fps
fps
100%
GeForce GTX 1070 Ti (Desktop):
57 [X] i7-7740X Asus X299 Prime Intel Core i7-7740X 4.3GHz
GeForce GTX 1070 Ti (Desktop)
min:
52 fps, max:
60 fps
fps
100%
GeForce GTX 1070 Ti (Desktop):
271 [X] i7-7740X Asus X299 Prime Intel Core i7-7740X 4.3GHz
GeForce GTX 1070 Ti (Desktop)
min:
209 fps, max:
313 fps
fps
100%
GeForce GTX 1070 Ti (Desktop):
249 [X] i7-7740X Asus X299 Prime Intel Core i7-7740X 4.3GHz
GeForce GTX 1070 Ti (Desktop)
min:
201 fps, max:
284 fps
fps
100%
GeForce GTX 1070 Ti (Desktop):
241 [X] i7-7740X Asus X299 Prime Intel Core i7-7740X 4.3GHz
GeForce GTX 1070 Ti (Desktop)
min:
189 fps, max:
269 fps
fps
100%
GeForce GTX 1070 Ti (Desktop):
219 [X] i7-7740X Asus X299 Prime Intel Core i7-7740X 4.3GHz
GeForce GTX 1070 Ti (Desktop)
min:
159 fps, max:
243 fps
fps
100%
GeForce GTX 1070 Ti (Desktop):
222 [X] i7-7740X Asus X299 Prime Intel Core i7-7740X 4.3GHz
GeForce GTX 1070 Ti (Desktop)
min:
176 fps, max:
250 fps
fps
100%
GeForce GTX 1070 Ti (Desktop):
221 [X] i7-7740X Asus X299 Prime Intel Core i7-7740X 4.3GHz
GeForce GTX 1070 Ti (Desktop)
min:
161 fps, max:
247 fps
fps
100%
GeForce GTX 1070 Ti (Desktop):
86.6 [X] i7-7740X Asus X299 Prime Intel Core i7-7740X 4.3GHz
GeForce GTX 1070 Ti (Desktop)
min:
71 fps, max:
102 fps
fps
100%
GeForce GTX 1070 Ti (Desktop):
63.4 [X] i7-7740X Asus X299 Prime Intel Core i7-7740X 4.3GHz
GeForce GTX 1070 Ti (Desktop)
min:
56 fps, max:
76 fps
fps
100%
GeForce GTX 1070 Ti (Desktop):
41.2 [X] i7-7740X Asus X299 Prime Intel Core i7-7740X 4.3GHz
GeForce GTX 1070 Ti (Desktop)
min:
36 fps, max:
47 fps
fps
100%
GeForce GTX 1070 Ti (Desktop):
20.3 [X] i7-7740X Asus X299 Prime Intel Core i7-7740X 4.3GHz
GeForce GTX 1070 Ti (Desktop)
min:
17 fps, max:
22 fps
fps
100%
GeForce GTX 1070 Ti (Desktop):
46 [X] i7-7740X Asus X299 Prime Intel Core i7-7740X 4.3GHz
GeForce GTX 1070 Ti (Desktop)
min:
39 fps, max:
54 fps
fps
100%
GeForce GTX 1070 Ti (Desktop):
40.4 [X] i7-7740X Asus X299 Prime Intel Core i7-7740X 4.3GHz
GeForce GTX 1070 Ti (Desktop)
min:
34 fps, max:
44 fps
fps
100%
GeForce GTX 1070 Ti (Desktop):
24.1 [X] i7-7740X Asus X299 Prime Intel Core i7-7740X 4.3GHz
GeForce GTX 1070 Ti (Desktop)
min:
22 fps, max:
26 fps
fps
100%
GeForce GTX 1070 Ti (Desktop):
121 [X] i7-7740X Asus X299 Prime Intel Core i7-7740X 4.3GHz
GeForce GTX 1070 Ti (Desktop)
min:
93 fps, max:
174 fps
fps
100%
GeForce GTX 1070 Ti (Desktop):
107 [X] i7-7740X Asus X299 Prime Intel Core i7-7740X 4.3GHz
GeForce GTX 1070 Ti (Desktop)
min:
83 fps, max:
140 fps
fps
100%
GeForce GTX 1070 Ti (Desktop):
103 [X] i7-7740X Asus X299 Prime Intel Core i7-7740X 4.3GHz
GeForce GTX 1070 Ti (Desktop)
min:
84 fps, max:
132 fps
fps
100%
GeForce GTX 1070 Ti (Desktop):
93 [X] i7-7740X Asus X299 Prime Intel Core i7-7740X 4.3GHz
GeForce GTX 1070 Ti (Desktop)
min:
72 fps, max:
127 fps
fps
100%
GeForce GTX 1070 Ti (Desktop):
76 [X] i7-7740X Asus X299 Prime Intel Core i7-7740X 4.3GHz
GeForce GTX 1070 Ti (Desktop)
min:
60 fps, max:
95 fps
fps
100%
GeForce GTX 1070 Ti (Desktop):
42 [X] i7-7740X Asus X299 Prime Intel Core i7-7740X 4.3GHz
GeForce GTX 1070 Ti (Desktop)
min:
34 fps, max:
51 fps
fps
100%
GeForce GTX 1070 Ti (Desktop):
147 [X] i7-7740X Asus X299 Prime Intel Core i7-7740X 4.3GHz
GeForce GTX 1070 Ti (Desktop)
min:
77.86 fps, max:
237.53 fps
fps
100%
GeForce GTX 1070 Ti (Desktop):
83 [X] i7-7740X Asus X299 Prime Intel Core i7-7740X 4.3GHz
GeForce GTX 1070 Ti (Desktop)
min:
40.8 fps, max:
146.74 fps
fps
100%
GeForce GTX 1070 Ti (Desktop):
63 [X] i7-7740X Asus X299 Prime Intel Core i7-7740X 4.3GHz
GeForce GTX 1070 Ti (Desktop)
min:
32.59 fps, max:
112.4 fps
fps
100%
GeForce GTX 1070 Ti (Desktop):
52.3 [X] i7-7740X Asus X299 Prime Intel Core i7-7740X 4.3GHz
GeForce GTX 1070 Ti (Desktop)
min:
28.83 fps, max:
88.2 fps
fps
100%
GeForce GTX 1070 Ti (Desktop):
40.2 [X] i7-7740X Asus X299 Prime Intel Core i7-7740X 4.3GHz
GeForce GTX 1070 Ti (Desktop)
min:
24.15 fps, max:
62.69 fps
fps
100%
GeForce GTX 1070 Ti (Desktop):
24.6 [X] i7-7740X Asus X299 Prime Intel Core i7-7740X 4.3GHz
GeForce GTX 1070 Ti (Desktop)
min:
16.12 fps, max:
36.5 fps
fps
100%
GeForce GTX 1070 Ti (Desktop):
144 [X] i7-7740X Asus X299 Prime Intel Core i7-7740X 4.3GHz
GeForce GTX 1070 Ti (Desktop)
min:
143 fps, max:
145 fps
fps
100%
GeForce GTX 1070 Ti (Desktop):
138 [X] i7-7740X Asus X299 Prime Intel Core i7-7740X 4.3GHz
GeForce GTX 1070 Ti (Desktop)
min:
128 fps, max:
145 fps
fps
100%
GeForce GTX 1070 Ti (Desktop):
123 [X] i7-7740X Asus X299 Prime Intel Core i7-7740X 4.3GHz
GeForce GTX 1070 Ti (Desktop)
min:
110 fps, max:
145 fps
fps
100%
GeForce GTX 1070 Ti (Desktop):
121 [X] i7-7740X Asus X299 Prime Intel Core i7-7740X 4.3GHz
GeForce GTX 1070 Ti (Desktop)
min:
109 fps, max:
145 fps
fps
100%
GeForce GTX 1070 Ti (Desktop):
81 [X] i7-7740X Asus X299 Prime Intel Core i7-7740X 4.3GHz
GeForce GTX 1070 Ti (Desktop)
min:
63 fps, max:
100 fps
fps
100%
GeForce GTX 1070 Ti (Desktop):
42.4 [X] i7-7740X Asus X299 Prime Intel Core i7-7740X 4.3GHz
GeForce GTX 1070 Ti (Desktop)
min:
37 fps, max:
52 fps
fps
100%
GeForce GTX 1070 Ti (Desktop):
88 [X] i7-7740X Asus X299 Prime Intel Core i7-7740X 4.3GHz
GeForce GTX 1070 Ti (Desktop)
min:
82 fps, max:
94 fps
fps
100%
GeForce GTX 1070 Ti (Desktop):
64 [X] i7-7740X Asus X299 Prime Intel Core i7-7740X 4.3GHz
GeForce GTX 1070 Ti (Desktop)
min:
58 fps, max:
68 fps
fps
100%
GeForce GTX 1070 Ti (Desktop):
35.3 [X] i7-7740X Asus X299 Prime Intel Core i7-7740X 4.3GHz
GeForce GTX 1070 Ti (Desktop)
min:
32 fps, max:
38 fps
fps
100%
GeForce GTX 1070 Ti (Desktop):
110 [X] i7-7740X Asus X299 Prime Intel Core i7-7740X 4.3GHz
GeForce GTX 1070 Ti (Desktop)
min:
84 fps, max:
125 fps
fps
100%
GeForce GTX 1070 Ti (Desktop):
74 [X] i7-7740X Asus X299 Prime Intel Core i7-7740X 4.3GHz
GeForce GTX 1070 Ti (Desktop)
min:
62 fps, max:
84 fps
fps
100%
GeForce GTX 1070 Ti (Desktop):
35.4 [X] i7-7740X Asus X299 Prime Intel Core i7-7740X 4.3GHz
GeForce GTX 1070 Ti (Desktop)
min:
27 fps, max:
41 fps
fps
100%
GeForce GTX 1070 Ti (Desktop):
111 [X] i7-7740X Asus X299 Prime Intel Core i7-7740X 4.3GHz
GeForce GTX 1070 Ti (Desktop)
min:
90 fps, max:
162 fps
fps
100%
GeForce GTX 1070 Ti (Desktop):
83 [X] i7-7740X Asus X299 Prime Intel Core i7-7740X 4.3GHz
GeForce GTX 1070 Ti (Desktop)
min:
67 fps, max:
124 fps
fps
100%
GeForce GTX 1070 Ti (Desktop):
47.1 [X] i7-7740X Asus X299 Prime Intel Core i7-7740X 4.3GHz
GeForce GTX 1070 Ti (Desktop)
min:
37 fps, max:
72 fps
fps
HD Graphics (Haswell):
0 (!) [X] MSI CX61 2QC 2970M MS-16GD Intel Celeron 2970M 2.2GHz
HD Graphics (Haswell)
fps
HD Graphics (Haswell):
4.9 (!) [X] MSI CX61 2QC 2970M MS-16GD Intel Celeron 2970M 2.2GHz
HD Graphics (Haswell)
min:
1 fps, max:
7 fps
fps
100%
GeForce GTX 1070 Ti (Desktop):
120 [X] i7-7740X Asus X299 Prime Intel Core i7-7740X 4.3GHz
GeForce GTX 1070 Ti (Desktop)
min:
94 fps, max:
156 fps
fps
100%
GeForce GTX 1070 Ti (Desktop):
80 [X] i7-7740X Asus X299 Prime Intel Core i7-7740X 4.3GHz
GeForce GTX 1070 Ti (Desktop)
min:
61 fps, max:
105 fps
fps
100%
GeForce GTX 1070 Ti (Desktop):
40.1 [X] i7-7740X Asus X299 Prime Intel Core i7-7740X 4.3GHz
GeForce GTX 1070 Ti (Desktop)
min:
28 fps, max:
53 fps
fps
100%
GeForce GTX 1070 Ti (Desktop):
63 [X] i7-7740X Asus X299 Prime Intel Core i7-7740X 4.3GHz
GeForce GTX 1070 Ti (Desktop)
min:
35 fps, max:
124 fps
fps
100%
GeForce GTX 1070 Ti (Desktop):
48 [X] i7-7740X Asus X299 Prime Intel Core i7-7740X 4.3GHz
GeForce GTX 1070 Ti (Desktop)
min:
24 fps, max:
81 fps
fps
100%
GeForce GTX 1070 Ti (Desktop):
27 [X] i7-7740X Asus X299 Prime Intel Core i7-7740X 4.3GHz
GeForce GTX 1070 Ti (Desktop)
min:
13 fps, max:
63 fps
fps
100%
GeForce GTX 1070 Ti (Desktop):
100 [X] i7-7740X Asus X299 Prime Intel Core i7-7740X 4.3GHz
GeForce GTX 1070 Ti (Desktop)
min:
87 fps, max:
129 fps
fps
100%
GeForce GTX 1070 Ti (Desktop):
81 [X] i7-7740X Asus X299 Prime Intel Core i7-7740X 4.3GHz
GeForce GTX 1070 Ti (Desktop)
min:
73 fps, max:
103 fps
fps
100%
GeForce GTX 1070 Ti (Desktop):
55 [X] i7-7740X Asus X299 Prime Intel Core i7-7740X 4.3GHz
GeForce GTX 1070 Ti (Desktop)
min:
49 fps, max:
68 fps
fps
100%
GeForce GTX 1070 Ti (Desktop):
267 [X] i7-7740X Asus X299 Prime Intel Core i7-7740X 4.3GHz
GeForce GTX 1070 Ti (Desktop)
min:
248 fps, max:
287 fps
fps
100%
GeForce GTX 1070 Ti (Desktop):
141 [X] i7-7740X Asus X299 Prime Intel Core i7-7740X 4.3GHz
GeForce GTX 1070 Ti (Desktop)
min:
114 fps, max:
165 fps
fps
100%
GeForce GTX 1070 Ti (Desktop):
84 [X] i7-7740X Asus X299 Prime Intel Core i7-7740X 4.3GHz
GeForce GTX 1070 Ti (Desktop)
min:
67 fps, max:
142 fps
fps
100%
GeForce GTX 1070 Ti (Desktop):
51 [X] i7-7740X Asus X299 Prime Intel Core i7-7740X 4.3GHz
GeForce GTX 1070 Ti (Desktop)
min:
46 fps, max:
87 fps
fps
100%
GeForce GTX 1070 Ti (Desktop):
28 [X] i7-7740X Asus X299 Prime Intel Core i7-7740X 4.3GHz
GeForce GTX 1070 Ti (Desktop)
min:
24 fps, max:
43 fps
fps
100%
GeForce GTX 1070 Ti (Desktop):
97 [X] i7-7740X Asus X299 Prime Intel Core i7-7740X 4.3GHz
GeForce GTX 1070 Ti (Desktop)
min:
85 fps, max:
102 fps
fps
100%
GeForce GTX 1070 Ti (Desktop):
78 [X] i7-7740X Asus X299 Prime Intel Core i7-7740X 4.3GHz
GeForce GTX 1070 Ti (Desktop)
min:
70 fps, max:
82 fps
fps
100%
GeForce GTX 1070 Ti (Desktop):
49 [X] i7-7740X Asus X299 Prime Intel Core i7-7740X 4.3GHz
GeForce GTX 1070 Ti (Desktop)
min:
44 fps, max:
51 fps
fps
100%
GeForce GTX 1070 Ti (Desktop):
78 [X] i7-7740X Asus X299 Prime Intel Core i7-7740X 4.3GHz
GeForce GTX 1070 Ti (Desktop)
min:
64 fps, max:
99 fps
fps
100%
GeForce GTX 1070 Ti (Desktop):
48.5 [X] i7-7740X Asus X299 Prime Intel Core i7-7740X 4.3GHz
GeForce GTX 1070 Ti (Desktop)
min:
41 fps, max:
59 fps
fps
100%
GeForce GTX 1070 Ti (Desktop):
23.8 [X] i7-7740X Asus X299 Prime Intel Core i7-7740X 4.3GHz
GeForce GTX 1070 Ti (Desktop)
min:
21 fps, max:
28 fps
fps
100%
GeForce GTX 1070 Ti (Desktop):
135 [X] i7-7740X Asus X299 Prime Intel Core i7-7740X 4.3GHz
GeForce GTX 1070 Ti (Desktop)
min:
111 fps, max:
171 fps
fps
100%
GeForce GTX 1070 Ti (Desktop):
114 [X] i7-7740X Asus X299 Prime Intel Core i7-7740X 4.3GHz
GeForce GTX 1070 Ti (Desktop)
min:
95 fps, max:
132 fps
fps
100%
GeForce GTX 1070 Ti (Desktop):
108 [X] i7-7740X Asus X299 Prime Intel Core i7-7740X 4.3GHz
GeForce GTX 1070 Ti (Desktop)
min:
95 fps, max:
122 fps
fps
100%
GeForce GTX 1070 Ti (Desktop):
102 [X] i7-7740X Asus X299 Prime Intel Core i7-7740X 4.3GHz
GeForce GTX 1070 Ti (Desktop)
min:
79 fps, max:
116 fps
fps
100%
GeForce GTX 1070 Ti (Desktop):
75 [X] i7-7740X Asus X299 Prime Intel Core i7-7740X 4.3GHz
GeForce GTX 1070 Ti (Desktop)
min:
67 fps, max:
85 fps
fps
100%
GeForce GTX 1070 Ti (Desktop):
39 [X] i7-7740X Asus X299 Prime Intel Core i7-7740X 4.3GHz
GeForce GTX 1070 Ti (Desktop)
min:
34 fps, max:
45 fps
fps
100%
GeForce GTX 1070 Ti (Desktop):
101 [X] Intel Core i7-4790K 4GHz
GeForce GTX 1070 Ti (Desktop)
fps
14%
HD Graphics (Haswell):
14.3 [X] MSI CX61 2QC 2970M MS-16GD Intel Celeron 2970M 2.2GHz
HD Graphics (Haswell)
fps
100%
GeForce GTX 1070 Ti (Desktop):
89 [X] Intel Core i7-4790K 4GHz
GeForce GTX 1070 Ti (Desktop)
fps
9%
HD Graphics (Haswell):
8 [X] MSI CX61 2QC 2970M MS-16GD Intel Celeron 2970M 2.2GHz
HD Graphics (Haswell)
fps
100%
GeForce GTX 1070 Ti (Desktop):
74.5 [X] Intel Core i7-4790K 4GHz
GeForce GTX 1070 Ti (Desktop)
fps
100%
GeForce GTX 1070 Ti (Desktop):
66.7 [X] Intel Core i7-4790K 4GHz
GeForce GTX 1070 Ti (Desktop)
fps
100%
GeForce GTX 1070 Ti (Desktop):
154 [X] Intel Core i7-4790K 4GHz
GeForce GTX 1070 Ti (Desktop)
min:
101 fps, max:
189 fps
fps
100%
GeForce GTX 1070 Ti (Desktop):
100 [X] Intel Core i7-4790K 4GHz
GeForce GTX 1070 Ti (Desktop)
min:
77 fps, max:
115 fps
fps
100%
GeForce GTX 1070 Ti (Desktop):
82 [X] Intel Core i7-4790K 4GHz
GeForce GTX 1070 Ti (Desktop)
min:
58 fps, max:
97 fps
fps
100%
GeForce GTX 1070 Ti (Desktop):
59.1 [X] Intel Core i7-4790K 4GHz
GeForce GTX 1070 Ti (Desktop)
min:
44 fps, max:
74 fps
fps
100%
GeForce GTX 1070 Ti (Desktop):
42.4 [X] Intel Core i7-4790K 4GHz
GeForce GTX 1070 Ti (Desktop)
min:
33 fps, max:
50 fps
fps
100%
GeForce GTX 1070 Ti (Desktop):
22.7 [X] Intel Core i7-4790K 4GHz
GeForce GTX 1070 Ti (Desktop)
min:
18 fps, max:
27 fps
fps
100%
GeForce GTX 1070 Ti (Desktop):
146 [X] Intel Core i7-4790K 4GHz
GeForce GTX 1070 Ti (Desktop)
min:
93 fps, max:
194 fps
fps
100%
GeForce GTX 1070 Ti (Desktop):
87 [X] Intel Core i7-4790K 4GHz
GeForce GTX 1070 Ti (Desktop)
min:
69 fps, max:
110 fps
fps
100%
GeForce GTX 1070 Ti (Desktop):
63 [X] Intel Core i7-4790K 4GHz
GeForce GTX 1070 Ti (Desktop)
max:
92 fps
fps
100%
GeForce GTX 1070 Ti (Desktop):
27.7 [X] Intel Core i7-4790K 4GHz
GeForce GTX 1070 Ti (Desktop)
max:
42 fps
fps
100%
GeForce GTX 1070 Ti (Desktop):
109 [X] Intel Core i7-4790K 4GHz
GeForce GTX 1070 Ti (Desktop)
min:
78 fps, max:
132 fps
fps
100%
GeForce GTX 1070 Ti (Desktop):
72 [X] Intel Core i7-4790K 4GHz
GeForce GTX 1070 Ti (Desktop)
min:
61 fps, max:
89 fps
fps
100%
GeForce GTX 1070 Ti (Desktop):
36 [X] Intel Core i7-4790K 4GHz
GeForce GTX 1070 Ti (Desktop)
min:
32 fps, max:
39 fps
fps
100%
GeForce GTX 1070 Ti (Desktop):
117 [X] Intel Core i7-4790K 4GHz
GeForce GTX 1070 Ti (Desktop)
min:
106 fps, max:
130 fps
fps
100%
GeForce GTX 1070 Ti (Desktop):
77 [X] Intel Core i7-4790K 4GHz
GeForce GTX 1070 Ti (Desktop)
min:
70 fps, max:
85 fps
fps
100%
GeForce GTX 1070 Ti (Desktop):
38 [X] Intel Core i7-4790K 4GHz
GeForce GTX 1070 Ti (Desktop)
min:
34 fps, max:
44 fps
fps
100%
GeForce GTX 1070 Ti (Desktop):
122 [X] Intel Core i7-4790K 4GHz
GeForce GTX 1070 Ti (Desktop)
min:
86 fps, max:
155 fps
fps
100%
GeForce GTX 1070 Ti (Desktop):
85 [X] Intel Core i7-4790K 4GHz
GeForce GTX 1070 Ti (Desktop)
min:
57 fps, max:
102 fps
fps
100%
GeForce GTX 1070 Ti (Desktop):
45 [X] Intel Core i7-4790K 4GHz
GeForce GTX 1070 Ti (Desktop)
min:
30 fps, max:
52 fps
fps
100%
GeForce GTX 1070 Ti (Desktop):
103 [X] Intel Core i7-4790K 4GHz
GeForce GTX 1070 Ti (Desktop)
min:
60 fps, max:
143 fps
fps
100%
GeForce GTX 1070 Ti (Desktop):
92 [X] Intel Core i7-4790K 4GHz
GeForce GTX 1070 Ti (Desktop)
min:
55 fps, max:
133 fps
fps
100%
GeForce GTX 1070 Ti (Desktop):
88 [X] Intel Core i7-4790K 4GHz
GeForce GTX 1070 Ti (Desktop)
min:
53 fps, max:
126 fps
fps
100%
GeForce GTX 1070 Ti (Desktop):
75 [X] Intel Core i7-4790K 4GHz
GeForce GTX 1070 Ti (Desktop)
min:
30 fps, max:
117 fps
fps
100%
GeForce GTX 1070 Ti (Desktop):
58 [X] Intel Core i7-4790K 4GHz
GeForce GTX 1070 Ti (Desktop)
min:
33 fps, max:
104 fps
fps
100%
GeForce GTX 1070 Ti (Desktop):
34 [X] Intel Core i7-4790K 4GHz
GeForce GTX 1070 Ti (Desktop)
min:
24 fps, max:
51 fps
fps
100%
GeForce GTX 1070 Ti (Desktop):
165 [X] Intel Core i7-4790K 4GHz
GeForce GTX 1070 Ti (Desktop)
min:
76 fps, max:
225 fps
fps
100%
GeForce GTX 1070 Ti (Desktop):
136 [X] Intel Core i7-4790K 4GHz
GeForce GTX 1070 Ti (Desktop)
min:
66 fps, max:
190 fps
fps
100%
GeForce GTX 1070 Ti (Desktop):
109 [X] Intel Core i7-4790K 4GHz
GeForce GTX 1070 Ti (Desktop)
min:
49 fps, max:
169 fps
fps
100%
GeForce GTX 1070 Ti (Desktop):
85 [X] Intel Core i7-4790K 4GHz
GeForce GTX 1070 Ti (Desktop)
min:
43 fps, max:
169 fps
fps
100%
GeForce GTX 1070 Ti (Desktop):
34 [X] Intel Core i7-4790K 4GHz
GeForce GTX 1070 Ti (Desktop)
min:
21 fps, max:
50 fps
fps
HD Graphics (Haswell):
5.9 [X] MSI CX61 2QC 2970M MS-16GD Intel Celeron 2970M 2.2GHz
HD Graphics (Haswell)
min:
5 fps, max:
7 fps
fps
100%
GeForce GTX 1070 Ti (Desktop):
47.1 [X] Intel Core i7-4790K 4GHz
GeForce GTX 1070 Ti (Desktop)
min:
44 fps, max:
51 fps
fps
100%
GeForce GTX 1070 Ti (Desktop):
17.3 [X] Intel Core i7-4790K 4GHz
GeForce GTX 1070 Ti (Desktop)
min:
16 fps, max:
18 fps
fps
HD Graphics (Haswell):
13 [X] MSI CX61 2QC 2970M MS-16GD Intel Celeron 2970M 2.2GHz
HD Graphics (Haswell)
min:
7 fps, max:
13 fps
fps
100%
GeForce GTX 1070 Ti (Desktop):
106 [X] Intel Core i7-4790K 4GHz
GeForce GTX 1070 Ti (Desktop)
min:
95 fps, max:
113 fps
fps
100%
GeForce GTX 1070 Ti (Desktop):
52 [X] Intel Core i7-4790K 4GHz
GeForce GTX 1070 Ti (Desktop)
min:
47 fps, max:
55 fps
fps
HD Graphics (Haswell):
62 [X] MSI CX61 2QC 2970M MS-16GD Intel Celeron 2970M 2.2GHz
HD Graphics (Haswell)
min:
54 fps
fps
HD Graphics (Haswell):
28.6 [X] MSI CX61 2QC 2970M MS-16GD Intel Celeron 2970M 2.2GHz
HD Graphics (Haswell)
min:
19 fps
fps
100%
GeForce GTX 1070 Ti (Desktop):
152 [X] Intel Core i7-4790K 4GHz
GeForce GTX 1070 Ti (Desktop)
min:
130 fps
fps
HD Graphics (Haswell):
16.4 [X] MSI CX61 2QC 2970M MS-16GD Intel Celeron 2970M 2.2GHz
HD Graphics (Haswell)
min:
14 fps, max:
19 fps
fps
100%
GeForce GTX 1070 Ti (Desktop):
57.9 [X] Intel Core i7-4790K 4GHz
GeForce GTX 1070 Ti (Desktop)
min:
51 fps, max:
69 fps
fps
HD Graphics (Haswell):
45.1 [X] MSI CX61 2QC 2970M MS-16GD Intel Celeron 2970M 2.2GHz
HD Graphics (Haswell)
min:
37 fps, max:
54 fps
fps
HD Graphics (Haswell):
15.9 [X] MSI CX61 2QC 2970M MS-16GD Intel Celeron 2970M 2.2GHz
HD Graphics (Haswell)
min:
13 fps, max:
19 fps
fps
100%
GeForce GTX 1070 Ti (Desktop):
223 [X] Intel Core i7-4790K 4GHz
GeForce GTX 1070 Ti (Desktop)
min:
176 fps, max:
252 fps
fps
100%
GeForce GTX 1070 Ti (Desktop):
92 [X] Intel Core i7-4790K 4GHz
GeForce GTX 1070 Ti (Desktop)
min:
76 fps, max:
133 fps
fps
HD Graphics (Haswell):
0 (!) [X] MSI CX61 2QC 2970M MS-16GD Intel Celeron 2970M 2.2GHz
HD Graphics (Haswell)
fps
100%
GeForce GTX 1070 Ti (Desktop):
54.2 [X] Intel Core i7-4790K 4GHz
GeForce GTX 1070 Ti (Desktop)
min:
47 fps, max:
62 fps
fps
100%
GeForce GTX 1070 Ti (Desktop):
35.8 [X] Intel Core i7-4790K 4GHz
GeForce GTX 1070 Ti (Desktop)
min:
27 fps, max:
40 fps
fps
100%
GeForce GTX 1070 Ti (Desktop):
156 [X] Intel Core i7-4790K 4GHz
GeForce GTX 1070 Ti (Desktop)
min:
92 fps, max:
189 fps
fps
100%
GeForce GTX 1070 Ti (Desktop):
122 [X] Intel Core i7-4790K 4GHz
GeForce GTX 1070 Ti (Desktop)
min:
75 fps, max:
163 fps
fps
100%
GeForce GTX 1070 Ti (Desktop):
47.9 [X] Intel Core i7-4790K 4GHz
GeForce GTX 1070 Ti (Desktop)
min:
39 fps, max:
60 fps
fps
HD Graphics (Haswell):
17.8 [X] MSI CX61 2QC 2970M MS-16GD Intel Celeron 2970M 2.2GHz
HD Graphics (Haswell)
min:
15 fps, max:
21 fps
fps
100%
GeForce GTX 1070 Ti (Desktop):
67.8 [X] Intel Core i7-4790K 4GHz
GeForce GTX 1070 Ti (Desktop)
min:
51 fps, max:
97 fps
fps
HD Graphics (Haswell):
38.6 [X] MSI CX61 2QC 2970M MS-16GD Intel Celeron 2970M 2.2GHz
HD Graphics (Haswell)
min:
35 fps, max:
52 fps
fps
HD Graphics (Haswell):
21.6 [X] MSI CX61 2QC 2970M MS-16GD Intel Celeron 2970M 2.2GHz
HD Graphics (Haswell)
min:
19 fps, max:
28 fps
fps
HD Graphics (Haswell):
6.3 [X] MSI CX61 2QC 2970M MS-16GD Intel Celeron 2970M 2.2GHz
HD Graphics (Haswell)
min:
5 fps, max:
8 fps
fps
100%
GeForce GTX 1070 Ti (Desktop):
80 [X] Intel Core i7-4790K 4GHz
GeForce GTX 1070 Ti (Desktop)
min:
79 fps, max:
81 fps
fps
HD Graphics (Haswell):
14.1 [X] MSI CX61 2QC 2970M MS-16GD Intel Celeron 2970M 2.2GHz
HD Graphics (Haswell)
min:
12 fps, max:
15 fps
fps
100%
GeForce GTX 1070 Ti (Desktop):
108 [X] Intel Core i7-4790K 4GHz
GeForce GTX 1070 Ti (Desktop)
min:
86 fps, max:
184 fps
fps
100%
GeForce GTX 1070 Ti (Desktop):
91 [X] Intel Core i7-4790K 4GHz
GeForce GTX 1070 Ti (Desktop)
min:
70 fps, max:
133 fps
fps
100%
GeForce GTX 1070 Ti (Desktop):
67.9 [X] DX11
Intel Core i7-4790K 4GHz
GeForce GTX 1070 Ti (Desktop)
min:
53 fps, max:
87 fps
fps
100%
GeForce GTX 1070 Ti (Desktop):
31.9 [X] DX11
Intel Core i7-4790K 4GHz
GeForce GTX 1070 Ti (Desktop)
min:
27 fps, max:
38 fps
fps
HD Graphics (Haswell):
12.4 [X] MSI CX61 2QC 2970M MS-16GD Intel Celeron 2970M 2.2GHz
HD Graphics (Haswell)
min:
11 fps, max:
14 fps
fps
HD Graphics (Haswell):
7.1 [X] MSI CX61 2QC 2970M MS-16GD Intel Celeron 2970M 2.2GHz
HD Graphics (Haswell)
min:
6 fps, max:
8 fps
fps
HD Graphics (Haswell):
26.1 [X] MSI CX61 2QC 2970M MS-16GD Intel Celeron 2970M 2.2GHz
HD Graphics (Haswell)
min:
19 fps, max:
33 fps
fps
HD Graphics (Haswell):
16.3 [X] MSI CX61 2QC 2970M MS-16GD Intel Celeron 2970M 2.2GHz
HD Graphics (Haswell)
min:
12 fps, max:
21 fps
fps
100%
GeForce GTX 1070 Ti (Desktop):
182 [X] Intel Core i7-4790K 4GHz
GeForce GTX 1070 Ti (Desktop)
min:
149 fps, max:
213 fps
fps
100%
GeForce GTX 1070 Ti (Desktop):
88.7 [X] Intel Core i7-4790K 4GHz
GeForce GTX 1070 Ti (Desktop)
min:
77 fps, max:
103 fps
fps
HD Graphics (Haswell):
0 (!) [X] MSI CX61 2QC 2970M MS-16GD Intel Celeron 2970M 2.2GHz
HD Graphics (Haswell)
fps
HD Graphics (Haswell):
6 [X] MSI CX61 2QC 2970M MS-16GD Intel Celeron 2970M 2.2GHz
HD Graphics (Haswell)
min:
3 fps, max:
9 fps
fps
HD Graphics (Haswell):
8.5 [X] MSI CX61 2QC 2970M MS-16GD Intel Celeron 2970M 2.2GHz
HD Graphics (Haswell)
min:
6 fps, max:
11 fps
fps
100%
GeForce GTX 1070 Ti (Desktop):
94.6 [X] Intel Core i7-4790K 4GHz
GeForce GTX 1070 Ti (Desktop)
min:
53 fps, max:
133 fps
fps
100%
GeForce GTX 1070 Ti (Desktop):
45.6 [X] Intel Core i7-4790K 4GHz
GeForce GTX 1070 Ti (Desktop)
min:
21 fps, max:
59 fps
fps
HD Graphics (Haswell):
9 [X] MSI CX61 2QC 2970M MS-16GD Intel Celeron 2970M 2.2GHz
HD Graphics (Haswell)
min:
8 fps, max:
11 fps
fps
100%
GeForce GTX 1070 Ti (Desktop):
98 [X] Intel Core i7-4790K 4GHz
GeForce GTX 1070 Ti (Desktop)
min:
80 fps, max:
113 fps
fps
100%
GeForce GTX 1070 Ti (Desktop):
41 [X] Intel Core i7-4790K 4GHz
GeForce GTX 1070 Ti (Desktop)
min:
39 fps, max:
45 fps
fps
HD Graphics (Haswell):
9.4 [X] MSI CX61 2QC 2970M MS-16GD Intel Celeron 2970M 2.2GHz
HD Graphics (Haswell)
min:
8 fps, max:
11 fps
fps
HD Graphics (Haswell):
5.3 [X] MSI CX61 2QC 2970M MS-16GD Intel Celeron 2970M 2.2GHz
HD Graphics (Haswell)
fps
HD Graphics (Haswell):
2.5 [X] MSI CX61 2QC 2970M MS-16GD Intel Celeron 2970M 2.2GHz
HD Graphics (Haswell)
fps
100%
GeForce GTX 1070 Ti (Desktop):
111 [X] DX11
Intel Core i7-4790K 4GHz
GeForce GTX 1070 Ti (Desktop)
min:
101 fps, max:
119 fps
fps
2%
HD Graphics (Haswell):
1.8 [X] MSI CX61 2QC 2970M MS-16GD Intel Celeron 2970M 2.2GHz
HD Graphics (Haswell)
fps
100%
GeForce GTX 1070 Ti (Desktop):
46.5 [X] DX11
Intel Core i7-4790K 4GHz
GeForce GTX 1070 Ti (Desktop)
min:
41 fps, max:
52 fps
fps
HD Graphics (Haswell):
13.7 [X] MSI CX61 2QC 2970M MS-16GD Intel Celeron 2970M 2.2GHz
HD Graphics (Haswell)
min:
5 fps, max:
75 fps
fps
HD Graphics (Haswell):
8.9 [X] MSI CX61 2QC 2970M MS-16GD Intel Celeron 2970M 2.2GHz
HD Graphics (Haswell)
min:
4 fps, max:
65 fps
fps
100%
GeForce GTX 1070 Ti (Desktop):
177 [X] Intel Core i7-4790K 4GHz
GeForce GTX 1070 Ti (Desktop)
min:
106 fps, max:
305 fps
fps
100%
GeForce GTX 1070 Ti (Desktop):
77 [X] Intel Core i7-4790K 4GHz
GeForce GTX 1070 Ti (Desktop)
min:
54 fps, max:
113 fps
fps
HD Graphics (Haswell):
11.7 [X] MSI CX61 2QC 2970M MS-16GD Intel Celeron 2970M 2.2GHz
HD Graphics (Haswell)
min:
10 fps, max:
14 fps
fps
HD Graphics (Haswell):
0 (!) [X] MSI CX61 2QC 2970M MS-16GD Intel Celeron 2970M 2.2GHz
HD Graphics (Haswell)
fps
HD Graphics (Haswell):
41.4 [X] MSI CX61 2QC 2970M MS-16GD Intel Celeron 2970M 2.2GHz
HD Graphics (Haswell)
min:
21 fps, max:
51 fps
fps
HD Graphics (Haswell):
24.1 [X] MSI CX61 2QC 2970M MS-16GD Intel Celeron 2970M 2.2GHz
HD Graphics (Haswell)
min:
11 fps, max:
35 fps
fps
HD Graphics (Haswell):
11.4 [X] MSI CX61 2QC 2970M MS-16GD Intel Celeron 2970M 2.2GHz
HD Graphics (Haswell)
min:
5 fps, max:
18 fps
fps
100%
GeForce GTX 1070 Ti (Desktop):
142.7 [X] Intel Core i7-4790K 4GHz
GeForce GTX 1070 Ti (Desktop)
min:
125.8 fps
fps
100%
GeForce GTX 1070 Ti (Desktop):
134.2 [X] Intel Core i7-4790K 4GHz
GeForce GTX 1070 Ti (Desktop)
min:
115.5 fps
fps
100%
GeForce GTX 1070 Ti (Desktop):
126.6 [X] Intel Core i7-4790K 4GHz
GeForce GTX 1070 Ti (Desktop)
min:
111.1 fps
fps
100%
GeForce GTX 1070 Ti (Desktop):
121.2 [X] Intel Core i7-4790K 4GHz
GeForce GTX 1070 Ti (Desktop)
min:
105.8 fps
fps
100%
GeForce GTX 1070 Ti (Desktop):
105 [X] Intel Core i7-4790K 4GHz
GeForce GTX 1070 Ti (Desktop)
min:
95 fps
fps
100%
GeForce GTX 1070 Ti (Desktop):
293 [X] Intel Core i7-4790K 4GHz
GeForce GTX 1070 Ti (Desktop)
min:
269 fps, max:
321 fps
fps
3%
HD Graphics (Haswell):
8.9 [X] MSI CX61 2QC 2970M MS-16GD Intel Celeron 2970M 2.2GHz
HD Graphics (Haswell)
min:
5 fps, max:
12 fps
fps
HD Graphics (Haswell):
5.2 [X] MSI CX61 2QC 2970M MS-16GD Intel Celeron 2970M 2.2GHz
HD Graphics (Haswell)
min:
3 fps, max:
8 fps
5.8 ~ 6 fps
HD Graphics (Haswell):
3.1 fps
100%
GeForce GTX 1070 Ti (Desktop):
71.8 [X] Intel Core i7-4790K 4GHz
GeForce GTX 1070 Ti (Desktop)
min:
61 fps, max:
80 fps
fps
100%
GeForce GTX 1070 Ti (Desktop):
47.1 [X] Intel Core i7-4790K 4GHz
GeForce GTX 1070 Ti (Desktop)
min:
42 fps, max:
51 fps
fps
HD Graphics (Haswell):
52.4 fps
HD Graphics (Haswell):
12.8 fps
100%
GeForce GTX 1070 Ti (Desktop):
67 [X] i7-7740X Asus X299 Prime Intel Core i7-7740X 4.3GHz
GeForce GTX 1070 Ti (Desktop)
min:
11.7 fps, P1:
27 fps, max:
202 fps
fps
HD Graphics (Haswell):
15.9 fps
HD Graphics (Haswell):
11.2 fps
HD Graphics (Haswell):
7.7 fps
HD Graphics (Haswell):
5.7 fps
HD Graphics (Haswell):
9.7 fps
HD Graphics (Haswell):
8.4 fps
HD Graphics (Haswell):
10.9 fps
HD Graphics (Haswell):
7 fps
HD Graphics (Haswell):
31 fps
HD Graphics (Haswell):
20 fps
HD Graphics (Haswell):
9 fps
HD Graphics (Haswell):
5.8 fps
HD Graphics (Haswell):
21.6 fps
HD Graphics (Haswell):
12.9 fps
HD Graphics (Haswell):
13.5 fps
HD Graphics (Haswell):
8.3 fps
HD Graphics (Haswell):
16.4 fps
HD Graphics (Haswell):
11.3 fps
HD Graphics (Haswell):
123.6 fps
HD Graphics (Haswell):
26.2 fps
HD Graphics (Haswell):
13.3 fps
HD Graphics (Haswell):
9.7 fps
HD Graphics (Haswell):
58.2 fps
HD Graphics (Haswell):
19.6 fps
HD Graphics (Haswell):
2.2 fps
HD Graphics (Haswell):
19.9 fps
HD Graphics (Haswell):
14 fps
HD Graphics (Haswell):
35.2 fps
HD Graphics (Haswell):
13.6 fps
HD Graphics (Haswell):
9 fps
HD Graphics (Haswell):
23.1 fps
HD Graphics (Haswell):
13.7 fps
HD Graphics (Haswell):
10.1 fps
HD Graphics (Haswell):
5.7 fps
HD Graphics (Haswell):
22.1 fps
HD Graphics (Haswell):
13 fps
HD Graphics (Haswell):
11.1 fps
HD Graphics (Haswell):
12.8 27.8 [X] MSI CX61 2QC 2970M MS-16GD Intel Celeron 2970M 2.2GHz
HD Graphics (Haswell)
~ 20 fps
HD Graphics (Haswell):
10 18.2 [X] MSI CX61 2QC 2970M MS-16GD Intel Celeron 2970M 2.2GHz
HD Graphics (Haswell)
~ 14 fps
HD Graphics (Haswell):
11.8 [X] MSI CX61 2QC 2970M MS-16GD Intel Celeron 2970M 2.2GHz
HD Graphics (Haswell)
fps
HD Graphics (Haswell):
3.9 [X] MSI CX61 2QC 2970M MS-16GD Intel Celeron 2970M 2.2GHz
HD Graphics (Haswell)
fps
HD Graphics (Haswell):
21 fps
HD Graphics (Haswell):
12 fps
HD Graphics (Haswell):
27 fps
HD Graphics (Haswell):
18 fps
HD Graphics (Haswell):
14 fps
HD Graphics (Haswell):
57.7 fps
HD Graphics (Haswell):
37 fps
HD Graphics (Haswell):
22.4 fps
HD Graphics (Haswell):
16.9 fps
HD Graphics (Haswell):
14 fps
HD Graphics (Haswell):
7.8 fps
HD Graphics (Haswell):
15.9 fps
HD Graphics (Haswell):
8.9 fps
HD Graphics (Haswell):
14.2 fps
HD Graphics (Haswell):
11.5 fps
HD Graphics (Haswell):
36.9 fps
HD Graphics (Haswell):
24.2 fps
HD Graphics (Haswell):
7.2 fps
HD Graphics (Haswell):
38 38.5 ~ 38 fps
HD Graphics (Haswell):
18.6 19.6 ~ 19 fps
HD Graphics (Haswell):
13.2 fps
HD Graphics (Haswell):
11.2 fps
HD Graphics (Haswell):
23 32.8 [X] MSI CX61 2QC 2970M MS-16GD Intel Celeron 2970M 2.2GHz
HD Graphics (Haswell)
~ 28 fps
HD Graphics (Haswell):
10.3 14.2 [X] MSI CX61 2QC 2970M MS-16GD Intel Celeron 2970M 2.2GHz
HD Graphics (Haswell)
~ 12 fps
HD Graphics (Haswell):
11.9 [X] MSI CX61 2QC 2970M MS-16GD Intel Celeron 2970M 2.2GHz
HD Graphics (Haswell)
fps
100%
GeForce GTX 1070 Ti (Desktop):
132 [X] Intel Core i7-4790K 4GHz
GeForce GTX 1070 Ti (Desktop)
min:
58 fps, max:
235 fps
fps
3%
HD Graphics (Haswell):
3.7 [X] MSI CX61 2QC 2970M MS-16GD Intel Celeron 2970M 2.2GHz
HD Graphics (Haswell)
fps
HD Graphics (Haswell):
96.5 fps
HD Graphics (Haswell):
28.3 fps
HD Graphics (Haswell):
15 fps
HD Graphics (Haswell):
59.6 fps
HD Graphics (Haswell):
11.2 fps
HD Graphics (Haswell):
12.2 fps
HD Graphics (Haswell):
7.6 fps
HD Graphics (Haswell):
38.7 fps
HD Graphics (Haswell):
17.7 fps
HD Graphics (Haswell):
13.1 fps
HD Graphics (Haswell):
18.7 fps
HD Graphics (Haswell):
11.4 fps
HD Graphics (Haswell):
12.3 fps
HD Graphics (Haswell):
9.9 fps
HD Graphics (Haswell):
25.6 fps
HD Graphics (Haswell):
17.6 fps
HD Graphics (Haswell):
22.3 fps
HD Graphics (Haswell):
16.8 fps
HD Graphics (Haswell):
46.2 fps
HD Graphics (Haswell):
34.7 fps
HD Graphics (Haswell):
22.5 fps
HD Graphics (Haswell):
31 fps
HD Graphics (Haswell):
18.8 fps
HD Graphics (Haswell):
11.7 fps
HD Graphics (Haswell):
36.9 fps
HD Graphics (Haswell):
23 fps
HD Graphics (Haswell):
19.5 fps
HD Graphics (Haswell):
12.5 fps
HD Graphics (Haswell):
36 fps
HD Graphics (Haswell):
16 fps
HD Graphics (Haswell):
9.8 fps
HD Graphics (Haswell):
21.7 22.2 ~ 22 fps
HD Graphics (Haswell):
11.2 11.3 ~ 11 fps
HD Graphics (Haswell):
6.8 fps
HD Graphics (Haswell):
36.8 fps
HD Graphics (Haswell):
16.7 fps
HD Graphics (Haswell):
51.9 fps
HD Graphics (Haswell):
27.4 fps
HD Graphics (Haswell):
14.8 fps
HD Graphics (Haswell):
49.2 fps
HD Graphics (Haswell):
28 fps
HD Graphics (Haswell):
21.2 fps
HD Graphics (Haswell):
42.6 fps
HD Graphics (Haswell):
17.8 fps
HD Graphics (Haswell):
113 fps
HD Graphics (Haswell):
45.1 fps
HD Graphics (Haswell):
93.7 fps
HD Graphics (Haswell):
39.2 fps
Average Gaming NVIDIA GeForce GTX 1070 Ti (Desktop) → 100% Average Gaming 30-70 fps → 100%
Average Gaming Intel HD Graphics (Haswell) → 6% For more games that might be playable and a list of all games and graphics cards visit our Gaming List
v1.28
log 02. 19:02:17
#0 checking url part for id 8258 +0s ... 0s
#1 checking url part for id 4622 +0s ... 0s
#2 redirected to Ajax server, took 1719939736 +0s ... 0s
#3 did not recreate cache, as it is less than 5 days old! Created at Mon, 01 Jul 2024 05:16:07 +0200 +0s ... 0s
#4 composed specs +0.029s ... 0.029s
#5 did output specs +0s ... 0.029s
#6 start showIntegratedCPUs +0s ... 0.029s
#7 getting avg benchmarks for device 8258 +0.01s ... 0.039s
#8 got single benchmarks 8258 +0s ... 0.039s
#9 getting avg benchmarks for device 4622 +0.004s ... 0.043s
#10 got single benchmarks 4622 +0.015s ... 0.058s
#11 got avg benchmarks for devices +0s ... 0.058s
#12 min, max, avg, median took s +0.019s ... 0.077s
#13 before gaming benchmark output +0s ... 0.077s
#14 Got 329 rows for game benchmarks. +0.009s ... 0.086s
#15 composed SQL query for gamebenchmarks +0s ... 0.086s
#16 got data and put it in $dataArray +0.005s ... 0.091s
#17 benchmarks composed for output. +0.032s ... 0.123s
#18 calculated avg scores. +0s ... 0.123s
#19 return log +0.002s ... 0.125s
Please share our article, every link counts!
Redaktion, 2017-09- 8 (Update: 2023-07- 1)
 Deutsch
 English
 Español
 Français
 Italiano
 Nederlands
 Polski
 Português
 Русский
 Türkçe
 Svenska
 Chinese
 Magyar