NVIDIA GeForce GTX 1070 Ti (Desktop) vs Intel HD Graphics 4200
NVIDIA GeForce GTX 1070 Ti (Desktop) ► remove from comparison
The Nvidia GeForce GTX 1070 Ti is the second fastest Pascal based graphics card in November 2017. It is a high-end desktop graphics card based on a cut down GP104 chip as the GTX 1080 and manufactured in 16 nm FinFET at TSMC. Compared to the GTX 1080, it uses the more available GDDR5 graphics memory, and compared to the GTX 1070 it offers more shaders (2432 versus 1920). More details on the Pascal architecture including all features and comparisons to Maxwell, can be found here .
The performance of the GTX 1070 Ti was in our tests right between the GTX 1070 and GTX 1080. However, the powerefficiency was worse than the GTX 1070 and near the GTX 1080. Nvidia also specifies the 1070 Ti and 1080 at 180W.
Intel HD Graphics 4200 ► remove from comparison
The Intel HD Graphics 4200 (GT2) is a processor graphics card that is included in some of the ULV Haswell processors of 2013 (4th generation core). The relatively low base clock can be automatically overclocked using Turbo Boost technology.
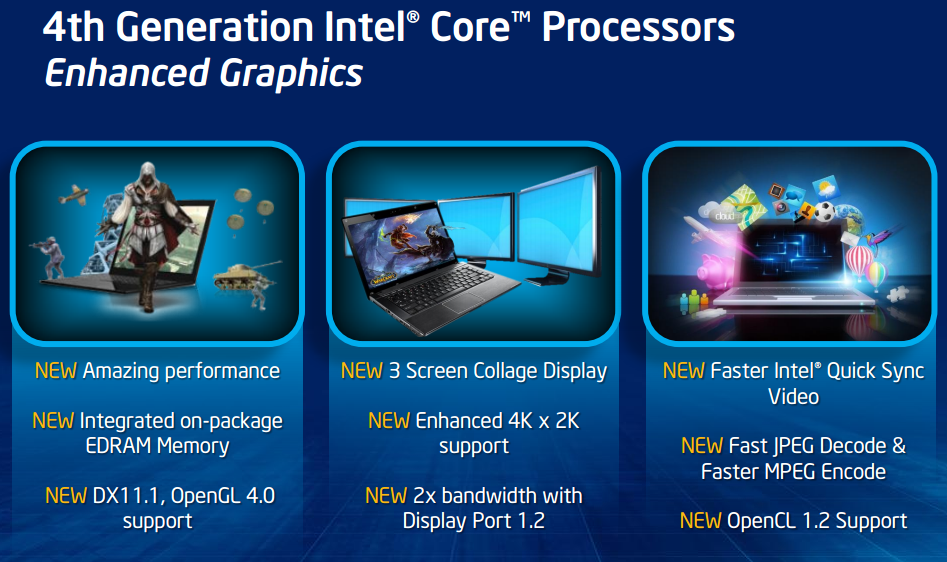
In comparison to the HD 4000, the graphics core has been modified in several details. The GPU supports DirectX 11.1, OpenCL 1.2 und OpenGL 4.0. It also features an improved decoder for 4K videos and the fast Quick Sync encoder.
The performance of the HD Graphics 4200 is clearly below the HD 4600 and HD 4400 , since the GPU is designed for ULV models of the Y-series (11.5 W). Therefore, the clock rates are relatively low. Compared to a similar clocked HD 4000 , the HD 4200 is somewhat faster due to architectural improvements and an increased number of execution units: The GT2 version integrates 20 EUs, compared to 16 EUs for the old HD 4000.
In simple games like Anno 2070 or Counter Strike: Global Offensive, the performance is sufficient to handle low settings and 1024 x 768 pixels. Many current titles like Battlefield 4, however, are not playable even at minimum graphic quality. Detailed benchmarks can be found below.
Due to the 22nm 3D Tri-Gate production process, the power consumption is relatively low and suitable even for tablets. In addition to the TDP of 11.5 watts, the Y-series CPUs are rated at an SDP (average power consumption) of 4.5 or 6 watts (depending on the model).
NVIDIA GeForce GTX 1070 Ti (Desktop) Intel HD Graphics 4200 HD Graphics Series Codename Pascal GP104 Haswell GT2 Architecture Pascal Gen. 7.5 Haswell Pipelines 2432 - unified 20 - unified Core Speed 1607 - 1683 (Boost) MHz 200 - 850 (Boost) MHz Memory Speed 8000 MHz Memory Bus Width 256 Bit 64/128 Bit Memory Type GDDR5 Max. Amount of Memory 8 GB Shared Memory no yes API DirectX 12_1, OpenGL 4.5 DirectX 11.1, Shader 5.0, OpenGL 4.0 Power Consumption 180 Watt Transistors 7.2 Billion technology 16 nm 22 nm Features Multi-Projection, VR Ready, G-SYNC, Vulkan, Multi Monitor QuickSync Date of Announcement 02.11.2017 05.06.2013 Link to Manufacturer Page www.nvidia.at
CPU in HD Graphics 4200 GPU Base Speed GPU Boost / Turbo Intel Core i7-4610Y 2 x 1700 MHz, 11.5 W 200 MHz 850 MHz Intel Core i5-4300Y 2 x 1600 MHz, 11.5 W 200 MHz 850 MHz Intel Core i5-4302Y 2 x 1600 MHz, 11.5 W 200 MHz 850 MHz » show 8 more Intel Core i5-4202Y 2 x 1600 MHz, 11.5 W 200 MHz 850 MHz Intel Core i5-4220Y 2 x 1600 MHz, 11.5 W 200 MHz 850 MHz Intel Core i5-4210Y 2 x 1500 MHz, 11.5 W 200 MHz 850 MHz Intel Core i5-4200Y 2 x 1400 MHz, 11.5 W 200 MHz 850 MHz Intel Core i3-4030Y 2 x 1600 MHz, 11.5 W 200 MHz 850 MHz Intel Core i3-4020Y 2 x 1500 MHz, 11.5 W 200 MHz 850 MHz Intel Core i3-4012Y 2 x 1500 MHz, 11.5 W 200 MHz 850 MHz Intel Core i3-4010Y 2 x 1300 MHz, 11.5 W 200 MHz 850 MHz min. - max. 200 MHz 850 MHz
Benchmarks Performance Rating - 3DMark 11 + Fire Strike + Time Spy - HD Graphics 4200
0.2 pt (1%)
...
...
3DMark - 3DMark Time Spy Score
6177 Points (18%)
3DMark - 3DMark Time Spy Graphics
6531 Points (17%)
3DMark - 3DMark Ice Storm Unlimited Graphics
442105 Points (50%)
41579 Points (5%)
3DMark - 3DMark Cloud Gate Score
29364 Points (31%)
min: 1716 avg: 2853 median: 3027 (3%) max: 3754 Points
3DMark - 3DMark Cloud Gate Graphics
88161 Points (23%)
min: 2101 avg: 3793 median: 3807 (1%) max: 5239 Points
3DMark - 3DMark Fire Strike Standard Score
15061 Points (27%)
min: 199 avg: 369.6 median: 394.5 (1%) max: 512 Points
3DMark - 3DMark Fire Strike Standard Graphics
18405 Points (21%)
min: 218 avg: 410.6 median: 431.5 (0%) max: 578 Points
3DMark - 3DMark Ice Storm Graphics
min: 17834 avg: 32317 median: 34087 (4%) max: 46175 Points
3DMark 11 - 3DM11 Performance Score
20106 Points (28%)
min: 367 avg: 660 median: 712 (1%) max: 828 Points
3DMark 11 - 3DM11 Performance GPU
27503 Points (24%)
min: 329 avg: 624 median: 638 (1%) max: 1060 Points
3DMark Vantage + Intel HD Graphics 4200 3DMark Vantage - 3DM Vant. Perf. total
min: 2165 avg: 2538 median: 2537.5 (1%) max: 2910 Points
3DM Vant. Perf. GPU no PhysX + Intel HD Graphics 4200 3DMark Vantage - 3DM Vant. Perf. GPU no PhysX
min: 1678 avg: 1985 median: 1807 (1%) max: 2471 Points
3DMark 06 3DMark 06 - Standard 1280x1024 + NVIDIA GeForce GTX 1070 Ti (Desktop)
36475 Points (48%)
3DMark 06 - Standard 1280x1024 + Intel HD Graphics 4200
min: 2060 avg: 3529 median: 3383 (4%) max: 5020 Points
Cinebench R10 Cinebench R10 Shading (32bit) + Intel HD Graphics 4200 Cinebench R10 - Cinebench R10 Shading (32bit)
min: 1991 avg: 4602 median: 4514 (3%) max: 6367 Points
Cinebench R11.5 Cinebench R11.5 OpenGL 64 Bit + Intel HD Graphics 4200 Cinebench R11.5 - Cinebench R11.5 OpenGL 64 Bit
min: 7.65 avg: 14.1 median: 14.9 (5%) max: 19.67 fps
Cinebench R15 + Intel HD Graphics 4200 Cinebench R15 - Cinebench R15 OpenGL 64 Bit
min: 8.82 avg: 15.6 median: 17 (1%) max: 19.99 fps
Cinebench R15 OpenGL Ref. Match 64 Bit + Intel HD Graphics 4200 Cinebench R15 - Cinebench R15 OpenGL Ref. Match 64 Bit
min: 63.3 avg: 87.8 median: 98 (98%) max: 99.6 %
GFXBench (DX / GLBenchmark) 2.7 + Intel HD Graphics 4200 GFXBench (DX / GLBenchmark) 2.7 - GFXBench T-Rex HD Offscreen C24Z16
min: 21 avg: 35.8 median: 37.5 (0%) max: 47 fps
LuxMark v2.0 64Bit - LuxMark v2.0 Room GPU
2542 Samples/s (11%)
min: 102 avg: 113.5 median: 113.5 (1%) max: 125 Samples/s
LuxMark v2.0 64Bit - LuxMark v2.0 Sala GPU
5159 Samples/s (9%)
min: 162 avg: 176.5 median: 176.5 (0%) max: 191 Samples/s
ComputeMark v2.1 - ComputeMark v2.1 Result
15488 Points (17%)
min: 469 avg: 486 median: 486 (1%) max: 503 Points
Power Consumption - Furmark Stress Test Power Consumption - external Monitor *
291 Watt (41%)
Power Consumption - The Witcher 3 Power Consumption - external Monitor *
290 Watt (41%)
Power Consumption - Witcher 3 ultra Power Efficiency - external Monitor
0.2 fps per Watt (21%)
Clock Speed - GPU Clock Witcher 3 ultra
1810 MHz (71%)
Clock Speed - GPU Clock Speed Furmark
1677 MHz (66%)
Average Benchmarks NVIDIA GeForce GTX 1070 Ti (Desktop) → 100% n=11 Average Benchmarks Intel HD Graphics 4200 → 5% n=11
- Range of benchmark values for this graphics card
- Average benchmark values for this graphics card
* Smaller numbers mean a higher performance
1 This benchmark is not used for the average calculation
Game Benchmarks The following benchmarks stem from our benchmarks of review laptops. The performance depends on the used graphics memory, clock rate, processor, system settings, drivers, and operating systems. So the results don't have to be representative for all laptops with this GPU. For detailed information on the benchmark results, click on the fps number.
100%
GeForce GTX 1070 Ti (Desktop):
200 [X] i7-7740X Asus X299 Prime Intel Core i7-7740X 4.3GHz
GeForce GTX 1070 Ti (Desktop)
min:
173 fps, max:
219 fps
fps
100%
GeForce GTX 1070 Ti (Desktop):
78 [X] i7-7740X Asus X299 Prime Intel Core i7-7740X 4.3GHz
GeForce GTX 1070 Ti (Desktop)
min:
68 fps, max:
88 fps
fps
100%
GeForce GTX 1070 Ti (Desktop):
58.5 [X] i7-7740X Asus X299 Prime Intel Core i7-7740X 4.3GHz
GeForce GTX 1070 Ti (Desktop)
min:
50 fps, max:
67 fps
fps
100%
GeForce GTX 1070 Ti (Desktop):
37.1 [X] i7-7740X Asus X299 Prime Intel Core i7-7740X 4.3GHz
GeForce GTX 1070 Ti (Desktop)
min:
31 fps, max:
43 fps
fps
100%
GeForce GTX 1070 Ti (Desktop):
17.9 [X] i7-7740X Asus X299 Prime Intel Core i7-7740X 4.3GHz
GeForce GTX 1070 Ti (Desktop)
min:
15 fps, max:
21 fps
fps
100%
GeForce GTX 1070 Ti (Desktop):
244 [X] i7-7740X Asus X299 Prime Intel Core i7-7740X 4.3GHz
GeForce GTX 1070 Ti (Desktop)
min:
195 fps, max:
269 fps
fps
100%
GeForce GTX 1070 Ti (Desktop):
183 [X] i7-7740X Asus X299 Prime Intel Core i7-7740X 4.3GHz
GeForce GTX 1070 Ti (Desktop)
min:
155 fps, max:
196 fps
fps
100%
GeForce GTX 1070 Ti (Desktop):
164 [X] i7-7740X Asus X299 Prime Intel Core i7-7740X 4.3GHz
GeForce GTX 1070 Ti (Desktop)
min:
145 fps, max:
176 fps
fps
100%
GeForce GTX 1070 Ti (Desktop):
120 [X] i7-7740X Asus X299 Prime Intel Core i7-7740X 4.3GHz
GeForce GTX 1070 Ti (Desktop)
min:
112 fps, max:
129 fps
fps
100%
GeForce GTX 1070 Ti (Desktop):
94 [X] i7-7740X Asus X299 Prime Intel Core i7-7740X 4.3GHz
GeForce GTX 1070 Ti (Desktop)
min:
86 fps, max:
98 fps
fps
100%
GeForce GTX 1070 Ti (Desktop):
57 [X] i7-7740X Asus X299 Prime Intel Core i7-7740X 4.3GHz
GeForce GTX 1070 Ti (Desktop)
min:
52 fps, max:
60 fps
fps
100%
GeForce GTX 1070 Ti (Desktop):
271 [X] i7-7740X Asus X299 Prime Intel Core i7-7740X 4.3GHz
GeForce GTX 1070 Ti (Desktop)
min:
209 fps, max:
313 fps
fps
100%
GeForce GTX 1070 Ti (Desktop):
249 [X] i7-7740X Asus X299 Prime Intel Core i7-7740X 4.3GHz
GeForce GTX 1070 Ti (Desktop)
min:
201 fps, max:
284 fps
fps
100%
GeForce GTX 1070 Ti (Desktop):
241 [X] i7-7740X Asus X299 Prime Intel Core i7-7740X 4.3GHz
GeForce GTX 1070 Ti (Desktop)
min:
189 fps, max:
269 fps
fps
100%
GeForce GTX 1070 Ti (Desktop):
219 [X] i7-7740X Asus X299 Prime Intel Core i7-7740X 4.3GHz
GeForce GTX 1070 Ti (Desktop)
min:
159 fps, max:
243 fps
fps
100%
GeForce GTX 1070 Ti (Desktop):
222 [X] i7-7740X Asus X299 Prime Intel Core i7-7740X 4.3GHz
GeForce GTX 1070 Ti (Desktop)
min:
176 fps, max:
250 fps
fps
100%
GeForce GTX 1070 Ti (Desktop):
221 [X] i7-7740X Asus X299 Prime Intel Core i7-7740X 4.3GHz
GeForce GTX 1070 Ti (Desktop)
min:
161 fps, max:
247 fps
fps
100%
GeForce GTX 1070 Ti (Desktop):
86.6 [X] i7-7740X Asus X299 Prime Intel Core i7-7740X 4.3GHz
GeForce GTX 1070 Ti (Desktop)
min:
71 fps, max:
102 fps
fps
100%
GeForce GTX 1070 Ti (Desktop):
63.4 [X] i7-7740X Asus X299 Prime Intel Core i7-7740X 4.3GHz
GeForce GTX 1070 Ti (Desktop)
min:
56 fps, max:
76 fps
fps
100%
GeForce GTX 1070 Ti (Desktop):
41.2 [X] i7-7740X Asus X299 Prime Intel Core i7-7740X 4.3GHz
GeForce GTX 1070 Ti (Desktop)
min:
36 fps, max:
47 fps
fps
100%
GeForce GTX 1070 Ti (Desktop):
20.3 [X] i7-7740X Asus X299 Prime Intel Core i7-7740X 4.3GHz
GeForce GTX 1070 Ti (Desktop)
min:
17 fps, max:
22 fps
fps
100%
GeForce GTX 1070 Ti (Desktop):
46 [X] i7-7740X Asus X299 Prime Intel Core i7-7740X 4.3GHz
GeForce GTX 1070 Ti (Desktop)
min:
39 fps, max:
54 fps
fps
100%
GeForce GTX 1070 Ti (Desktop):
40.4 [X] i7-7740X Asus X299 Prime Intel Core i7-7740X 4.3GHz
GeForce GTX 1070 Ti (Desktop)
min:
34 fps, max:
44 fps
fps
100%
GeForce GTX 1070 Ti (Desktop):
24.1 [X] i7-7740X Asus X299 Prime Intel Core i7-7740X 4.3GHz
GeForce GTX 1070 Ti (Desktop)
min:
22 fps, max:
26 fps
fps
100%
GeForce GTX 1070 Ti (Desktop):
121 [X] i7-7740X Asus X299 Prime Intel Core i7-7740X 4.3GHz
GeForce GTX 1070 Ti (Desktop)
min:
93 fps, max:
174 fps
fps
100%
GeForce GTX 1070 Ti (Desktop):
107 [X] i7-7740X Asus X299 Prime Intel Core i7-7740X 4.3GHz
GeForce GTX 1070 Ti (Desktop)
min:
83 fps, max:
140 fps
fps
100%
GeForce GTX 1070 Ti (Desktop):
103 [X] i7-7740X Asus X299 Prime Intel Core i7-7740X 4.3GHz
GeForce GTX 1070 Ti (Desktop)
min:
84 fps, max:
132 fps
fps
100%
GeForce GTX 1070 Ti (Desktop):
93 [X] i7-7740X Asus X299 Prime Intel Core i7-7740X 4.3GHz
GeForce GTX 1070 Ti (Desktop)
min:
72 fps, max:
127 fps
fps
100%
GeForce GTX 1070 Ti (Desktop):
76 [X] i7-7740X Asus X299 Prime Intel Core i7-7740X 4.3GHz
GeForce GTX 1070 Ti (Desktop)
min:
60 fps, max:
95 fps
fps
100%
GeForce GTX 1070 Ti (Desktop):
42 [X] i7-7740X Asus X299 Prime Intel Core i7-7740X 4.3GHz
GeForce GTX 1070 Ti (Desktop)
min:
34 fps, max:
51 fps
fps
100%
GeForce GTX 1070 Ti (Desktop):
147 [X] i7-7740X Asus X299 Prime Intel Core i7-7740X 4.3GHz
GeForce GTX 1070 Ti (Desktop)
min:
77.86 fps, max:
237.53 fps
fps
100%
GeForce GTX 1070 Ti (Desktop):
83 [X] i7-7740X Asus X299 Prime Intel Core i7-7740X 4.3GHz
GeForce GTX 1070 Ti (Desktop)
min:
40.8 fps, max:
146.74 fps
fps
100%
GeForce GTX 1070 Ti (Desktop):
63 [X] i7-7740X Asus X299 Prime Intel Core i7-7740X 4.3GHz
GeForce GTX 1070 Ti (Desktop)
min:
32.59 fps, max:
112.4 fps
fps
100%
GeForce GTX 1070 Ti (Desktop):
52.3 [X] i7-7740X Asus X299 Prime Intel Core i7-7740X 4.3GHz
GeForce GTX 1070 Ti (Desktop)
min:
28.83 fps, max:
88.2 fps
fps
100%
GeForce GTX 1070 Ti (Desktop):
40.2 [X] i7-7740X Asus X299 Prime Intel Core i7-7740X 4.3GHz
GeForce GTX 1070 Ti (Desktop)
min:
24.15 fps, max:
62.69 fps
fps
100%
GeForce GTX 1070 Ti (Desktop):
24.6 [X] i7-7740X Asus X299 Prime Intel Core i7-7740X 4.3GHz
GeForce GTX 1070 Ti (Desktop)
min:
16.12 fps, max:
36.5 fps
fps
100%
GeForce GTX 1070 Ti (Desktop):
144 [X] i7-7740X Asus X299 Prime Intel Core i7-7740X 4.3GHz
GeForce GTX 1070 Ti (Desktop)
min:
143 fps, max:
145 fps
fps
100%
GeForce GTX 1070 Ti (Desktop):
138 [X] i7-7740X Asus X299 Prime Intel Core i7-7740X 4.3GHz
GeForce GTX 1070 Ti (Desktop)
min:
128 fps, max:
145 fps
fps
100%
GeForce GTX 1070 Ti (Desktop):
123 [X] i7-7740X Asus X299 Prime Intel Core i7-7740X 4.3GHz
GeForce GTX 1070 Ti (Desktop)
min:
110 fps, max:
145 fps
fps
100%
GeForce GTX 1070 Ti (Desktop):
121 [X] i7-7740X Asus X299 Prime Intel Core i7-7740X 4.3GHz
GeForce GTX 1070 Ti (Desktop)
min:
109 fps, max:
145 fps
fps
100%
GeForce GTX 1070 Ti (Desktop):
81 [X] i7-7740X Asus X299 Prime Intel Core i7-7740X 4.3GHz
GeForce GTX 1070 Ti (Desktop)
min:
63 fps, max:
100 fps
fps
100%
GeForce GTX 1070 Ti (Desktop):
42.4 [X] i7-7740X Asus X299 Prime Intel Core i7-7740X 4.3GHz
GeForce GTX 1070 Ti (Desktop)
min:
37 fps, max:
52 fps
fps
100%
GeForce GTX 1070 Ti (Desktop):
88 [X] i7-7740X Asus X299 Prime Intel Core i7-7740X 4.3GHz
GeForce GTX 1070 Ti (Desktop)
min:
82 fps, max:
94 fps
fps
100%
GeForce GTX 1070 Ti (Desktop):
64 [X] i7-7740X Asus X299 Prime Intel Core i7-7740X 4.3GHz
GeForce GTX 1070 Ti (Desktop)
min:
58 fps, max:
68 fps
fps
100%
GeForce GTX 1070 Ti (Desktop):
35.3 [X] i7-7740X Asus X299 Prime Intel Core i7-7740X 4.3GHz
GeForce GTX 1070 Ti (Desktop)
min:
32 fps, max:
38 fps
fps
100%
GeForce GTX 1070 Ti (Desktop):
110 [X] i7-7740X Asus X299 Prime Intel Core i7-7740X 4.3GHz
GeForce GTX 1070 Ti (Desktop)
min:
84 fps, max:
125 fps
fps
100%
GeForce GTX 1070 Ti (Desktop):
74 [X] i7-7740X Asus X299 Prime Intel Core i7-7740X 4.3GHz
GeForce GTX 1070 Ti (Desktop)
min:
62 fps, max:
84 fps
fps
100%
GeForce GTX 1070 Ti (Desktop):
35.4 [X] i7-7740X Asus X299 Prime Intel Core i7-7740X 4.3GHz
GeForce GTX 1070 Ti (Desktop)
min:
27 fps, max:
41 fps
fps
100%
GeForce GTX 1070 Ti (Desktop):
111 [X] i7-7740X Asus X299 Prime Intel Core i7-7740X 4.3GHz
GeForce GTX 1070 Ti (Desktop)
min:
90 fps, max:
162 fps
fps
100%
GeForce GTX 1070 Ti (Desktop):
83 [X] i7-7740X Asus X299 Prime Intel Core i7-7740X 4.3GHz
GeForce GTX 1070 Ti (Desktop)
min:
67 fps, max:
124 fps
fps
100%
GeForce GTX 1070 Ti (Desktop):
47.1 [X] i7-7740X Asus X299 Prime Intel Core i7-7740X 4.3GHz
GeForce GTX 1070 Ti (Desktop)
min:
37 fps, max:
72 fps
fps
100%
GeForce GTX 1070 Ti (Desktop):
120 [X] i7-7740X Asus X299 Prime Intel Core i7-7740X 4.3GHz
GeForce GTX 1070 Ti (Desktop)
min:
94 fps, max:
156 fps
fps
100%
GeForce GTX 1070 Ti (Desktop):
80 [X] i7-7740X Asus X299 Prime Intel Core i7-7740X 4.3GHz
GeForce GTX 1070 Ti (Desktop)
min:
61 fps, max:
105 fps
fps
100%
GeForce GTX 1070 Ti (Desktop):
40.1 [X] i7-7740X Asus X299 Prime Intel Core i7-7740X 4.3GHz
GeForce GTX 1070 Ti (Desktop)
min:
28 fps, max:
53 fps
fps
100%
GeForce GTX 1070 Ti (Desktop):
63 [X] i7-7740X Asus X299 Prime Intel Core i7-7740X 4.3GHz
GeForce GTX 1070 Ti (Desktop)
min:
35 fps, max:
124 fps
fps
100%
GeForce GTX 1070 Ti (Desktop):
48 [X] i7-7740X Asus X299 Prime Intel Core i7-7740X 4.3GHz
GeForce GTX 1070 Ti (Desktop)
min:
24 fps, max:
81 fps
fps
100%
GeForce GTX 1070 Ti (Desktop):
27 [X] i7-7740X Asus X299 Prime Intel Core i7-7740X 4.3GHz
GeForce GTX 1070 Ti (Desktop)
min:
13 fps, max:
63 fps
fps
100%
GeForce GTX 1070 Ti (Desktop):
100 [X] i7-7740X Asus X299 Prime Intel Core i7-7740X 4.3GHz
GeForce GTX 1070 Ti (Desktop)
min:
87 fps, max:
129 fps
fps
100%
GeForce GTX 1070 Ti (Desktop):
81 [X] i7-7740X Asus X299 Prime Intel Core i7-7740X 4.3GHz
GeForce GTX 1070 Ti (Desktop)
min:
73 fps, max:
103 fps
fps
100%
GeForce GTX 1070 Ti (Desktop):
55 [X] i7-7740X Asus X299 Prime Intel Core i7-7740X 4.3GHz
GeForce GTX 1070 Ti (Desktop)
min:
49 fps, max:
68 fps
fps
100%
GeForce GTX 1070 Ti (Desktop):
267 [X] i7-7740X Asus X299 Prime Intel Core i7-7740X 4.3GHz
GeForce GTX 1070 Ti (Desktop)
min:
248 fps, max:
287 fps
fps
100%
GeForce GTX 1070 Ti (Desktop):
141 [X] i7-7740X Asus X299 Prime Intel Core i7-7740X 4.3GHz
GeForce GTX 1070 Ti (Desktop)
min:
114 fps, max:
165 fps
fps
100%
GeForce GTX 1070 Ti (Desktop):
84 [X] i7-7740X Asus X299 Prime Intel Core i7-7740X 4.3GHz
GeForce GTX 1070 Ti (Desktop)
min:
67 fps, max:
142 fps
fps
100%
GeForce GTX 1070 Ti (Desktop):
51 [X] i7-7740X Asus X299 Prime Intel Core i7-7740X 4.3GHz
GeForce GTX 1070 Ti (Desktop)
min:
46 fps, max:
87 fps
fps
100%
GeForce GTX 1070 Ti (Desktop):
28 [X] i7-7740X Asus X299 Prime Intel Core i7-7740X 4.3GHz
GeForce GTX 1070 Ti (Desktop)
min:
24 fps, max:
43 fps
fps
100%
GeForce GTX 1070 Ti (Desktop):
97 [X] i7-7740X Asus X299 Prime Intel Core i7-7740X 4.3GHz
GeForce GTX 1070 Ti (Desktop)
min:
85 fps, max:
102 fps
fps
100%
GeForce GTX 1070 Ti (Desktop):
78 [X] i7-7740X Asus X299 Prime Intel Core i7-7740X 4.3GHz
GeForce GTX 1070 Ti (Desktop)
min:
70 fps, max:
82 fps
fps
100%
GeForce GTX 1070 Ti (Desktop):
49 [X] i7-7740X Asus X299 Prime Intel Core i7-7740X 4.3GHz
GeForce GTX 1070 Ti (Desktop)
min:
44 fps, max:
51 fps
fps
100%
GeForce GTX 1070 Ti (Desktop):
78 [X] i7-7740X Asus X299 Prime Intel Core i7-7740X 4.3GHz
GeForce GTX 1070 Ti (Desktop)
min:
64 fps, max:
99 fps
fps
100%
GeForce GTX 1070 Ti (Desktop):
48.5 [X] i7-7740X Asus X299 Prime Intel Core i7-7740X 4.3GHz
GeForce GTX 1070 Ti (Desktop)
min:
41 fps, max:
59 fps
fps
100%
GeForce GTX 1070 Ti (Desktop):
23.8 [X] i7-7740X Asus X299 Prime Intel Core i7-7740X 4.3GHz
GeForce GTX 1070 Ti (Desktop)
min:
21 fps, max:
28 fps
fps
100%
GeForce GTX 1070 Ti (Desktop):
135 [X] i7-7740X Asus X299 Prime Intel Core i7-7740X 4.3GHz
GeForce GTX 1070 Ti (Desktop)
min:
111 fps, max:
171 fps
fps
100%
GeForce GTX 1070 Ti (Desktop):
114 [X] i7-7740X Asus X299 Prime Intel Core i7-7740X 4.3GHz
GeForce GTX 1070 Ti (Desktop)
min:
95 fps, max:
132 fps
fps
100%
GeForce GTX 1070 Ti (Desktop):
108 [X] i7-7740X Asus X299 Prime Intel Core i7-7740X 4.3GHz
GeForce GTX 1070 Ti (Desktop)
min:
95 fps, max:
122 fps
fps
100%
GeForce GTX 1070 Ti (Desktop):
102 [X] i7-7740X Asus X299 Prime Intel Core i7-7740X 4.3GHz
GeForce GTX 1070 Ti (Desktop)
min:
79 fps, max:
116 fps
fps
100%
GeForce GTX 1070 Ti (Desktop):
75 [X] i7-7740X Asus X299 Prime Intel Core i7-7740X 4.3GHz
GeForce GTX 1070 Ti (Desktop)
min:
67 fps, max:
85 fps
fps
100%
GeForce GTX 1070 Ti (Desktop):
39 [X] i7-7740X Asus X299 Prime Intel Core i7-7740X 4.3GHz
GeForce GTX 1070 Ti (Desktop)
min:
34 fps, max:
45 fps
fps
100%
GeForce GTX 1070 Ti (Desktop):
101 [X] Intel Core i7-4790K 4GHz
GeForce GTX 1070 Ti (Desktop)
fps
100%
GeForce GTX 1070 Ti (Desktop):
89 [X] Intel Core i7-4790K 4GHz
GeForce GTX 1070 Ti (Desktop)
fps
100%
GeForce GTX 1070 Ti (Desktop):
74.5 [X] Intel Core i7-4790K 4GHz
GeForce GTX 1070 Ti (Desktop)
fps
100%
GeForce GTX 1070 Ti (Desktop):
66.7 [X] Intel Core i7-4790K 4GHz
GeForce GTX 1070 Ti (Desktop)
fps
100%
GeForce GTX 1070 Ti (Desktop):
154 [X] Intel Core i7-4790K 4GHz
GeForce GTX 1070 Ti (Desktop)
min:
101 fps, max:
189 fps
fps
100%
GeForce GTX 1070 Ti (Desktop):
100 [X] Intel Core i7-4790K 4GHz
GeForce GTX 1070 Ti (Desktop)
min:
77 fps, max:
115 fps
fps
100%
GeForce GTX 1070 Ti (Desktop):
82 [X] Intel Core i7-4790K 4GHz
GeForce GTX 1070 Ti (Desktop)
min:
58 fps, max:
97 fps
fps
100%
GeForce GTX 1070 Ti (Desktop):
59.1 [X] Intel Core i7-4790K 4GHz
GeForce GTX 1070 Ti (Desktop)
min:
44 fps, max:
74 fps
fps
100%
GeForce GTX 1070 Ti (Desktop):
42.4 [X] Intel Core i7-4790K 4GHz
GeForce GTX 1070 Ti (Desktop)
min:
33 fps, max:
50 fps
fps
100%
GeForce GTX 1070 Ti (Desktop):
22.7 [X] Intel Core i7-4790K 4GHz
GeForce GTX 1070 Ti (Desktop)
min:
18 fps, max:
27 fps
fps
100%
GeForce GTX 1070 Ti (Desktop):
146 [X] Intel Core i7-4790K 4GHz
GeForce GTX 1070 Ti (Desktop)
min:
93 fps, max:
194 fps
fps
100%
GeForce GTX 1070 Ti (Desktop):
87 [X] Intel Core i7-4790K 4GHz
GeForce GTX 1070 Ti (Desktop)
min:
69 fps, max:
110 fps
fps
100%
GeForce GTX 1070 Ti (Desktop):
63 [X] Intel Core i7-4790K 4GHz
GeForce GTX 1070 Ti (Desktop)
max:
92 fps
fps
100%
GeForce GTX 1070 Ti (Desktop):
27.7 [X] Intel Core i7-4790K 4GHz
GeForce GTX 1070 Ti (Desktop)
max:
42 fps
fps
100%
GeForce GTX 1070 Ti (Desktop):
109 [X] Intel Core i7-4790K 4GHz
GeForce GTX 1070 Ti (Desktop)
min:
78 fps, max:
132 fps
fps
100%
GeForce GTX 1070 Ti (Desktop):
72 [X] Intel Core i7-4790K 4GHz
GeForce GTX 1070 Ti (Desktop)
min:
61 fps, max:
89 fps
fps
100%
GeForce GTX 1070 Ti (Desktop):
36 [X] Intel Core i7-4790K 4GHz
GeForce GTX 1070 Ti (Desktop)
min:
32 fps, max:
39 fps
fps
100%
GeForce GTX 1070 Ti (Desktop):
117 [X] Intel Core i7-4790K 4GHz
GeForce GTX 1070 Ti (Desktop)
min:
106 fps, max:
130 fps
fps
100%
GeForce GTX 1070 Ti (Desktop):
77 [X] Intel Core i7-4790K 4GHz
GeForce GTX 1070 Ti (Desktop)
min:
70 fps, max:
85 fps
fps
100%
GeForce GTX 1070 Ti (Desktop):
38 [X] Intel Core i7-4790K 4GHz
GeForce GTX 1070 Ti (Desktop)
min:
34 fps, max:
44 fps
fps
100%
GeForce GTX 1070 Ti (Desktop):
122 [X] Intel Core i7-4790K 4GHz
GeForce GTX 1070 Ti (Desktop)
min:
86 fps, max:
155 fps
fps
100%
GeForce GTX 1070 Ti (Desktop):
85 [X] Intel Core i7-4790K 4GHz
GeForce GTX 1070 Ti (Desktop)
min:
57 fps, max:
102 fps
fps
100%
GeForce GTX 1070 Ti (Desktop):
45 [X] Intel Core i7-4790K 4GHz
GeForce GTX 1070 Ti (Desktop)
min:
30 fps, max:
52 fps
fps
100%
GeForce GTX 1070 Ti (Desktop):
103 [X] Intel Core i7-4790K 4GHz
GeForce GTX 1070 Ti (Desktop)
min:
60 fps, max:
143 fps
fps
100%
GeForce GTX 1070 Ti (Desktop):
92 [X] Intel Core i7-4790K 4GHz
GeForce GTX 1070 Ti (Desktop)
min:
55 fps, max:
133 fps
fps
100%
GeForce GTX 1070 Ti (Desktop):
88 [X] Intel Core i7-4790K 4GHz
GeForce GTX 1070 Ti (Desktop)
min:
53 fps, max:
126 fps
fps
100%
GeForce GTX 1070 Ti (Desktop):
75 [X] Intel Core i7-4790K 4GHz
GeForce GTX 1070 Ti (Desktop)
min:
30 fps, max:
117 fps
fps
100%
GeForce GTX 1070 Ti (Desktop):
58 [X] Intel Core i7-4790K 4GHz
GeForce GTX 1070 Ti (Desktop)
min:
33 fps, max:
104 fps
fps
100%
GeForce GTX 1070 Ti (Desktop):
34 [X] Intel Core i7-4790K 4GHz
GeForce GTX 1070 Ti (Desktop)
min:
24 fps, max:
51 fps
fps
100%
GeForce GTX 1070 Ti (Desktop):
165 [X] Intel Core i7-4790K 4GHz
GeForce GTX 1070 Ti (Desktop)
min:
76 fps, max:
225 fps
fps
100%
GeForce GTX 1070 Ti (Desktop):
136 [X] Intel Core i7-4790K 4GHz
GeForce GTX 1070 Ti (Desktop)
min:
66 fps, max:
190 fps
fps
100%
GeForce GTX 1070 Ti (Desktop):
109 [X] Intel Core i7-4790K 4GHz
GeForce GTX 1070 Ti (Desktop)
min:
49 fps, max:
169 fps
fps
100%
GeForce GTX 1070 Ti (Desktop):
85 [X] Intel Core i7-4790K 4GHz
GeForce GTX 1070 Ti (Desktop)
min:
43 fps, max:
169 fps
fps
100%
GeForce GTX 1070 Ti (Desktop):
34 [X] Intel Core i7-4790K 4GHz
GeForce GTX 1070 Ti (Desktop)
min:
21 fps, max:
50 fps
fps
100%
GeForce GTX 1070 Ti (Desktop):
47.1 [X] Intel Core i7-4790K 4GHz
GeForce GTX 1070 Ti (Desktop)
min:
44 fps, max:
51 fps
fps
100%
GeForce GTX 1070 Ti (Desktop):
17.3 [X] Intel Core i7-4790K 4GHz
GeForce GTX 1070 Ti (Desktop)
min:
16 fps, max:
18 fps
fps
100%
GeForce GTX 1070 Ti (Desktop):
106 [X] Intel Core i7-4790K 4GHz
GeForce GTX 1070 Ti (Desktop)
min:
95 fps, max:
113 fps
fps
100%
GeForce GTX 1070 Ti (Desktop):
52 [X] Intel Core i7-4790K 4GHz
GeForce GTX 1070 Ti (Desktop)
min:
47 fps, max:
55 fps
fps
100%
GeForce GTX 1070 Ti (Desktop):
152 [X] Intel Core i7-4790K 4GHz
GeForce GTX 1070 Ti (Desktop)
min:
130 fps
fps
100%
GeForce GTX 1070 Ti (Desktop):
57.9 [X] Intel Core i7-4790K 4GHz
GeForce GTX 1070 Ti (Desktop)
min:
51 fps, max:
69 fps
fps
100%
GeForce GTX 1070 Ti (Desktop):
223 [X] Intel Core i7-4790K 4GHz
GeForce GTX 1070 Ti (Desktop)
min:
176 fps, max:
252 fps
fps
100%
GeForce GTX 1070 Ti (Desktop):
92 [X] Intel Core i7-4790K 4GHz
GeForce GTX 1070 Ti (Desktop)
min:
76 fps, max:
133 fps
fps
100%
GeForce GTX 1070 Ti (Desktop):
54.2 [X] Intel Core i7-4790K 4GHz
GeForce GTX 1070 Ti (Desktop)
min:
47 fps, max:
62 fps
fps
100%
GeForce GTX 1070 Ti (Desktop):
35.8 [X] Intel Core i7-4790K 4GHz
GeForce GTX 1070 Ti (Desktop)
min:
27 fps, max:
40 fps
fps
100%
GeForce GTX 1070 Ti (Desktop):
156 [X] Intel Core i7-4790K 4GHz
GeForce GTX 1070 Ti (Desktop)
min:
92 fps, max:
189 fps
fps
100%
GeForce GTX 1070 Ti (Desktop):
122 [X] Intel Core i7-4790K 4GHz
GeForce GTX 1070 Ti (Desktop)
min:
75 fps, max:
163 fps
fps
100%
GeForce GTX 1070 Ti (Desktop):
47.9 [X] Intel Core i7-4790K 4GHz
GeForce GTX 1070 Ti (Desktop)
min:
39 fps, max:
60 fps
fps
100%
GeForce GTX 1070 Ti (Desktop):
67.8 [X] Intel Core i7-4790K 4GHz
GeForce GTX 1070 Ti (Desktop)
min:
51 fps, max:
97 fps
fps
100%
GeForce GTX 1070 Ti (Desktop):
80 [X] Intel Core i7-4790K 4GHz
GeForce GTX 1070 Ti (Desktop)
min:
79 fps, max:
81 fps
fps
100%
GeForce GTX 1070 Ti (Desktop):
108 [X] Intel Core i7-4790K 4GHz
GeForce GTX 1070 Ti (Desktop)
min:
86 fps, max:
184 fps
fps
100%
GeForce GTX 1070 Ti (Desktop):
91 [X] Intel Core i7-4790K 4GHz
GeForce GTX 1070 Ti (Desktop)
min:
70 fps, max:
133 fps
fps
100%
GeForce GTX 1070 Ti (Desktop):
67.9 [X] DX11
Intel Core i7-4790K 4GHz
GeForce GTX 1070 Ti (Desktop)
min:
53 fps, max:
87 fps
fps
100%
GeForce GTX 1070 Ti (Desktop):
31.9 [X] DX11
Intel Core i7-4790K 4GHz
GeForce GTX 1070 Ti (Desktop)
min:
27 fps, max:
38 fps
fps
100%
GeForce GTX 1070 Ti (Desktop):
182 [X] Intel Core i7-4790K 4GHz
GeForce GTX 1070 Ti (Desktop)
min:
149 fps, max:
213 fps
fps
100%
GeForce GTX 1070 Ti (Desktop):
88.7 [X] Intel Core i7-4790K 4GHz
GeForce GTX 1070 Ti (Desktop)
min:
77 fps, max:
103 fps
fps
100%
GeForce GTX 1070 Ti (Desktop):
94.6 [X] Intel Core i7-4790K 4GHz
GeForce GTX 1070 Ti (Desktop)
min:
53 fps, max:
133 fps
fps
100%
GeForce GTX 1070 Ti (Desktop):
45.6 [X] Intel Core i7-4790K 4GHz
GeForce GTX 1070 Ti (Desktop)
min:
21 fps, max:
59 fps
fps
100%
GeForce GTX 1070 Ti (Desktop):
98 [X] Intel Core i7-4790K 4GHz
GeForce GTX 1070 Ti (Desktop)
min:
80 fps, max:
113 fps
fps
100%
GeForce GTX 1070 Ti (Desktop):
41 [X] Intel Core i7-4790K 4GHz
GeForce GTX 1070 Ti (Desktop)
min:
39 fps, max:
45 fps
fps
HD Graphics 4200:
11.2 fps
100%
GeForce GTX 1070 Ti (Desktop):
111 [X] DX11
Intel Core i7-4790K 4GHz
GeForce GTX 1070 Ti (Desktop)
min:
101 fps, max:
119 fps
fps
100%
GeForce GTX 1070 Ti (Desktop):
46.5 [X] DX11
Intel Core i7-4790K 4GHz
GeForce GTX 1070 Ti (Desktop)
min:
41 fps, max:
52 fps
fps
HD Graphics 4200:
17.2 fps
HD Graphics 4200:
10.7 fps
100%
GeForce GTX 1070 Ti (Desktop):
177 [X] Intel Core i7-4790K 4GHz
GeForce GTX 1070 Ti (Desktop)
min:
106 fps, max:
305 fps
fps
100%
GeForce GTX 1070 Ti (Desktop):
77 [X] Intel Core i7-4790K 4GHz
GeForce GTX 1070 Ti (Desktop)
min:
54 fps, max:
113 fps
fps
HD Graphics 4200:
11.3 fps
HD Graphics 4200:
19.2 fps
HD Graphics 4200:
11.5 fps
HD Graphics 4200:
14.9 fps
HD Graphics 4200:
37.7 fps
HD Graphics 4200:
24.8 fps
HD Graphics 4200:
30.7 fps
HD Graphics 4200:
20.5 fps
100%
GeForce GTX 1070 Ti (Desktop):
142.7 [X] Intel Core i7-4790K 4GHz
GeForce GTX 1070 Ti (Desktop)
min:
125.8 fps
fps
100%
GeForce GTX 1070 Ti (Desktop):
134.2 [X] Intel Core i7-4790K 4GHz
GeForce GTX 1070 Ti (Desktop)
min:
115.5 fps
fps
100%
GeForce GTX 1070 Ti (Desktop):
126.6 [X] Intel Core i7-4790K 4GHz
GeForce GTX 1070 Ti (Desktop)
min:
111.1 fps
fps
100%
GeForce GTX 1070 Ti (Desktop):
121.2 [X] Intel Core i7-4790K 4GHz
GeForce GTX 1070 Ti (Desktop)
min:
105.8 fps
fps
100%
GeForce GTX 1070 Ti (Desktop):
105 [X] Intel Core i7-4790K 4GHz
GeForce GTX 1070 Ti (Desktop)
min:
95 fps
fps
100%
GeForce GTX 1070 Ti (Desktop):
293 [X] Intel Core i7-4790K 4GHz
GeForce GTX 1070 Ti (Desktop)
min:
269 fps, max:
321 fps
fps
3%
HD Graphics 4200:
8.8 fps
100%
GeForce GTX 1070 Ti (Desktop):
71.8 [X] Intel Core i7-4790K 4GHz
GeForce GTX 1070 Ti (Desktop)
min:
61 fps, max:
80 fps
fps
100%
GeForce GTX 1070 Ti (Desktop):
47.1 [X] Intel Core i7-4790K 4GHz
GeForce GTX 1070 Ti (Desktop)
min:
42 fps, max:
51 fps
fps
HD Graphics 4200:
67.9 fps
HD Graphics 4200:
15.6 fps
100%
GeForce GTX 1070 Ti (Desktop):
67 [X] i7-7740X Asus X299 Prime Intel Core i7-7740X 4.3GHz
GeForce GTX 1070 Ti (Desktop)
min:
11.7 fps, P1:
27 fps, max:
202 fps
fps
HD Graphics 4200:
12.9 fps
HD Graphics 4200:
3.4 4 ~ 4 fps
HD Graphics 4200:
15.3 fps
HD Graphics 4200:
10.9 fps
HD Graphics 4200:
89.1 fps
HD Graphics 4200:
24.4 fps
HD Graphics 4200:
19.9 fps
HD Graphics 4200:
11.7 fps
HD Graphics 4200:
57.5 fps
HD Graphics 4200:
18.9 fps
HD Graphics 4200:
27.2 fps
HD Graphics 4200:
21.9 fps
HD Graphics 4200:
43.1 fps
HD Graphics 4200:
23.4 fps
HD Graphics 4200:
11 14 ~ 13 fps
HD Graphics 4200:
5.3 7.1 ~ 6 fps
HD Graphics 4200:
26.2 fps
HD Graphics 4200:
13.9 fps
HD Graphics 4200:
14.1 fps
HD Graphics 4200:
18.4 fps
HD Graphics 4200:
12.7 fps
HD Graphics 4200:
15.9 fps
HD Graphics 4200:
10.1 fps
HD Graphics 4200:
90.8 fps
HD Graphics 4200:
59.7 fps
HD Graphics 4200:
33.3 fps
HD Graphics 4200:
22.3 fps
HD Graphics 4200:
27.7 fps
HD Graphics 4200:
18.4 fps
HD Graphics 4200:
13.3 fps
HD Graphics 4200:
11.3 fps
HD Graphics 4200:
11.9 fps
HD Graphics 4200:
17.8 fps
HD Graphics 4200:
10.4 fps
HD Graphics 4200:
51.1 fps
HD Graphics 4200:
25.7 fps
HD Graphics 4200:
17.9 fps
HD Graphics 4200:
12.7 fps
100%
GeForce GTX 1070 Ti (Desktop):
132 [X] Intel Core i7-4790K 4GHz
GeForce GTX 1070 Ti (Desktop)
min:
58 fps, max:
235 fps
fps
2%
HD Graphics 4200:
2.8 fps
HD Graphics 4200:
95 109.2 ~ 102 fps
HD Graphics 4200:
31 38.8 ~ 35 fps
HD Graphics 4200:
20 22.7 ~ 21 fps
HD Graphics 4200:
18.8 fps
HD Graphics 4200:
10.1 fps
HD Graphics 4200:
11.4 fps
HD Graphics 4200:
47.6 fps
HD Graphics 4200:
20.9 fps
HD Graphics 4200:
14.2 fps
HD Graphics 4200:
26.2 fps
HD Graphics 4200:
16.5 fps
HD Graphics 4200:
16.7 fps
HD Graphics 4200:
11.4 fps
HD Graphics 4200:
27.2 fps
HD Graphics 4200:
19.1 fps
HD Graphics 4200:
22.9 fps
HD Graphics 4200:
15.1 fps
HD Graphics 4200:
17.8 fps
HD Graphics 4200:
14.5 fps
HD Graphics 4200:
13.9 fps
HD Graphics 4200:
104.8 fps
HD Graphics 4200:
55.6 fps
HD Graphics 4200:
49.2 fps
HD Graphics 4200:
31.7 fps
HD Graphics 4200:
15.5 fps
HD Graphics 4200:
70.7 fps
HD Graphics 4200:
35.5 fps
HD Graphics 4200:
18.9 fps
HD Graphics 4200:
12.5 fps
HD Graphics 4200:
22.7 fps
HD Graphics 4200:
16.5 fps
HD Graphics 4200:
34.5 fps
HD Graphics 4200:
18.9 fps
HD Graphics 4200:
12.6 fps
HD Graphics 4200:
16.9 19 ~ 18 fps
HD Graphics 4200:
28.2 fps
HD Graphics 4200:
19.5 fps
HD Graphics 4200:
11.1 fps
HD Graphics 4200:
24.4 fps
HD Graphics 4200:
10.2 fps
HD Graphics 4200:
13.9 fps
HD Graphics 4200:
15.4 19 ~ 17 fps
HD Graphics 4200:
12 34.1 ~ 23 fps
HD Graphics 4200:
20.4 fps
HD Graphics 4200:
54.8 fps
HD Graphics 4200:
32.2 fps
HD Graphics 4200:
24.5 fps
HD Graphics 4200:
15.6 fps
HD Graphics 4200:
37.5 fps
HD Graphics 4200:
19.5 fps
HD Graphics 4200:
56.5 fps
HD Graphics 4200:
22.8 fps
HD Graphics 4200:
121 [X] Panasonic ToughPad FZ-M1 Intel Core i5-4302Y 1.6GHz
HD Graphics 4200
130 ~ 126 fps
HD Graphics 4200:
43.9 46.9 [X] Panasonic ToughPad FZ-M1 Intel Core i5-4302Y 1.6GHz
HD Graphics 4200
~ 45 fps
HD Graphics 4200:
64.6 fps
HD Graphics 4200:
53.4 fps
Average Gaming NVIDIA GeForce GTX 1070 Ti (Desktop) → 100% Average Gaming 30-70 fps → 100%
Average Gaming Intel HD Graphics 4200 → 3% For more games that might be playable and a list of all games and graphics cards visit our Gaming List
v1.28
log 02. 19:32:03
#0 checking url part for id 8258 +0s ... 0s
#1 checking url part for id 4576 +0s ... 0s
#2 redirected to Ajax server, took 1719941523 +0s ... 0s
#3 did not recreate cache, as it is less than 5 days old! Created at Mon, 01 Jul 2024 05:16:07 +0200 +0s ... 0s
#4 composed specs +0.061s ... 0.061s
#5 did output specs +0s ... 0.061s
#6 start showIntegratedCPUs +0s ... 0.061s
#7 getting avg benchmarks for device 8258 +0.02s ... 0.081s
#8 got single benchmarks 8258 +0.004s ... 0.085s
#9 getting avg benchmarks for device 4576 +0.005s ... 0.09s
#10 got single benchmarks 4576 +0.014s ... 0.104s
#11 got avg benchmarks for devices +0s ... 0.104s
#12 min, max, avg, median took s +0.018s ... 0.122s
#13 before gaming benchmark output +0s ... 0.122s
#14 Got 413 rows for game benchmarks. +0.019s ... 0.141s
#15 composed SQL query for gamebenchmarks +0s ... 0.141s
#16 got data and put it in $dataArray +0.015s ... 0.156s
#17 benchmarks composed for output. +0.044s ... 0.2s
#18 calculated avg scores. +0s ... 0.2s
#19 return log +0.002s ... 0.203s
Please share our article, every link counts!
Redaktion, 2017-09- 8 (Update: 2023-07- 1)
 Deutsch
 English
 Español
 Français
 Italiano
 Nederlands
 Polski
 Português
 Русский
 Türkçe
 Svenska
 Chinese
 Magyar