NVIDIA GeForce GTX 1050 Ti (Desktop) vs AMD Radeon R7 M340
NVIDIA GeForce GTX 1050 Ti (Desktop) ► remove from comparison
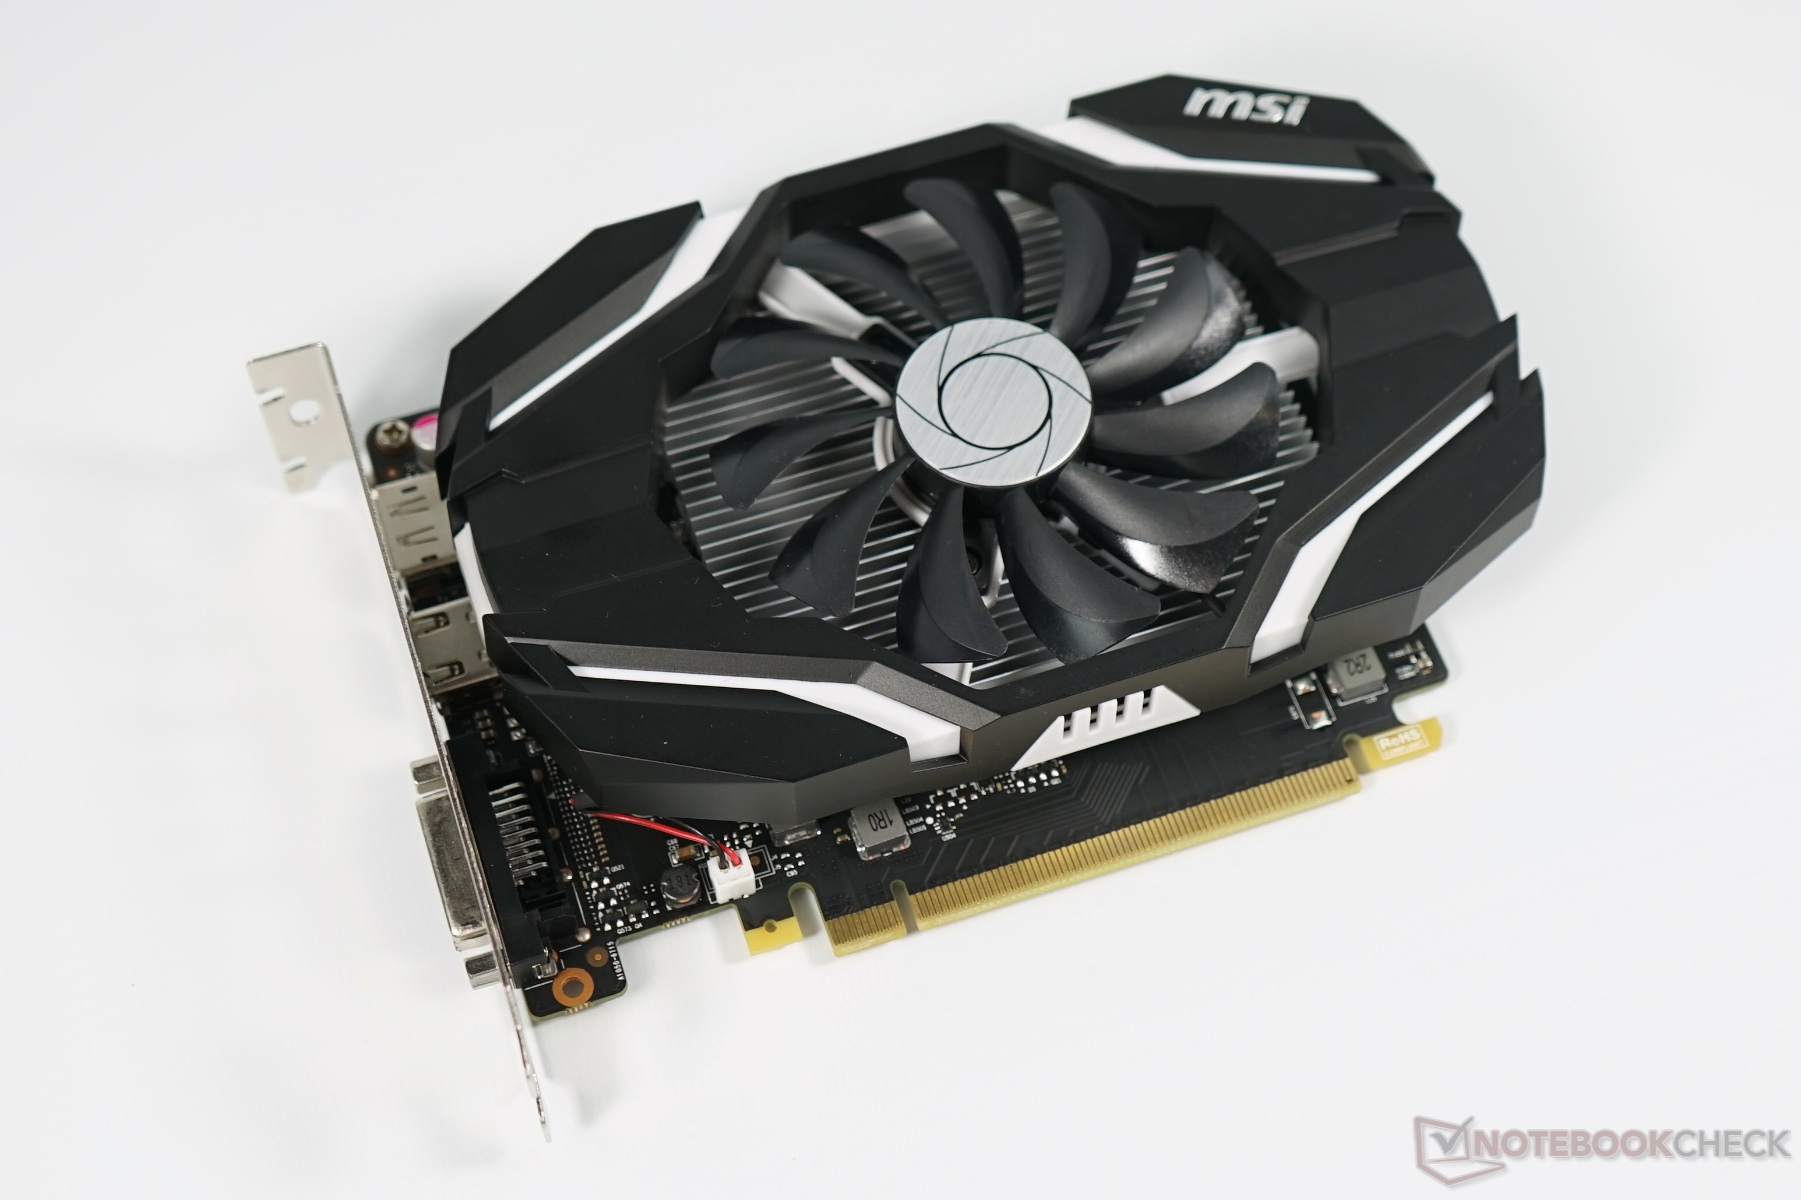
The Nvidia GeForce GTX 1050 Ti (N17P-G1) for desktops is an entry level gaming graphics card that was announced late 2016. It is based on the GP107 chip using the Pascal architecture and manufactured in 14nm FinFET at Samsung (the bigger Pascal chips are manufactured in 16nm at TSMC). Usually it is equipped with 4 GB GDDR5 memory with a 7 Gbps data rate. The mobile GTX 1050 Ti version should be announced later (beginning of 2017) and feature similar specs.
The performance of the GTX 1050 lies between the Radeon RX 460 and the RX 470 on a similar level of the old GeForce GTX 960 (or 970M ). Therefore, the card is most suited for 1080p gaming at high detail settings (but not maximum settings).
See our extensive review of the MSI GeForce GTX 1050 Ti for more information on power consumption, benchmarks and noise level.
AMD Radeon R7 M340 ► remove from comparison
The AMD Radeon R7 M340 is a low-end dedicated graphics card for laptops. It could be based on a new derivative of the Tonga chip and therefore support DirectX 12, Vulkan and FreeSync. According to our informations the chip will be clocked at 1021 MHz and featuring 5 compute cores. That would turn out to be slower than the R5 M335 and M330 (but faster than the M320). The gaming performance should be therefore somewhere in the ballpark of the old Radeon R5 M255 (see for gaming benchmarks) .
NVIDIA GeForce GTX 1050 Ti (Desktop) AMD Radeon R7 M340 Radeon R7 M300 Series Codename N17P-G1 Meso Pro DDR3 Architecture Pascal GCN Pipelines 768 - unified 320 - unified Core Speed 1290 - 1392 (Boost) MHz 1021 MHz Memory Speed 7008 MHz 2000 MHz Memory Bus Width 128 Bit 64 Bit Memory Type GDDR5 DDR3 Max. Amount of Memory 4 GB Shared Memory no no API DirectX 12_1, OpenGL 4.5 DirectX 12, OpenGL 4.3 technology 16 nm 28 nm Features Multi-Projection, VR Ready, G-SYNC, Vulkan, Multi Monitor DirectX 12, Mantle, OpenGL 4.3, OpenCL 1.2, Vulkan Date of Announcement 25.10.2016 16.06.2015 Link to Manufacturer Page www.amd.com
Benchmarks Performance Rating - 3DMark 11 + Fire Strike + Time Spy - Radeon R7 M340
0.6 pt (2%)
...
...
3DMark - 3DMark Time Spy Score
min: 2474 avg: 2568 median: 2568 (7%) max: 2662 Points
3DMark - 3DMark Time Spy Graphics
min: 2277 avg: 2309 median: 2308.5 (6%) max: 2340 Points
3DMark - 3DMark Ice Storm Unlimited Graphics
352876 Points (40%)
69098 Points (8%)
3DMark - 3DMark Ice Storm Extreme Graphics
min: 31086 avg: 44959 median: 41700 (5%) max: 62092 Points
3DMark - 3DMark Cloud Gate Score
24195 Points (26%)
min: 5029 avg: 5320 median: 5272.5 (6%) max: 5704 Points
3DMark - 3DMark Cloud Gate Graphics
50939 Points (13%)
min: 6037 avg: 7115 median: 6153 (2%) max: 10116 Points
3DMark - 3DMark Fire Strike Standard Score
min: 6644 avg: 6783 median: 6816 (12%) max: 6888 Points
min: 1061 avg: 1163 median: 1091.5 (2%) max: 1407 Points
3DMark - 3DMark Fire Strike Standard Graphics
min: 7293 avg: 7491 median: 7485 (8%) max: 7696 Points
min: 1173 avg: 1379 median: 1208.5 (1%) max: 1926 Points
3DMark - 3DMark Ice Storm Graphics
min: 40343 avg: 44050 median: 42388 (5%) max: 51082 Points
3DMark 11 - 3DM11 Performance Score
min: 9151 avg: 9481 median: 9480.5 (13%) max: 9810 Points
min: 2209 avg: 2427 median: 2268 (3%) max: 2961 Points
3DMark 11 - 3DM11 Performance GPU
min: 9212 avg: 9453 median: 9453 (8%) max: 9694 Points
min: 2074 avg: 2492 median: 2148 (2%) max: 3597 Points
3DMark Vantage + AMD Radeon R7 M340 3DMark Vantage - 3DM Vant. Perf. total
5427 Points (2%)
3DM Vant. Perf. GPU no PhysX + AMD Radeon R7 M340 3DMark Vantage - 3DM Vant. Perf. GPU no PhysX
4606 Points (3%)
3DMark 03 - 3DMark 03 - Standard
19471 Points (10%)
3DMark 05 - 3DMark 05 - Standard
15629 Points (17%)
3DMark 06 3DMark 06 - Standard 1280x1024 + NVIDIA GeForce GTX 1050 Ti (Desktop)
min: 36277 avg: 38484 median: 38483.5 (50%) max: 40690 Points
3DMark 06 - Standard 1280x1024 + AMD Radeon R7 M340
8982 Points (12%)
Unigine Valley 1.0 - Unigine Valley 1.0 DX
40.7 fps (13%)
Unigine Heaven 2.1 - Heaven 2.1 high
19.8 fps (4%)
SPECviewperf 11 + AMD Radeon R7 M340 SPECviewperf 11 - specvp11 snx-01
10.9 fps (7%)
specvp11 tcvis-02 + AMD Radeon R7 M340 SPECviewperf 11 - specvp11 tcvis-02
5 fps (3%)
specvp11 sw-02 + AMD Radeon R7 M340 SPECviewperf 11 - specvp11 sw-02
19.9 fps (15%)
specvp11 proe-05 + AMD Radeon R7 M340 SPECviewperf 11 - specvp11 proe-05
3.4 fps (4%)
specvp11 maya-03 + AMD Radeon R7 M340 SPECviewperf 11 - specvp11 maya-03
8 fps (6%)
specvp11 lightwave-01 + AMD Radeon R7 M340 SPECviewperf 11 - specvp11 lightwave-01
19.2 fps (21%)
specvp11 ensight-04 + AMD Radeon R7 M340 SPECviewperf 11 - specvp11 ensight-04
16.6 fps (8%)
specvp11 catia-03 + AMD Radeon R7 M340 SPECviewperf 11 - specvp11 catia-03
5.5 fps (3%)
Cinebench R10 Cinebench R10 Shading (32bit) + AMD Radeon R7 M340 Cinebench R10 - Cinebench R10 Shading (32bit)
min: 4932 avg: 6112 median: 6111.5 (4%) max: 7291 Points
Cinebench R11.5 Cinebench R11.5 OpenGL 64 Bit + AMD Radeon R7 M340 Cinebench R11.5 - Cinebench R11.5 OpenGL 64 Bit
min: 25.28 avg: 26.8 median: 26.8 (9%) max: 28.34 fps
Cinebench R15 + NVIDIA GeForce GTX 1050 Ti (Desktop) Cinebench R15 - Cinebench R15 OpenGL 64 Bit
min: 134.7 avg: 150.4 median: 150.4 (9%) max: 166 fps
Cinebench R15 OpenGL 64 Bit + AMD Radeon R7 M340
min: 31.32 avg: 33.8 median: 33.5 (2%) max: 36.97 fps
Cinebench R15 OpenGL Ref. Match 64 Bit + NVIDIA GeForce GTX 1050 Ti (Desktop) Cinebench R15 - Cinebench R15 OpenGL Ref. Match 64 Bit
min: 99.6 avg: 99.8 median: 99.8 (100%) max: 100 %
Cinebench R15 OpenGL Ref. Match 64 Bit + AMD Radeon R7 M340
98 % (98%)
GFXBench 3.1 - GFXBench Manhattan ES 3.1 Offscreen
27.9 fps (1%)
GFXBench 3.0 - GFXBench 3.0 Manhattan Offscreen
28.7 fps (2%)
GFXBench (DX / GLBenchmark) 2.7 + AMD Radeon R7 M340 GFXBench (DX / GLBenchmark) 2.7 - GFXBench T-Rex HD Offscreen C24Z16
109.3 fps (1%)
LuxMark v2.0 64Bit - LuxMark v2.0 Room GPU
1175 Samples/s (5%)
163 Samples/s (1%)
LuxMark v2.0 64Bit - LuxMark v2.0 Sala GPU
2156 Samples/s (4%)
274 Samples/s (0%)
ComputeMark v2.1 - ComputeMark v2.1 Result
5493 Points (6%)
min: 1408 avg: 1456 median: 1455.5 (2%) max: 1503 Points
Power Consumption - Furmark Stress Test Power Consumption - external Monitor *
164 Watt (23%)
Power Consumption - The Witcher 3 Power Consumption - external Monitor *
155 Watt (22%)
Power Consumption - Witcher 3 Power Consumption *
99.5 Watt (22%)
53.3 Watt (12%)
Power Consumption - Witcher 3 ultra Power Efficiency
0.2 fps per Watt (22%)
Power Consumption - Witcher 3 ultra Power Efficiency - external Monitor
0.2 fps per Watt (15%)
Emissions Witcher 3 Fan Noise + NVIDIA GeForce GTX 1050 Ti (Desktop) Emissions - Witcher 3 Fan Noise
42 dB(A) (67%)
Witcher 3 Fan Noise + AMD Radeon R7 M340
41.8 dB(A) (67%)
Average Benchmarks NVIDIA GeForce GTX 1050 Ti (Desktop) → 100% n=13 Average Benchmarks AMD Radeon R7 M340 → 25% n=13
- Range of benchmark values for this graphics card
- Average benchmark values for this graphics card
* Smaller numbers mean a higher performance
1 This benchmark is not used for the average calculation
Game Benchmarks The following benchmarks stem from our benchmarks of review laptops. The performance depends on the used graphics memory, clock rate, processor, system settings, drivers, and operating systems. So the results don't have to be representative for all laptops with this GPU. For detailed information on the benchmark results, click on the fps number.
100%
GeForce GTX 1050 Ti (Desktop):
31 [X] Asus Maximum XIII Hero Desktop MSI GTX 1050 Ti Intel Core i9-11900K 3.5GHz
GeForce GTX 1050 Ti (Desktop)
min:
19 fps
fps
100%
GeForce GTX 1050 Ti (Desktop):
18 [X] Asus Maximum XIII Hero Desktop MSI GTX 1050 Ti Intel Core i9-11900K 3.5GHz
GeForce GTX 1050 Ti (Desktop)
min:
8 fps
fps
100%
GeForce GTX 1050 Ti (Desktop):
11 [X] Asus Maximum XIII Hero Desktop MSI GTX 1050 Ti Intel Core i9-11900K 3.5GHz
GeForce GTX 1050 Ti (Desktop)
min:
5 fps
fps
100%
GeForce GTX 1050 Ti (Desktop):
7 [X] Asus Maximum XIII Hero Desktop MSI GTX 1050 Ti Intel Core i9-11900K 3.5GHz
GeForce GTX 1050 Ti (Desktop)
min:
2 fps
fps
100%
GeForce GTX 1050 Ti (Desktop):
86.5 [X] Asus Maximum XIII Hero Desktop MSI GTX 1050 Ti 918016
Intel Core i9-11900K 3.5GHz
GeForce GTX 1050 Ti (Desktop)
min:
74 fps, P1:
72 fps, max:
101 fps
fps
100%
GeForce GTX 1050 Ti (Desktop):
75.3 [X] Asus Maximum XIII Hero Desktop MSI GTX 1050 Ti 918016
Intel Core i9-11900K 3.5GHz
GeForce GTX 1050 Ti (Desktop)
min:
64 fps, P1:
63 fps, max:
86 fps
fps
100%
GeForce GTX 1050 Ti (Desktop):
52.5 [X] Asus Maximum XIII Hero Desktop MSI GTX 1050 Ti 918016
Intel Core i9-11900K 3.5GHz
GeForce GTX 1050 Ti (Desktop)
min:
46 fps, P1:
45 fps, max:
60 fps
fps
100%
GeForce GTX 1050 Ti (Desktop):
65 [X] Asus Maximum XIII Hero Desktop MSI GTX 1050 Ti Intel Core i9-11900K 3.5GHz
GeForce GTX 1050 Ti (Desktop)
min:
40.3 fps, P0.1:
49.9 fps, P1:
53.2 fps, max:
202 fps
fps
100%
GeForce GTX 1050 Ti (Desktop):
23.3 [X] Asus Maximum XIII Hero Desktop MSI GTX 1050 Ti Intel Core i9-11900K 3.5GHz
GeForce GTX 1050 Ti (Desktop)
min:
17.1 fps, P0.1:
17.5 fps, P1:
18.8 fps, max:
33 fps
fps
100%
GeForce GTX 1050 Ti (Desktop):
15.8 [X] Asus Maximum XIII Hero Desktop MSI GTX 1050 Ti Intel Core i9-11900K 3.5GHz
GeForce GTX 1050 Ti (Desktop)
min:
12 fps, P0.1:
12.1 fps, P1:
13 fps, max:
20.3 fps
fps
100%
GeForce GTX 1050 Ti (Desktop):
7.7 [X] Asus Maximum XIII Hero Desktop MSI GTX 1050 Ti Intel Core i9-11900K 3.5GHz
GeForce GTX 1050 Ti (Desktop)
min:
6.08 fps, P0.1:
6.1 fps, P1:
6.17 fps, max:
9.98 fps
fps
100%
GeForce GTX 1050 Ti (Desktop):
55 [X] Asus Maximum XIII Hero Desktop MSI GTX 1050 Ti Intel Core i9-11900K 3.5GHz
GeForce GTX 1050 Ti (Desktop)
min:
14 fps, max:
73 fps
fps
100%
GeForce GTX 1050 Ti (Desktop):
37 [X] Asus Maximum XIII Hero Desktop MSI GTX 1050 Ti Intel Core i9-11900K 3.5GHz
GeForce GTX 1050 Ti (Desktop)
min:
25 fps, max:
46 fps
fps
100%
GeForce GTX 1050 Ti (Desktop):
36 [X] Asus Maximum XIII Hero Desktop MSI GTX 1050 Ti Intel Core i9-11900K 3.5GHz
GeForce GTX 1050 Ti (Desktop)
min:
25 fps, max:
46 fps
fps
100%
GeForce GTX 1050 Ti (Desktop):
35 [X] Asus Maximum XIII Hero Desktop MSI GTX 1050 Ti Intel Core i9-11900K 3.5GHz
GeForce GTX 1050 Ti (Desktop)
min:
24 fps, max:
45 fps
fps
100%
GeForce GTX 1050 Ti (Desktop):
24 [X] Asus Maximum XIII Hero Desktop MSI GTX 1050 Ti Intel Core i9-11900K 3.5GHz
GeForce GTX 1050 Ti (Desktop)
min:
14 fps, max:
29 fps
fps
100%
GeForce GTX 1050 Ti (Desktop):
11 [X] Asus Maximum XIII Hero Desktop MSI GTX 1050 Ti Intel Core i9-11900K 3.5GHz
GeForce GTX 1050 Ti (Desktop)
min:
8 fps, max:
13 fps
fps
100%
GeForce GTX 1050 Ti (Desktop):
185 [X] Aorus Z370 Ultra Gaming Desktop MSI GTX 1050 Ti 797778
Intel Core i7-8086K 3.7GHz
GeForce GTX 1050 Ti (Desktop)
min:
152 fps, P1:
142 fps, max:
230 fps
fps
100%
GeForce GTX 1050 Ti (Desktop):
88.8 [X] Aorus Z370 Ultra Gaming Desktop MSI GTX 1050 Ti 797778
Intel Core i7-8086K 3.7GHz
GeForce GTX 1050 Ti (Desktop)
min:
74 fps, P1:
71 fps, max:
104 fps
fps
100%
GeForce GTX 1050 Ti (Desktop):
71.7 [X] Aorus Z370 Ultra Gaming Desktop MSI GTX 1050 Ti 797778
Intel Core i7-8086K 3.7GHz
GeForce GTX 1050 Ti (Desktop)
min:
59 fps, P1:
56 fps, max:
83 fps
fps
100%
GeForce GTX 1050 Ti (Desktop):
41.3 [X] Aorus Z370 Ultra Gaming Desktop MSI GTX 1050 Ti Intel Core i7-8086K 3.7GHz
GeForce GTX 1050 Ti (Desktop)
min:
17.7 fps, P0.1:
28.4 fps, P1:
32.5 fps, max:
81.3 fps
fps
100%
GeForce GTX 1050 Ti (Desktop):
21.3 [X] Aorus Z370 Ultra Gaming Desktop MSI GTX 1050 Ti Intel Core i7-8086K 3.7GHz
GeForce GTX 1050 Ti (Desktop)
min:
14.9 fps, P0.1:
15.3 fps, P1:
18.1 fps, max:
35.3 fps
fps
100%
GeForce GTX 1050 Ti (Desktop):
17 [X] Aorus Z370 Ultra Gaming Desktop MSI GTX 1050 Ti Intel Core i7-8086K 3.7GHz
GeForce GTX 1050 Ti (Desktop)
min:
12.5 fps, P0.1:
12.6 fps, P1:
13.3 fps, max:
19.3 fps
fps
100%
GeForce GTX 1050 Ti (Desktop):
56.1 [X] Aorus Z370 Ultra Gaming Desktop MSI GTX 1050 Ti Intel Core i7-8086K 3.7GHz
GeForce GTX 1050 Ti (Desktop)
min:
7 fps, P1:
41.5 fps, max:
81 fps
fps
100%
GeForce GTX 1050 Ti (Desktop):
25.6 [X] Aorus Z370 Ultra Gaming Desktop MSI GTX 1050 Ti Intel Core i7-8086K 3.7GHz
GeForce GTX 1050 Ti (Desktop)
min:
8 fps, P1:
21.2 fps, max:
55 fps
fps
100%
GeForce GTX 1050 Ti (Desktop):
18.1 [X] Aorus Z370 Ultra Gaming Desktop MSI GTX 1050 Ti Intel Core i7-8086K 3.7GHz
GeForce GTX 1050 Ti (Desktop)
min:
10 fps, P1:
12.3 fps, max:
47 fps
fps
100%
GeForce GTX 1050 Ti (Desktop):
12.1 [X] Aorus Z370 Ultra Gaming Desktop MSI GTX 1050 Ti Intel Core i7-8086K 3.7GHz
GeForce GTX 1050 Ti (Desktop)
min:
7 fps, P1:
8.3 fps, max:
26 fps
fps
100%
GeForce GTX 1050 Ti (Desktop):
8.6 [X] Aorus Z370 Ultra Gaming Desktop MSI GTX 1050 Ti Intel Core i7-8086K 3.7GHz
GeForce GTX 1050 Ti (Desktop)
min:
6 fps, P1:
6.4 fps, max:
12 fps
fps
100%
GeForce GTX 1050 Ti (Desktop):
44.7 [X] Aorus Z370 Ultra Gaming Desktop MSI GTX 1050 Ti 670054
Intel Core i7-8086K 3.7GHz
GeForce GTX 1050 Ti (Desktop)
min:
34 fps, max:
54 fps
fps
100%
GeForce GTX 1050 Ti (Desktop):
32.3 [X] Aorus Z370 Ultra Gaming Desktop MSI GTX 1050 Ti 670054
Intel Core i7-8086K 3.7GHz
GeForce GTX 1050 Ti (Desktop)
min:
25 fps, max:
38 fps
fps
100%
GeForce GTX 1050 Ti (Desktop):
17.6 [X] Aorus Z370 Ultra Gaming Desktop MSI GTX 1050 Ti 670054
Intel Core i7-8086K 3.7GHz
GeForce GTX 1050 Ti (Desktop)
min:
14 fps, max:
20 fps
fps
100%
GeForce GTX 1050 Ti (Desktop):
200 [X] Aorus Z370 Ultra Gaming Desktop MSI GTX 1050 Ti Intel Core i7-8086K 3.7GHz
GeForce GTX 1050 Ti (Desktop)
fps
100%
GeForce GTX 1050 Ti (Desktop):
71.7 [X] Aorus Z370 Ultra Gaming Desktop MSI GTX 1050 Ti Intel Core i7-8086K 3.7GHz
GeForce GTX 1050 Ti (Desktop)
fps
100%
GeForce GTX 1050 Ti (Desktop):
44.3 □ [X] Aorus Z370 Ultra Gaming Desktop MSI GTX 1050 Ti Intel Core i7-8086K 3.7GHz
GeForce GTX 1050 Ti (Desktop)
fps
100%
GeForce GTX 1050 Ti (Desktop):
32.6 [X] Aorus Z370 Ultra Gaming Desktop MSI GTX 1050 Ti Intel Core i7-8086K 3.7GHz
GeForce GTX 1050 Ti (Desktop)
fps
100%
GeForce GTX 1050 Ti (Desktop):
20.6 [X] Aorus Z370 Ultra Gaming Desktop MSI GTX 1050 Ti Intel Core i7-8086K 3.7GHz
GeForce GTX 1050 Ti (Desktop)
fps
100%
GeForce GTX 1050 Ti (Desktop):
101 [X] Aorus Z370 Ultra Gaming Desktop MSI GTX 1050 Ti Intel Core i7-8086K 3.7GHz
GeForce GTX 1050 Ti (Desktop)
P1:
69 fps
fps
100%
GeForce GTX 1050 Ti (Desktop):
62.9 [X] Aorus Z370 Ultra Gaming Desktop MSI GTX 1050 Ti Intel Core i7-8086K 3.7GHz
GeForce GTX 1050 Ti (Desktop)
P1:
55.2 fps
fps
100%
GeForce GTX 1050 Ti (Desktop):
55.5 [X] Aorus Z370 Ultra Gaming Desktop MSI GTX 1050 Ti Intel Core i7-8086K 3.7GHz
GeForce GTX 1050 Ti (Desktop)
P1:
36.4 fps
fps
100%
GeForce GTX 1050 Ti (Desktop):
52.9 [X] Aorus Z370 Ultra Gaming Desktop MSI GTX 1050 Ti Intel Core i7-8086K 3.7GHz
GeForce GTX 1050 Ti (Desktop)
P1:
33.1 fps
fps
100%
GeForce GTX 1050 Ti (Desktop):
39.3 [X] Aorus Z370 Ultra Gaming Desktop MSI GTX 1050 Ti Intel Core i7-8086K 3.7GHz
GeForce GTX 1050 Ti (Desktop)
P1:
25.4 fps
fps
100%
GeForce GTX 1050 Ti (Desktop):
109 [X] Aorus Z370 Ultra Gaming Desktop MSI GTX 1050 Ti Intel Core i7-8086K 3.7GHz
GeForce GTX 1050 Ti (Desktop)
min:
97 fps, max:
124 fps
fps
100%
GeForce GTX 1050 Ti (Desktop):
41.6 [X] Aorus Z370 Ultra Gaming Desktop MSI GTX 1050 Ti Intel Core i7-8086K 3.7GHz
GeForce GTX 1050 Ti (Desktop)
min:
39 fps, max:
45 fps
fps
100%
GeForce GTX 1050 Ti (Desktop):
33.5 [X] Aorus Z370 Ultra Gaming Desktop MSI GTX 1050 Ti Intel Core i7-8086K 3.7GHz
GeForce GTX 1050 Ti (Desktop)
min:
30 fps, max:
36 fps
fps
100%
GeForce GTX 1050 Ti (Desktop):
50.9 [X] Aorus Z370 Ultra Gaming Desktop MSI GTX 1050 Ti Intel Core i7-8086K 3.7GHz
GeForce GTX 1050 Ti (Desktop)
min:
41 fps, max:
56 fps
fps
100%
GeForce GTX 1050 Ti (Desktop):
40.2 [X] Aorus Z370 Ultra Gaming Desktop MSI GTX 1050 Ti Intel Core i7-8086K 3.7GHz
GeForce GTX 1050 Ti (Desktop)
min:
28 fps, max:
55 fps
fps
100%
GeForce GTX 1050 Ti (Desktop):
32.4 [X] Aorus Z370 Ultra Gaming Desktop MSI GTX 1050 Ti Intel Core i7-8086K 3.7GHz
GeForce GTX 1050 Ti (Desktop)
min:
24 fps, max:
39 fps
fps
100%
GeForce GTX 1050 Ti (Desktop):
75 [X] MSI GeForce GTX 1050 Ti Intel Core i7-7740X 4.3GHz
GeForce GTX 1050 Ti (Desktop)
min:
13 fps, P1:
66.7 fps, max:
140 fps
fps
100%
GeForce GTX 1050 Ti (Desktop):
34.8 [X] MSI GeForce GTX 1050 Ti Intel Core i7-7740X 4.3GHz
GeForce GTX 1050 Ti (Desktop)
min:
24 fps, P1:
30.3 fps, max:
135 fps
fps
100%
GeForce GTX 1050 Ti (Desktop):
22.3 [X] MSI GeForce GTX 1050 Ti Intel Core i7-7740X 4.3GHz
GeForce GTX 1050 Ti (Desktop)
min:
16.7 fps, P1:
17.5 fps, max:
128 fps
fps
100%
GeForce GTX 1050 Ti (Desktop):
14.3 [X] MSI GeForce GTX 1050 Ti Intel Core i7-7740X 4.3GHz
GeForce GTX 1050 Ti (Desktop)
min:
5.82 fps, P1:
10 fps, max:
128 fps
fps
100%
GeForce GTX 1050 Ti (Desktop):
43.2 [X] MSI GeForce GTX 1050 Ti Intel Core i7-7740X 4.3GHz
GeForce GTX 1050 Ti (Desktop)
P1:
31.4 fps
fps
100%
GeForce GTX 1050 Ti (Desktop):
33.9 [X] MSI GeForce GTX 1050 Ti Intel Core i7-7740X 4.3GHz
GeForce GTX 1050 Ti (Desktop)
P1:
24.8 fps
fps
100%
GeForce GTX 1050 Ti (Desktop):
24 [X] MSI GeForce GTX 1050 Ti Intel Core i7-7740X 4.3GHz
GeForce GTX 1050 Ti (Desktop)
P1:
16.6 fps
fps
100%
GeForce GTX 1050 Ti (Desktop):
141 [X] MSI GeForce GTX 1050 Ti Intel Core i7-7740X 4.3GHz
GeForce GTX 1050 Ti (Desktop)
P1:
103.1 fps
fps
100%
GeForce GTX 1050 Ti (Desktop):
107 [X] MSI GeForce GTX 1050 Ti Intel Core i7-7740X 4.3GHz
GeForce GTX 1050 Ti (Desktop)
P1:
84.7 fps
fps
100%
GeForce GTX 1050 Ti (Desktop):
62 [X] MSI GeForce GTX 1050 Ti Intel Core i7-7740X 4.3GHz
GeForce GTX 1050 Ti (Desktop)
P1:
51.5 fps
fps
100%
GeForce GTX 1050 Ti (Desktop):
115 [X] MSI GeForce GTX 1050 Ti Intel Core i7-7740X 4.3GHz
GeForce GTX 1050 Ti (Desktop)
fps
100%
GeForce GTX 1050 Ti (Desktop):
47.5 [X] MSI GeForce GTX 1050 Ti Intel Core i7-7740X 4.3GHz
GeForce GTX 1050 Ti (Desktop)
fps
100%
GeForce GTX 1050 Ti (Desktop):
29.6 [X] MSI GeForce GTX 1050 Ti Intel Core i7-7740X 4.3GHz
GeForce GTX 1050 Ti (Desktop)
fps
100%
GeForce GTX 1050 Ti (Desktop):
21.8 [X] MSI GeForce GTX 1050 Ti Intel Core i7-7740X 4.3GHz
GeForce GTX 1050 Ti (Desktop)
fps
100%
GeForce GTX 1050 Ti (Desktop):
15 [X] MSI GeForce GTX 1050 Ti Intel Core i7-7740X 4.3GHz
GeForce GTX 1050 Ti (Desktop)
fps
100%
GeForce GTX 1050 Ti (Desktop):
94 [X] MSI GeForce GTX 1050 Ti Intel Core i7-7740X 4.3GHz
GeForce GTX 1050 Ti (Desktop)
min:
81 fps, max:
107 fps
fps
100%
GeForce GTX 1050 Ti (Desktop):
29.9 [X] MSI GeForce GTX 1050 Ti Intel Core i7-7740X 4.3GHz
GeForce GTX 1050 Ti (Desktop)
min:
26 fps, max:
34 fps
fps
100%
GeForce GTX 1050 Ti (Desktop):
21.3 [X] MSI GeForce GTX 1050 Ti Intel Core i7-7740X 4.3GHz
GeForce GTX 1050 Ti (Desktop)
min:
18 fps, max:
24 fps
fps
100%
GeForce GTX 1050 Ti (Desktop):
164 [X] MSI GeForce GTX 1050 Ti Intel Core i7-7740X 4.3GHz
GeForce GTX 1050 Ti (Desktop)
min:
143 fps, max:
181 fps
fps
100%
GeForce GTX 1050 Ti (Desktop):
73 [X] MSI GeForce GTX 1050 Ti Intel Core i7-7740X 4.3GHz
GeForce GTX 1050 Ti (Desktop)
min:
65 fps, max:
77 fps
fps
100%
GeForce GTX 1050 Ti (Desktop):
52.8 [X] MSI GeForce GTX 1050 Ti Intel Core i7-7740X 4.3GHz
GeForce GTX 1050 Ti (Desktop)
min:
49 fps, max:
55 fps
fps
100%
GeForce GTX 1050 Ti (Desktop):
37.4 [X] MSI GeForce GTX 1050 Ti Intel Core i7-7740X 4.3GHz
GeForce GTX 1050 Ti (Desktop)
min:
34 fps, max:
39 fps
fps
100%
GeForce GTX 1050 Ti (Desktop):
29.3 [X] MSI GeForce GTX 1050 Ti Intel Core i7-7740X 4.3GHz
GeForce GTX 1050 Ti (Desktop)
min:
27 fps, max:
30 fps
fps
100%
GeForce GTX 1050 Ti (Desktop):
18 [X] MSI GeForce GTX 1050 Ti Intel Core i7-7740X 4.3GHz
GeForce GTX 1050 Ti (Desktop)
min:
15 fps, max:
18 fps
fps
100%
GeForce GTX 1050 Ti (Desktop):
153 [X] MSI GeForce GTX 1050 Ti Intel Core i7-7740X 4.3GHz
GeForce GTX 1050 Ti (Desktop)
min:
128 fps, max:
183 fps
fps
100%
GeForce GTX 1050 Ti (Desktop):
51.4 [X] MSI GeForce GTX 1050 Ti Intel Core i7-7740X 4.3GHz
GeForce GTX 1050 Ti (Desktop)
min:
43 fps, max:
59 fps
fps
100%
GeForce GTX 1050 Ti (Desktop):
31.5 [X] MSI GeForce GTX 1050 Ti Intel Core i7-7740X 4.3GHz
GeForce GTX 1050 Ti (Desktop)
min:
27 fps, max:
36 fps
fps
100%
GeForce GTX 1050 Ti (Desktop):
21.4 [X] MSI GeForce GTX 1050 Ti Intel Core i7-7740X 4.3GHz
GeForce GTX 1050 Ti (Desktop)
min:
18 fps, max:
26 fps
fps
100%
GeForce GTX 1050 Ti (Desktop):
12.8 [X] MSI GeForce GTX 1050 Ti Intel Core i7-7740X 4.3GHz
GeForce GTX 1050 Ti (Desktop)
min:
11 fps, max:
15 fps
fps
100%
GeForce GTX 1050 Ti (Desktop):
156 [X] MSI GeForce GTX 1050 Ti Intel Core i7-7740X 4.3GHz
GeForce GTX 1050 Ti (Desktop)
min:
64.9351 fps, P1:
104.167 fps, max:
322.581 fps
fps
100%
GeForce GTX 1050 Ti (Desktop):
53.6 [X] MSI GeForce GTX 1050 Ti Intel Core i7-7740X 4.3GHz
GeForce GTX 1050 Ti (Desktop)
min:
20.3666 fps, P1:
36.6596 fps, max:
86.9565 fps
fps
100%
GeForce GTX 1050 Ti (Desktop):
41.4 [X] MSI GeForce GTX 1050 Ti Intel Core i7-7740X 4.3GHz
GeForce GTX 1050 Ti (Desktop)
min:
16.8634 fps, P1:
25.3165 fps, max:
83.3333 fps
fps
100%
GeForce GTX 1050 Ti (Desktop):
31.5 [X] MSI GeForce GTX 1050 Ti Intel Core i7-7740X 4.3GHz
GeForce GTX 1050 Ti (Desktop)
min:
15.9744 fps, P1:
20.6612 fps, max:
59.8802 fps
fps
100%
GeForce GTX 1050 Ti (Desktop):
21.5 [X] MSI GeForce GTX 1050 Ti Intel Core i7-7740X 4.3GHz
GeForce GTX 1050 Ti (Desktop)
min:
12.3609 fps, P1:
16.3319 fps, max:
45.6621 fps
fps
100%
GeForce GTX 1050 Ti (Desktop):
10.2 [X] MSI GeForce GTX 1050 Ti Intel Core i7-7740X 4.3GHz
GeForce GTX 1050 Ti (Desktop)
min:
3.60881 fps, P1:
7.28385 fps, max:
16.7785 fps
fps
100%
GeForce GTX 1050 Ti (Desktop):
149 [X] MSI GeForce GTX 1050 Ti Intel Core i7-7740X 4.3GHz
GeForce GTX 1050 Ti (Desktop)
min:
135 fps, max:
177 fps
fps
100%
GeForce GTX 1050 Ti (Desktop):
67 [X] MSI GeForce GTX 1050 Ti Intel Core i7-7740X 4.3GHz
GeForce GTX 1050 Ti (Desktop)
min:
59 fps, max:
81 fps
fps
100%
GeForce GTX 1050 Ti (Desktop):
52.3 [X] MSI GeForce GTX 1050 Ti Intel Core i7-7740X 4.3GHz
GeForce GTX 1050 Ti (Desktop)
min:
46 fps, max:
63 fps
fps
100%
GeForce GTX 1050 Ti (Desktop):
32.3 [X] MSI GeForce GTX 1050 Ti Intel Core i7-7740X 4.3GHz
GeForce GTX 1050 Ti (Desktop)
min:
29 fps, max:
39 fps
fps
100%
GeForce GTX 1050 Ti (Desktop):
23.5 [X] MSI GeForce GTX 1050 Ti Intel Core i7-7740X 4.3GHz
GeForce GTX 1050 Ti (Desktop)
min:
21 fps, max:
27 fps
fps
100%
GeForce GTX 1050 Ti (Desktop):
13.4 [X] MSI GeForce GTX 1050 Ti Intel Core i7-7740X 4.3GHz
GeForce GTX 1050 Ti (Desktop)
min:
12 fps, max:
15 fps
fps
100%
GeForce GTX 1050 Ti (Desktop):
87 [X] MSI GeForce GTX 1050 Ti Intel Core i7-7740X 4.3GHz
GeForce GTX 1050 Ti (Desktop)
min:
65 fps, max:
111 fps
fps
100%
GeForce GTX 1050 Ti (Desktop):
48 [X] MSI GeForce GTX 1050 Ti Intel Core i7-7740X 4.3GHz
GeForce GTX 1050 Ti (Desktop)
min:
38 fps, max:
58 fps
fps
100%
GeForce GTX 1050 Ti (Desktop):
45 [X] MSI GeForce GTX 1050 Ti Intel Core i7-7740X 4.3GHz
GeForce GTX 1050 Ti (Desktop)
min:
36 fps, max:
54 fps
fps
100%
GeForce GTX 1050 Ti (Desktop):
41 [X] MSI GeForce GTX 1050 Ti Intel Core i7-7740X 4.3GHz
GeForce GTX 1050 Ti (Desktop)
min:
31 fps, max:
51 fps
fps
100%
GeForce GTX 1050 Ti (Desktop):
29 [X] MSI GeForce GTX 1050 Ti Intel Core i7-7740X 4.3GHz
GeForce GTX 1050 Ti (Desktop)
min:
23 fps, max:
36 fps
fps
100%
GeForce GTX 1050 Ti (Desktop):
14 [X] MSI GeForce GTX 1050 Ti Intel Core i7-7740X 4.3GHz
GeForce GTX 1050 Ti (Desktop)
min:
11 fps, max:
18 fps
fps
100%
GeForce GTX 1050 Ti (Desktop):
64.7 [X] MSI GeForce GTX 1050 Ti Intel Core i7-7740X 4.3GHz
GeForce GTX 1050 Ti (Desktop)
min:
34 fps, max:
116 fps
fps
100%
GeForce GTX 1050 Ti (Desktop):
32.8 [X] MSI GeForce GTX 1050 Ti Intel Core i7-7740X 4.3GHz
GeForce GTX 1050 Ti (Desktop)
min:
17 fps, max:
53 fps
fps
100%
GeForce GTX 1050 Ti (Desktop):
24 [X] MSI GeForce GTX 1050 Ti Intel Core i7-7740X 4.3GHz
GeForce GTX 1050 Ti (Desktop)
min:
13 fps, max:
40 fps
fps
100%
GeForce GTX 1050 Ti (Desktop):
19.8 [X] MSI GeForce GTX 1050 Ti Intel Core i7-7740X 4.3GHz
GeForce GTX 1050 Ti (Desktop)
min:
11 fps, max:
32 fps
fps
100%
GeForce GTX 1050 Ti (Desktop):
9.2 [X] MSI GeForce GTX 1050 Ti Intel Core i7-7740X 4.3GHz
GeForce GTX 1050 Ti (Desktop)
min:
6 fps, max:
14 fps
fps
100%
GeForce GTX 1050 Ti (Desktop):
128 [X] MSI GeForce GTX 1050 Ti Intel Core i7-7740X 4.3GHz
GeForce GTX 1050 Ti (Desktop)
min:
115 fps, max:
144 fps
fps
100%
GeForce GTX 1050 Ti (Desktop):
55.6 [X] MSI GeForce GTX 1050 Ti Intel Core i7-7740X 4.3GHz
GeForce GTX 1050 Ti (Desktop)
min:
46 fps, max:
69 fps
fps
100%
GeForce GTX 1050 Ti (Desktop):
46.7 [X] MSI GeForce GTX 1050 Ti Intel Core i7-7740X 4.3GHz
GeForce GTX 1050 Ti (Desktop)
min:
41 fps, max:
57 fps
fps
100%
GeForce GTX 1050 Ti (Desktop):
45 [X] MSI GeForce GTX 1050 Ti Intel Core i7-7740X 4.3GHz
GeForce GTX 1050 Ti (Desktop)
min:
33 fps, max:
57 fps
fps
100%
GeForce GTX 1050 Ti (Desktop):
28.8 [X] MSI GeForce GTX 1050 Ti Intel Core i7-7740X 4.3GHz
GeForce GTX 1050 Ti (Desktop)
min:
25 fps, max:
37 fps
fps
100%
GeForce GTX 1050 Ti (Desktop):
14.1 [X] MSI GeForce GTX 1050 Ti Intel Core i7-7740X 4.3GHz
GeForce GTX 1050 Ti (Desktop)
min:
11 fps, max:
18 fps
fps
100%
GeForce GTX 1050 Ti (Desktop):
41.9 [X] MSI GeForce GTX 1050 Ti Intel Core i7-7740X 4.3GHz
GeForce GTX 1050 Ti (Desktop)
min:
38 fps, max:
45 fps
fps
100%
GeForce GTX 1050 Ti (Desktop):
40.1 [X] MSI GeForce GTX 1050 Ti Intel Core i7-7740X 4.3GHz
GeForce GTX 1050 Ti (Desktop)
min:
37 fps, max:
44 fps
fps
100%
GeForce GTX 1050 Ti (Desktop):
50.9 [X] MSI GeForce GTX 1050 Ti Intel Core i7-7740X 4.3GHz
GeForce GTX 1050 Ti (Desktop)
min:
45 fps, max:
58 fps
fps
100%
GeForce GTX 1050 Ti (Desktop):
43.3 [X] MSI GeForce GTX 1050 Ti Intel Core i7-7740X 4.3GHz
GeForce GTX 1050 Ti (Desktop)
min:
39 fps, max:
49 fps
fps
100%
GeForce GTX 1050 Ti (Desktop):
140 [X] MSI GeForce GTX 1050 Ti Intel Core i7-7740X 4.3GHz
GeForce GTX 1050 Ti (Desktop)
min:
107 fps, max:
186 fps
fps
100%
GeForce GTX 1050 Ti (Desktop):
63 [X] MSI GeForce GTX 1050 Ti Intel Core i7-7740X 4.3GHz
GeForce GTX 1050 Ti (Desktop)
min:
52 fps, max:
92 fps
fps
100%
GeForce GTX 1050 Ti (Desktop):
51.9 [X] MSI GeForce GTX 1050 Ti Intel Core i7-7740X 4.3GHz
GeForce GTX 1050 Ti (Desktop)
min:
42 fps, max:
79 fps
fps
100%
GeForce GTX 1050 Ti (Desktop):
50.9 [X] MSI GeForce GTX 1050 Ti Intel Core i7-7740X 4.3GHz
GeForce GTX 1050 Ti (Desktop)
min:
41 fps, max:
78 fps
fps
100%
GeForce GTX 1050 Ti (Desktop):
35.6 [X] MSI GeForce GTX 1050 Ti Intel Core i7-7740X 4.3GHz
GeForce GTX 1050 Ti (Desktop)
min:
29 fps, max:
55 fps
fps
100%
GeForce GTX 1050 Ti (Desktop):
17.5 [X] MSI GeForce GTX 1050 Ti Intel Core i7-7740X 4.3GHz
GeForce GTX 1050 Ti (Desktop)
min:
13 fps, max:
29 fps
fps
100%
GeForce GTX 1050 Ti (Desktop):
60 [X] MSI GeForce GTX 1050 Ti Intel Core i7-7740X 4.3GHz
GeForce GTX 1050 Ti (Desktop)
min:
48 fps, max:
93 fps
fps
100%
GeForce GTX 1050 Ti (Desktop):
20.3 [X] MSI GeForce GTX 1050 Ti Intel Core i7-7740X 4.3GHz
GeForce GTX 1050 Ti (Desktop)
min:
16 fps, max:
36 fps
fps
100%
GeForce GTX 1050 Ti (Desktop):
46.4 [X] MSI GeForce GTX 1050 Ti Intel Core i7-7740X 4.3GHz
GeForce GTX 1050 Ti (Desktop)
min:
37 fps, max:
57 fps
fps
100%
GeForce GTX 1050 Ti (Desktop):
30.7 [X] MSI GeForce GTX 1050 Ti Intel Core i7-7740X 4.3GHz
GeForce GTX 1050 Ti (Desktop)
min:
23 fps, max:
36 fps
fps
100%
GeForce GTX 1050 Ti (Desktop):
39.1 [X] MSI GeForce GTX 1050 Ti Intel Core i7-7740X 4.3GHz
GeForce GTX 1050 Ti (Desktop)
min:
32 fps, max:
47 fps
fps
100%
GeForce GTX 1050 Ti (Desktop):
53 [X] MSI GeForce GTX 1050 Ti Intel Core i7-7740X 4.3GHz
GeForce GTX 1050 Ti (Desktop)
min:
34 fps, max:
73 fps
fps
100%
GeForce GTX 1050 Ti (Desktop):
47.3 [X] MSI GeForce GTX 1050 Ti Intel Core i7-7740X 4.3GHz
GeForce GTX 1050 Ti (Desktop)
min:
34 fps, max:
63 fps
fps
100%
GeForce GTX 1050 Ti (Desktop):
41.6 [X] MSI GeForce GTX 1050 Ti Intel Core i7-7740X 4.3GHz
GeForce GTX 1050 Ti (Desktop)
min:
30 fps, max:
57 fps
fps
100%
GeForce GTX 1050 Ti (Desktop):
48 [X] MSI GeForce GTX 1050 Ti Intel Core i7-7740X 4.3GHz
GeForce GTX 1050 Ti (Desktop)
min:
18 fps, max:
101 fps
fps
100%
GeForce GTX 1050 Ti (Desktop):
40 [X] MSI GeForce GTX 1050 Ti Intel Core i7-7740X 4.3GHz
GeForce GTX 1050 Ti (Desktop)
min:
17 fps, max:
86 fps
fps
100%
GeForce GTX 1050 Ti (Desktop):
24 [X] MSI GeForce GTX 1050 Ti Intel Core i7-7740X 4.3GHz
GeForce GTX 1050 Ti (Desktop)
min:
12 fps, max:
54 fps
fps
100%
GeForce GTX 1050 Ti (Desktop):
133 [X] MSI GeForce GTX 1050 Ti Intel Core i7-7740X 4.3GHz
GeForce GTX 1050 Ti (Desktop)
min:
115 fps, max:
174 fps
fps
100%
GeForce GTX 1050 Ti (Desktop):
69 [X] MSI GeForce GTX 1050 Ti Intel Core i7-7740X 4.3GHz
GeForce GTX 1050 Ti (Desktop)
min:
60 fps, max:
87 fps
fps
100%
GeForce GTX 1050 Ti (Desktop):
64 [X] MSI GeForce GTX 1050 Ti Intel Core i7-7740X 4.3GHz
GeForce GTX 1050 Ti (Desktop)
min:
56 fps, max:
80 fps
fps
100%
GeForce GTX 1050 Ti (Desktop):
45 [X] MSI GeForce GTX 1050 Ti Intel Core i7-7740X 4.3GHz
GeForce GTX 1050 Ti (Desktop)
min:
37 fps, max:
58 fps
fps
100%
GeForce GTX 1050 Ti (Desktop):
20 [X] MSI GeForce GTX 1050 Ti Intel Core i7-7740X 4.3GHz
GeForce GTX 1050 Ti (Desktop)
min:
13.5 fps, max:
25.2 fps
fps
100%
GeForce GTX 1050 Ti (Desktop):
105 [X] MSI GeForce GTX 1050 Ti Intel Core i7-7740X 4.3GHz
GeForce GTX 1050 Ti (Desktop)
min:
86 fps, max:
113 fps
fps
100%
GeForce GTX 1050 Ti (Desktop):
75 [X] MSI GeForce GTX 1050 Ti Intel Core i7-7740X 4.3GHz
GeForce GTX 1050 Ti (Desktop)
min:
60 fps, max:
80 fps
fps
100%
GeForce GTX 1050 Ti (Desktop):
40.1 [X] MSI GeForce GTX 1050 Ti Intel Core i7-7740X 4.3GHz
GeForce GTX 1050 Ti (Desktop)
min:
33 fps, max:
43 fps
fps
100%
GeForce GTX 1050 Ti (Desktop):
31 [X] MSI GeForce GTX 1050 Ti Intel Core i7-7740X 4.3GHz
GeForce GTX 1050 Ti (Desktop)
min:
23 fps, max:
61 fps
fps
100%
GeForce GTX 1050 Ti (Desktop):
29 [X] MSI GeForce GTX 1050 Ti Intel Core i7-7740X 4.3GHz
GeForce GTX 1050 Ti (Desktop)
min:
23 fps, max:
55 fps
fps
100%
GeForce GTX 1050 Ti (Desktop):
25 [X] MSI GeForce GTX 1050 Ti Intel Core i7-7740X 4.3GHz
GeForce GTX 1050 Ti (Desktop)
min:
17 fps, max:
47 fps
fps
100%
GeForce GTX 1050 Ti (Desktop):
169 [X] Aorus Z370 Ultra Gaming Desktop MSI GTX 1050 Ti 1.47.22.14 D3D12
Intel Core i7-8086K 3.7GHz
GeForce GTX 1050 Ti (Desktop)
min:
133 fps, P1:
138 fps, max:
237 fps
fps
100%
GeForce GTX 1050 Ti (Desktop):
66.6 [X] Aorus Z370 Ultra Gaming Desktop MSI GTX 1050 Ti 1.47.22.14 D3D12
Intel Core i7-8086K 3.7GHz
GeForce GTX 1050 Ti (Desktop)
min:
56.2 fps, P1:
57.3 fps, max:
82.7 fps
fps
100%
GeForce GTX 1050 Ti (Desktop):
49.8 [X] Aorus Z370 Ultra Gaming Desktop MSI GTX 1050 Ti 1.47.22.14 D3D12
Intel Core i7-8086K 3.7GHz
GeForce GTX 1050 Ti (Desktop)
min:
39.1 fps, P1:
39.7 fps, max:
71.6 fps
fps
100%
GeForce GTX 1050 Ti (Desktop):
42.5 [X] Aorus Z370 Ultra Gaming Desktop MSI GTX 1050 Ti 1.47.22.14 D3D12
Intel Core i7-8086K 3.7GHz
GeForce GTX 1050 Ti (Desktop)
min:
33.5 fps, P1:
34.4 fps, max:
60 fps
fps
100%
GeForce GTX 1050 Ti (Desktop):
30.2 [X] Aorus Z370 Ultra Gaming Desktop MSI GTX 1050 Ti 1.47.22.14 D3D12
Intel Core i7-8086K 3.7GHz
GeForce GTX 1050 Ti (Desktop)
min:
25.3 fps, P1:
25.6 fps, max:
40.6 fps
fps
100%
GeForce GTX 1050 Ti (Desktop):
17 [X] Aorus Z370 Ultra Gaming Desktop MSI GTX 1050 Ti 1.47.22.14 D3D12
Intel Core i7-8086K 3.7GHz
GeForce GTX 1050 Ti (Desktop)
min:
14.3 fps, P1:
14.7 fps, max:
22.8 fps
fps
100%
GeForce GTX 1050 Ti (Desktop):
136 [X] MSI GeForce GTX 1050 Ti Intel Core i7-7740X 4.3GHz
GeForce GTX 1050 Ti (Desktop)
min:
105 fps, max:
159 fps
fps
100%
GeForce GTX 1050 Ti (Desktop):
80 [X] MSI GeForce GTX 1050 Ti Intel Core i7-7740X 4.3GHz
GeForce GTX 1050 Ti (Desktop)
min:
67 fps, max:
90 fps
fps
100%
GeForce GTX 1050 Ti (Desktop):
63 [X] MSI GeForce GTX 1050 Ti Intel Core i7-7740X 4.3GHz
GeForce GTX 1050 Ti (Desktop)
min:
55 fps, max:
67 fps
fps
100%
GeForce GTX 1050 Ti (Desktop):
42.4 [X] MSI GeForce GTX 1050 Ti Intel Core i7-7740X 4.3GHz
GeForce GTX 1050 Ti (Desktop)
min:
36 fps, max:
46 fps
fps
100%
GeForce GTX 1050 Ti (Desktop):
29.5 [X] MSI GeForce GTX 1050 Ti Intel Core i7-7740X 4.3GHz
GeForce GTX 1050 Ti (Desktop)
min:
26 fps, max:
31 fps
fps
100%
GeForce GTX 1050 Ti (Desktop):
18.3 [X] MSI GeForce GTX 1050 Ti Intel Core i7-7740X 4.3GHz
GeForce GTX 1050 Ti (Desktop)
min:
16 fps, max:
19 fps
fps
100%
GeForce GTX 1050 Ti (Desktop):
36 [X] MSI GeForce GTX 1050 Ti Intel Core i7-7740X 4.3GHz
GeForce GTX 1050 Ti (Desktop)
min:
32 fps, max:
42 fps
fps
100%
GeForce GTX 1050 Ti (Desktop):
94 [X] Asus Prime X299 Deluxe XMP OC Intel Core i9-9980XE @4.4GHz
GeForce GTX 1050 Ti (Desktop)
102 [X] MSI GeForce GTX 1050 Ti Intel Core i7-7740X 4.3GHz
GeForce GTX 1050 Ti (Desktop)
~ 98 fps
100%
GeForce GTX 1050 Ti (Desktop):
86 [X] Asus Prime X299 Deluxe XMP OC Intel Core i9-9980XE @4.4GHz
GeForce GTX 1050 Ti (Desktop)
92 [X] MSI GeForce GTX 1050 Ti Intel Core i7-7740X 4.3GHz
GeForce GTX 1050 Ti (Desktop)
~ 89 fps
100%
GeForce GTX 1050 Ti (Desktop):
74 [X] Asus Prime X299 Deluxe XMP OC Intel Core i9-9980XE @4.4GHz
GeForce GTX 1050 Ti (Desktop)
79 [X] MSI GeForce GTX 1050 Ti Intel Core i7-7740X 4.3GHz
GeForce GTX 1050 Ti (Desktop)
~ 77 fps
100%
GeForce GTX 1050 Ti (Desktop):
41.7 [X] MSI GeForce GTX 1050 Ti Intel Core i7-7740X 4.3GHz
GeForce GTX 1050 Ti (Desktop)
fps
100%
GeForce GTX 1050 Ti (Desktop):
35.2 [X] Intel Core i7-4790K 4GHz
GeForce GTX 1050 Ti (Desktop)
min:
28 fps, max:
41 fps
fps
100%
GeForce GTX 1050 Ti (Desktop):
26.6 [X] Intel Core i7-4790K 4GHz
GeForce GTX 1050 Ti (Desktop)
min:
20 fps, max:
32 fps
fps
100%
GeForce GTX 1050 Ti (Desktop):
62 [X] Intel Core i7-4790K 4GHz
GeForce GTX 1050 Ti (Desktop)
min:
41 fps, max:
78 fps
fps
100%
GeForce GTX 1050 Ti (Desktop):
33.3 [X] Intel Core i7-4790K 4GHz
GeForce GTX 1050 Ti (Desktop)
min:
26 fps, max:
45 fps
fps
100%
GeForce GTX 1050 Ti (Desktop):
22.7 [X] Intel Core i7-4790K 4GHz
GeForce GTX 1050 Ti (Desktop)
max:
36 fps
fps
100%
GeForce GTX 1050 Ti (Desktop):
65 [X] Intel Core i7-4790K 4GHz
GeForce GTX 1050 Ti (Desktop)
min:
53 fps, max:
78 fps
fps
100%
GeForce GTX 1050 Ti (Desktop):
44.8 [X] Intel Core i7-4790K 4GHz
GeForce GTX 1050 Ti (Desktop)
min:
36 fps, max:
55 fps
fps
100%
GeForce GTX 1050 Ti (Desktop):
12.5 [X] Intel Core i7-4790K 4GHz
GeForce GTX 1050 Ti (Desktop)
min:
9 fps, max:
15 fps
fps
100%
GeForce GTX 1050 Ti (Desktop):
127 [X] Intel Core i7-4790K 4GHz
GeForce GTX 1050 Ti (Desktop)
min:
85 fps, max:
144 fps
fps
100%
GeForce GTX 1050 Ti (Desktop):
55.1 [X] Intel Core i7-4790K 4GHz
GeForce GTX 1050 Ti (Desktop)
min:
43 fps, max:
64 fps
fps
100%
GeForce GTX 1050 Ti (Desktop):
49.5 [X] Intel Core i7-4790K 4GHz
GeForce GTX 1050 Ti (Desktop)
min:
38 fps, max:
57 fps
fps
100%
GeForce GTX 1050 Ti (Desktop):
35.5 [X] Intel Core i7-4790K 4GHz
GeForce GTX 1050 Ti (Desktop)
min:
25 fps, max:
40 fps
fps
100%
GeForce GTX 1050 Ti (Desktop):
11.4 [X] Intel Core i7-4790K 4GHz
GeForce GTX 1050 Ti (Desktop)
min:
8 fps, max:
13 fps
fps
100%
GeForce GTX 1050 Ti (Desktop):
52.2 [X] MSI GeForce GTX 1050 Ti Intel Core i7-7740X 4.3GHz
GeForce GTX 1050 Ti (Desktop)
min:
38 fps, max:
74 fps
fps
100%
GeForce GTX 1050 Ti (Desktop):
30.7 [X] MSI GeForce GTX 1050 Ti Intel Core i7-7740X 4.3GHz
GeForce GTX 1050 Ti (Desktop)
min:
24 fps, max:
43 fps
fps
100%
GeForce GTX 1050 Ti (Desktop):
143 [X] Intel Core i7-4790K 4GHz
GeForce GTX 1050 Ti (Desktop)
fps
27%
Radeon R7 M340:
38.4 fps
100%
GeForce GTX 1050 Ti (Desktop):
82 [X] Intel Core i7-4790K 4GHz
GeForce GTX 1050 Ti (Desktop)
min:
66 fps, max:
105 fps
fps
100%
GeForce GTX 1050 Ti (Desktop):
66.6 [X] Intel Core i7-4790K 4GHz
GeForce GTX 1050 Ti (Desktop)
min:
56 fps, max:
84 fps
fps
100%
GeForce GTX 1050 Ti (Desktop):
23 [X] Intel Core i7-4790K 4GHz
GeForce GTX 1050 Ti (Desktop)
min:
19 fps, max:
29 fps
fps
100%
GeForce GTX 1050 Ti (Desktop):
30 [X] Intel Core i7-4790K 4GHz
GeForce GTX 1050 Ti (Desktop)
min:
23 fps, max:
43 fps
fps
100%
GeForce GTX 1050 Ti (Desktop):
25.9 [X] Intel Core i7-4790K 4GHz
GeForce GTX 1050 Ti (Desktop)
min:
20 fps, max:
37 fps
fps
100%
GeForce GTX 1050 Ti (Desktop):
52.7 [X] Intel Core i7-4790K 4GHz
GeForce GTX 1050 Ti (Desktop)
min:
40 fps, max:
71 fps
fps
100%
GeForce GTX 1050 Ti (Desktop):
34.8 [X] Intel Core i7-4790K 4GHz
GeForce GTX 1050 Ti (Desktop)
min:
30 fps, max:
46 fps
fps
100%
GeForce GTX 1050 Ti (Desktop):
31.4 [X] Intel Core i7-4790K 4GHz
GeForce GTX 1050 Ti (Desktop)
min:
28 fps, max:
40 fps
fps
100%
GeForce GTX 1050 Ti (Desktop):
13.2 [X] Intel Core i7-4790K 4GHz
GeForce GTX 1050 Ti (Desktop)
min:
12 fps, max:
16 fps
fps
100%
GeForce GTX 1050 Ti (Desktop):
198 [X] Intel Core i7-4790K 4GHz
GeForce GTX 1050 Ti (Desktop)
min:
152 fps, max:
257 fps
fps
100%
GeForce GTX 1050 Ti (Desktop):
71.4 [X] Intel Core i7-4790K 4GHz
GeForce GTX 1050 Ti (Desktop)
min:
58 fps, max:
83 fps
fps
100%
GeForce GTX 1050 Ti (Desktop):
68 [X] Intel Core i7-4790K 4GHz
GeForce GTX 1050 Ti (Desktop)
min:
54 fps, max:
81 fps
fps
100%
GeForce GTX 1050 Ti (Desktop):
48.9 [X] Intel Core i7-4790K 4GHz
GeForce GTX 1050 Ti (Desktop)
min:
35 fps, max:
67 fps
fps
100%
GeForce GTX 1050 Ti (Desktop):
19.7 [X] Intel Core i7-4790K 4GHz
GeForce GTX 1050 Ti (Desktop)
min:
15 fps, max:
43 fps
fps
100%
GeForce GTX 1050 Ti (Desktop):
70 [X] Intel Core i7-4790K 4GHz
GeForce GTX 1050 Ti (Desktop)
min:
56 fps, max:
81 fps
fps
100%
GeForce GTX 1050 Ti (Desktop):
58.4 [X] Intel Core i7-4790K 4GHz
GeForce GTX 1050 Ti (Desktop)
min:
48 fps, max:
68 fps
fps
100%
GeForce GTX 1050 Ti (Desktop):
18.6 [X] Intel Core i7-4790K 4GHz
GeForce GTX 1050 Ti (Desktop)
min:
15 fps, max:
23 fps
fps
100%
GeForce GTX 1050 Ti (Desktop):
45.4 [X] Intel Core i7-4790K 4GHz
GeForce GTX 1050 Ti (Desktop)
min:
40 fps, max:
51 fps
fps
100%
GeForce GTX 1050 Ti (Desktop):
28.5 [X] Intel Core i7-4790K 4GHz
GeForce GTX 1050 Ti (Desktop)
min:
22 fps, max:
34 fps
fps
100%
GeForce GTX 1050 Ti (Desktop):
15.2 [X] Intel Core i7-4790K 4GHz
GeForce GTX 1050 Ti (Desktop)
min:
13 fps, max:
19 fps
fps
100%
GeForce GTX 1050 Ti (Desktop):
82 [X] Intel Core i7-4790K 4GHz
GeForce GTX 1050 Ti (Desktop)
min:
70 fps, max:
99 fps
fps
100%
GeForce GTX 1050 Ti (Desktop):
73 [X] Intel Core i7-4790K 4GHz
GeForce GTX 1050 Ti (Desktop)
min:
64 fps, max:
88 fps
fps
100%
GeForce GTX 1050 Ti (Desktop):
41.1 [X] Intel Core i7-4790K 4GHz
GeForce GTX 1050 Ti (Desktop)
min:
32 fps, max:
50 fps
fps
100%
GeForce GTX 1050 Ti (Desktop):
38.7 [X] Intel Core i7-4790K 4GHz
GeForce GTX 1050 Ti (Desktop)
min:
32 fps, max:
48 fps
fps
100%
GeForce GTX 1050 Ti (Desktop):
21.9 [X] Intel Core i7-4790K 4GHz
GeForce GTX 1050 Ti (Desktop)
min:
17 fps, max:
27 fps
fps
100%
GeForce GTX 1050 Ti (Desktop):
60.5 [X] Intel Core i7-4790K 4GHz
GeForce GTX 1050 Ti (Desktop)
min:
43 fps, max:
98 fps
fps
100%
GeForce GTX 1050 Ti (Desktop):
26.1 [X] Intel Core i7-4790K 4GHz
GeForce GTX 1050 Ti (Desktop)
min:
19 fps, max:
40 fps
fps
100%
GeForce GTX 1050 Ti (Desktop):
62 [X] Intel Core i7-4790K 4GHz
GeForce GTX 1050 Ti (Desktop)
min:
51 fps, max:
80 fps
fps
100%
GeForce GTX 1050 Ti (Desktop):
56.6 [X] Intel Core i7-4790K 4GHz
GeForce GTX 1050 Ti (Desktop)
min:
46 fps, max:
72 fps
fps
100%
GeForce GTX 1050 Ti (Desktop):
18.5 [X] Intel Core i7-4790K 4GHz
GeForce GTX 1050 Ti (Desktop)
min:
15 fps, max:
23 fps
fps
100%
GeForce GTX 1050 Ti (Desktop):
113 [X] Intel Core i7-4790K 4GHz
GeForce GTX 1050 Ti (Desktop)
min:
105 fps, max:
141 fps
fps
100%
GeForce GTX 1050 Ti (Desktop):
51.1 [X] Intel Core i7-4790K 4GHz
GeForce GTX 1050 Ti (Desktop)
min:
47 fps, max:
63 fps
fps
100%
GeForce GTX 1050 Ti (Desktop):
199 [X] Intel Core i7-4790K 4GHz
GeForce GTX 1050 Ti (Desktop)
min:
195 fps, max:
201 fps
fps
100%
GeForce GTX 1050 Ti (Desktop):
144 [X] Intel Core i7-4790K 4GHz
GeForce GTX 1050 Ti (Desktop)
min:
137 fps, max:
159 fps
fps
100%
GeForce GTX 1050 Ti (Desktop):
69 [X] Intel Core i7-4790K 4GHz
GeForce GTX 1050 Ti (Desktop)
min:
62 fps, max:
73 fps
fps
100%
GeForce GTX 1050 Ti (Desktop):
62.4 [X] Intel Core i7-4790K 4GHz
GeForce GTX 1050 Ti (Desktop)
min:
53 fps, max:
68 fps
fps
100%
GeForce GTX 1050 Ti (Desktop):
25.2 [X] Intel Core i7-4790K 4GHz
GeForce GTX 1050 Ti (Desktop)
min:
21 fps, max:
27 fps
fps
100%
GeForce GTX 1050 Ti (Desktop):
57.5 [X] Intel Core i7-4790K 4GHz
GeForce GTX 1050 Ti (Desktop)
min:
42 fps, max:
86 fps
fps
100%
GeForce GTX 1050 Ti (Desktop):
47.3 [X] Intel Core i7-4790K 4GHz
GeForce GTX 1050 Ti (Desktop)
min:
36 fps, max:
71 fps
fps
100%
GeForce GTX 1050 Ti (Desktop):
36.3 [X] Intel Core i7-4790K 4GHz
GeForce GTX 1050 Ti (Desktop)
min:
29 fps, max:
53 fps
fps
100%
GeForce GTX 1050 Ti (Desktop):
68.2 [X] Intel Core i7-4790K 4GHz
GeForce GTX 1050 Ti (Desktop)
min:
61 fps, max:
79 fps
fps
100%
GeForce GTX 1050 Ti (Desktop):
41.8 [X] Intel Core i7-4790K 4GHz
GeForce GTX 1050 Ti (Desktop)
min:
37 fps, max:
49 fps
fps
100%
GeForce GTX 1050 Ti (Desktop):
22.1 [X] Intel Core i7-4790K 4GHz
GeForce GTX 1050 Ti (Desktop)
min:
19 fps, max:
25 fps
fps
100%
GeForce GTX 1050 Ti (Desktop):
187 [X] Intel Core i7-4790K 4GHz
GeForce GTX 1050 Ti (Desktop)
min:
135 fps, max:
215 fps
fps
100%
GeForce GTX 1050 Ti (Desktop):
72 [X] Intel Core i7-4790K 4GHz
GeForce GTX 1050 Ti (Desktop)
min:
55 fps, max:
78 fps
fps
100%
GeForce GTX 1050 Ti (Desktop):
61.4 [X] Intel Core i7-4790K 4GHz
GeForce GTX 1050 Ti (Desktop)
min:
49 fps, max:
78 fps
fps
100%
GeForce GTX 1050 Ti (Desktop):
32.7 [X] Intel Core i7-4790K 4GHz
GeForce GTX 1050 Ti (Desktop)
min:
27 fps, max:
39 fps
fps
100%
GeForce GTX 1050 Ti (Desktop):
22.8 [X] Intel Core i7-4790K 4GHz
GeForce GTX 1050 Ti (Desktop)
min:
18 fps, max:
28 fps
fps
100%
GeForce GTX 1050 Ti (Desktop):
79 [X] Intel Core i7-4790K 4GHz
GeForce GTX 1050 Ti (Desktop)
min:
51 fps, max:
104 fps
fps
100%
GeForce GTX 1050 Ti (Desktop):
44.6 [X] Intel Core i7-4790K 4GHz
GeForce GTX 1050 Ti (Desktop)
min:
36 fps, max:
53 fps
fps
100%
GeForce GTX 1050 Ti (Desktop):
20.7 [X] Intel Core i7-4790K 4GHz
GeForce GTX 1050 Ti (Desktop)
min:
15 fps, max:
25 fps
fps
100%
GeForce GTX 1050 Ti (Desktop):
46.5 [X] Intel Core i7-4790K 4GHz
GeForce GTX 1050 Ti (Desktop)
min:
43 fps, max:
50 fps
fps
100%
GeForce GTX 1050 Ti (Desktop):
114 [X] Intel Core i7-4790K 4GHz
GeForce GTX 1050 Ti (Desktop)
min:
94 fps, max:
132 fps
fps
100%
GeForce GTX 1050 Ti (Desktop):
68 [X] Intel Core i7-4790K 4GHz
GeForce GTX 1050 Ti (Desktop)
min:
58 fps, max:
82 fps
fps
100%
GeForce GTX 1050 Ti (Desktop):
35.6 [X] Intel Core i7-4790K 4GHz
GeForce GTX 1050 Ti (Desktop)
min:
31 fps, max:
42 fps
fps
100%
GeForce GTX 1050 Ti (Desktop):
69 [X] Intel Core i7-4790K 4GHz
GeForce GTX 1050 Ti (Desktop)
min:
58 fps, max:
94 fps
fps
100%
GeForce GTX 1050 Ti (Desktop):
23.3 [X] OGL
Intel Core i7-4790K 4GHz
GeForce GTX 1050 Ti (Desktop)
min:
19 fps, max:
31 fps
fps
100%
GeForce GTX 1050 Ti (Desktop):
40.4 [X] DX12
Intel Core i7-4790K 4GHz
GeForce GTX 1050 Ti (Desktop)
42.9 [X] DX11
Intel Core i7-4790K 4GHz
GeForce GTX 1050 Ti (Desktop)
43.9 ~ 42 fps
100%
GeForce GTX 1050 Ti (Desktop):
37.9 [X] DX11
Intel Core i7-4790K 4GHz
GeForce GTX 1050 Ti (Desktop)
39.1 ~ 39 fps
100%
GeForce GTX 1050 Ti (Desktop):
12.8 [X] DX12
Intel Core i7-4790K 4GHz
GeForce GTX 1050 Ti (Desktop)
fps
100%
GeForce GTX 1050 Ti (Desktop):
88 [X] Intel Core i7-4790K 4GHz
GeForce GTX 1050 Ti (Desktop)
min:
61 fps, max:
107 fps
fps
100%
GeForce GTX 1050 Ti (Desktop):
34.5 [X] DX11
Intel Core i7-4790K 4GHz
GeForce GTX 1050 Ti (Desktop)
min:
25 fps, max:
44 fps
fps
100%
GeForce GTX 1050 Ti (Desktop):
32.7 [X] DX11
Intel Core i7-4790K 4GHz
GeForce GTX 1050 Ti (Desktop)
min:
23 fps, max:
42 fps
fps
100%
GeForce GTX 1050 Ti (Desktop):
135 [X] Intel Core i7-4790K 4GHz
GeForce GTX 1050 Ti (Desktop)
min:
118 fps, max:
151 fps
fps
100%
GeForce GTX 1050 Ti (Desktop):
61 [X] Intel Core i7-4790K 4GHz
GeForce GTX 1050 Ti (Desktop)
min:
56 fps, max:
68 fps
fps
100%
GeForce GTX 1050 Ti (Desktop):
54 [X] Intel Core i7-4790K 4GHz
GeForce GTX 1050 Ti (Desktop)
min:
49 fps, max:
60 fps
fps
100%
GeForce GTX 1050 Ti (Desktop):
41 [X] Intel Core i7-4790K 4GHz
GeForce GTX 1050 Ti (Desktop)
min:
32 fps, max:
49 fps
fps
100%
GeForce GTX 1050 Ti (Desktop):
48.9 [X] Intel Core i7-4790K 4GHz
GeForce GTX 1050 Ti (Desktop)
min:
45 fps, max:
53 fps
fps
100%
GeForce GTX 1050 Ti (Desktop):
40.7 [X] Intel Core i7-4790K 4GHz
GeForce GTX 1050 Ti (Desktop)
min:
37 fps, max:
45 fps
fps
100%
GeForce GTX 1050 Ti (Desktop):
272 [X] Intel Core i7-4790K 4GHz
GeForce GTX 1050 Ti (Desktop)
fps
100%
GeForce GTX 1050 Ti (Desktop):
181 [X] Intel Core i7-4790K 4GHz
GeForce GTX 1050 Ti (Desktop)
min:
103 fps, max:
275 fps
fps
100%
GeForce GTX 1050 Ti (Desktop):
95 [X] Intel Core i7-4790K 4GHz
GeForce GTX 1050 Ti (Desktop)
min:
63 fps, max:
148 fps
fps
100%
GeForce GTX 1050 Ti (Desktop):
79 [X] Intel Core i7-4790K 4GHz
GeForce GTX 1050 Ti (Desktop)
min:
56 fps, max:
104 fps
fps
100%
GeForce GTX 1050 Ti (Desktop):
61 [X] Intel Core i7-4790K 4GHz
GeForce GTX 1050 Ti (Desktop)
min:
52 fps, max:
74 fps
fps
9%
Radeon R7 M340:
5.3 fps
100%
GeForce GTX 1050 Ti (Desktop):
21.6 [X] Intel Core i7-4790K 4GHz
GeForce GTX 1050 Ti (Desktop)
min:
18 fps, max:
26 fps
fps
100%
GeForce GTX 1050 Ti (Desktop):
52.6 [X] Intel Core i7-4790K 4GHz
GeForce GTX 1050 Ti (Desktop)
min:
48 fps, max:
58 fps
fps
100%
GeForce GTX 1050 Ti (Desktop):
22.9 [X] Intel Core i7-4790K 4GHz
GeForce GTX 1050 Ti (Desktop)
min:
18 fps, max:
27 fps
fps
100%
GeForce GTX 1050 Ti (Desktop):
46.4 [X] Intel Core i7-4790K 4GHz
GeForce GTX 1050 Ti (Desktop)
min:
38 fps, max:
58 fps
fps
14%
Radeon R7 M340:
6.6 fps
100%
GeForce GTX 1050 Ti (Desktop):
61.8 [X] Intel Core i7-4790K 4GHz
GeForce GTX 1050 Ti (Desktop)
min:
56 fps, max:
66 fps
fps
11%
Radeon R7 M340:
6.9 fps
100%
GeForce GTX 1050 Ti (Desktop):
20.7 [X] Intel Core i7-4790K 4GHz
GeForce GTX 1050 Ti (Desktop)
min:
17 fps, max:
23 fps
fps
16%
Radeon R7 M340:
3.3 fps
100%
GeForce GTX 1050 Ti (Desktop):
113 [X] Intel Core i7-4790K 4GHz
GeForce GTX 1050 Ti (Desktop)
min:
86 fps, max:
152 fps
fps
11%
Radeon R7 M340:
11.9 fps
100%
GeForce GTX 1050 Ti (Desktop):
35.7 [X] Intel Core i7-4790K 4GHz
GeForce GTX 1050 Ti (Desktop)
min:
22 fps, max:
54 fps
fps
Radeon R7 M340:
44 57 ~ 51 fps
Radeon R7 M340:
26.2 40 ~ 33 fps
Radeon R7 M340:
12.7 14 ~ 13 fps
100%
GeForce GTX 1050 Ti (Desktop):
79 [X] Intel Core i7-4790K 4GHz
GeForce GTX 1050 Ti (Desktop)
min:
72 fps, max:
87 fps
fps
13%
Radeon R7 M340:
10.2 fps
100%
GeForce GTX 1050 Ti (Desktop):
26.9 [X] Intel Core i7-4790K 4GHz
GeForce GTX 1050 Ti (Desktop)
min:
24 fps, max:
30 fps
fps
100%
GeForce GTX 1050 Ti (Desktop):
178 [X] Asus Prime X299 Deluxe XMP OC Intel Core i9-9980XE @4.4GHz
GeForce GTX 1050 Ti (Desktop)
min:
153.9 fps
fps
26%
Radeon R7 M340:
46 fps
100%
GeForce GTX 1050 Ti (Desktop):
161 [X] Asus Prime X299 Deluxe XMP OC Intel Core i9-9980XE @4.4GHz
GeForce GTX 1050 Ti (Desktop)
min:
141.3 fps
fps
24%
Radeon R7 M340:
38 fps
100%
GeForce GTX 1050 Ti (Desktop):
141 [X] Asus Prime X299 Deluxe XMP OC Intel Core i9-9980XE @4.4GHz
GeForce GTX 1050 Ti (Desktop)
min:
123.3 fps
fps
15%
Radeon R7 M340:
21 fps
100%
GeForce GTX 1050 Ti (Desktop):
125 [X] Asus Prime X299 Deluxe XMP OC Intel Core i9-9980XE @4.4GHz
GeForce GTX 1050 Ti (Desktop)
min:
107.3 fps
fps
14%
Radeon R7 M340:
18 fps
100%
GeForce GTX 1050 Ti (Desktop):
63 [X] Intel Core i7-4790K 4GHz
GeForce GTX 1050 Ti (Desktop)
min:
58 fps
fps
Radeon R7 M340:
11 [X] HP ProBook 450 G3 P4P34EA Intel Core i7-6500U 2.5GHz
Radeon R7 M340
19 19 20 [X] HP ProBook 470 G3 W4P78EA Intel Core i5-6200U 2.3GHz
Radeon R7 M340
~ 17 fps
Radeon R7 M340:
8 [X] HP ProBook 450 G3 P4P34EA Intel Core i7-6500U 2.5GHz
Radeon R7 M340
16 16 [X] HP ProBook 470 G3 W4P78EA Intel Core i5-6200U 2.3GHz
Radeon R7 M340
~ 13 fps
Radeon R7 M340:
7 8 [X] HP ProBook 470 G3 W4P78EA Intel Core i5-6200U 2.3GHz
Radeon R7 M340
~ 8 fps
Radeon R7 M340:
18.3 19 ~ 19 fps
100%
GeForce GTX 1050 Ti (Desktop):
49.4 [X] Intel Core i7-4790K 4GHz
GeForce GTX 1050 Ti (Desktop)
min:
41 fps, max:
54 fps
fps
14%
Radeon R7 M340:
6.7 fps
100%
GeForce GTX 1050 Ti (Desktop):
24 27.5 [X] Intel Core i7-4790K 4GHz
GeForce GTX 1050 Ti (Desktop)
min:
22 fps, max:
32 fps
~ 26 fps
15%
Radeon R7 M340:
3.9 fps
100%
GeForce GTX 1050 Ti (Desktop):
62.1 [X] Intel Core i7-4790K 4GHz
GeForce GTX 1050 Ti (Desktop)
min:
51 fps, max:
75 fps
fps
20%
Radeon R7 M340:
12.5 fps
100%
GeForce GTX 1050 Ti (Desktop):
52.7 [X] Intel Core i7-4790K 4GHz
GeForce GTX 1050 Ti (Desktop)
min:
46 fps, max:
67 fps
fps
100%
GeForce GTX 1050 Ti (Desktop):
176 [X] Aorus Z370 Ultra Gaming Desktop MSI GTX 1050 Ti Intel Core i7-8086K 3.7GHz
GeForce GTX 1050 Ti (Desktop)
min:
3.93 fps, P1:
125 fps, max:
337 fps
fps
100%
GeForce GTX 1050 Ti (Desktop):
169 [X] Aorus Z370 Ultra Gaming Desktop MSI GTX 1050 Ti Intel Core i7-8086K 3.7GHz
GeForce GTX 1050 Ti (Desktop)
min:
20.6 fps, P1:
125 fps, max:
258 fps
fps
100%
GeForce GTX 1050 Ti (Desktop):
88.8 [X] Aorus Z370 Ultra Gaming Desktop MSI GTX 1050 Ti Intel Core i7-8086K 3.7GHz
GeForce GTX 1050 Ti (Desktop)
min:
10.1 fps, P1:
62.5 fps, max:
163 fps
fps
100%
GeForce GTX 1050 Ti (Desktop):
36.4 [X] Intel Core i7-4790K 4GHz
GeForce GTX 1050 Ti (Desktop)
min:
22.1 fps, max:
102 fps
41.2 [X] Aorus Z370 Ultra Gaming Desktop MSI GTX 1050 Ti Intel Core i7-8086K 3.7GHz
GeForce GTX 1050 Ti (Desktop)
min:
6.32 fps, P1:
27.8 fps, max:
110 fps
~ 39 fps
100%
GeForce GTX 1050 Ti (Desktop):
29.4 [X] Aorus Z370 Ultra Gaming Desktop MSI GTX 1050 Ti Intel Core i7-8086K 3.7GHz
GeForce GTX 1050 Ti (Desktop)
min:
5.25 fps, P1:
20.8 fps, max:
79.5 fps
fps
100%
GeForce GTX 1050 Ti (Desktop):
27.8 [X] Aorus Z370 Ultra Gaming Desktop MSI GTX 1050 Ti Intel Core i7-8086K 3.7GHz
GeForce GTX 1050 Ti (Desktop)
min:
6.34 fps, P1:
20.8 fps, max:
126 fps
fps
100%
GeForce GTX 1050 Ti (Desktop):
39.9 [X] Intel Core i7-4790K 4GHz
GeForce GTX 1050 Ti (Desktop)
min:
29 fps
fps
12%
Radeon R7 M340:
4.9 fps
100%
GeForce GTX 1050 Ti (Desktop):
84 [X] Intel Core i7-4790K 4GHz
GeForce GTX 1050 Ti (Desktop)
fps
16%
Radeon R7 M340:
13.8 fps
100%
GeForce GTX 1050 Ti (Desktop):
58.2 [X] Intel Core i7-4790K 4GHz
GeForce GTX 1050 Ti (Desktop)
min:
25 fps, max:
165 fps
fps
14%
Radeon R7 M340:
8.1 fps
100%
GeForce GTX 1050 Ti (Desktop):
66 [X] Intel Core i7-4790K 4GHz
GeForce GTX 1050 Ti (Desktop)
min:
58 fps, max:
81 fps
fps
100%
GeForce GTX 1050 Ti (Desktop):
30.2 [X] Intel Core i7-4790K 4GHz
GeForce GTX 1050 Ti (Desktop)
min:
27 fps, max:
36 fps
fps
Radeon R7 M340:
59.8 [X] HP ProBook 450 G3 P4P34EA Intel Core i7-6500U 2.5GHz
Radeon R7 M340
65.5 [X] HP ProBook 470 G3 W4P78EA Intel Core i5-6200U 2.3GHz
Radeon R7 M340
~ 63 fps
Radeon R7 M340:
46.7 [X] HP ProBook 450 G3 P4P34EA Intel Core i7-6500U 2.5GHz
Radeon R7 M340
48.9 [X] HP ProBook 470 G3 W4P78EA Intel Core i5-6200U 2.3GHz
Radeon R7 M340
~ 48 fps
Radeon R7 M340:
41.3 [X] HP ProBook 450 G3 P4P34EA Intel Core i7-6500U 2.5GHz
Radeon R7 M340
41.9 [X] HP ProBook 470 G3 W4P78EA Intel Core i5-6200U 2.3GHz
Radeon R7 M340
~ 42 fps
Radeon R7 M340:
7.3 [X] HP ProBook 450 G3 P4P34EA Intel Core i7-6500U 2.5GHz
Radeon R7 M340
7.6 [X] HP ProBook 470 G3 W4P78EA Intel Core i5-6200U 2.3GHz
Radeon R7 M340
~ 7 fps
100%
GeForce GTX 1050 Ti (Desktop):
303.5 fps
25%
Radeon R7 M340:
74.5 76.1 [X] HP ProBook 470 G3 W4P78EA Intel Core i5-6200U 2.3GHz
Radeon R7 M340
80.2 [X] HP ProBook 450 G3 P4P34EA Intel Core i7-6500U 2.5GHz
Radeon R7 M340
~ 77 fps
Radeon R7 M340:
42.5 [X] HP ProBook 470 G3 W4P78EA Intel Core i5-6200U 2.3GHz
Radeon R7 M340
43.5 44.6 [X] HP ProBook 450 G3 P4P34EA Intel Core i7-6500U 2.5GHz
Radeon R7 M340
~ 44 fps
100%
GeForce GTX 1050 Ti (Desktop):
208 [X] Intel Core i7-4790K 4GHz
GeForce GTX 1050 Ti (Desktop)
min:
58 fps, max:
311 fps
fps
16%
Radeon R7 M340:
33.5 [X] HP ProBook 470 G3 W4P78EA Intel Core i5-6200U 2.3GHz
Radeon R7 M340
34.1 34.9 [X] HP ProBook 450 G3 P4P34EA Intel Core i7-6500U 2.5GHz
Radeon R7 M340
~ 34 fps
100%
GeForce GTX 1050 Ti (Desktop):
77.2 79 [X] Intel Core i7-4790K 4GHz
GeForce GTX 1050 Ti (Desktop)
min:
45 fps, max:
130 fps
~ 78 fps
15%
Radeon R7 M340:
11.6 [X] HP ProBook 470 G3 W4P78EA Intel Core i5-6200U 2.3GHz
Radeon R7 M340
11.8 [X] HP ProBook 450 G3 P4P34EA Intel Core i7-6500U 2.5GHz
Radeon R7 M340
11.8 ~ 12 fps
100%
GeForce GTX 1050 Ti (Desktop):
35.8 [X] Intel Core i7-4790K 4GHz
GeForce GTX 1050 Ti (Desktop)
min:
29 fps, max:
54 fps
fps
14%
Radeon R7 M340:
5.1 fps
Radeon R7 M340:
55 [X] HP ProBook 470 G3 W4P78EA Intel Core i5-6200U 2.3GHz
Radeon R7 M340
64.7 [X] HP ProBook 450 G3 P4P34EA Intel Core i7-6500U 2.5GHz
Radeon R7 M340
~ 60 fps
Radeon R7 M340:
42.7 [X] HP ProBook 470 G3 W4P78EA Intel Core i5-6200U 2.3GHz
Radeon R7 M340
52 [X] HP ProBook 450 G3 P4P34EA Intel Core i7-6500U 2.5GHz
Radeon R7 M340
~ 47 fps
Radeon R7 M340:
35.7 [X] HP ProBook 470 G3 W4P78EA Intel Core i5-6200U 2.3GHz
Radeon R7 M340
44.2 [X] HP ProBook 450 G3 P4P34EA Intel Core i7-6500U 2.5GHz
Radeon R7 M340
~ 40 fps
Radeon R7 M340:
22.3 [X] HP ProBook 470 G3 W4P78EA Intel Core i5-6200U 2.3GHz
Radeon R7 M340
27.7 [X] HP ProBook 450 G3 P4P34EA Intel Core i7-6500U 2.5GHz
Radeon R7 M340
~ 25 fps
100%
GeForce GTX 1050 Ti (Desktop):
55.1 [X] Intel Core i7-4790K 4GHz
GeForce GTX 1050 Ti (Desktop)
min:
22 fps, max:
93 fps
fps
Average Gaming NVIDIA GeForce GTX 1050 Ti (Desktop) → 100% Average Gaming 30-70 fps → 100%
Average Gaming AMD Radeon R7 M340 → 16% Average Gaming 30-70 fps → 23%
 Deutsch
 English
 Español
 Français
 Italiano
 Nederlands
 Polski
 Português
 Русский
 Türkçe
 Svenska
 Chinese
 Magyar