Notebookcheck Logo

AMD E2-2000 vs Intel Core i5-10600K

AMD E2-2000

► remove from comparison

The AMD E2-2000 (codename Zacate) is a dual core processor for small notebooks and netbooks. It offers a relatively powerful integrated graphics card and a single channel DDR3-1333 memory controller. Compared to the older E2-1800 offers only slightly higher CPU (50 MHz) and GPU (15 - 20 MHz) clock rates.

Inside the E2-2000 two Bobcat cores can access 512KB level 2 cache per core. In comparison to the Atom processors, the Bobcat architecture uses an "out-of-order" execution and is therefore faster at the same clock speed. However, the performance is far worse than similar clocked Penryn (Celeron) or Danube (Athlon II) cores. On average the cpu performance of the E2-2000 is a bit below a Celeron SU2300 at 1.2 GHz or a Athlon II Neo K325 at 1.3 GHz. 

The integrated Radeon HD 7340 graphics card offers 80 shaders, clocked at 538 - 700 MHz, and an UVD3 video processor. Compared to the slow GMA 3150 in the Atom processors, the HD7340 offers a lot more performance and is about as fast as the Nvidia ION graphics solution.

The power consumption is rated with a TDP of 18 W by AMD. That's about the same level as Intels (significantly faster) ULV CPUs.

Intel Core i5-10600K

► remove from comparison Intel i5-10600K

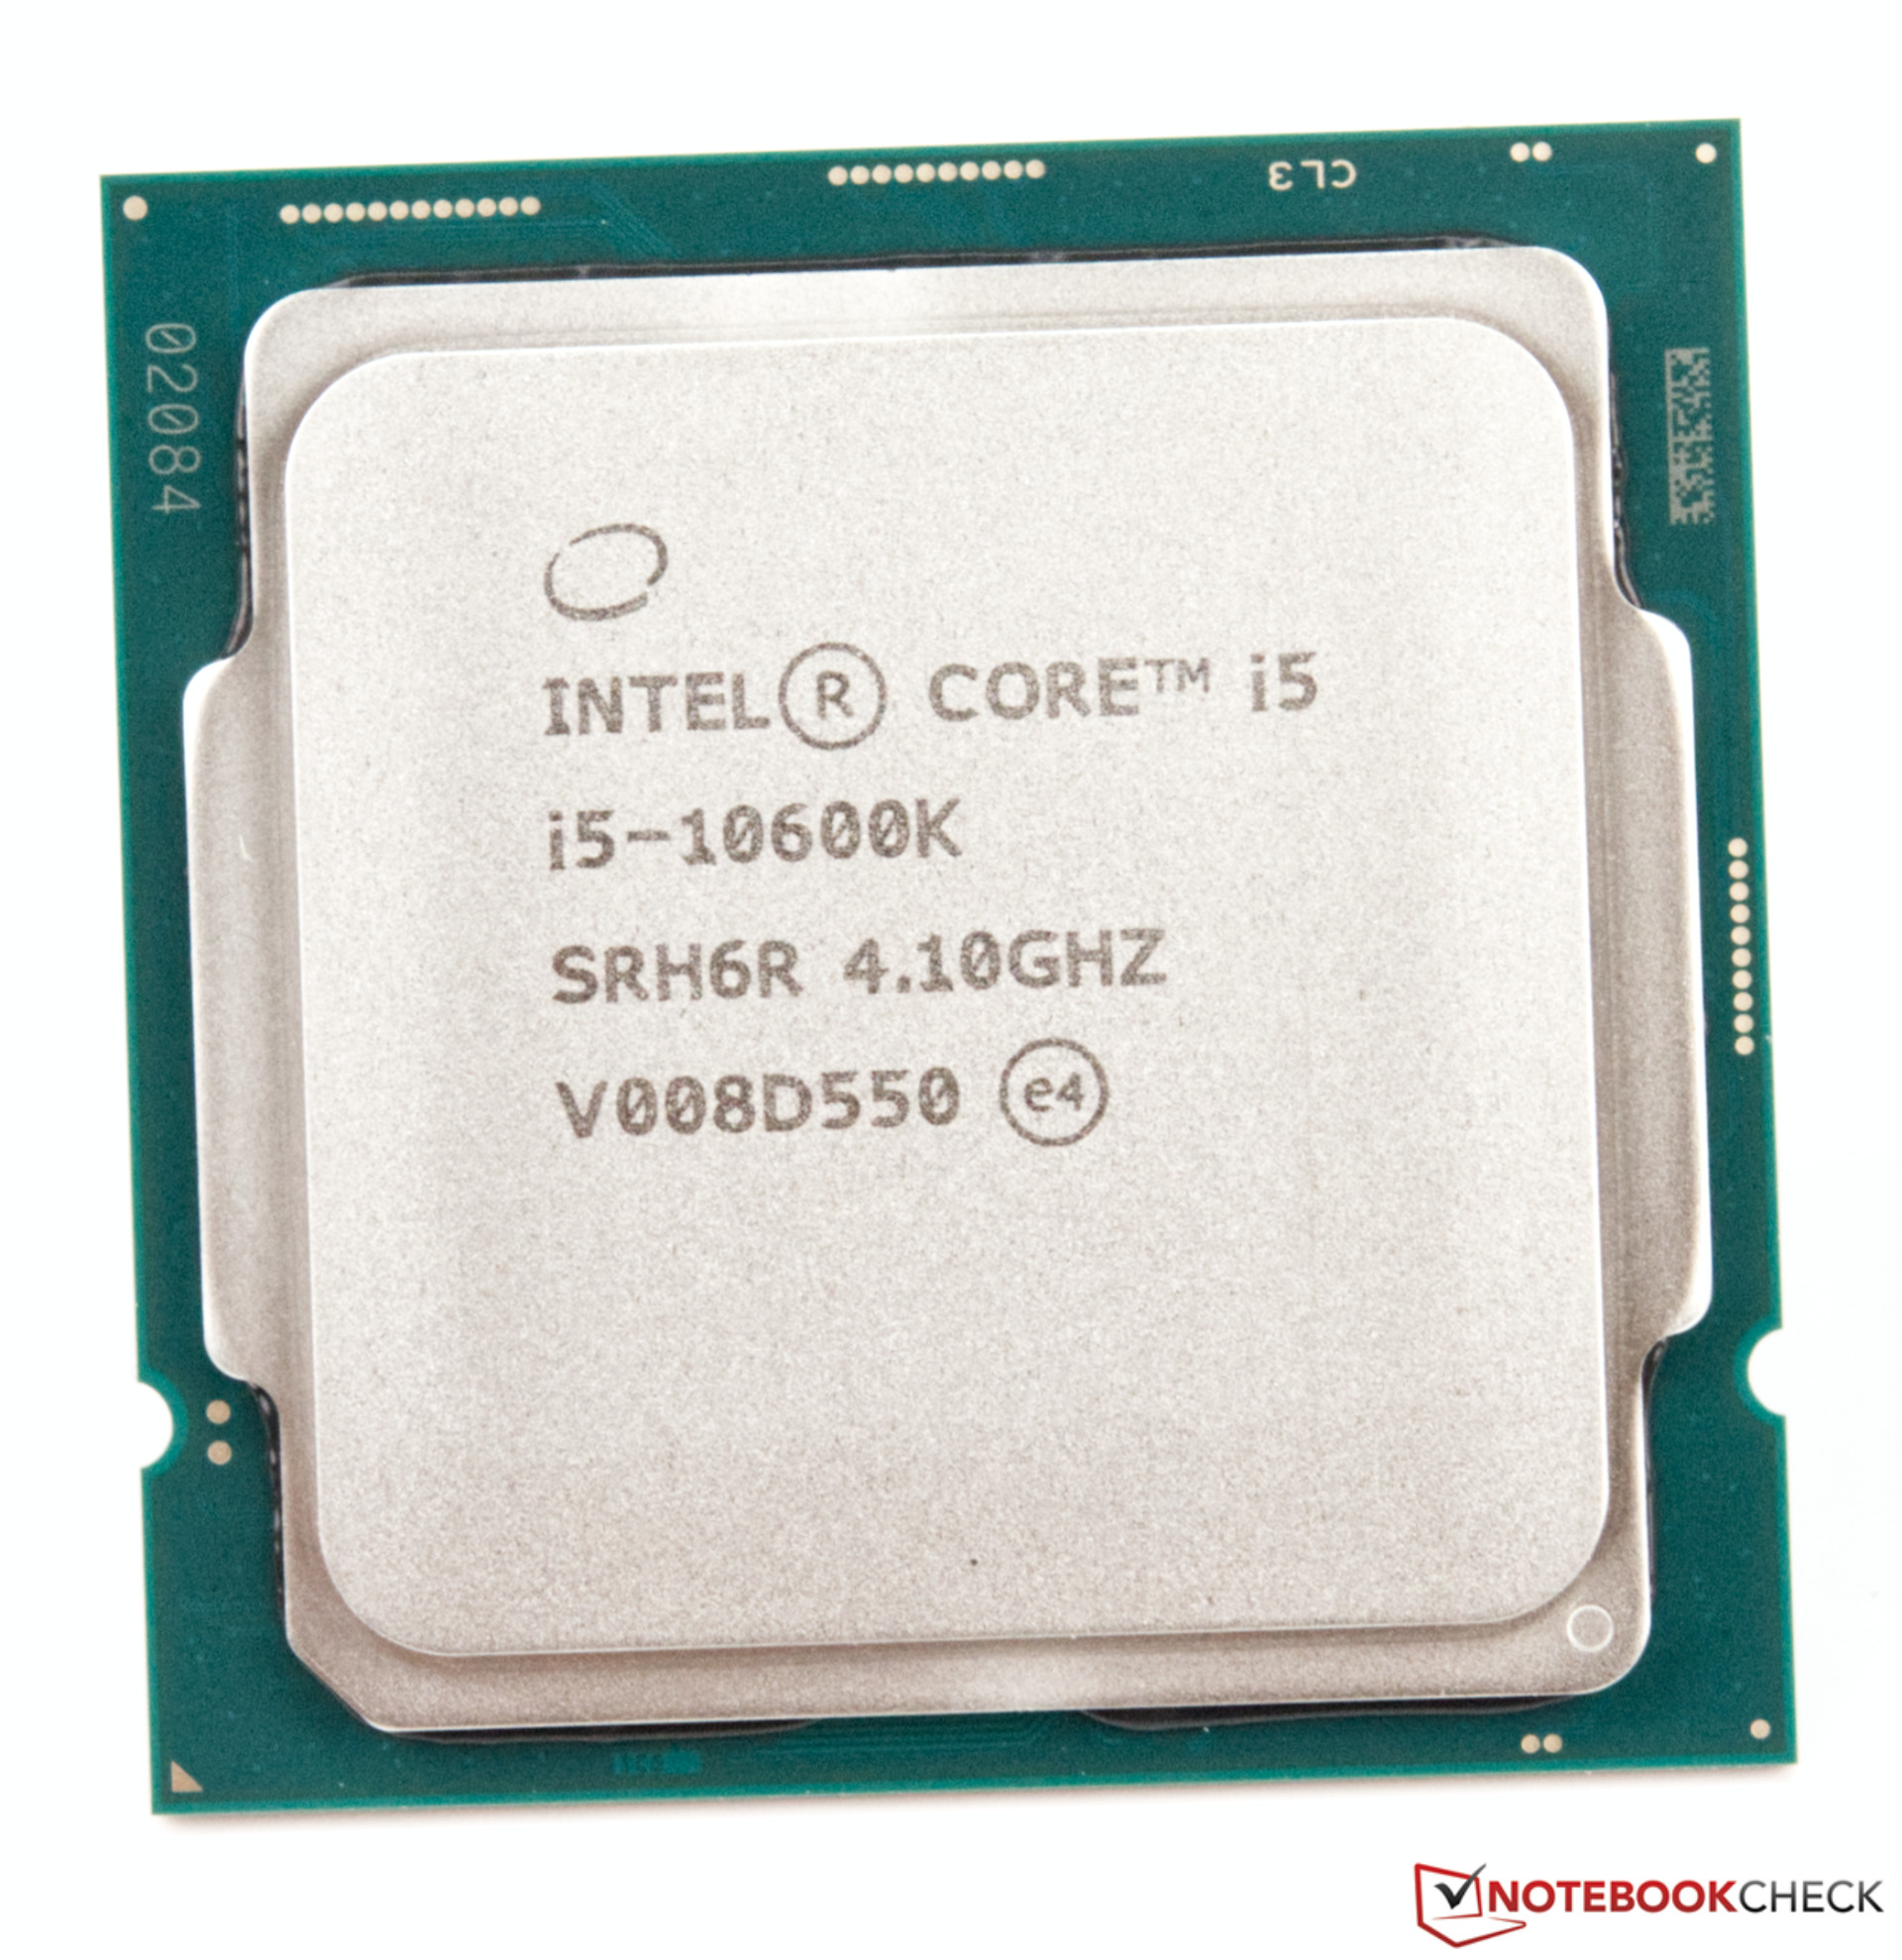
The Intel Core i5-10600K is a mid-range processor for desktops with six cores based on the Comet Lake architecture (CML-S, 4th generation of Skylake). The processor clocks at between 4.1 and 4.8 GHz and can execute up to twelfe threads simultaneously thanks to Hyper-Threading. 

The processor is still manufactured in the old 14nm (14nm++) process. Thanks to the free multiplicator, the CPU can also be easily overclocked (but may not have much headroom).

The Comet Lake architecture is similar to Coffee Lake and offers the same features and is produced in the same 14nm process. Other than the improved clock rates, the memory controller now also supports faster DDR4-2933 RAM. More information on Comet Lake and all the models and articles on it can be found here.

Performance

Thanks to the high clock speeds (and possible TDP settings with most mainboards), the Core i5-10600K offers a similar speed than the old Core i7-9700K quad core. Compared to current AMD offerings, the multi-core performance is on par with a Ryzen 5 3600, single core and gaming performance with a faster Ryzen 9 3900.

Graphics

The integrated Intel UHD Graphics 630 iGPU is supposed to offer a similar performance as the UHD630 in the Core i7-9900K. As a  low-end solution it will only run current games smoothly at reduced details - if at all.

Power Consumption

Intel specifies the TDP with 125 Watts (PL1) but under full load up to 250 Watt are consumed (PL2). In default mode these 250 Watt and therefore high clock speeds can be maintained for up to 56 seconds, however, all boards offer the option to alter these settings.

ModelAMD E2-2000Intel Core i5-10600K
SeriesAMD E-SeriesIntel Comet Lake
CodenameZacateComet Lake
Series: Comet Lake Comet Lake
AMD E2-2000 « 1.75 GHz2 / 2 cores
AMD E2-1800 compare1.7 GHz2 / 2 cores
AMD E-450 compare1.65 GHz2 / 2 cores
AMD E-350 compare1.6 GHz2 / 2 cores
AMD E1-1500 compare1.48 GHz2 / 2 cores
AMD E1-1200 compare1.4 GHz2 / 2 cores
AMD E-300 compare1.3 GHz2 / 2 cores
AMD E-240 compare1.5 GHz1 / 1 cores
Intel Core i9-10900K compare3.7 - 5.3 GHz10 / 20 cores20 MB L3
Intel Core i7-10700K compare3.8 - 5.1 GHz8 / 16 cores16 MB L3
Intel Core i7-10700 compare2.9 - 4.8 GHz8 / 16 cores16 MB L3
Intel Core i5-10600K « 4.1 - 4.8 GHz6 / 12 cores12 MB L3
Intel Core i5-10400F compare2.9 - 4.3 GHz6 / 12 cores12 MB L3
Intel Core i3-10100F compare3.6 - 4.3 GHz4 / 8 cores6 MB L3
Clock1750 MHz4100 - 4800 MHz
L1 Cache128 KB384 KB
L2 Cache1 MB1.5 MB
Cores / Threads2 / 26 / 12
TDP18 Watt125 Watt
Technology40 nm14 nm
Die Size75 mm2
SocketFT1 BGA 413-BallLGA1200
FeaturesMMX(+), SSE(1,2,3,3S,4A), AMD-VDDR4-2666 RAM, PCIe 3, 8 GT/s bus, vPro, MMX, SSE, SSE2, SSE3, SSSE3, SSE4.1, SSE4.2, AVX, AVX2, BMI2, ABM, FMA, ADX, VMX, SMX, SMEP, SMAP, MPX, EIST, TM1, TM2, HT, Turbo, SST, AES-NI, RDRAND, RDSEED, SGX
Architecturex86x86
Announced
L3 Cache12 MB
max. Temp.100 °C
iGPUIntel UHD Graphics 630 (350 - 1200 MHz)
$262 U.S.
Manufacturerark.intel.com

Benchmarks

Performance Rating - CB R15 + R20 + 7-Zip + X265 + Blender + 3DM11 CPU - i5-10600K
35.1 pt (49%)
Cinebench R23 - Cinebench R23 Multi Core
10475 Points (10%)
Cinebench R23 - Cinebench R23 Single Core
1385 Points (59%)
Cinebench R20 - Cinebench R20 CPU (Single Core)
464 Points (52%)
Cinebench R20 - Cinebench R20 CPU (Multi Core)
3443 Points (8%)
Cinebench R15 - Cinebench R15 CPU Multi 64 Bit
1452 Points (9%)
Cinebench R15 - Cinebench R15 CPU Single 64 Bit
205 Points (62%)
Cinebench R11.5 - Cinebench R11.5 CPU Multi 64 Bit
15.8 Points (21%)
Cinebench R11.5 - Cinebench R11.5 CPU Single 64 Bit
2.2 Points (54%)
Cinebench R10 - Cinebench R10 Rend. Single (32bit)
7343 Points (44%)
Cinebench R10 - Cinebench R10 Rend. Multi (32bit)
40074 Points (29%)
Cinebench R10 - Cinebench R10 Rend. Multi (64bit)
51816 Points (36%)
Cinebench R10 - Cinebench R10 Rend. Single (64bit)
9594 Points (12%)
wPrime 2.10 - wPrime 2.0 1024m *
113.2 s (1%)
wPrime 2.10 - wPrime 2.0 32m *
4.6 s (1%)
WinRAR - WinRAR 4.0
6536 Points (10%)
7-Zip 18.03 - 7-Zip 18.03 Multli Thread 4 runs
40379 MIPS (23%)
7-Zip 18.03 - 7-Zip 18.03 Single Thread 4 runs
5289 MIPS (63%)
X264 HD Benchmark 4.0 - x264 Pass 2
88.2 fps (31%)
X264 HD Benchmark 4.0 - x264 Pass 1
251.5 fps (58%)
HWBOT x265 Benchmark v2.2 - HWBOT x265 4k Preset
12.2 fps (21%)
TrueCrypt - TrueCrypt Serpent
0.8 GB/s (0%)
TrueCrypt - TrueCrypt Twofish
1.4 GB/s (24%)
TrueCrypt - TrueCrypt AES
8 GB/s (21%)
Blender - Blender 2.79 BMW27 CPU *
302.4 Seconds (2%)
R Benchmark 2.5 - R Benchmark 2.5 *
0.6 sec (13%)
Super Pi mod 1.5 XS 1M - Super Pi mod 1.5 XS 1M *
7.8 s (2%)
Super Pi mod 1.5 XS 2M - Super Pi mod 1.5 XS 2M *
17.5 s (1%)
Super Pi Mod 1.5 XS 32M - Super Pi mod 1.5 XS 32M *
438.7 s (2%)
3DMark 11 - 3DM11 Performance Physics
15961 Points (43%)
3DMark - 3DMark Ice Storm Physics
68275 Points (55%)
3DMark - 3DMark Ice Storm Extreme Physics
68908 Points (56%)
3DMark - 3DMark Ice Storm Unlimited Physics
70668 Points (60%)
3DMark - 3DMark Cloud Gate Physics
13014 Points (33%)
3DMark - 3DMark Fire Strike Standard Physics
20040 Points (36%)
3DMark - 3DMark Time Spy CPU
8290 Points (35%)
Geekbench 5.5 - Geekbench 5.1 - 5.4 64 Bit Single-Core
1286 Points (54%)
Geekbench 5.5 - Geekbench 5.1 - 5.4 64 Bit Multi-Core
7248 Points (13%)
Geekbench 5.0 - Geekbench 5.0 64 Bit Single-Core
1281 Points (6%)
Geekbench 5.0 - Geekbench 5.0 64 Bit Multi-Core
7237 Points (23%)
Geekbench 4.4 - Geekbench 4.1 - 4.4 64 Bit Single-Core
5821 Points (58%)
Geekbench 4.4 - Geekbench 4.1 - 4.4 64 Bit Multi-Core
28391 Points (31%)
Mozilla Kraken 1.1 - Kraken 1.1 Total Score *
760 ms (1%)
WebXPRT 3 - WebXPRT 3 Score
239 Points (50%)
Power Consumption - Prime95 Power Consumption - external Monitor *
204.4 Watt (35%)
Power Consumption - Cinebench R15 Multi Power Consumption - external Monitor *
172.5 Watt (31%)
Power Consumption - Cinebench R15 Multi Power Efficiency - external Monitor
8.4 Points per Watt (6%)

Average Benchmarks Intel Core i5-10600K → 0% n=

- Range of benchmark values for this graphics card
- Average benchmark values for this graphics card
* Smaller numbers mean a higher performance
1 This benchmark is not used for the average calculation

Add one or more devices and compare

In the following list you can select (and also search for) devices that should be added to the comparison. You can select more than one device.

restrict list:

show all (including archived), 2024, 2023
v1.28
log 04. 07:59:44

#0 checking url part for id 3632 +0s ... 0s

#1 checking url part for id 12212 +0s ... 0s

#2 redirected to Ajax server, took 1720072784 +0s ... 0s

#3 did not recreate cache, as it is less than 5 days old! Created at Thu, 04 Jul 2024 05:15:21 +0200 +0s ... 0s

#4 composed specs +0.005s ... 0.005s

#5 did output specs +0s ... 0.005s

#6 getting avg benchmarks for device 3632 +0.001s ... 0.006s

#7 got single benchmarks 3632 +0.003s ... 0.009s

#8 getting avg benchmarks for device 12212 +0.004s ... 0.013s

#9 got single benchmarks 12212 +0.004s ... 0.016s

#10 got avg benchmarks for devices +0s ... 0.016s

#11 min, max, avg, median took s +0.019s ... 0.035s

#12 return log +0.002s ... 0.038s

Please share our article, every link counts!
> Expert Reviews and News on Laptops, Smartphones and Tech Innovations > Benchmarks / Tech > Processor Comparison - Head 2 Head
Redaktion, 2017-09- 8 (Update: 2023-07- 1)