 Deutsch
 English
 Español
 Français
 Italiano
 Nederlands
 Polski
 Português
 Русский
 Türkçe
 Svenska
 Chinese
 Magyar
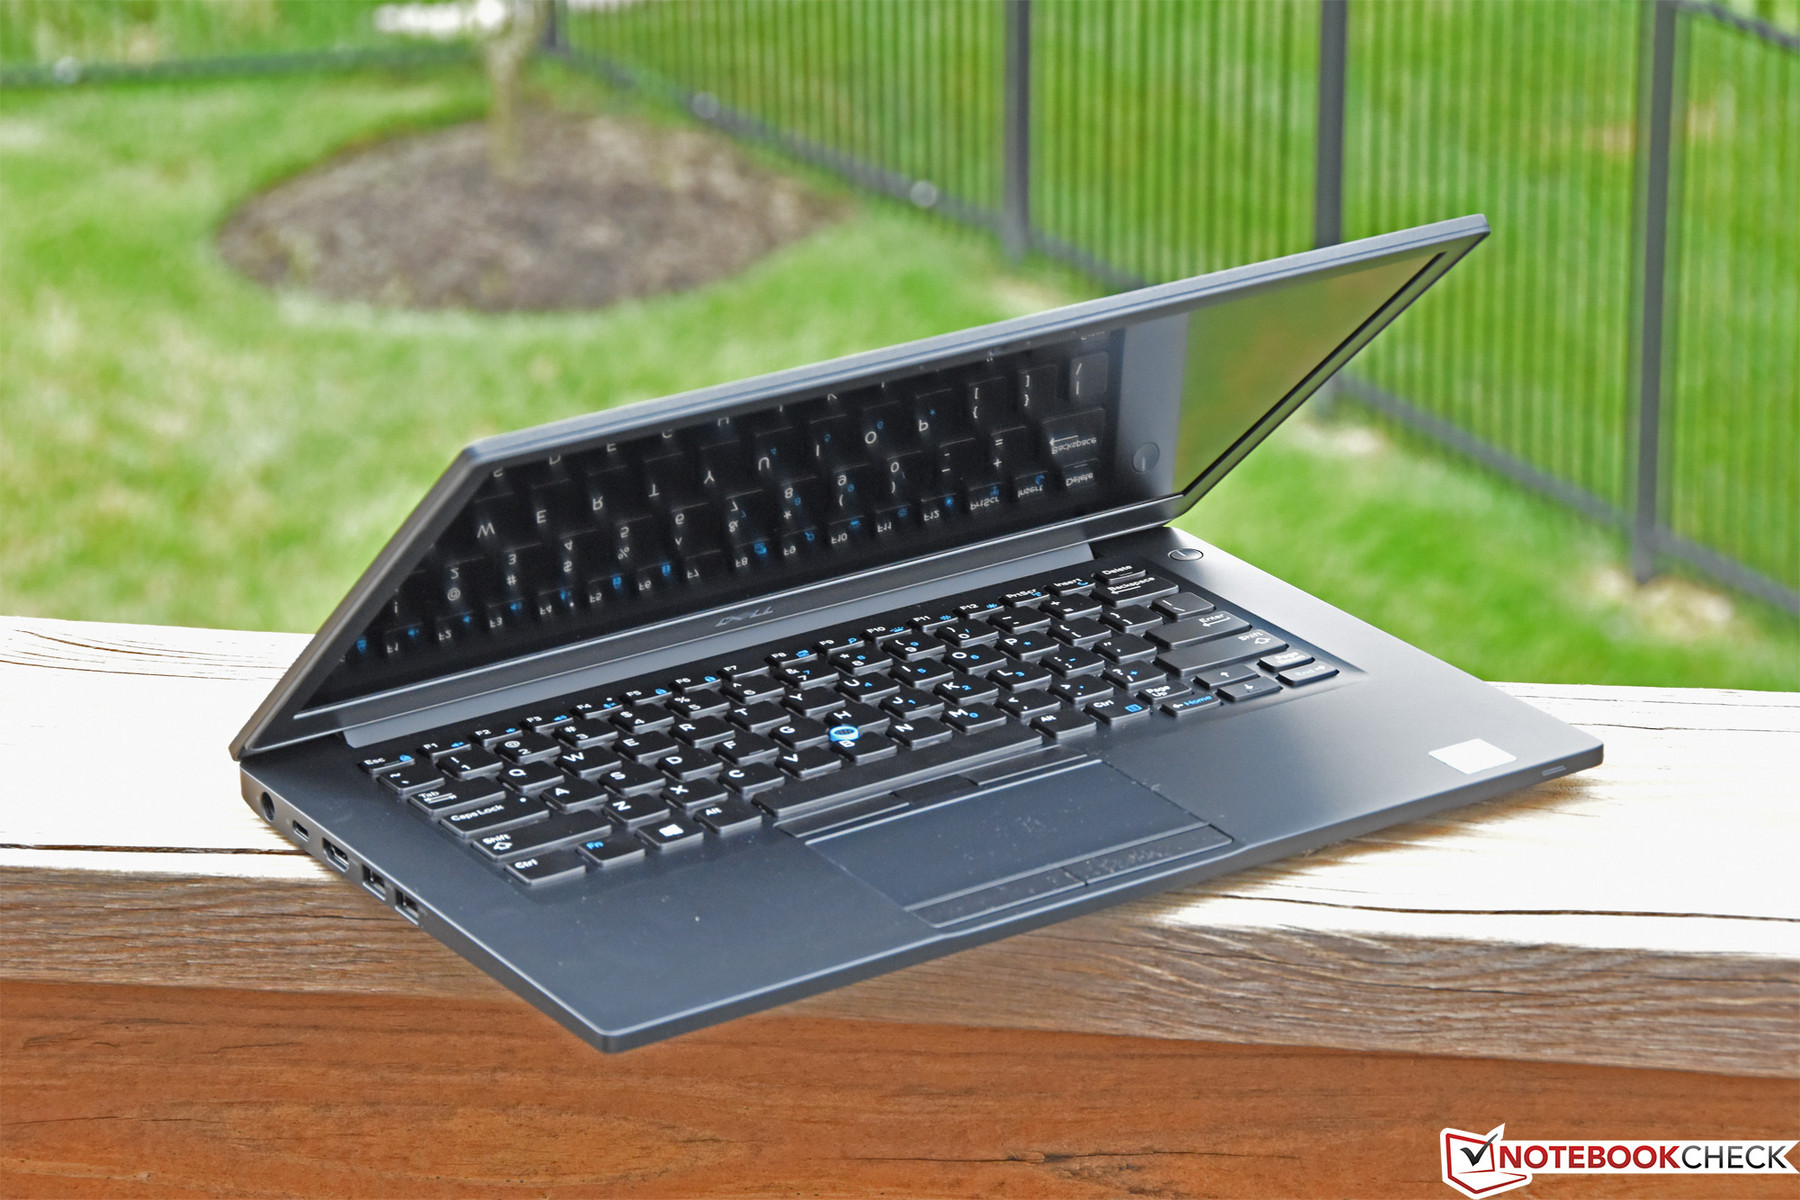
Dell Latitude 7490 (i5-8350U, FHD) Laptop Review

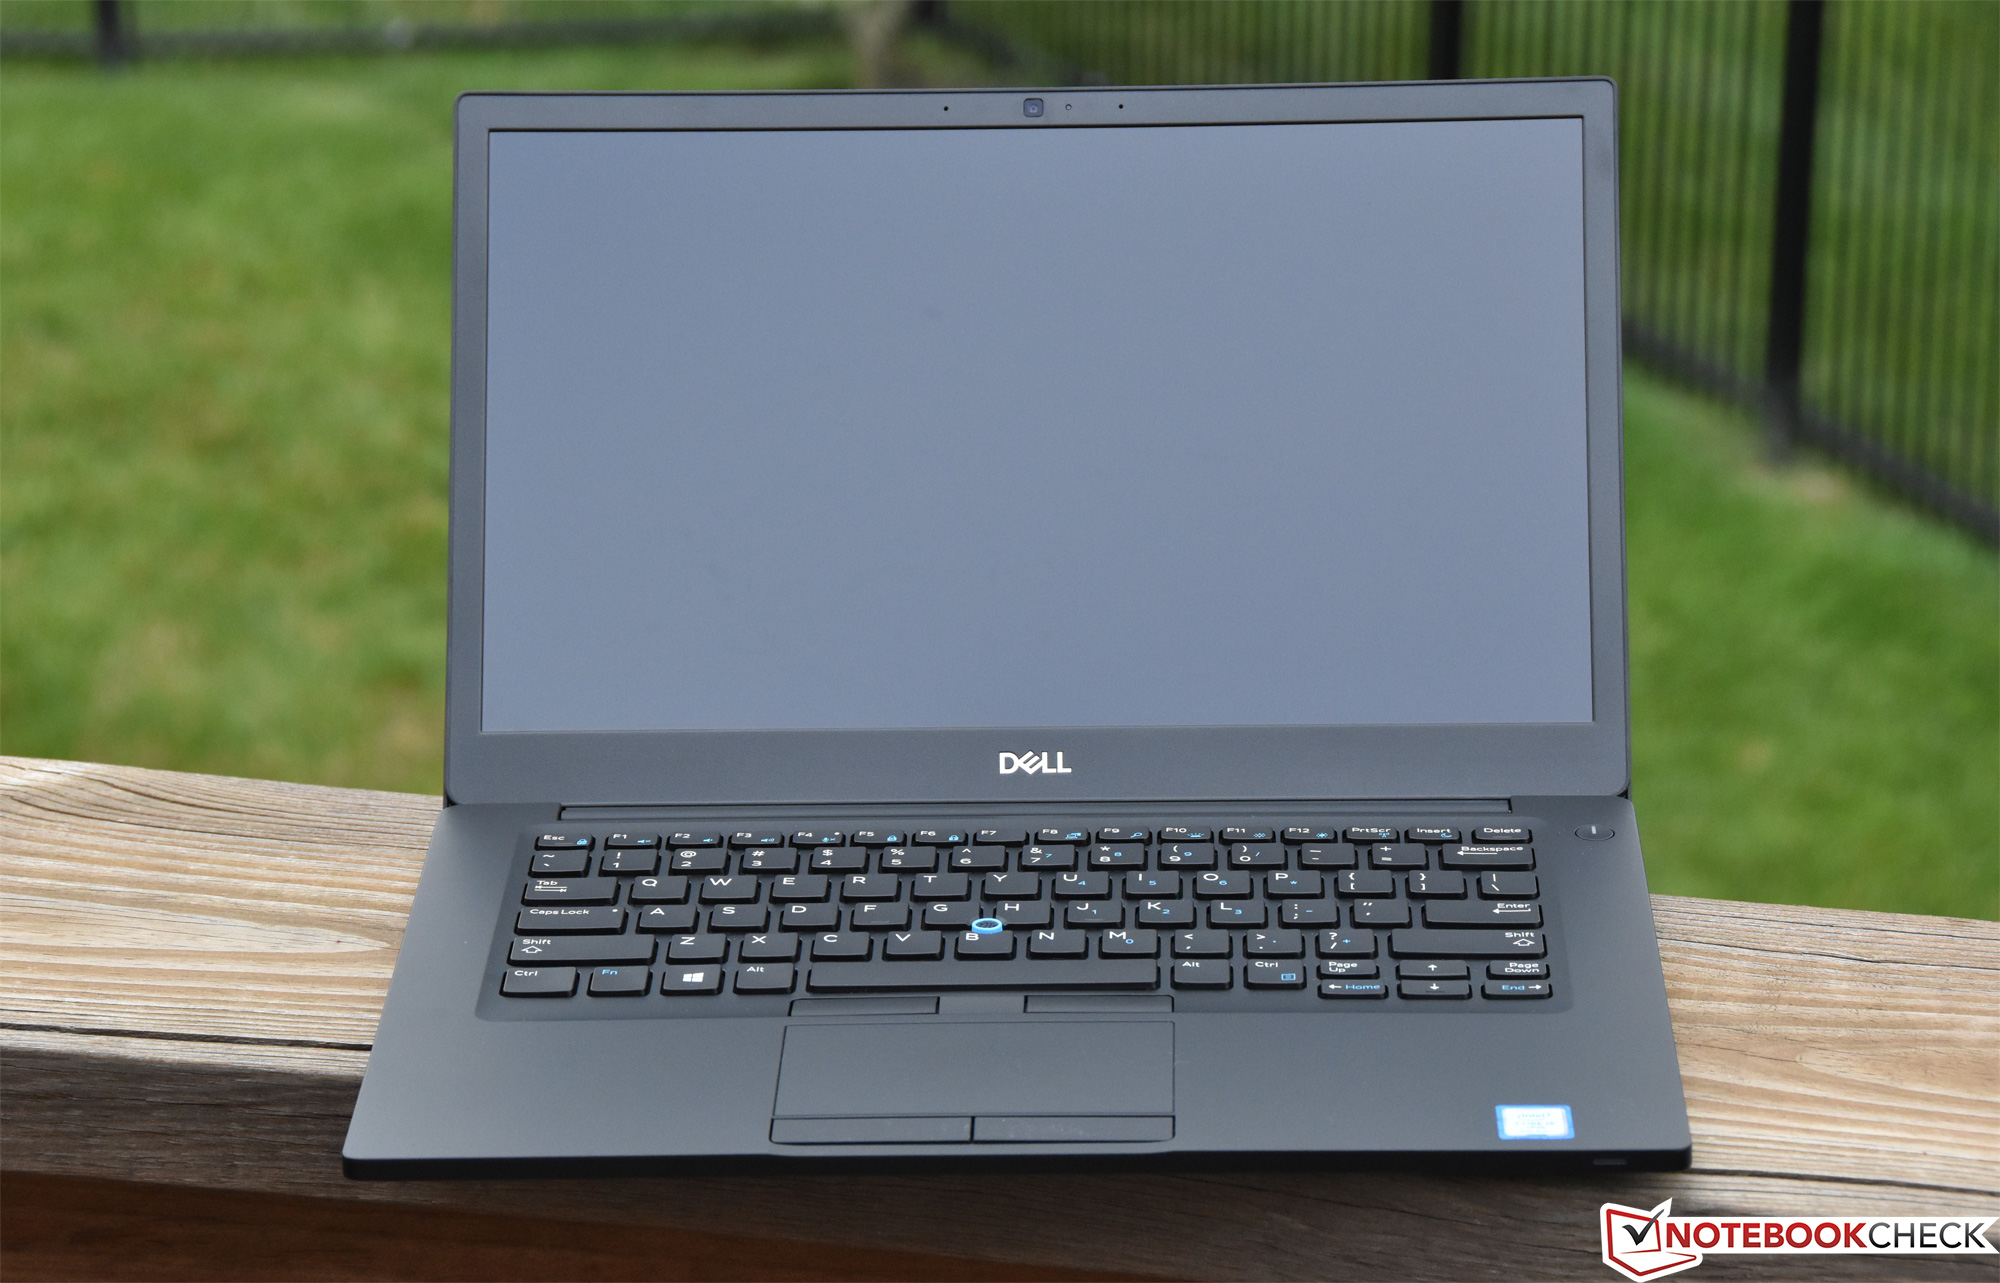
Back in April, we reviewed Dell’s latest 14-inch Latitude 7000 series machine, the Latitude 7490. Unsurprisingly, we found our test unit to be overall excellent (in keeping with the trends of its forebears). While it’s true that the 7490 is primarily an iterative (rather than revolutionary) update—preserving the perennially-lauded magnesium casing, terrific keyboard, straightforward maintenance, and all-day battery life—this year’s revision also introduces a few other significant improvements. Apart from the obvious benefits bestowed by the quad-core Intel Kaby Lake Refresh CPUs, the touchpad has been greatly enhanced by the adoption of Windows Precision drivers, and the incorporation of Active Steering Antenna technology seems to have improved WLAN throughput and reliability to boot.
Our previous review unit packed a Core i7 and one of Dell’s new embedded touch displays (which are a pretty enticing alternative to the usual high-gloss touchscreens); today’s review unit dials back the CPU to a Core i5-8350U, reverts to a conventional FHD non-touch (still matte) display, and makes a few other minor changes. It retails currently for $1,709 directly from Dell, which is a few hundred bucks below the previous configuration. How does it stand up to fierce competitors from Lenovo (ThinkPad X1 Carbon) and HP (EliteBook 840 G5)? Let’s dig into the data and find out.
Case
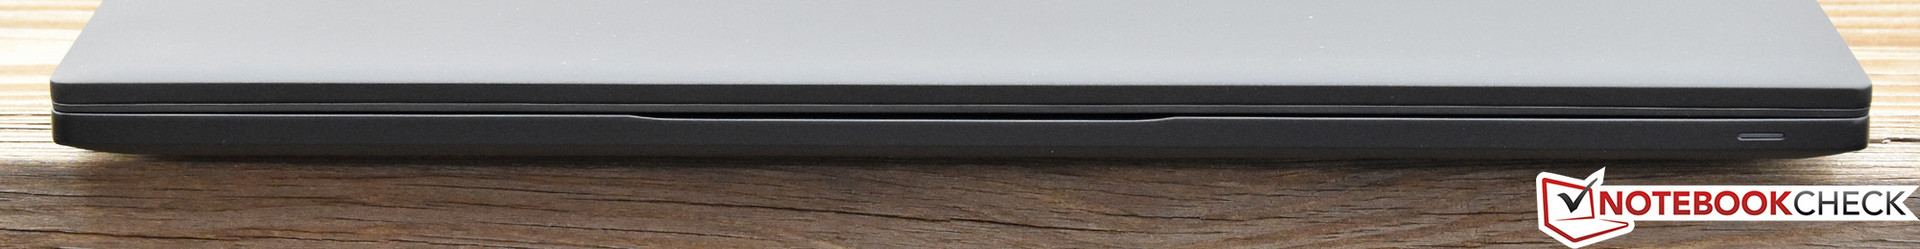
The case design hasn’t changed much since our previous review unit, so we’ll refer you to that article for our full impressions. The sole difference with today’s configuration is the exchange of the carbon fiber lid (which optionally lines the back of the embedded touch panel, which today’s unit lacks) for a conventional magnesium lid that we recognize from the 7480. To summarize the rest of our impressions, the (nearly fully magnesium) construction is as sturdy as ever, with very little flex across the base unit even under direct pressure. The display lid, likewise, remains highly resistant to torsion, and the single central hinge is stiff enough to prevent the lid from unintended vibration—though it’s impossible to open without both hands. Gaps between parts are even and small.


Our single complaint is merely an aesthetic one: namely, the penchant of the soft-touch material covering the surfaces for collecting and preserving fingerprints and skin oils. Otherwise, the Latitude 7490 remains one of the best-constructed business laptops on the market today.
Connectivity
Today’s test configuration lacks the Thunderbolt port and smart card reader of the Core i7 setup we reviewed back in April, but it’s otherwise identical. The Thunderbolt port has been exchanged instead for a conventional USB Type-C (with DisplayPort). Port selection and placement, as before, is overall very good—with four total USB ports (if the aforementioned Type-C port is included) and plenty of space between the connections, all of which are located on the left and right sides.


SD Card Reader
The Latitude 7490’s integrated microSD card reader manages reasonable speeds—ahead of the ThinkPad T480s and not far from the Latitude 7390, but well below the ThinkPad X1 Carbon, which leads the field.
| SD Card Reader | |
| average JPG Copy Test (av. of 3 runs) | |
| Lenovo ThinkPad X1 Carbon 2018-20KGS03900 (Toshiba Exceria Pro M501) | |
| Dell Latitude 7390 (Toshiba Exceria Pro M501 UHS-II) | |
| Dell Latitude 7490 (Toshiba Exceria Pro M501 UHS-II) | |
| Lenovo ThinkPad T480s-20L8S02D00 (Toshiba Exceria Pro SDXC 64 GB UHS-II) | |
| Average of class Office (8 - 82.7, n=50, last 2 years) | |
| maximum AS SSD Seq Read Test (1GB) | |
| Lenovo ThinkPad X1 Carbon 2018-20KGS03900 (Toshiba Exceria Pro M501) | |
| Dell Latitude 7390 (Toshiba Exceria Pro M501 UHS-II) | |
| Dell Latitude 7490 (Toshiba Exceria Pro M501 UHS-II) | |
| Lenovo ThinkPad T480s-20L8S02D00 (Toshiba Exceria Pro SDXC 64 GB UHS-II) | |
| Average of class Office (25 - 90.5, n=44, last 2 years) | |
Communication
Powering the Latitude’s WLAN connectivity is the esteemed Intel Dual Band Wireless-AC 8265, which is in fact the same adapter used by all competitors in our comparison field. The Latitude 7490 edges out its peers, however, possibly thanks to its adoption of Active Steering Antenna technology (which we discussed in our previous review). You can read more about this particular technology here.
Security (business devices)
Absent from today’s review unit is the touch fingerprint reader that occupied the right palmrest of the configuration we reviewed a couple of months ago—along with the NFC reader. As previously mentioned, the smart card reader is also missing. Finally, the IR camera (for Windows Hello and facial recognition) has been replaced by a conventional webcam. However, the typical Dell Client Command Suite and related software are still available.
Accessories

Since today’s unit trades the Thunderbolt port for a traditional USB Type-C/DisplayPort instead, Thunderbolt docks (such as the Dell TB16) won’t work. Instead, users will need to opt for a USB 3.0 or USB Type-C dock, which will still probably suffice for the average user. No accessories were included with our review system apart from a 65 W AC adapter.
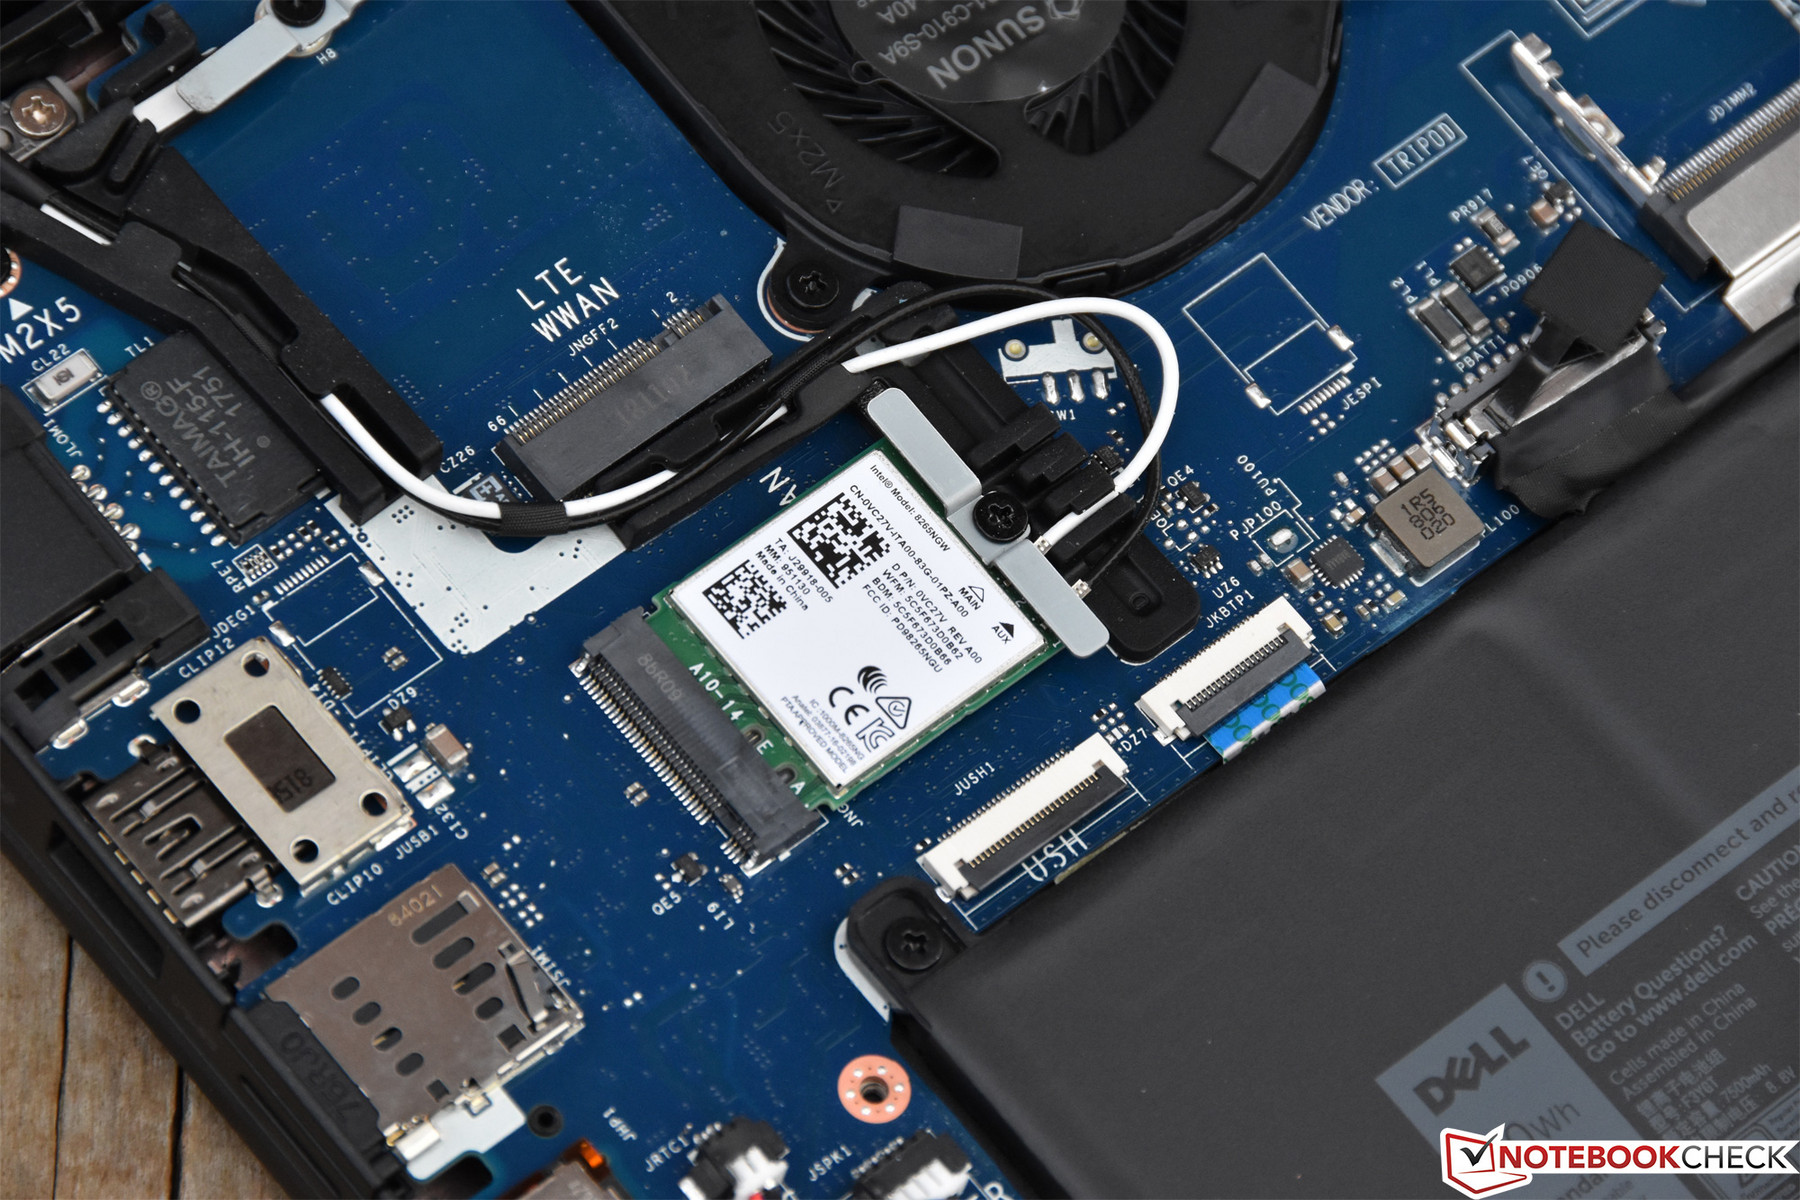
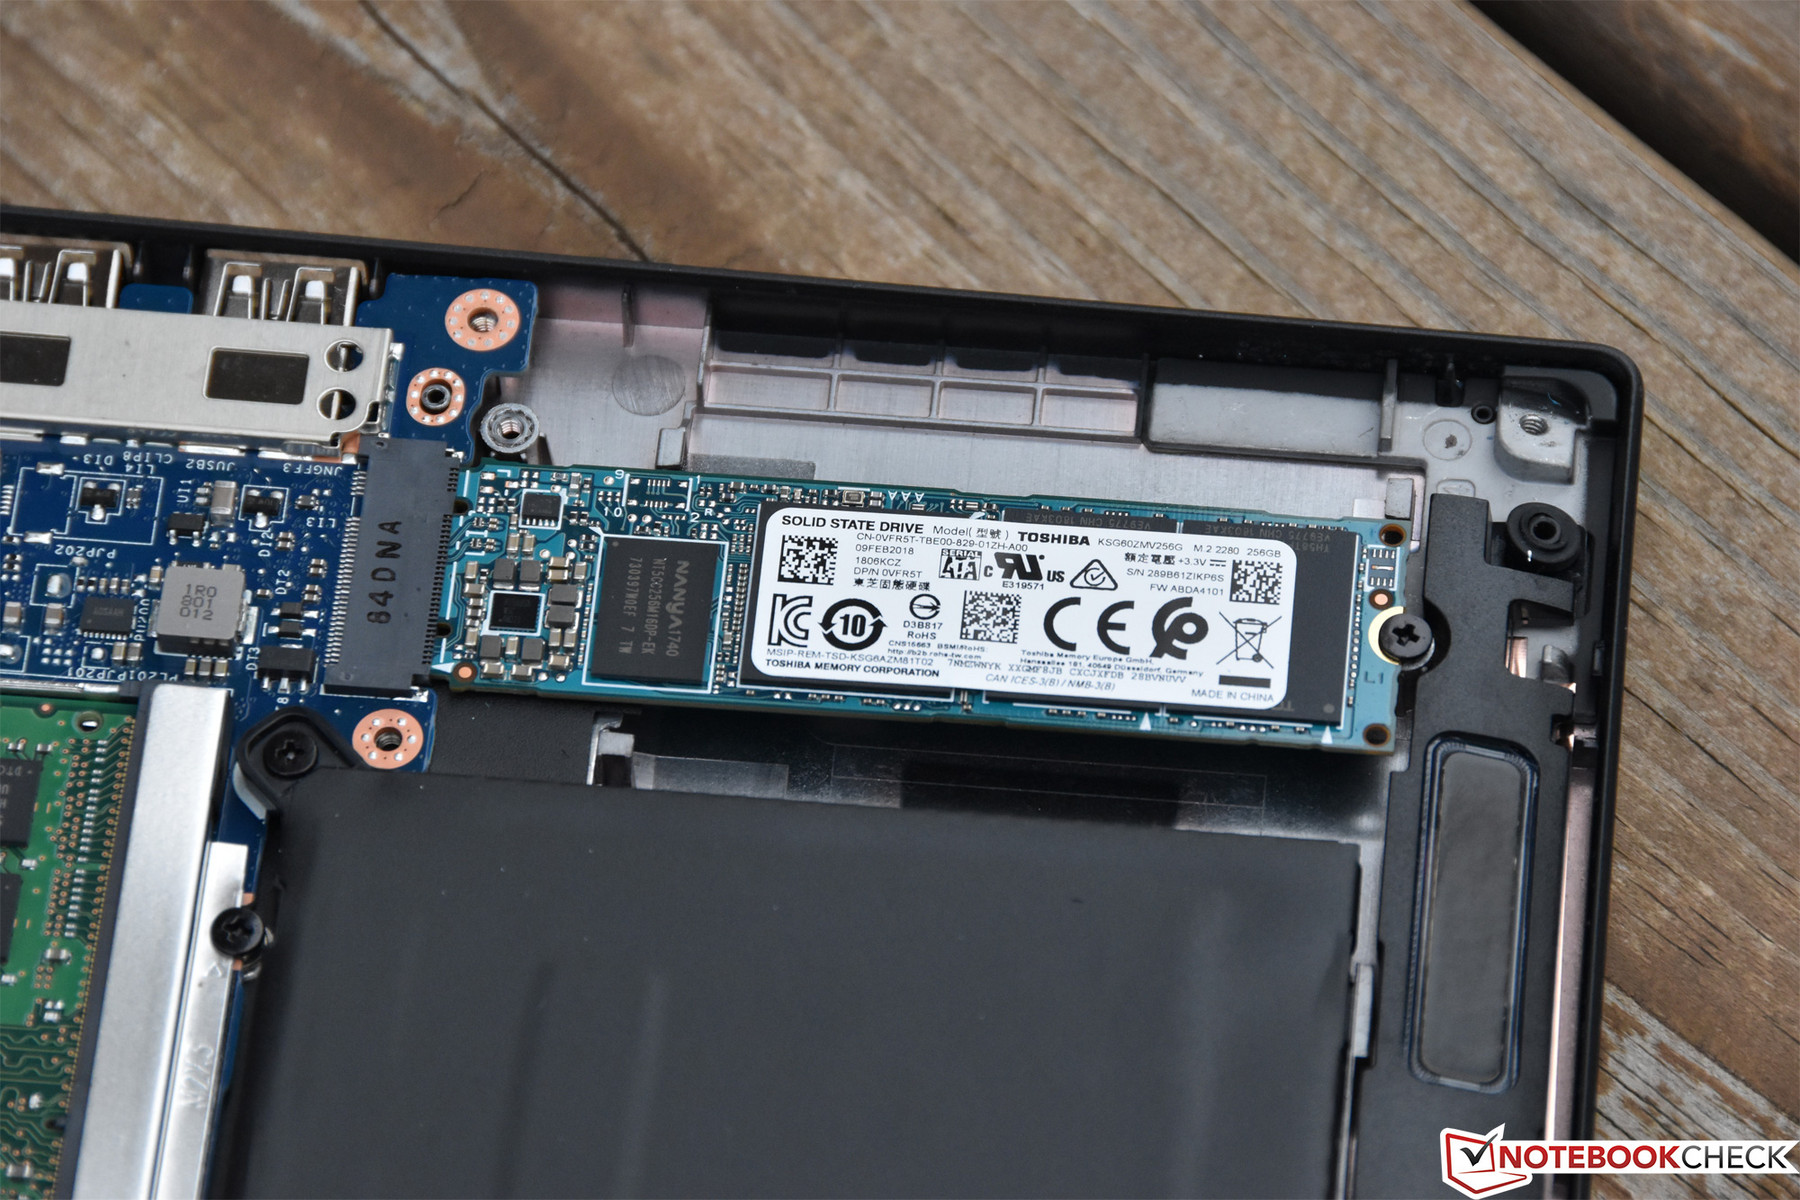
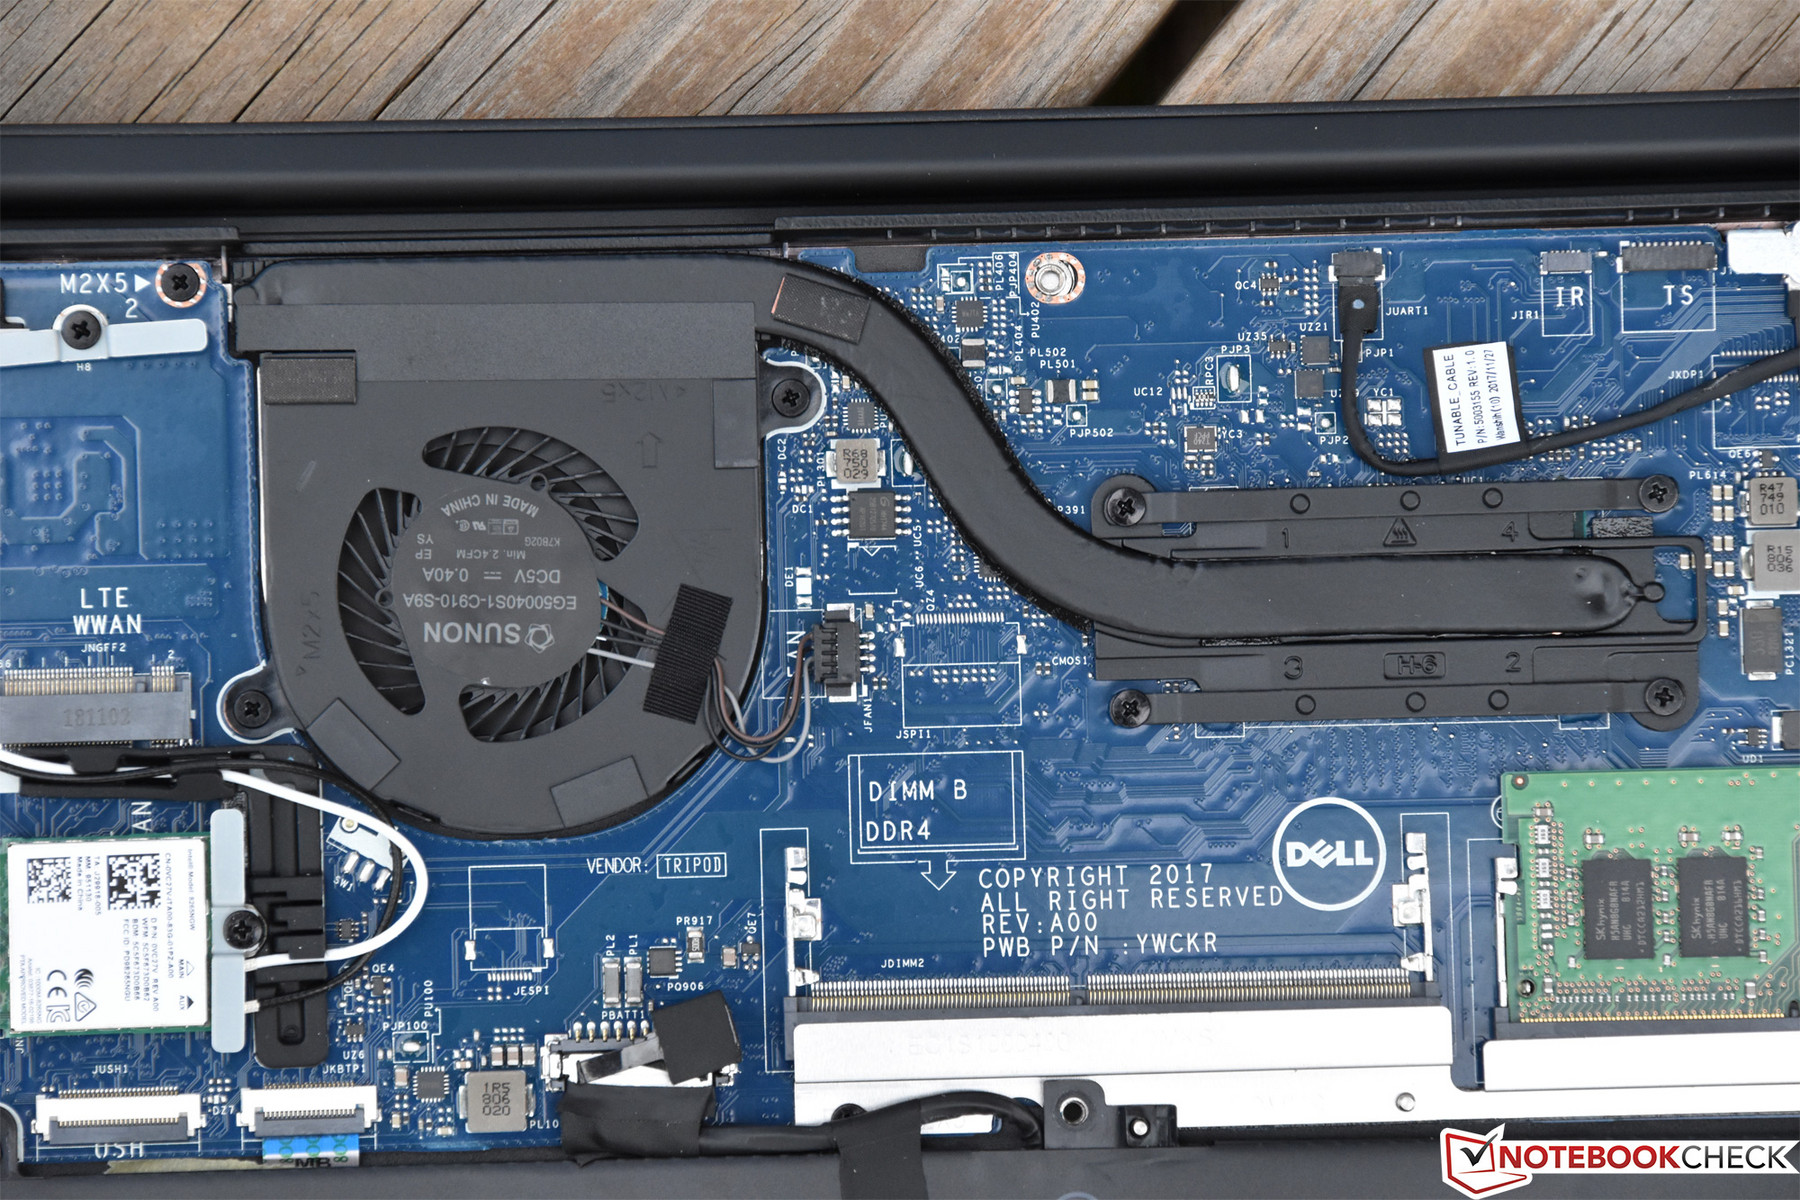
Maintenance
The ease of the disassembly process has not changed since our last review; some eight captive Phillips Head screws secure the bottom cover, and nearly every replaceable component is available immediately beneath the panel. One gripe which still applies here is that the keyboard is among the hardest of all FRUs to replace since it’s beneath the motherboard—though this is unfortunately a pretty common trend these days thanks to the thinness of the devices populating even the business segment (which are more and more akin to their consumer-grade counterparts as the years pass). There’s also an adhesive lining the LCD panel to help keep a consistent seal between the bezel and display that’s perilous during disassembly. In the event of a broken screen, technicians will need to take care to separate the bezel and panel surround without damaging anything.
On the other hand, a notable advantage of the Latitude design is the incorporation of a plug-in DC jack rather than a conventional design in which it is soldered to the board. This makes DC jack replacements relatively painless, far easier than the full disassembly, board removal, and desolder/solder work that is required for a traditional broken DC jack.


Warranty
All US Latitude 7490 machines ship with a 3-year, on-site warranty (after remote diagnosis) from Dell. Various upgrades are available, including longer warranty terms and ProSupport/ProSupport Plus packages which include North American dedicated support specialists. Please see our Guarantees, Return policies and Warranties FAQ for country-specific information.
Input Devices
Keyboard
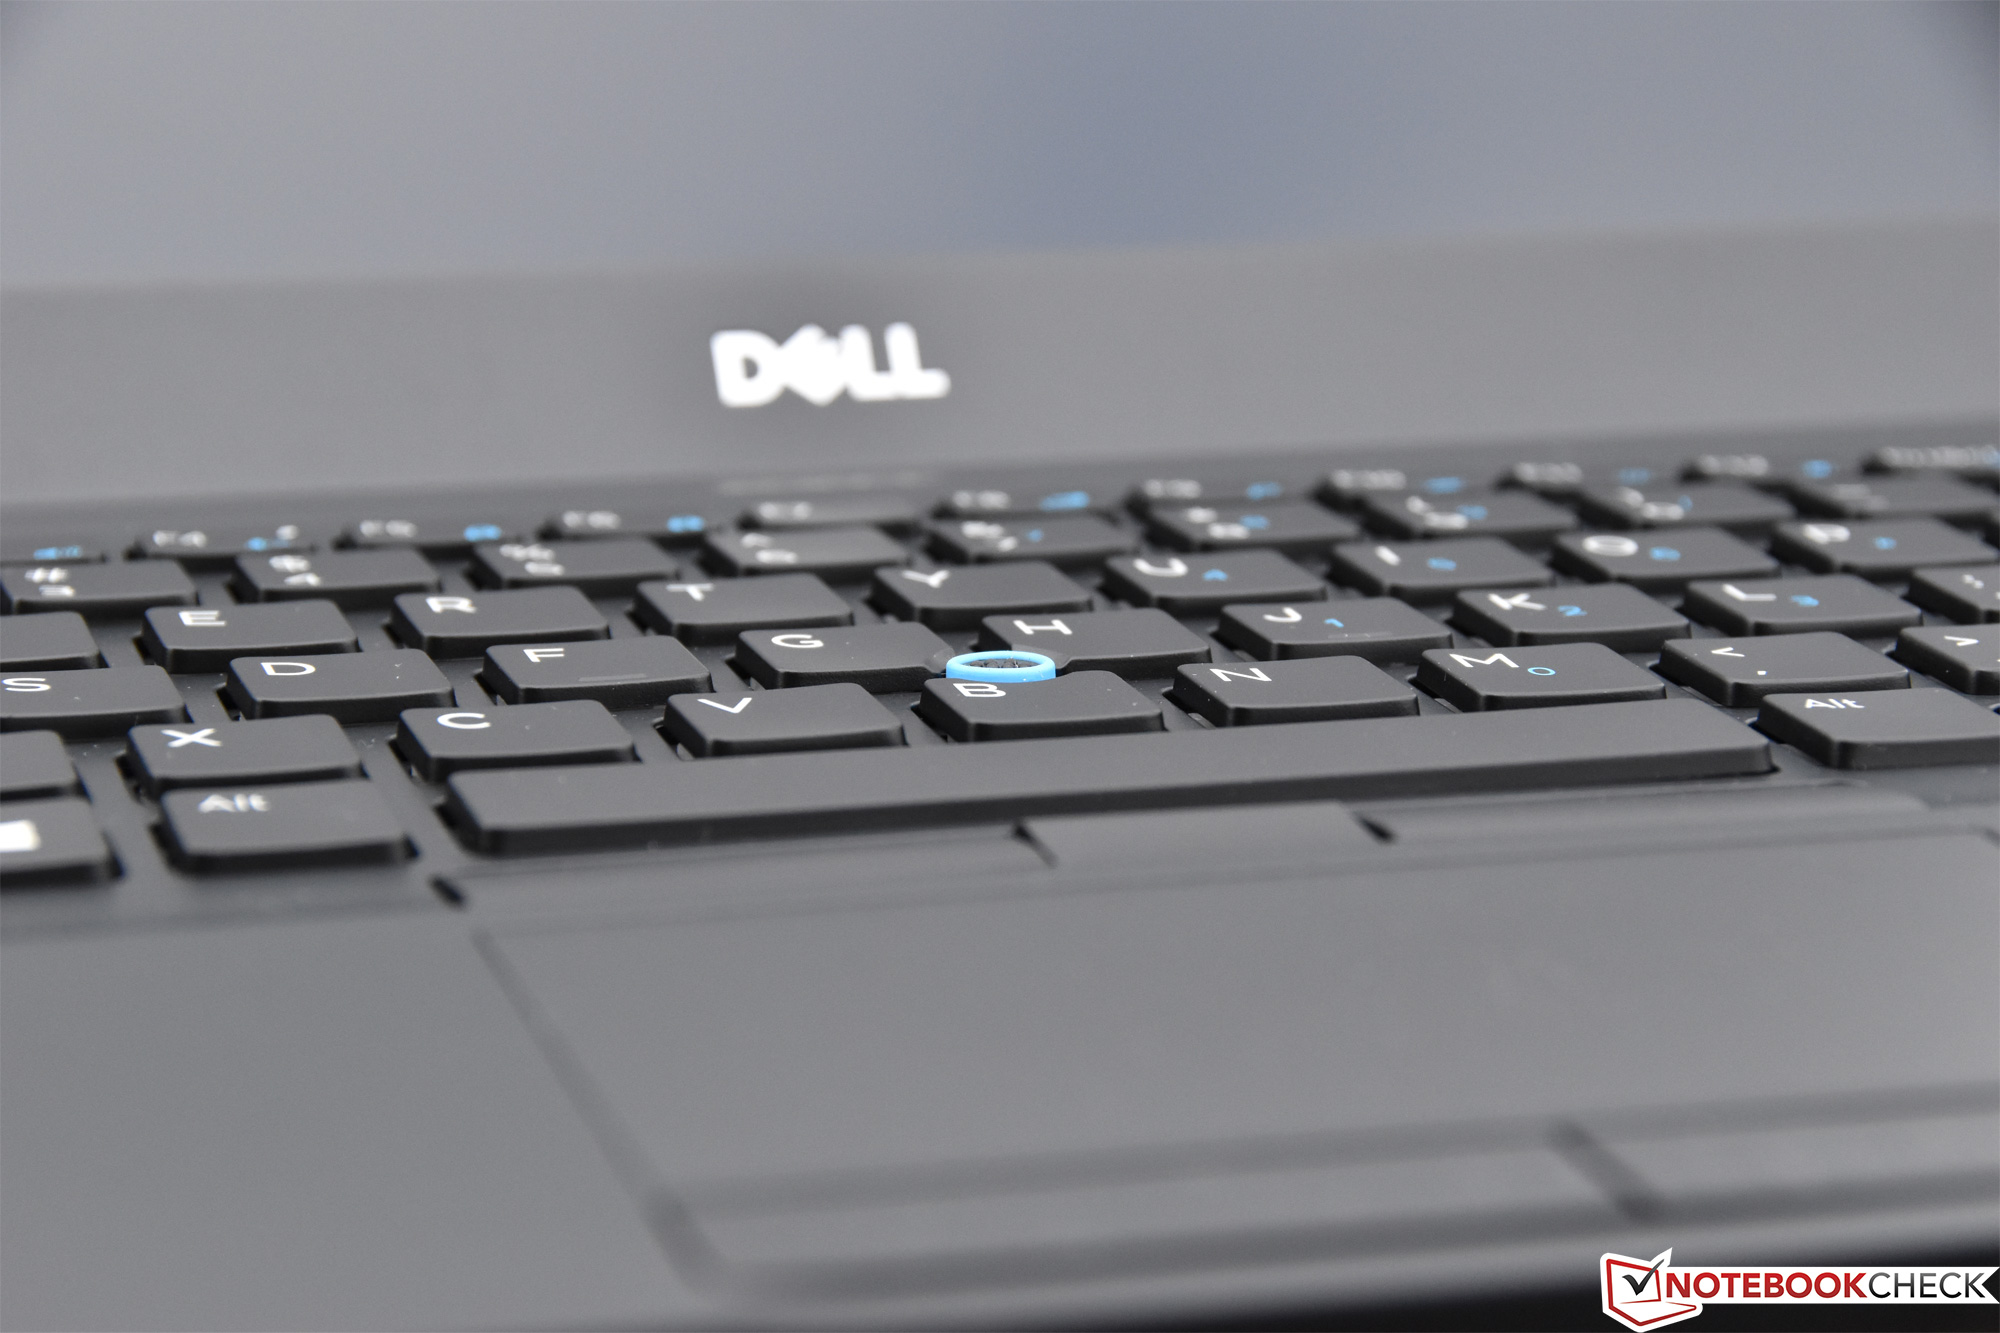
Alongside Lenovo’s ThinkPad devices, Dell Latitude 5000 and 7000 laptops consistently possess some of the highest-rated keyboards around. The Latitude 7490 is no exception; its chiclet keys are well-spaced, the layout is familiar, and visibility is very good (thanks to the black keys with white labels and a two-stage backlight that’s mostly even). Actuation force is medium and travel is lengthy—roughly 2 mm—with a good sense of feedback that supports fast typing without obtrusive noise. There is no “clatter” or unintended movement of keys. Overall, it’s an excellent keyboard and easily among the best we’ve reviewed.
Touchpad
Majorly improved over last generation’s version (on the Latitude 7480) is the Alps touchpad, which now supports Microsoft Precision drivers for a notably more responsive and smooth operation. We had absolutely no problems during our time with the unit; pointer movement is quick and without delay. Although it's not quite as large as the touchpads from some competitors, we didn't struggle much with real estate for the typical gestures, which are reliably interpreted. The two buttons below the pad are quiet yet springy and comfortable for long-term use—far better than most any integrated buttons.


Display
Today’s Latitude 7490 retains the 1920x1080 resolution, but exchanges the embedded touch display of our previous unit with a conventional IPS, non-touch, matte panel. Subjectively, color seems vivid, contrast appears strong, and brightness is fairly good. Our measurements revealed an average brightness of 294 cd/m²—ever-so-slightly below that of the embedded touch model—and a very good contrast ratio of 1342:1. While the ThinkPad T480s and the EliteBook 840 G5 in our comparison table only achieve results slightly above these, the X1 Carbon absolutely blows them all away with an average brightness of 533 cd/m²—and the 840 G5 offers a superior FHD IPS display option with a mind-blowing 630 cd/m² result. While today’s screen is certainly nice enough, Dell should consider stepping up their options for the next model to stay in competition.
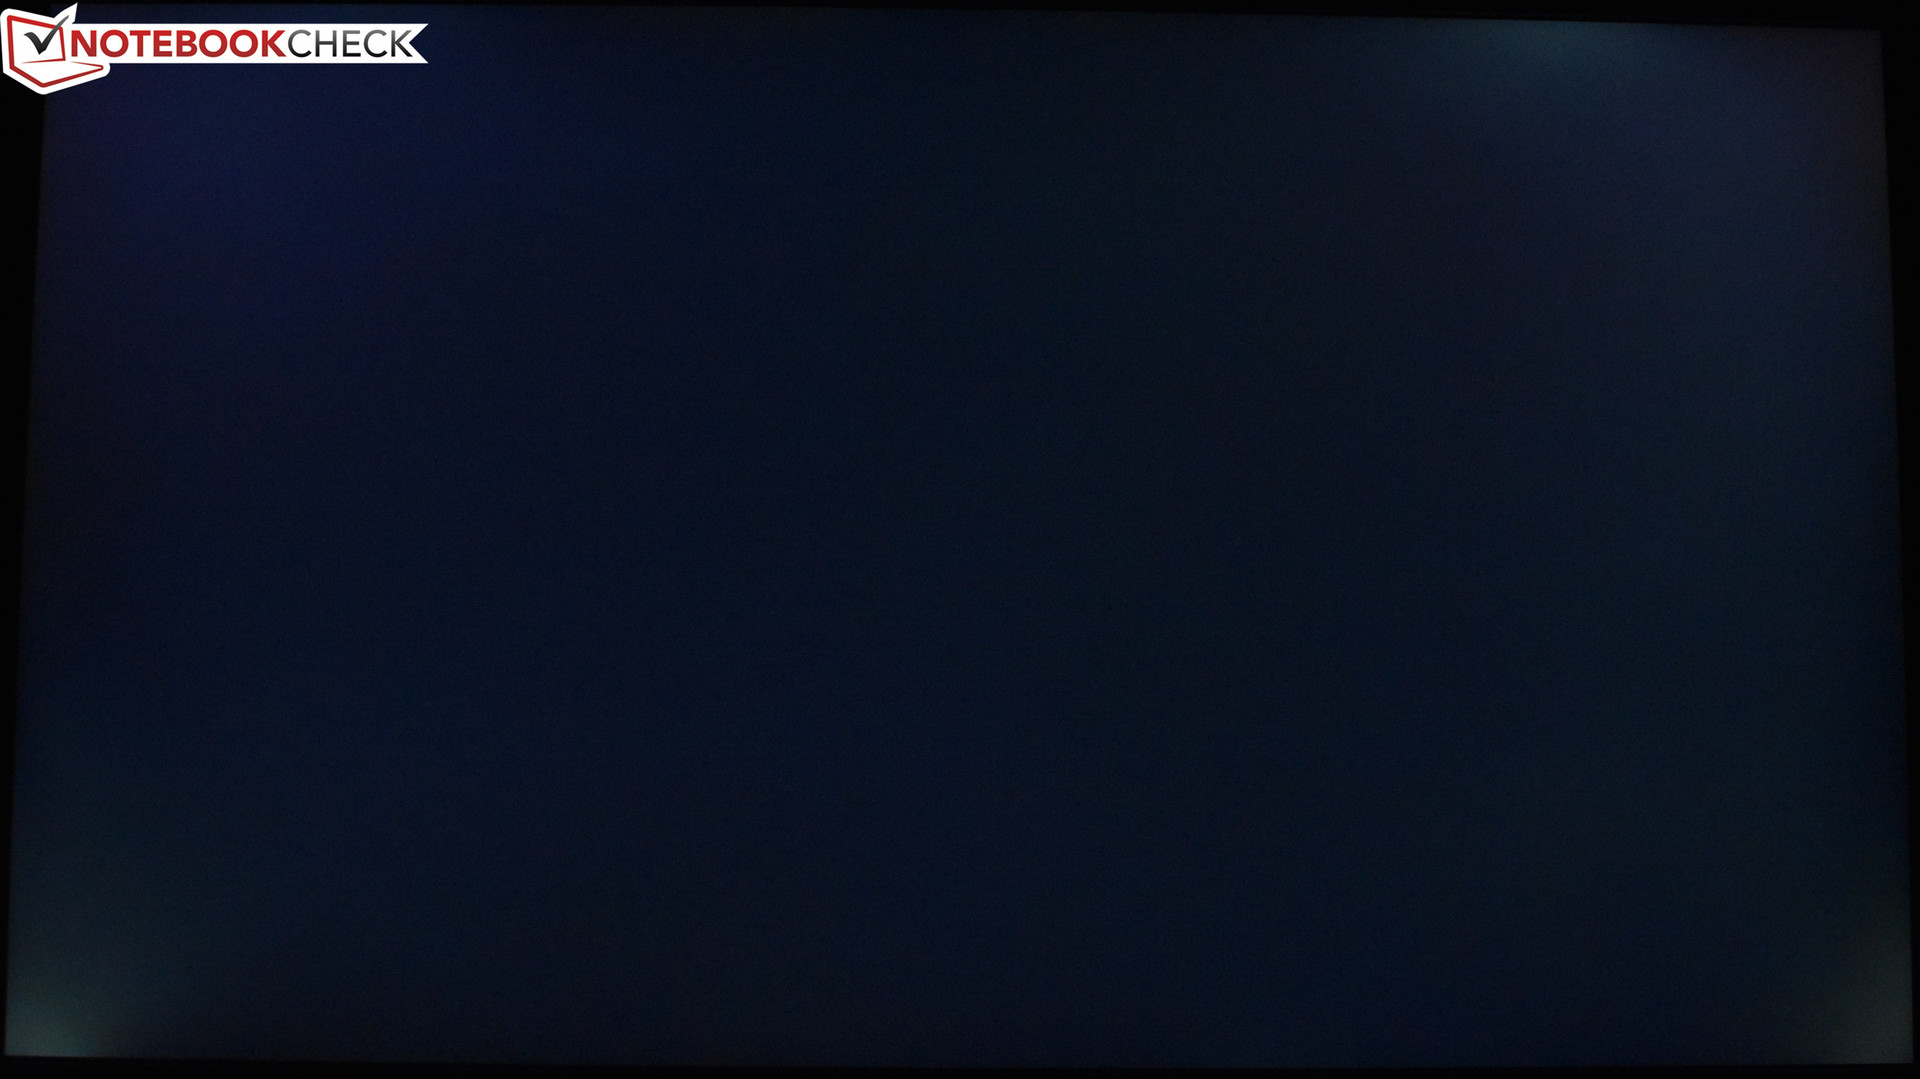
Our display did exhibit some unfortunate backlight bleed in the lower left and right corners, as well as near the top right corner. As a whole, brightness distribution was fairly good, however, at 89%.

| |||||||||||||||||||||||||
Brightness Distribution: 89 %
Center on Battery: 308.6 cd/m²
Contrast: 1342:1 (Black: 0.23 cd/m²)
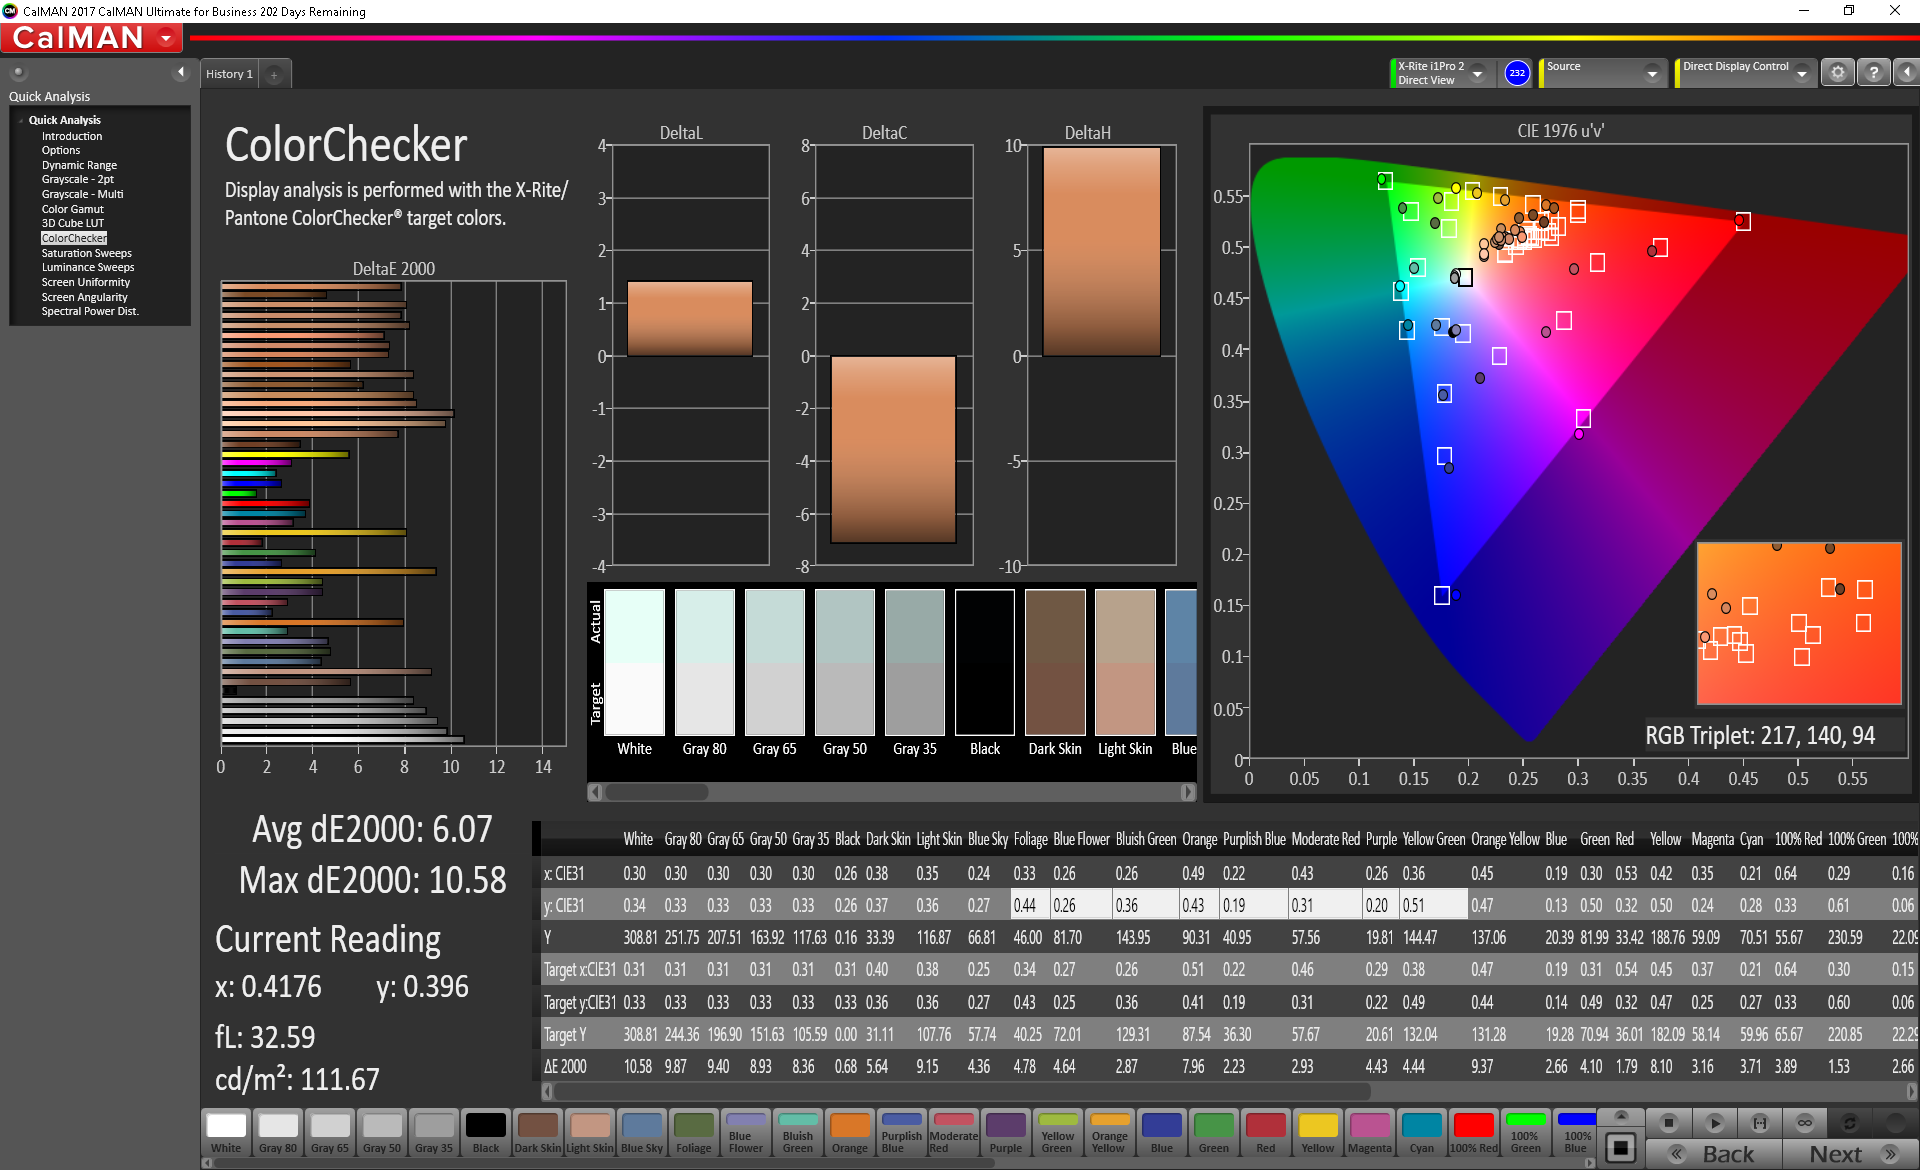
ΔE Color 6.07 | 0.5-29.43 Ø5, calibrated: 1.67
ΔE Greyscale 7.3 | 0.57-98 Ø5.3
97% sRGB (Argyll 1.6.3 3D)
62% AdobeRGB 1998 (Argyll 1.6.3 3D)
67.9% AdobeRGB 1998 (Argyll 2.2.0 3D)
96.8% sRGB (Argyll 2.2.0 3D)
66.6% Display P3 (Argyll 2.2.0 3D)
Gamma: 2.061
| Dell Latitude 7490 AUO503D (D04YD_B140HAN), IPS, 14.00, 1920x1080 | HP EliteBook 840 G5-3JX66EA AUO3B3D, IPS, 14.00, 1920x1080 | Dell Latitude 7390 LGD059B, IPS, 13.30, 1920x1080 | Lenovo ThinkPad T480s-20L8S02D00 LP140QH2-SPB1, IPS, 14.00, 2560x1440 | Lenovo ThinkPad X1 Carbon 2018-20KGS03900 B140QAN02.0, IPS, 14.00, 2560x1440 | Dell Latitude 7490 AU Optronics AU0223D, IPS, 14.00, 1920x1080 | |
|---|---|---|---|---|---|---|
| Display | -10% | 0% | 6% | 27% | -6% | |
| Display P3 Coverage | 66.6 | 60.2 -10% | 67.8 2% | 72.8 9% | 87.7 32% | 63.6 -5% |
| sRGB Coverage | 96.8 | 88.2 -9% | 95.1 -2% | 97.9 1% | 100 3% | 88.8 -8% |
| AdobeRGB 1998 Coverage | 67.9 | 61.3 -10% | 67.8 0% | 74.1 9% | 99.9 47% | 64.8 -5% |
| Response Times | -1% | 9% | 10% | -25% | -9% | |
| Response Time Grey 50% / Grey 80% * | 41.6 ? | 42.4 ? -2% | 36.8 ? 12% | 38.4 ? 8% | 59.2 ? -42% | 48.4 ? -16% |
| Response Time Black / White * | 32 ? | 31.6 ? 1% | 30.4 ? 5% | 28.4 ? 11% | 34.4 ? -8% | 32.4 ? -1% |
| PWM Frequency | ||||||
| Screen | 5% | 7% | 1% | 36% | -6% | |
| Brightness middle | 308.6 | 414 34% | 303.8 -2% | 352 14% | 578 87% | 328.2 6% |
| Brightness | 294 | 387 32% | 289 -2% | 343 17% | 533 81% | 305 4% |
| Brightness Distribution | 89 | 87 -2% | 86 -3% | 91 2% | 84 -6% | 87 -2% |
| Black Level * | 0.23 | 0.25 -9% | 0.31 -35% | 0.46 -100% | 0.38 -65% | 0.37 -61% |
| Contrast | 1342 | 1656 23% | 980 -27% | 765 -43% | 1521 13% | 887 -34% |
| Colorchecker dE 2000 * | 6.07 | 5.5 9% | 2.9 52% | 3.3 46% | 1.9 69% | 3.82 37% |
| Colorchecker dE 2000 max. * | 10.58 | 9.9 6% | 5.79 45% | 7.3 31% | 3.8 64% | 5.58 47% |
| Colorchecker dE 2000 calibrated * | 1.67 | 2.3 -38% | 1.72 -3% | 0.8 52% | 3.5 -110% | |
| Greyscale dE 2000 * | 7.3 | 6.4 12% | 3.7 49% | 5.3 27% | 3 59% | 3 59% |
| Gamma | 2.061 107% | 2.31 95% | 2.118 104% | 2.22 99% | 2.14 103% | 2.36 93% |
| CCT | 7269 89% | 7811 83% | 6323 103% | 6452 101% | 6377 102% | 6962 93% |
| Color Space (Percent of AdobeRGB 1998) | 62 | 56.9 -8% | 63 2% | 68.4 10% | 88.8 43% | 58 -6% |
| Color Space (Percent of sRGB) | 97 | 88.1 -9% | 95 -2% | 98 1% | 100 3% | 88 -9% |
| Total Average (Program / Settings) | -2% /
1% | 5% /
6% | 6% /
3% | 13% /
27% | -7% /
-7% |
* ... smaller is better
Color coverage is good at 97% of sRGB and 62% of AdobeRGB. This is roughly in line with the performance of HP’s EliteBook 840 G5, which just barely edges it out. However, the X1 Carbon runs away with the crown with a whopping 89% of AdobeRGB; the 7490 manages to cover just 64% of its displayed color gamut.


Out of the box, the 7490’s color accuracy measurements were only average. Using CalMAN, we recorded an average ColorChecker DeltaE2000 of 6.07 and a maximum of 10.58 (White), along wide a Greyscale DeltaE2000 average of 7.3. The CCT Average of 7269 is also on the cool side, and our Total Gamma reading of 2.061 is below the ideal value of 2.2. A bit of calibration works wonders; afterwards, ColorChecker and Greyscale DeltaE average values dropped to just 1.67 and 1.8 respectively.


Display Response Times
| ↔ Response Time Black to White | ||
|---|---|---|
| 32 ms ... rise ↗ and fall ↘ combined | ↗ 16.4 ms rise |  |
| ↘ 15.6 ms fall | ||
| The screen shows slow response rates in our tests and will be unsatisfactory for gamers. In comparison, all tested devices range from 0.1 (minimum) to 240 (maximum) ms. » 84 % of all devices are better. This means that the measured response time is worse than the average of all tested devices (21.5 ms). | ||
| ↔ Response Time 50% Grey to 80% Grey | ||
| 41.6 ms ... rise ↗ and fall ↘ combined | ↗ 22 ms rise |  |
| ↘ 19.6 ms fall | ||
| The screen shows slow response rates in our tests and will be unsatisfactory for gamers. In comparison, all tested devices range from 0.2 (minimum) to 636 (maximum) ms. » 62 % of all devices are better. This means that the measured response time is worse than the average of all tested devices (33.7 ms). | ||
Screen Flickering / PWM (Pulse-Width Modulation)
| Screen flickering / PWM not detected |  | ||
In comparison: 53 % of all tested devices do not use PWM to dim the display. If PWM was detected, an average of 17903 (minimum: 5 - maximum: 3846000) Hz was measured. | |||
The panel’s response times are a bit on the slow side, but PWM is not used for brightness management.
Reflections are no problem for the Latitude 7480, which—thanks to its good brightness and contrast and anti-glare finish—is usable in all but the brightest of environments. Viewing angles of the IPS panel are excellent.


Performance

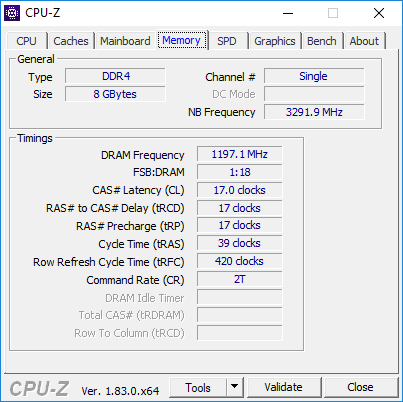
All Latitude 7490 machines pack Kaby Lake Refresh (8th generation) Intel CPUs ranging from dual-core Core i3 options up to quad-core Core i7 SoCs; all of the available chips operate under the constraints of 15 W TDP. While our previous review unit featured a Core i7 and 8 GB of dual-channel memory, today’s machine dials it back to an Intel Core i5-8350U and 8 GB of single-channel memory.
As it often does with the recent Latitude models, LatencyMon reported some issues with DPC latencies—which could translate to issues streaming real-time audio and video. Performance is not diminished while operating unplugged, however; a second run of 3DMark 11 on battery power resulted in a score of 1771, which is close enough to our original score to dispel any concerns.


Processor

While the 8th-generation Intel CPUs all tend to experience an initial short burst of performance before subsiding somewhat, the Intel Core i7 in our previous 7490 review unit still distances itself from the Core i5-8350U in our CPU tests—ahead by some 9% and 15% in the Cinebench R15 multi- and single-core tests, respectively. After the first few runs, average multi-core scores are closer to the 530 mark in our tests—again, below the less-consistent but still quite a bit higher (roughly) 570 we received over the long-term from the Core i7 model.
Compared with the rest of its peers, the 7490 roughly matches the EliteBook 840 G5, but it’s well below both the (larger) ThinkPad T480s and Core i7-equipped X1 Carbon. The Core i7 model fares better here, so if more power is needed, we’d recommend springing for that one. Naturally, however, for most users, today’s specifications will be perfectly sufficient.
System Performance
Whereas the Core i7 setup was close to the top in most of our general productivity benchmarks, today’s unit hovers around the middle of the pack, and ever-so-slightly below average for all notebooks powered by this CPU currently in our database. The PCMark 8 Work Score of 4906 is very good, while the PCMark 10 overall score of 3564 is slightly less impressive.
The primary reason for today’s lower scores is probably the surrender of NVMe storage in favor of less expensive conventional M.2 SATA storage. At any rate, subjectively speaking, the machine seems nimble enough.

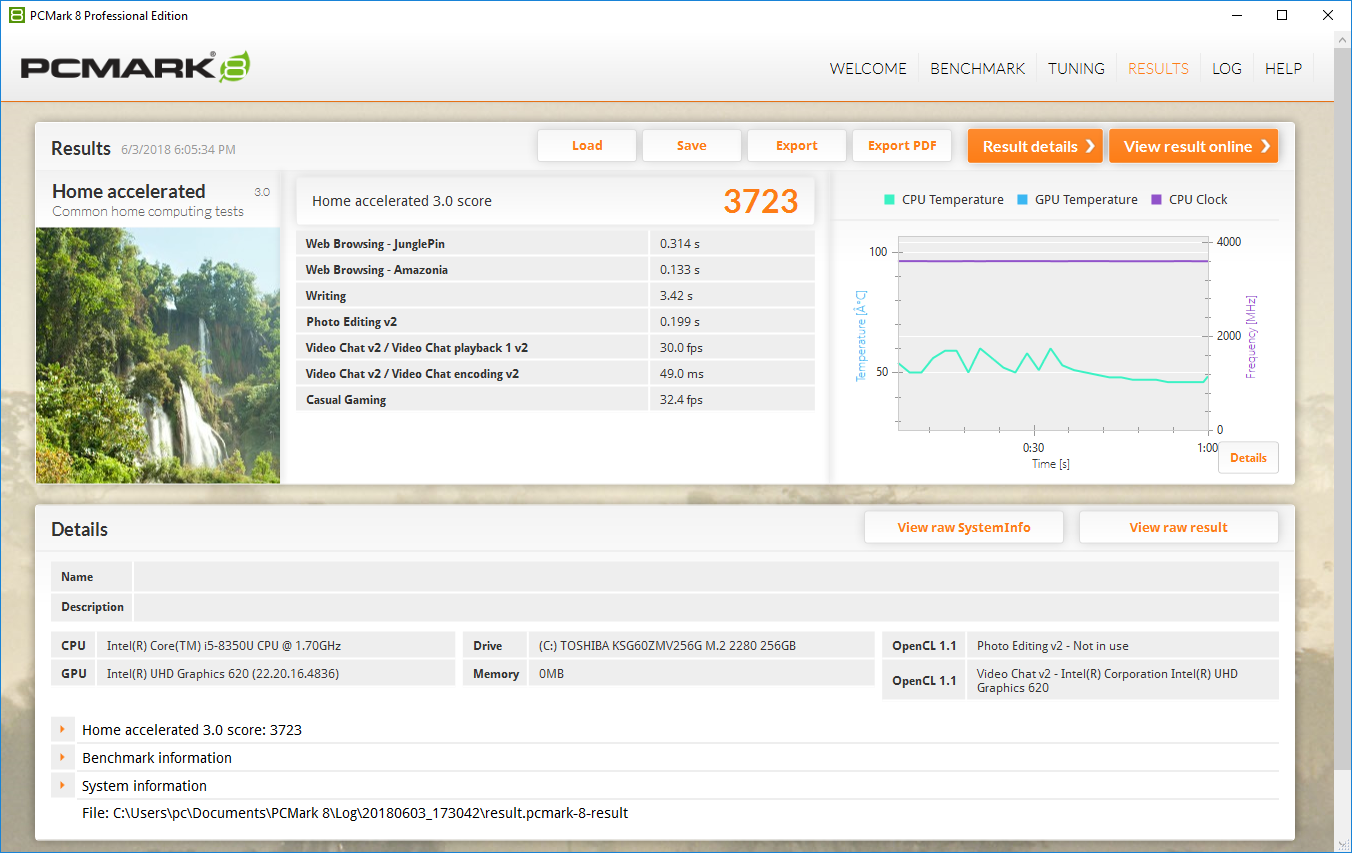

| PCMark 8 Home Score Accelerated v2 | 3723 points | |
| PCMark 8 Work Score Accelerated v2 | 4906 points | |
| PCMark 10 Score | 3564 points | |
Help | ||
Storage Devices
Predictably, storage speeds are well below those of the previous 7490, since this machine steps down to a Toshiba M.2 SATA drive from an NVMe Samsung PM961. Thanks to this, today’s unit is by far the lowest-scoring of all those in our field. Nevertheless (as we alluded to above), once a certain level of performance is reached, most users aren’t likely to notice any difference. Plus, the replacement/upgrade procedure (as we covered previously) is simple—so if cost trumps top-end performance concerns, this would be a logical place to pull back.
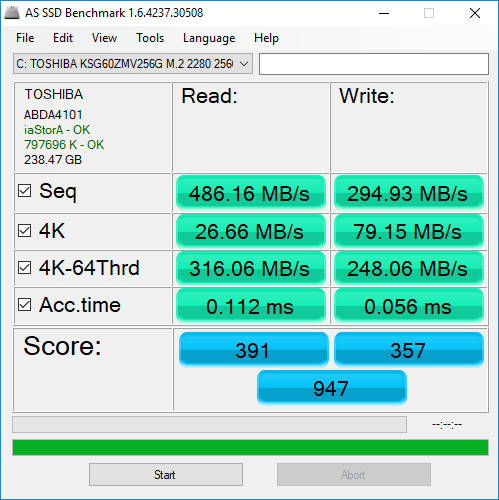

| Dell Latitude 7490 Toshiba KSG60ZMV256G | Dell Latitude 7490 Samsung PM961 MZVLW256HEHP | HP EliteBook 840 G5-3JX66EA Toshiba XG5 KXG50ZNV256G | Dell Latitude 7390 Samsung PM961 MZVLW256HEHP | Lenovo ThinkPad X1 Carbon 2018-20KGS03900 Samsung SSD PM981 MZVLB512HAJQ | Average Toshiba KSG60ZMV256G | |
|---|---|---|---|---|---|---|
| AS SSD | 135% | 19% | 113% | 238% | 0% | |
| Copy Game MB/s | 382.3 | 309.3 | 352 | 1107 | ||
| Copy Program MB/s | 227.1 | 168.2 | 247.4 | 460.2 | ||
| Copy ISO MB/s | 872 | 319.2 | 818 | 1247 | ||
| Score Total | 947 | 2350 148% | 1232 30% | 2215 134% | 3529 273% | 947 ? 0% |
| Score Write | 357 | 536 50% | 376 5% | 501 40% | 1801 404% | 357 ? 0% |
| Score Read | 391 | 1242 218% | 603 54% | 1158 196% | 1168 199% | 391 ? 0% |
| Access Time Write * | 0.056 | 0.03 46% | 0.053 5% | 0.032 43% | 0.027 52% | 0.056 ? -0% |
| Access Time Read * | 0.112 | 0.04 64% | 0.321 -187% | 0.063 44% | 0.029 74% | 0.112 ? -0% |
| 4K-64 Write | 248.1 | 329.6 33% | 248.3 0% | 302.4 22% | 1529 516% | 248 ? 0% |
| 4K-64 Read | 316.1 | 955 202% | 413.3 31% | 932 195% | 876 177% | 316 ? 0% |
| 4K Write | 79.2 | 114.9 45% | 93.6 18% | 115.2 45% | 134.3 70% | 79.2 ? 0% |
| 4K Read | 26.66 | 48.13 81% | 29.01 9% | 49.43 85% | 52.4 97% | 26.7 ? 0% |
| Seq Write | 294.9 | 919 212% | 339 15% | 830 181% | 1376 367% | 295 ? 0% |
| Seq Read | 486.2 | 2385 391% | 1611 231% | 1761 262% | 2396 393% | 486 ? 0% |
* ... smaller is better

GPU Performance
Today’s Latitude not only dials back the CPU (as discussed above), but it also downgrades the RAM configuration to single-channel—which does in fact affect the performance of integrated graphics. As a result, our scores are some 16% to 22% below those of the 7490 we reviewed in April, and near the bottom of the pack overall (which the X1 Carbon dominates).
Needless to say, this isn’t enough horsepower to run any modern games at even low settings—but the Latitude 7490 isn’t a gaming machine. If graphical performance is of any significant concern, we’d advise springing for the higher-end configurations (with both Core i7 CPU and dual-channel memory) if possible.


| 3DMark 11 Performance | 1797 points | |
| 3DMark Cloud Gate Standard Score | 7414 points | |
| 3DMark Fire Strike Score | 934 points | |
Help | ||
| Metro: Last Light | |
| 1024x768 Low (DX10) AF:4x (sort by value) | |
| Dell Latitude 7490 | |
| Average Intel UHD Graphics 620 (23.3 - 41, n=5) | |
| 1366x768 Medium (DX10) AF:4x (sort by value) | |
| Dell Latitude 7490 | |
| Average Intel UHD Graphics 620 (16.4 - 28, n=4) | |
| 1366x768 High (DX11) AF:16x (sort by value) | |
| Dell Latitude 7490 | |
| Average Intel UHD Graphics 620 (13 - 16, n=3) | |
| 1920x1080 Very High (DX11) AF:16x (sort by value) | |
| Dell Latitude 7490 | |
| Average Intel UHD Graphics 620 (6 - 8, n=3) | |
| Rise of the Tomb Raider | |
| 1024x768 Lowest Preset (sort by value) | |
| Dell Latitude 7490 | |
| HP EliteBook 840 G5-3JX66EA | |
| Lenovo ThinkPad X1 Carbon 2018-20KGS03900 | |
| Average Intel UHD Graphics 620 (10.4 - 110.7, n=82) | |
| 1366x768 Medium Preset AF:2x (sort by value) | |
| Dell Latitude 7490 | |
| HP EliteBook 840 G5-3JX66EA | |
| Lenovo ThinkPad X1 Carbon 2018-20KGS03900 | |
| Average Intel UHD Graphics 620 (6.5 - 49.3, n=62) | |
| 1920x1080 High Preset AA:FX AF:4x (sort by value) | |
| Dell Latitude 7490 | |
| HP EliteBook 840 G5-3JX66EA | |
| Lenovo ThinkPad X1 Carbon 2018-20KGS03900 | |
| Average Intel UHD Graphics 620 (4.9 - 32, n=42) | |
| low | med. | high | ultra | |
| BioShock Infinite (2013) | 52 | 35 | 24 | 8 |
| Metro: Last Light (2013) | 31 | 23 | 15 | 6 |
| Rise of the Tomb Raider (2016) | 17 | 11 | 6 |
Stress Test
As we’d expect from our previous tests, full stress sees an initial jump to max turbo frequencies of 3.6 GHz and concomitant core temperature jumps to 98 °C, but several seconds later the machine relents and we instead witness drops to around the 2.6 – 2.7 GHz range, where it remains thereafter. GPU stress by itself, meanwhile, isn’t quite as challenging for the system; clock rates are fairly consistent within the 1000 – 1100 MHz range, and temperatures reach 88 °C.
Combined stress results in temperatures quickly rocketing into the mid-90s C shortly followed by a drop in clock rates to 1.5 GHz (CPU) and 900 MHz (GPU). This is fairly common behavior for similarly-equipped machines.


| CPU Clock (GHz) | GPU Clock (MHz) | Average CPU Temperature (°C) | Average GPU Temperature (°C) | |
| Prime95 Stress | 2.6 - 2.7 | - | 78 | - |
| FurMark Stress | - | 1000 - 1100 | - | 88 |
| Prime95 + FurMark Stress | 1.5 | 900 | 76 | 76 |
Emissions
System Noise

The Latitude 7490 never was a loud machine, and it’s even quieter with today’s less power-hungry configuration. By slim margins, it’s in fact the quietest machine in our field, topping out at just 40.2 dB(A) and averaging under load a mere 29.9 dB(A)—barely above the ambient noise measurement of 28.2 dB(A). Like all of its competitors, while idling, the fan rarely even engages; and even when it does, noise levels barely increase to a paltry 29.9 dB(A).
We did not detect any coil whine from our Latitude 7490 review unit.
Noise Level
| Idle |
| 28.2 / 28.2 / 28.7 dB(A) |
| Load |
| 29.9 / 40.2 dB(A) |
 | ||
30 dB silent 40 dB(A) audible 50 dB(A) loud |
||
min: | ||

| Dell Latitude 7490 UHD Graphics 620, i5-8350U, Toshiba KSG60ZMV256G | HP EliteBook 840 G5-3JX66EA UHD Graphics 620, i5-8250U, Toshiba XG5 KXG50ZNV256G | Dell Latitude 7390 UHD Graphics 620, i7-8650U, Samsung PM961 MZVLW256HEHP | Lenovo ThinkPad T480s-20L8S02D00 UHD Graphics 620, i5-8250U, Samsung SSD PM981 MZVLB512HAJQ | Lenovo ThinkPad X1 Carbon 2018-20KGS03900 UHD Graphics 620, i5-8550U, Samsung SSD PM981 MZVLB512HAJQ | Dell Latitude 7490 UHD Graphics 620, i7-8650U, Samsung PM961 MZVLW256HEHP | |
|---|---|---|---|---|---|---|
| Noise | -5% | -2% | -5% | -4% | -3% | |
| off / environment * | 28.2 | 28.8 -2% | 28.2 -0% | 28.9 -2% | 28.9 -2% | 28.2 -0% |
| Idle Minimum * | 28.2 | 28.8 -2% | 28.2 -0% | 28.9 -2% | 28.9 -2% | 28.2 -0% |
| Idle Average * | 28.2 | 28.8 -2% | 28.2 -0% | 28.9 -2% | 28.9 -2% | 28.2 -0% |
| Idle Maximum * | 28.7 | 33.1 -15% | 28.2 2% | 28.9 -1% | 32.5 -13% | 31.4 -9% |
| Load Average * | 29.9 | 35.2 -18% | 31.5 -5% | 36.9 -23% | 35.1 -17% | 31.7 -6% |
| Load Maximum * | 40.2 | 35.2 12% | 42.7 -6% | 38.9 3% | 35.1 13% | 41.2 -2% |
* ... smaller is better
Temperature
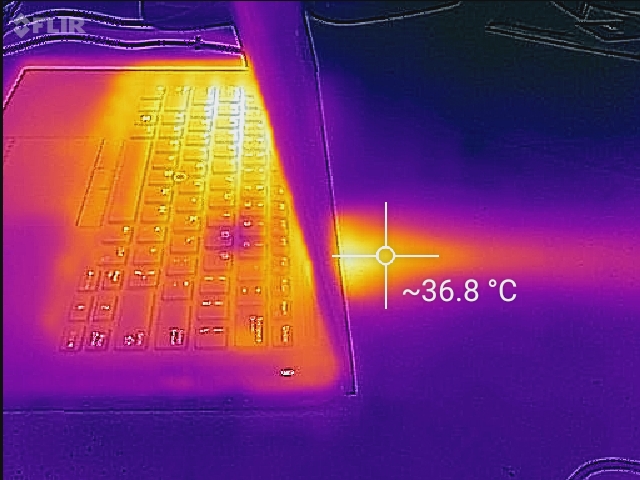
Temperatures haven’t changed much since the Core i7 model, with load averages on top/bottom 35.2 °C and 37.5 °C, respectively (within a degree C of the previous measurements—though room temperatures were also a degree higher during today’s measurements, so it’s really closer to 1.5 °C or so of a drop). Idle values are actually higher, which might be an idiosyncrasy of firmware or something similar (because no other logical explanation suffices). Here, we recorded values of 28.7 °C and 32.5 °C, well above room temperatures.
Unfortunately, while stressed, most of the heat is concentrated near the rear center and right side of the device (the left side while sitting upright), so lap-based use during any sort of significant load is likely to become uncomfortable in short order.
(-) The maximum temperature on the upper side is 45.2 °C / 113 F, compared to the average of 34.2 °C / 94 F, ranging from 21.2 to 62.5 °C for the class Office.
(-) The bottom heats up to a maximum of 51.6 °C / 125 F, compared to the average of 36.7 °C / 98 F
(+) In idle usage, the average temperature for the upper side is 28.7 °C / 84 F, compared to the device average of 29.5 °C / 85 F.
(+) The palmrests and touchpad are cooler than skin temperature with a maximum of 30.4 °C / 86.7 F and are therefore cool to the touch.
(-) The average temperature of the palmrest area of similar devices was 27.7 °C / 81.9 F (-2.7 °C / -4.8 F).


Speakers
The two down-firing, bottom-mounted speakers in the Latitude 7490 can’t hold a candle to those of the older (and thicker) Latitude 7000 models such as the 7440 and 7450, but they’re still better that most other direct competitors. Volume is merely average at 77.31 dB, but mids and highs are balanced and at least inoffensive in terms of their linearity. Bass, as always, is mostly absent.

Dell Latitude 7490 audio analysis
(±) | speaker loudness is average but good (77.3 dB)
Bass 100 - 315 Hz
(±) | reduced bass - on average 13.6% lower than median
(±) | linearity of bass is average (10.5% delta to prev. frequency)
Mids 400 - 2000 Hz
(+) | balanced mids - only 3.9% away from median
(±) | linearity of mids is average (7.3% delta to prev. frequency)
Highs 2 - 16 kHz
(+) | balanced highs - only 3.4% away from median
(±) | linearity of highs is average (8.8% delta to prev. frequency)
Overall 100 - 16.000 Hz
(±) | linearity of overall sound is average (18.8% difference to median)
Compared to same class
» 29% of all tested devices in this class were better, 7% similar, 64% worse
» The best had a delta of 7%, average was 22%, worst was 53%
Compared to all devices tested
» 38% of all tested devices were better, 8% similar, 54% worse
» The best had a delta of 4%, average was 25%, worst was 134%
Lenovo ThinkPad X1 Carbon 2018-20KGS03900 audio analysis
(+) | speakers can play relatively loud (83.6 dB)
Bass 100 - 315 Hz
(-) | nearly no bass - on average 25.9% lower than median
(±) | linearity of bass is average (9.8% delta to prev. frequency)
Mids 400 - 2000 Hz
(+) | balanced mids - only 3.8% away from median
(±) | linearity of mids is average (9% delta to prev. frequency)
Highs 2 - 16 kHz
(+) | balanced highs - only 2.1% away from median
(+) | highs are linear (4% delta to prev. frequency)
Overall 100 - 16.000 Hz
(±) | linearity of overall sound is average (18.7% difference to median)
Compared to same class
» 29% of all tested devices in this class were better, 6% similar, 65% worse
» The best had a delta of 7%, average was 22%, worst was 53%
Compared to all devices tested
» 37% of all tested devices were better, 8% similar, 55% worse
» The best had a delta of 4%, average was 25%, worst was 134%
Energy Management
Power Consumption
Partially because of its lack of NVMe storage, the Latitude 7490 is an extremely efficient device while idling. We measured just 4.7 W average, with min/max values of 2/5.7 W. This is the lowest of any machine we’re comparing today. Perhaps even more impressive is the measured maximum of 38.9 W—well below most other machines, and even nearly 5 W below that of its Core i7/NVMe-equipped predecessor.
| Off / Standby | |
| Idle | |
| Load |
|
| Dell Latitude 7490 i5-8350U, UHD Graphics 620, Toshiba KSG60ZMV256G, IPS, 1920x1080, 14.00 | HP EliteBook 840 G5-3JX66EA i5-8250U, UHD Graphics 620, Toshiba XG5 KXG50ZNV256G, IPS, 1920x1080, 14.00 | Dell Latitude 7390 i7-8650U, UHD Graphics 620, Samsung PM961 MZVLW256HEHP, IPS, 1920x1080, 13.30 | Lenovo ThinkPad T480s-20L8S02D00 i5-8250U, UHD Graphics 620, Samsung SSD PM981 MZVLB512HAJQ, IPS, 2560x1440, 14.00 | Lenovo ThinkPad X1 Carbon 2018-20KGS03900 i5-8550U, UHD Graphics 620, Samsung SSD PM981 MZVLB512HAJQ, IPS, 2560x1440, 14.00 | Dell Latitude 7490 i7-8650U, UHD Graphics 620, Samsung PM961 MZVLW256HEHP, IPS, 1920x1080, 14.00 | |
|---|---|---|---|---|---|---|
| Power Consumption | -46% | -26% | -55% | -69% | -30% | |
| Idle Minimum * | 2 | 3.2 -60% | 3.3 -65% | 3.1 -55% | 3.8 -90% | 3.1 -55% |
| Idle Average * | 4.7 | 6.6 -40% | 5.9 -26% | 6.8 -45% | 8.9 -89% | 6.5 -38% |
| Idle Maximum * | 5.7 | 9.5 -67% | 6.2 -9% | 10.1 -77% | 11.9 -109% | 7.6 -33% |
| Load Average * | 38.4 | 36.2 6% | 43.2 -13% | 48.4 -26% | 47.5 -24% | 43 -12% |
| Load Maximum * | 38.9 | 65.6 -69% | 45.2 -16% | 67.1 -72% | 52.5 -35% | 43.8 -13% |
* ... smaller is better
Battery Life

We recorded a battery runtime of 9 hours and 8 minutes in our standardized web surfing benchmark, which is slightly above competitors like the ThinkPad T480s and X1 Carbon, and well above the HP EliteBook 840 G5’s 7 hours and 27 minutes. The Latitude 7390 (with its slightly smaller screen) easily takes the cake here, however, with a terrific result of 11 hours and 4 minutes.
| Dell Latitude 7490 i5-8350U, UHD Graphics 620, 60 Wh | HP EliteBook 840 G5-3JX66EA i5-8250U, UHD Graphics 620, 50 Wh | Dell Latitude 7390 i7-8650U, UHD Graphics 620, 60 Wh | Lenovo ThinkPad T480s-20L8S02D00 i5-8250U, UHD Graphics 620, 57 Wh | Lenovo ThinkPad X1 Carbon 2018-20KGS03900 i5-8550U, UHD Graphics 620, 57 Wh | Dell Latitude 7490 i7-8650U, UHD Graphics 620, 60 Wh | |
|---|---|---|---|---|---|---|
| Battery Runtime | ||||||
| WiFi v1.3 | 548 | 447 -18% | 664 21% | 537 -2% | 519 -5% | 561 2% |
Pros
Cons
Verdict
Once again, we come away from a Dell Latitude 7000 series machine thoroughly impressed. Along with Lenovo’s ThinkPads and HP’s EliteBooks, the Latitudes stand head and shoulders above the rest of the business competition. They’re thoughtfully designed, smartly updated, and carefully revised. While the 7490 remains a mere iterative update to the 7480 in every sense of the term, it truly leaves little to be desired. The case is sturdy, subdued, and attractive, the weight is manageable, the input devices are top-notch, performance is very good, battery life is lengthy, and it’s a quiet companion. The few areas of improvement we’d like to see are display options to match its competitors, improved thermal management, and better speakers.
Once again, we come away from a Dell Latitude 7000 series machine thoroughly impressed. Today’s $1,709 Latitude 7490 absolutely deserves consideration by anyone in the market for a premium business laptop.
Today’s less expensive configuration lacks the Core i7, NVMe storage, touchscreen, and some of the biometric and security features of April’s review unit—but it’s also only $1,709 (as compared to over $2,000 for the previous model). Those who don’t require dual-channel memory or any of the previously listed omissions would find little to complain about in this setup. CPU performance is roughly between 10 and 15 percent below that of the Core i7-equipped unit, and GPU performance around 15 to 22 percent lower (though this is also a factor of dual-channel memory in our i7 configuration). As such, we’d suggest that upgrading to that SKU only makes sense if top-end CPU and GPU performance is of the utmost importance. Alongside the X1 Carbon, T480s, EliteBook 840 G5, and Latitude 7390, the Latitude 7490 absolutely deserves consideration by anyone in the market for a premium business laptop.
Dell Latitude 7490
-
06/21/2018 v6(old)
Steve Schardein
Pricecompare
