Intel Arc 8-Core iGPU vs AMD Radeon RX 6650M
Intel Arc 8-Core iGPU ► remove from comparison
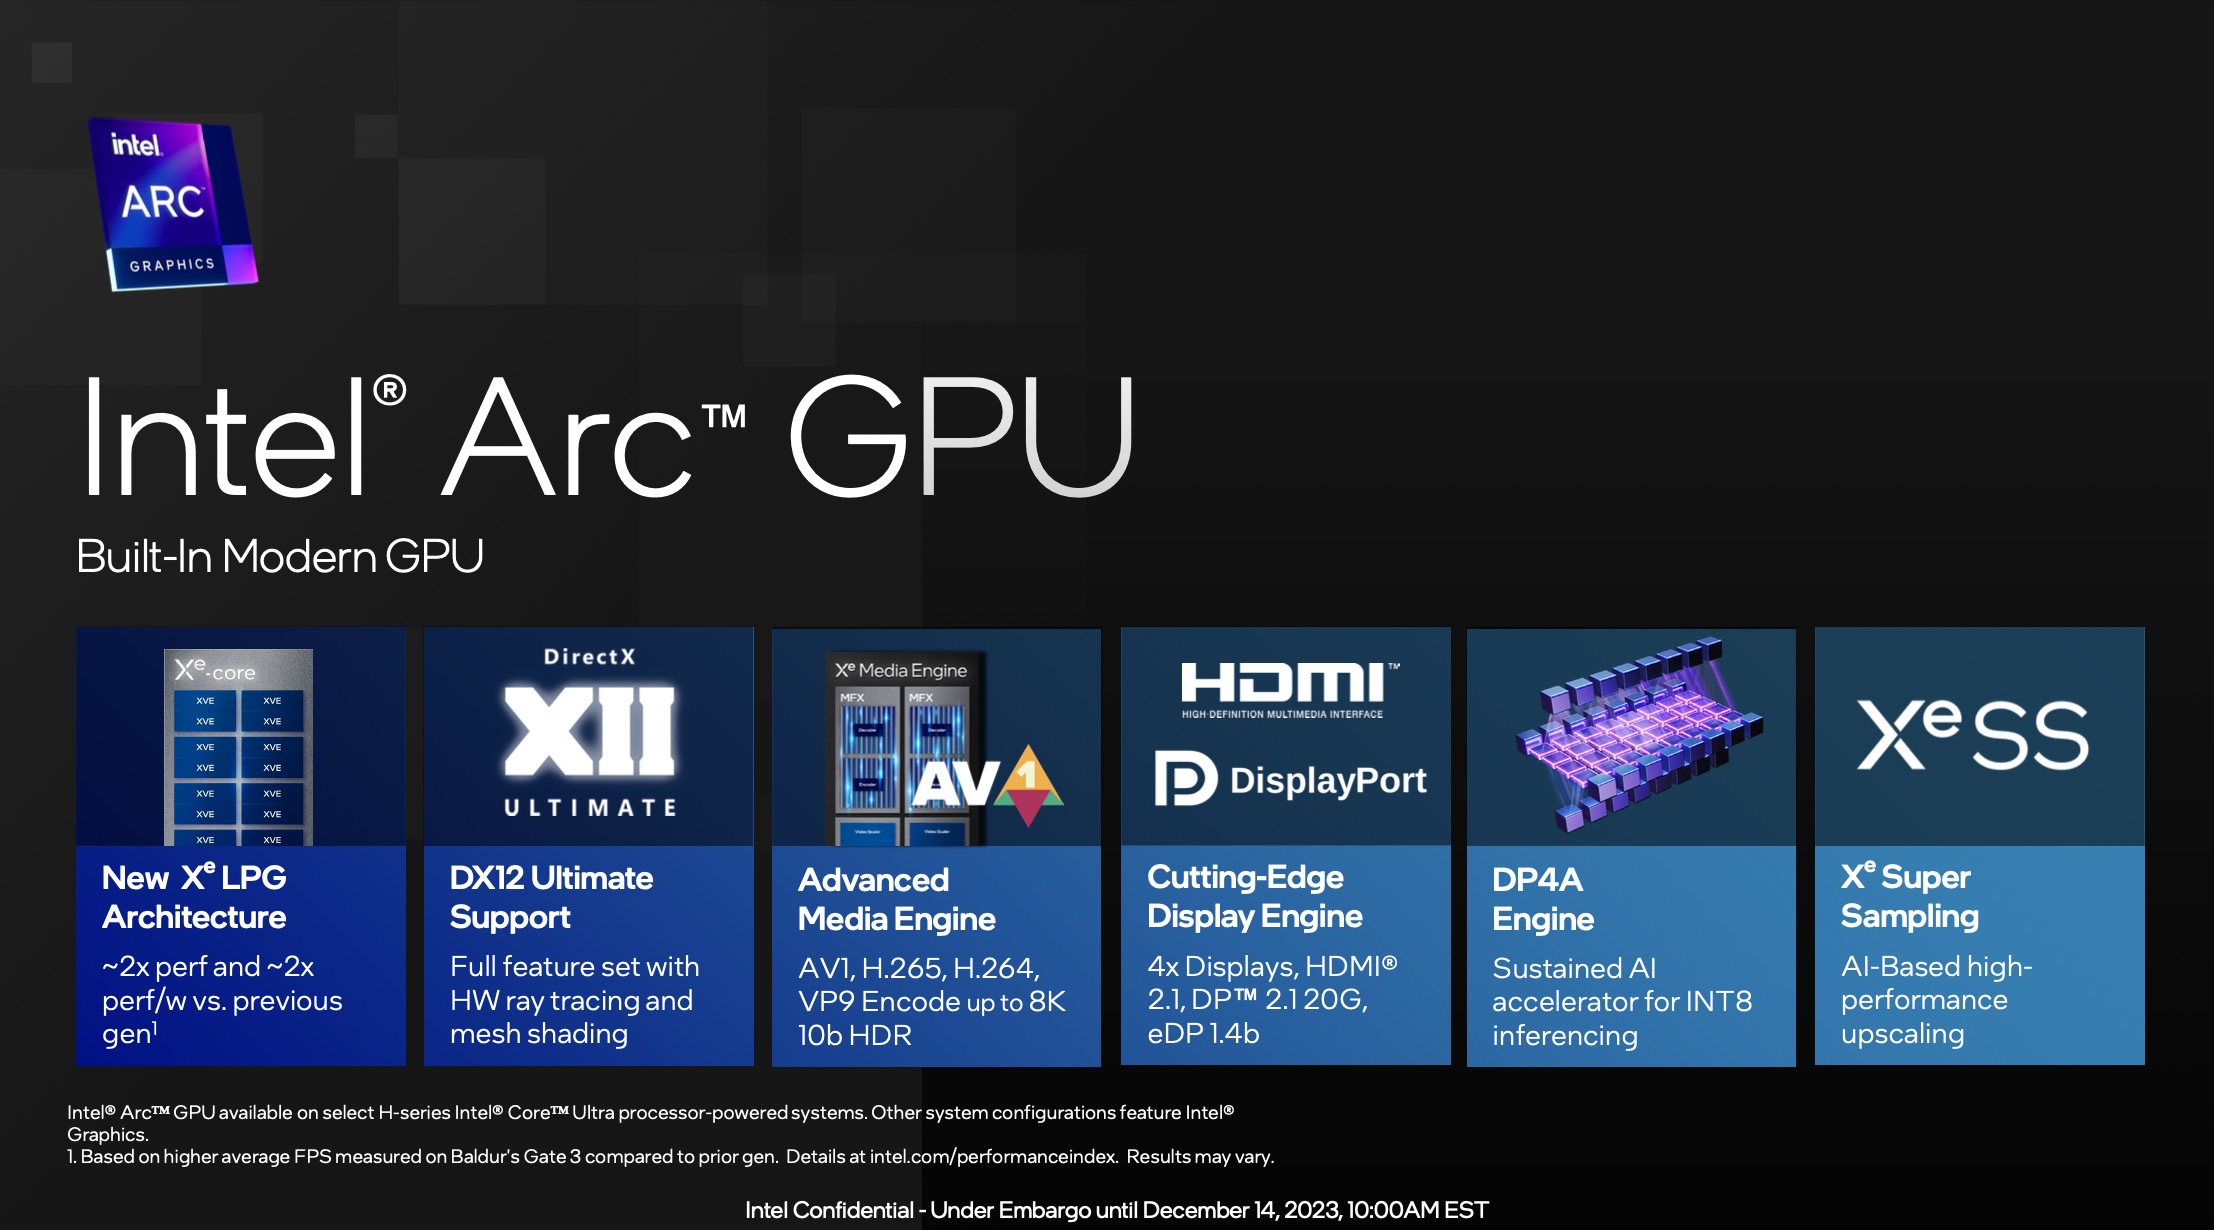
The Intel Arc iGPU with 8 cores (ID 7D55) is an integrated graphics adapter in Meteor Lake SoCs based on the Xe LPG architecture (similar to the dedicated Arc GPUs, but with a focus on efficiency). It offers all 8 Xe cores (128 Xe vector engines), 8 ray tracing units, 8 samplers and 4 pixel backends.
The Arc name may only be used if at least 16 GB RAM is used in dual channel mode. Otherwise, the only iGPU is called "Intel Graphics " and is also significantly slower.
According to Intel, performance has been doubled compared to the previous generation (probably still in Alder Lake).
The iGPU supports DirectX 12 Ultimate (probably DX 12_2 like the desktop Arc GPUs). The graphics unit also supports XeSS AI Super Sampling.
The media engine of Meteor Lake is in the SOC tile and supports up to 8k60 10-bit HDR encode and decode of MPEG2, AVC, VP9, HEVC and AV1. The display engine is also in the SoC tile and supports HDMI 2.1 and DisplayPort 2.1 20G with up to 8K60 HDR.
The GPU Tile of the Meteor Lake chip is manufactured at TSMC on 5nm (5N process).
AMD Radeon RX 6650M ► remove from comparison
The AMD Radeon RX 6650M is a mobile mid-range graphics card based on the Navi 23 chip (RDNA 2 architecture) manufactured in the modern 7nm process. It features 1,792 cores (28 CUs - compute units) and 8 GB of fast GDDR6 graphics memory connected with a 128 Bit memory bus. The chip also includes 32 MB Infinity Cache. The clock speed of the cores will depend on the laptop according to AMD. The specified game clock speed is 2222 MHz and therefore only slightly more than the RX 6600M. The power consumption (TDP settings) ranges from 100 - 120 Watt (similar to Nvidia).
AMD compares the performance to the RTX 3060 for laptops and similar to the RX 6600M . When Raytracing effects are activated, it falls behind the GeForce GPUs.
The Navi 21 chip is manufactured at TSMC in the modern 7nm process.
Intel Arc 8-Core iGPU AMD Radeon RX 6650M Radeon RX 6000M Series Codename Meteor Lake iGPU Architecture Xe LPG RDNA 2 Pipelines 8 - unified 1792 - unified Raytracing Cores 8 Core Speed 2300 (Boost) MHz 2222 (Boost) MHz Cache L1: 1.5 MB Shared Memory yes no API DirectX 12_2, OpenGL 4.6, Vulkan 1.3 DirectX 12, Shader 6.4, OpenGL 4.6 technology 5 nm 7 nm Displays HDMI 2.1b, DisplayPort 2.0 20G Date of Announcement 14.12.2023 04.01.2022 Memory Speed 18000 MHz Memory Bus Width 128 Bit Memory Type GDDR6 Max. Amount of Memory 8 GB Power Consumption 120 Watt Transistors 11.1 Billion Features DisplayPort 1.4 w/DFSC, HDMI 2.0b, Radeon Media Engine (H.264 4K150 decode, 4K90 encode / H.265 4K90 decode, 4K60 encode / VP9 4K90 decode) Notebook Size large Link to Manufacturer Page www.amd.com
Benchmarks Performance Rating - 3DMark 11 + Fire Strike + Time Spy - Arc 8-Core
3.9 pt (12%)
...
...
max:
3DMark - 3DMark Time Spy Score
min: 2178 avg: 3516 median: 3574.5 (10%) max: 4176 Points
8869 Points (26%)
GPU TDP ? TDP 105 W 40% 100%
3DMark - 3DMark Time Spy Graphics
min: 2018 avg: 3206 median: 3238.5 (9%) max: 3770 Points
8700 Points (23%)
GPU TDP ? TDP 105 W 37% 100%
3DMark - 3DMark Ice Storm Unlimited Graphics
397122 Points (45%)
3DMark - 3DMark Ice Storm Extreme Graphics
min: 78589 avg: 119169 median: 119168 (15%) max: 159748 Points
3DMark - 3DMark Cloud Gate Score
min: 18794 avg: 30583 median: 31105 (33%) max: 37020 Points
3DMark - 3DMark Cloud Gate Graphics
min: 35698 avg: 43120 median: 43977.5 (12%) max: 51286 Points
3DMark - 3DMark Fire Strike Standard Score
min: 5203 avg: 7632 median: 7919 (14%) max: 9084 Points
22516 Points (40%)
GPU TDP ? TDP 105 W 34% 100%
3DMark - 3DMark Fire Strike Standard Graphics
min: 5568 avg: 8330 median: 8561 (10%) max: 9692 Points
25739 Points (29%)
GPU TDP ? TDP 105 W 32% 100%
3DMark - 3DMark Ice Storm Graphics
min: 88046 avg: 166280 median: 166923 (20%) max: 215292 Points
3DMark - 3DMark Wild Life Extreme Unlimited
min: 4294 avg: 5985 median: 6116 (7%) max: 6686 Points
3DMark - 3DMark Night Raid
min: 13461 avg: 24491 median: 26194 (25%) max: 28337 Points
3DMark - 3DMark Night Raid Graphics Score
min: 25821 avg: 31603 median: 32382.5 (12%) max: 35338 Points
3DMark 11 - 3DM11 Performance Score
min: 7756 avg: 11980 median: 12326 (17%) max: 13943 Points
26153 Points (36%)
GPU TDP ? TDP 105 W 46% 100%
3DMark 11 - 3DM11 Performance GPU
min: 8064 avg: 12012 median: 12275.5 (11%) max: 13716 Points
32846 Points (28%)
GPU TDP ? TDP 105 W 37% 100%
3DMark Vantage + Intel Arc 8-Core iGPU 3DMark Vantage - 3DM Vant. Perf. total
min: 38739 avg: 40267 median: 38877 (11%) max: 43185 Points
3DM Vant. Perf. GPU no PhysX + Intel Arc 8-Core iGPU 3DMark Vantage - 3DM Vant. Perf. GPU no PhysX
min: 33028 avg: 35245 median: 33524 (19%) max: 39184 Points
3DMark 05 - 3DMark 05 - Standard
min: 42967 avg: 44045 median: 44044.5 (48%) max: 45122 Points
3DMark 06 3DMark 06 - Standard 1280x1024 + Intel Arc 8-Core iGPU
min: 36831 avg: 37523 median: 37522.5 (49%) max: 38214 Points
Unigine Valley 1.0 - Unigine Valley 1.0 DX
min: 17.1 avg: 17.8 median: 17.8 (6%) max: 18.5 fps
SPECviewperf 12 + Intel Arc 8-Core iGPU SPECviewperf 12 - specvp12 sw-03
min: 42.7 avg: 42.9 median: 42.9 (11%) max: 43 fps
specvp12 snx-02 + Intel Arc 8-Core iGPU SPECviewperf 12 - specvp12 snx-02
min: 3.29 avg: 3.4 median: 3.4 (1%) max: 3.56 fps
specvp12 showcase-01 + Intel Arc 8-Core iGPU SPECviewperf 12 - specvp12 showcase-01
min: 18.2 avg: 19.1 median: 19.1 (4%) max: 19.9 fps
specvp12 mediacal-01 + Intel Arc 8-Core iGPU SPECviewperf 12 - specvp12 mediacal-01
min: 15.9 avg: 16.4 median: 16.4 (4%) max: 16.9 fps
specvp12 maya-04 + Intel Arc 8-Core iGPU SPECviewperf 12 - specvp12 maya-04
min: 54.9 avg: 56.5 median: 56.5 (15%) max: 58 fps
specvp12 energy-01 + Intel Arc 8-Core iGPU SPECviewperf 12 - specvp12 energy-01
min: 0.67 avg: 0.8 median: 0.8 (1%) max: 0.91 fps
specvp12 creo-01 + Intel Arc 8-Core iGPU SPECviewperf 12 - specvp12 creo-01
min: 22.7 avg: 22.9 median: 22.9 (9%) max: 23.1 fps
specvp12 catia-04 + Intel Arc 8-Core iGPU SPECviewperf 12 - specvp12 catia-04
min: 48.2 avg: 49.8 median: 49.8 (8%) max: 51.3 fps
specvp12 3dsmax-05 + Intel Arc 8-Core iGPU SPECviewperf 12 - specvp12 3dsmax-05
min: 49.7 avg: 49.8 median: 49.8 (9%) max: 49.8 fps
SPECviewperf 13 specvp13 sw-04 + Intel Arc 8-Core iGPU SPECviewperf 13 - specvp13 sw-04
min: 44.8 avg: 45.2 median: 45.2 (12%) max: 45.6 fps
specvp13 snx-03 + Intel Arc 8-Core iGPU SPECviewperf 13 - specvp13 snx-03
min: 5.9 avg: 6.2 median: 6.2 (1%) max: 6.43 fps
specvp13 showcase-02 + Intel Arc 8-Core iGPU SPECviewperf 13 - specvp13 showcase-02
min: 18.2 avg: 19.1 median: 19.1 (4%) max: 19.9 fps
specvp13 medical-02 + Intel Arc 8-Core iGPU SPECviewperf 13 - specvp13 medical-02
min: 25 avg: 27.4 median: 27.4 (6%) max: 29.7 fps
specvp13 maya-05 + Intel Arc 8-Core iGPU SPECviewperf 13 - specvp13 maya-05
min: 59.5 avg: 61 median: 61 (7%) max: 62.5 fps
specvp13 energy-02 + Intel Arc 8-Core iGPU SPECviewperf 13 - specvp13 energy-02
min: 5.27 avg: 5.5 median: 5.5 (2%) max: 5.69 fps
specvp13 creo-02 + Intel Arc 8-Core iGPU SPECviewperf 13 - specvp13 creo-02
min: 29.3 avg: 29.5 median: 29.5 (4%) max: 29.6 fps
specvp13 catia-05 + Intel Arc 8-Core iGPU SPECviewperf 13 - specvp13 catia-05
min: 71.6 avg: 74.2 median: 74.2 (8%) max: 76.8 fps
specvp13 3dsmax-06 + Intel Arc 8-Core iGPU SPECviewperf 13 - specvp13 3dsmax-06
min: 46.4 avg: 47.5 median: 47.5 (8%) max: 48.5 fps
SPECviewperf 2020 specvp2020 solidworks-05 4k + Intel Arc 8-Core iGPU SPECviewperf 2020 - specvp2020 solidworks-05 4k
min: 11 avg: 11.6 median: 11.6 (3%) max: 12.1 fps
specvp2020 snx-04 4k + Intel Arc 8-Core iGPU SPECviewperf 2020 - specvp2020 snx-04 4k
min: 5.7 avg: 6 median: 6 (1%) max: 6.24 fps
specvp2020 medical-03 4k + Intel Arc 8-Core iGPU SPECviewperf 2020 - specvp2020 medical-03 4k
min: 4.23 avg: 4.6 median: 4.6 (4%) max: 5.05 fps
specvp2020 maya-06 4k + Intel Arc 8-Core iGPU SPECviewperf 2020 - specvp2020 maya-06 4k
min: 35.4 avg: 36.6 median: 36.6 (6%) max: 37.7 fps
specvp2020 energy-03 4k + Intel Arc 8-Core iGPU SPECviewperf 2020 - specvp2020 energy-03 4k
min: 4.61 avg: 5.3 median: 5.3 (1%) max: 6.03 fps
specvp2020 creo-03 4k + Intel Arc 8-Core iGPU SPECviewperf 2020 - specvp2020 creo-03 4k
min: 17.9 avg: 18.2 median: 18.2 (9%) max: 18.5 fps
specvp2020 catia-06 4k + Intel Arc 8-Core iGPU SPECviewperf 2020 - specvp2020 catia-06 4k
min: 10 avg: 10.6 median: 10.6 (7%) max: 11.1 fps
specvp2020 3dsmax-07 4k + Intel Arc 8-Core iGPU SPECviewperf 2020 - specvp2020 3dsmax-07 4k
min: 12.9 avg: 13.9 median: 13.9 (6%) max: 14.9 fps
Cinebench R10 Cinebench R10 Shading (32bit) + Intel Arc 8-Core iGPU Cinebench R10 - Cinebench R10 Shading (32bit)
min: 17440 avg: 18121 median: 18429 (13%) max: 18495 Points
Cinebench R11.5 Cinebench R11.5 OpenGL 64 Bit + Intel Arc 8-Core iGPU Cinebench R11.5 - Cinebench R11.5 OpenGL 64 Bit
min: 101.92 avg: 106 median: 107.1 (37%) max: 108.87 fps
Cinebench R15 + Intel Arc 8-Core iGPU Cinebench R15 - Cinebench R15 OpenGL 64 Bit
min: 135.3 avg: 152.6 median: 152.9 (9%) max: 176.3 fps
Cinebench R15 OpenGL 64 Bit + AMD Radeon RX 6650M
175.8 fps (10%)
GPU TDP ? TDP 105 W 87% 100%
Cinebench R15 OpenGL Ref. Match 64 Bit + Intel Arc 8-Core iGPU Cinebench R15 - Cinebench R15 OpenGL Ref. Match 64 Bit
97.8 % (98%)
Cinebench R15 OpenGL Ref. Match 64 Bit + AMD Radeon RX 6650M
98 % (98%)
GPU TDP ? TDP 105 W 100% 100%
GFXBench - GFXBench 5.0 4K Aztec Ruins High Tier Offscreen
min: 36.6 avg: 39.6 median: 40.5 (16%) max: 41.6 fps
GFXBench - GFXBench 5.0 Aztec Ruins High Tier Offscreen
min: 83.4 avg: 87.5 median: 87.5 (16%) max: 91.5 fps
GFXBench - GFXBench 5.0 Aztec Ruins Normal Tier Offscreen
min: 206.4 avg: 216.5 median: 210 (16%) max: 233.2 fps
GFXBench - GFXBench Car Chase Offscreen
167.1 fps (19%)
GFXBench (DX / GLBenchmark) 2.7 + Intel Arc 8-Core iGPU GFXBench (DX / GLBenchmark) 2.7 - GFXBench T-Rex HD Offscreen C24Z16
817 fps (7%)
Basemark GPU 1.2 - Basemark GPU 1.2 Vulkan Official Medium Offscreen 1080
min: 104.6 avg: 231 median: 289 (2%) max: 345 fps
Basemark GPU 1.2 - Basemark GPU 1.2 Vulkan Official High Offscreen 2160
3.6 fps (1%)
Geekbench 6.2 - Geekbench 6.2 GPU OpenCL
min: 17911 avg: 32012 median: 34669 (10%) max: 36741 Points
Geekbench 6.2 - Geekbench 6.2 GPU Vulkan
min: 16515 avg: 30887 median: 33079 (11%) max: 35076 Points
LuxMark v2.0 64Bit - LuxMark v2.0 Room GPU
min: 549 avg: 634 median: 640 (3%) max: 714 Samples/s
LuxMark v2.0 64Bit - LuxMark v2.0 Sala GPU
min: 2319 avg: 2554 median: 2611 (5%) max: 2732 Samples/s
ComputeMark v2.1 - ComputeMark v2.1 Result
min: 6270 avg: 7126 median: 7480 (8%) max: 7627 Points
Power Consumption - Furmark Stress Test Power Consumption - external Monitor *
min: 35 avg: 49.3 median: 49.7 (7%) max: 66.8 Watt
199.8 Watt (28%)
GPU TDP ? TDP 105 W 130% 100%
Power Consumption - The Witcher 3 Power Consumption - external Monitor *
min: 27 avg: 43.5 median: 44 (6%) max: 61 Watt
205 Watt (29%)
GPU TDP ? TDP 105 W 132% 100%
Power Consumption - Witcher 3 Power Consumption *
min: 29.7 avg: 47.7 median: 46.7 (10%) max: 64.6 Watt
206 Watt (45%)
GPU TDP ? TDP 105 W 164% 100%
Power Consumption - Witcher 3 ultra Power Efficiency
min: 0.3826 avg: 0.5 median: 0.5 (45%) max: 1.108 fps per Watt
Power Consumption - Witcher 3 ultra Power Efficiency - external Monitor
min: 0.4246 avg: 0.6 median: 0.5 (44%) max: 1.207 fps per Watt
Power Consumption - Cyberpunk 2077 Power Consumption 150cd *
min: 53.2 avg: 59.7 median: 54.4 (24%) max: 71.5 Watt
Power Consumption - Cyberpunk 2077 Power Consumption - external Monitor *
min: 49.2 avg: 60.6 median: 60.6 (8%) max: 71.9 Watt
Emissions Witcher 3 Fan Noise + Intel Arc 8-Core iGPU Emissions - Witcher 3 Fan Noise
min: 27 avg: 38.1 median: 38 (61%) max: 46.3 dB(A)
Witcher 3 Fan Noise + AMD Radeon RX 6650M
54.1 dB(A) (87%)
GPU TDP ? TDP 105 W 70% 100%
Average Benchmarks Intel Arc 8-Core iGPU → 100% n=8 Average Benchmarks AMD Radeon RX 6650M → 225% n=8
- Range of benchmark values for this graphics card
- Average benchmark values for this graphics card
* Smaller numbers mean a higher performance
1 This benchmark is not used for the average calculation
Game Benchmarks The following benchmarks stem from our benchmarks of review laptops. The performance depends on the used graphics memory, clock rate, processor, system settings, drivers, and operating systems. So the results don't have to be representative for all laptops with this GPU. For detailed information on the benchmark results, click on the fps number.
100%
Arc 8-Core:
82 [X] Lenovo Yoga Pro 7 14 Intel Core Ultra 7 155H 3.8GHz
Arc 8-Core
min:
68 fps
fps
100%
Arc 8-Core:
74 [X] Lenovo Yoga Pro 7 14 Intel Core Ultra 7 155H 3.8GHz
Arc 8-Core
min:
62 fps
fps
100%
Arc 8-Core:
53 [X] Lenovo Yoga Pro 7 14 Intel Core Ultra 7 155H 3.8GHz
Arc 8-Core
min:
43 fps
fps
100%
Arc 8-Core:
14 [X] Lenovo Yoga Pro 7 14 Intel Core Ultra 7 155H 3.8GHz
Arc 8-Core
min:
10 fps
fps
100%
Arc 8-Core:
17.8 [X] Lenovo Yoga Pro 7 14 Intel Core Ultra 7 155H 3.8GHz
Arc 8-Core
min:
14.3 fps, P0.1:
14.4 fps, P1:
15.5 fps, max:
24.4 fps
fps
100%
Arc 8-Core:
14.9 [X] Lenovo Yoga Pro 7 14 Intel Core Ultra 7 155H 3.8GHz
Arc 8-Core
min:
11.5 fps, P0.1:
11.8 fps, P1:
13.1 fps, max:
20.8 fps
fps
100%
Arc 8-Core:
12.1 [X] Lenovo Yoga Pro 7 14 Intel Core Ultra 7 155H 3.8GHz
Arc 8-Core
min:
9.82 fps, P0.1:
9.88 fps, P1:
10.6 fps, max:
15.4 fps
fps
100%
Arc 8-Core:
33.6 [X] Lenovo Yoga Pro 7 14 Intel Core Ultra 7 155H 3.8GHz
Arc 8-Core
min:
26.7 fps, P0.1:
26.8 fps, P1:
28.7 fps, max:
43.8 fps
fps
100%
Arc 8-Core:
28 [X] Lenovo Yoga Pro 7 14 Intel Core Ultra 7 155H 3.8GHz
Arc 8-Core
min:
22.5 fps, P0.1:
23.3 fps, P1:
24.1 fps, max:
35.6 fps
fps
100%
Arc 8-Core:
25.2 [X] Lenovo Yoga Pro 7 14 Intel Core Ultra 7 155H 3.8GHz
Arc 8-Core
min:
20.9 fps, P0.1:
20.9 fps, P1:
21.9 fps, max:
31 fps
fps
100%
Arc 8-Core:
19 [X] Lenovo Yoga Pro 7 14 Intel Core Ultra 7 155H 3.8GHz
Arc 8-Core
min:
16.4 fps, P0.1:
16.5 fps, P1:
16.9 fps, max:
22.5 fps
fps
100%
Arc 8-Core:
18 [X] Lenovo Yoga Pro 7 14 Intel Core Ultra 7 155H 3.8GHz
Arc 8-Core
min:
13.1 fps, P0.1:
13.6 fps, P1:
14.8 fps, max:
22.7 fps
fps
100%
Arc 8-Core:
14.5 [X] Lenovo Yoga Pro 7 14 Intel Core Ultra 7 155H 3.8GHz
Arc 8-Core
min:
2.52 fps, P0.1:
2.78 fps, P1:
10.3 fps, max:
18.6 fps
fps
100%
Arc 8-Core:
0 (!) 30.6 [X] Lenovo Yoga Pro 7 14 Intel Core Ultra 7 155H 3.8GHz
Arc 8-Core
min:
24 fps, P0.1:
24 fps, P1:
24.5 fps, max:
44.3 fps
52 ~ 28 fps
100%
Arc 8-Core:
27.1 [X] Lenovo Yoga Pro 7 14 Intel Core Ultra 7 155H 3.8GHz
Arc 8-Core
min:
20.1 fps, P0.1:
20.3 fps, P1:
21.6 fps, max:
41.7 fps
34 ~ 31 fps
100%
Arc 8-Core:
18.5 [X] Lenovo Yoga Pro 7 14 Intel Core Ultra 7 155H 3.8GHz
Arc 8-Core
min:
13.2 fps, P0.1:
13.4 fps, P1:
14.9 fps, max:
23.3 fps
29 ~ 24 fps
100%
Arc 8-Core:
16.2 [X] Lenovo Yoga Pro 7 14 Intel Core Ultra 7 155H 3.8GHz
Arc 8-Core
min:
12.3 fps, P0.1:
12.3 fps, P1:
13.5 fps, max:
21.9 fps
25 ~ 21 fps
100%
Arc 8-Core:
69 [X] Lenovo Yoga Pro 7 14 Intel Core Ultra 7 155H 3.8GHz
Arc 8-Core
min:
28 fps
fps
100%
Arc 8-Core:
56 [X] Lenovo Yoga Pro 7 14 Intel Core Ultra 7 155H 3.8GHz
Arc 8-Core
min:
20 fps
fps
100%
Arc 8-Core:
49 [X] Lenovo Yoga Pro 7 14 Intel Core Ultra 7 155H 3.8GHz
Arc 8-Core
min:
8 fps
fps
100%
Arc 8-Core:
29 [X] Lenovo Yoga Pro 7 14 Intel Core Ultra 7 155H 3.8GHz
Arc 8-Core
min:
7 fps
fps
100%
Arc 8-Core:
45.8 [X] Acemagic F2A Intel Core Ultra 7 155H 3.8GHz
Arc 8-Core
min:
14.5 fps, P0.1:
37.2 fps, P1:
38.5 fps, max:
92.5 fps
73.9 ~ 60 fps
100%
Arc 8-Core:
39.1 [X] Acemagic F2A Intel Core Ultra 7 155H 3.8GHz
Arc 8-Core
min:
13.6 fps, P0.1:
30.9 fps, P1:
33.7 fps, max:
100.7 fps
52.4 ~ 46 fps
100%
Arc 8-Core:
33.9 [X] Acemagic F2A Intel Core Ultra 7 155H 3.8GHz
Arc 8-Core
min:
10.5 fps, P0.1:
22.8 fps, P1:
29.4 fps, max:
108.3 fps
46.4 ~ 40 fps
100%
Arc 8-Core:
27.6 [X] Acemagic F2A Intel Core Ultra 7 155H 3.8GHz
Arc 8-Core
min:
13.3 fps, P0.1:
18.8 fps, P1:
24.3 fps, max:
102.3 fps
40.3 ~ 34 fps
100%
Arc 8-Core:
152.6 183.9 [X] Acemagic F2A Intel Core Ultra 7 155H 3.8GHz
Arc 8-Core
min:
19.6 fps, P0.1:
45.2 fps, P1:
128.5 fps, max:
834 fps
208 ~ 182 fps
100%
Arc 8-Core:
111.5 128.6 [X] Acemagic F2A Intel Core Ultra 7 155H 3.8GHz
Arc 8-Core
min:
17.2 fps, P0.1:
40.4 fps, P1:
90.9 fps, max:
415 fps
142.8 ~ 128 fps
100%
Arc 8-Core:
108.6 120.9 [X] Acemagic F2A Intel Core Ultra 7 155H 3.8GHz
Arc 8-Core
min:
18 fps, P0.1:
32.4 fps, P1:
93.7 fps, max:
461 fps
134.2 ~ 121 fps
100%
Arc 8-Core:
111.1 fps
100%
Arc 8-Core:
45.7 [X] Acemagic F2A Intel Core Ultra 7 155H 3.8GHz
Arc 8-Core
min:
11.6 fps, P0.1:
27.2 fps, P1:
39.8 fps, max:
116.8 fps
61 ~ 53 fps
100%
Arc 8-Core:
35.4 [X] Acemagic F2A Intel Core Ultra 7 155H 3.8GHz
Arc 8-Core
min:
17.3 fps, P0.1:
18.6 fps, P1:
30.4 fps, max:
93.9 fps
44.1 ~ 40 fps
100%
Arc 8-Core:
24.6 [X] Acemagic F2A Intel Core Ultra 7 155H 3.8GHz
Arc 8-Core
min:
5.68 fps, P0.1:
9.48 fps, P1:
20.2 fps, max:
90.6 fps
30.9 ~ 28 fps
100%
Arc 8-Core:
18.7 [X] Acemagic F2A Intel Core Ultra 7 155H 3.8GHz
Arc 8-Core
min:
7.17 fps, P0.1:
7.84 fps, P1:
16 fps, max:
58.8 fps
22.2 ~ 20 fps
297%
Radeon RX 6650M:
217 [X] HP Omen 16-n0033dx 928484
AMD Ryzen 7 6800H 3.2GHz
Radeon RX 6650M
min:
166 fps, P1:
135 fps, max:
250 fps
fps
326%
Radeon RX 6650M:
215 [X] HP Omen 16-n0033dx 928484
AMD Ryzen 7 6800H 3.2GHz
Radeon RX 6650M
min:
159 fps, P1:
131 fps, max:
243 fps
fps
356%
Radeon RX 6650M:
178.2 [X] HP Omen 16-n0033dx 928484
AMD Ryzen 7 6800H 3.2GHz
Radeon RX 6650M
min:
151 fps, P1:
121 fps, max:
205 fps
fps
312%
Radeon RX 6650M:
40.6 [X] HP Omen 16-n0033dx 928484
AMD Ryzen 7 6800H 3.2GHz
Radeon RX 6650M
min:
31 fps, P1:
31 fps, max:
49 fps
fps
Radeon RX 6650M:
126.8 fps
Radeon RX 6650M:
106.3 fps
100%
Arc 8-Core:
67.7 [X] Acemagic F2A 800660
Intel Core Ultra 7 155H 3.8GHz
Arc 8-Core
min:
33.1 fps, max:
113.8 fps
73 ~ 70 fps
100%
Arc 8-Core:
51.8 [X] Acemagic F2A 800660
Intel Core Ultra 7 155H 3.8GHz
Arc 8-Core
min:
31.2 fps, max:
99 fps
56.8 ~ 54 fps
100%
Arc 8-Core:
41.7 [X] Acemagic F2A 800660
Intel Core Ultra 7 155H 3.8GHz
Arc 8-Core
min:
24 fps, max:
88.6 fps
44.8 ~ 43 fps
100%
Arc 8-Core:
36.6 [X] Acemagic F2A 800660
Intel Core Ultra 7 155H 3.8GHz
Arc 8-Core
min:
19.9 fps, max:
58.1 fps
39.2 ~ 38 fps
100%
Arc 8-Core:
27 [X] Acemagic F2A Intel Core Ultra 7 155H 3.8GHz
Arc 8-Core
min:
22.1 fps, P0.1:
22.3 fps, P1:
23.6 fps, max:
36.5 fps
33.7 ~ 30 fps
231%
Radeon RX 6650M:
69.3 fps
100%
Arc 8-Core:
24 [X] Acemagic F2A Intel Core Ultra 7 155H 3.8GHz
Arc 8-Core
min:
20.6 fps, P0.1:
20.7 fps, P1:
21.5 fps, max:
27.6 fps
31.2 ~ 28 fps
244%
Radeon RX 6650M:
68.4 fps
100%
Arc 8-Core:
18.3 [X] Acemagic F2A Intel Core Ultra 7 155H 3.8GHz
Arc 8-Core
min:
10.5 fps, P0.1:
11 fps, P1:
15.2 fps, max:
28.6 fps
24 ~ 21 fps
306%
Radeon RX 6650M:
64.3 fps
100%
Arc 8-Core:
12.9 [X] Acemagic F2A Intel Core Ultra 7 155H 3.8GHz
Arc 8-Core
min:
9.37 fps, P0.1:
9.72 fps, P1:
11 fps, max:
17.4 fps
17.3 ~ 15 fps
343%
Radeon RX 6650M:
51.5 fps
100%
Arc 8-Core:
61.9 [X] Acemagic F2A Intel Core Ultra 7 155H 3.8GHz
Arc 8-Core
min:
52 fps, max:
68 fps
fps
179%
Radeon RX 6650M:
111 fps
100%
Arc 8-Core:
37.7 [X] Acemagic F2A Intel Core Ultra 7 155H 3.8GHz
Arc 8-Core
min:
35 fps, max:
41 fps
fps
279%
Radeon RX 6650M:
105 fps
100%
Arc 8-Core:
32.1 [X] Acemagic F2A Intel Core Ultra 7 155H 3.8GHz
Arc 8-Core
min:
29 fps, max:
34 fps
fps
299%
Radeon RX 6650M:
96 fps
100%
Arc 8-Core:
27.2 [X] Acemagic F2A Intel Core Ultra 7 155H 3.8GHz
Arc 8-Core
min:
21 fps, max:
30 fps
fps
324%
Radeon RX 6650M:
88 fps
227%
Radeon RX 6650M:
315 fps
334%
Radeon RX 6650M:
247 fps
372%
Radeon RX 6650M:
216 fps
370%
Radeon RX 6650M:
100 fps
Radeon RX 6650M:
224.8 fps
Radeon RX 6650M:
178.8 fps
Radeon RX 6650M:
165.5 fps
Radeon RX 6650M:
156.3 fps
Radeon RX 6650M:
236.6 fps
Radeon RX 6650M:
135.4 fps
Radeon RX 6650M:
109.1 fps
100%
Arc 8-Core:
0 (!) 58 [X] Acemagic F2A Intel Core Ultra 7 155H 3.8GHz
Arc 8-Core
min:
43 fps, max:
83 fps
~ 29 fps
100%
Arc 8-Core:
33 35 [X] Acemagic F2A Intel Core Ultra 7 155H 3.8GHz
Arc 8-Core
min:
25 fps, max:
47 fps
~ 34 fps
100%
Arc 8-Core:
28 (!) [X] Acer Swift Go 14 SFG14-72 Intel Core Ultra 7 155H 3.8GHz
Arc 8-Core
30 [X] Acemagic F2A Intel Core Ultra 7 155H 3.8GHz
Arc 8-Core
min:
5 fps, max:
44 fps
~ 29 fps
100%
Arc 8-Core:
26 27 [X] Acemagic F2A Intel Core Ultra 7 155H 3.8GHz
Arc 8-Core
min:
8 fps, max:
36 fps
~ 27 fps
100%
Arc 8-Core:
139.1 fps
Radeon RX 6650M:
162.8 fps
Radeon RX 6650M:
205.9 fps
Radeon RX 6650M:
124.2 fps
Radeon RX 6650M:
100.4 fps
100%
Arc 8-Core:
68.5 93 ~ 81 fps
136%
Radeon RX 6650M:
110.4 fps
240%
Radeon RX 6650M:
95.9 fps
304%
Radeon RX 6650M:
85.2 fps
306%
Radeon RX 6650M:
67.4 fps
100%
Arc 8-Core:
65 [X] Acemagic F2A Intel Core Ultra 7 155H 3.8GHz
Arc 8-Core
min:
11 fps, max:
82 fps
69 ~ 67 fps
100%
Arc 8-Core:
39 [X] Acemagic F2A Intel Core Ultra 7 155H 3.8GHz
Arc 8-Core
min:
26 fps, max:
47 fps
41 ~ 40 fps
100%
Arc 8-Core:
37 [X] Acemagic F2A Intel Core Ultra 7 155H 3.8GHz
Arc 8-Core
min:
25 fps, max:
44 fps
39 ~ 38 fps
100%
Arc 8-Core:
35 [X] Acemagic F2A Intel Core Ultra 7 155H 3.8GHz
Arc 8-Core
min:
28 fps, max:
42 fps
36 ~ 36 fps
100%
Arc 8-Core:
52.2 [X] Acemagic F2A Intel Core Ultra 7 155H 3.8GHz
Arc 8-Core
min:
27.79 fps, max:
85.54 fps
63.1 ~ 58 fps
239%
Radeon RX 6650M:
138.8 fps
100%
Arc 8-Core:
33.9 [X] Acemagic F2A Intel Core Ultra 7 155H 3.8GHz
Arc 8-Core
min:
19.97 fps, max:
51.8 fps
37.6 ~ 36 fps
310%
Radeon RX 6650M:
111.5 fps
100%
Arc 8-Core:
25 [X] Acemagic F2A Intel Core Ultra 7 155H 3.8GHz
Arc 8-Core
min:
14.2 fps, max:
40.08 fps
27.1 ~ 26 fps
312%
Radeon RX 6650M:
81 fps
100%
Arc 8-Core:
19.7 [X] Acemagic F2A Intel Core Ultra 7 155H 3.8GHz
Arc 8-Core
min:
11.97 fps, max:
28.47 fps
21.7 ~ 21 fps
313%
Radeon RX 6650M:
65.8 fps
204%
Radeon RX 6650M:
337 [X] HP Omen 16-n0033dx 1.47.22.14 D3D12
AMD Ryzen 7 6800H 3.2GHz
Radeon RX 6650M
min:
135.8 fps, P1:
247 fps, max:
622 fps
fps
313%
Radeon RX 6650M:
222 [X] HP Omen 16-n0033dx 1.47.22.14 D3D12
AMD Ryzen 7 6800H 3.2GHz
Radeon RX 6650M
min:
135.5 fps, P1:
160.6 fps, max:
325 fps
fps
328%
Radeon RX 6650M:
190 [X] HP Omen 16-n0033dx 1.47.22.14 D3D12
AMD Ryzen 7 6800H 3.2GHz
Radeon RX 6650M
min:
123.2 fps, P1:
140.4 fps, max:
291 fps
fps
372%
Radeon RX 6650M:
167.2 [X] HP Omen 16-n0033dx 1.47.22.14 D3D12
AMD Ryzen 7 6800H 3.2GHz
Radeon RX 6650M
min:
61.1 fps, P1:
120.8 fps, max:
239 fps
fps
100%
Arc 8-Core:
32 33 ~ 33 fps
123%
Radeon RX 6650M:
66.4 fps
125%
Radeon RX 6650M:
52.7 fps
133%
Radeon RX 6650M:
46.4 fps
266%
Radeon RX 6650M:
164.7 fps
315%
Radeon RX 6650M:
113.3 fps
347%
Radeon RX 6650M:
83.2 fps
Radeon RX 6650M:
507.9 fps
Radeon RX 6650M:
481.9 fps
Radeon RX 6650M:
350.9 fps
140%
Radeon RX 6650M:
141 fps
154%
Radeon RX 6650M:
130.7 fps
166%
Radeon RX 6650M:
118 fps
147%
Radeon RX 6650M:
100 fps
200%
Radeon RX 6650M:
276.5 fps
256%
Radeon RX 6650M:
217.4 fps
348%
Radeon RX 6650M:
167 fps
375%
Radeon RX 6650M:
90.1 fps
Average Gaming Intel Arc 8-Core iGPU → 100% Average Gaming 30-70 fps → 100%
Average Gaming AMD Radeon RX 6650M → 268% Average Gaming 30-70 fps → 244%
AMD Radeon RX 6650M low med. high ultra QHD 4K F1 22 217 215 178.2 40.6 Cyberpunk 2077 1.6 126.8 106.3 78.9 63.8 God of War 69.3 68.4 64.3 51.5 Guardians of the Galaxy 117 110 111 105 Far Cry 6 111 105 96 88 F1 2021 315 247 216 100 Hitman 3 224.8 178.8 165.5 156.3 Dirt 5 236.6 135.4 109.1 83.6 Watch Dogs Legion 109 104 94 62 Gears Tactics 162.8 205.9 124.2 100.4 Borderlands 3 110.4 95.9 85.2 67.4 Metro Exodus 138.8 111.5 81 65.8 Strange Brigade 337 222 190 167.2 X-Plane 11.11 66.4 52.7 46.4 Final Fantasy XV Benchmark 164.7 113.3 83.2 Fortnite 95.5 54.1 46 40.4 Overwatch 507.9 481.9 350.9 150 Dota 2 Reborn 141 130.7 118 100 The Witcher 3 276.5 217.4 167 90.1 < 30 fps < 60 fps < 120 fps ≥ 120 fps 7 12 2 8 9 2 10 7 3 11 3
For more games that might be playable and a list of all games and graphics cards visit our Gaming List
v1.28
log 04. 17:35:57
#0 checking url part for id 12086 +0s ... 0s
#1 checking url part for id 11134 +0s ... 0s
#2 redirected to Ajax server, took 1720107357 +0s ... 0s
#3 did not recreate cache, as it is less than 5 days old! Created at Thu, 04 Jul 2024 05:15:44 +0200 +0s ... 0s
#4 composed specs +0.051s ... 0.051s
#5 did output specs +0s ... 0.051s
#6 start showIntegratedCPUs +0s ... 0.051s
#7 getting avg benchmarks for device 12086 +0.021s ... 0.072s
#8 got single benchmarks 12086 +0.03s ... 0.102s
#9 getting avg benchmarks for device 11134 +0s ... 0.103s
#10 got single benchmarks 11134 +0.003s ... 0.106s
#11 got avg benchmarks for devices +0s ... 0.106s
#12 min, max, avg, median took s +0.042s ... 0.148s
#13 before gaming benchmark output +0s ... 0.148s
#14 Got 1295 rows for game benchmarks. +0.083s ... 0.231s
#15 composed SQL query for gamebenchmarks +0s ... 0.231s
#16 got data and put it in $dataArray +0.005s ... 0.236s
#17 benchmarks composed for output. +0.023s ... 0.259s
#18 calculated avg scores. +0s ... 0.259s
#19 return log +0.003s ... 0.261s
Please share our article, every link counts!
Redaktion, 2017-09- 8 (Update: 2023-07- 1)
 Deutsch
 English
 Español
 Français
 Italiano
 Nederlands
 Polski
 Português
 Русский
 Türkçe
 Svenska
 Chinese
 Magyar