Intel Arc 8-Core iGPU vs Intel Arc A350M
Intel Arc 8-Core iGPU ► remove from comparison
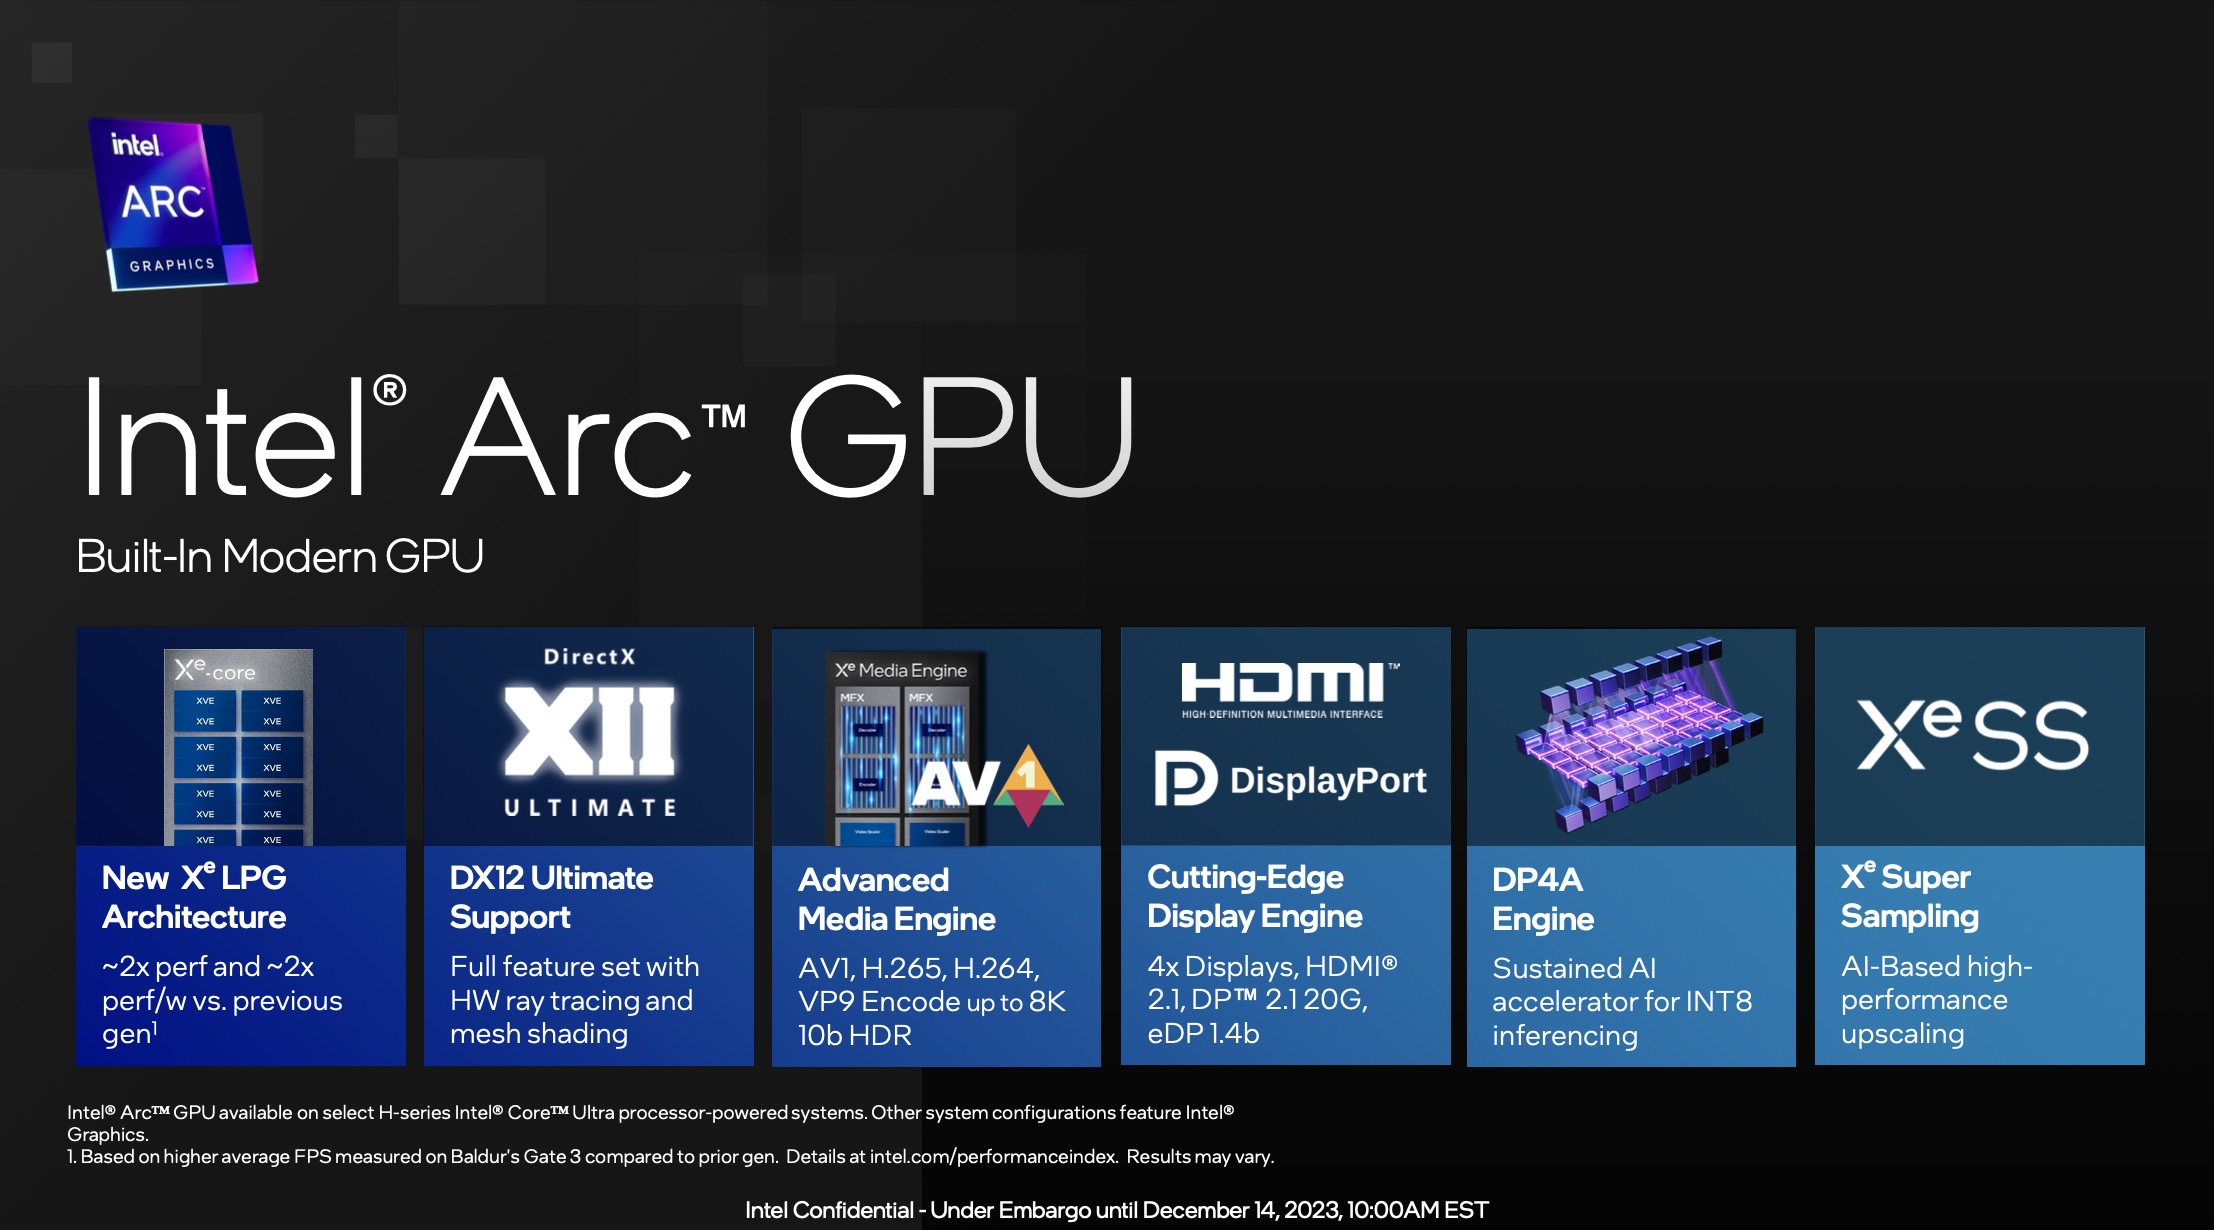
The Intel Arc iGPU with 8 cores (ID 7D55) is an integrated graphics adapter in Meteor Lake SoCs based on the Xe LPG architecture (similar to the dedicated Arc GPUs, but with a focus on efficiency). It offers all 8 Xe cores (128 Xe vector engines), 8 ray tracing units, 8 samplers and 4 pixel backends.
The Arc name may only be used if at least 16 GB RAM is used in dual channel mode. Otherwise, the only iGPU is called "Intel Graphics " and is also significantly slower.
According to Intel, performance has been doubled compared to the previous generation (probably still in Alder Lake).
The iGPU supports DirectX 12 Ultimate (probably DX 12_2 like the desktop Arc GPUs). The graphics unit also supports XeSS AI Super Sampling.
The media engine of Meteor Lake is in the SOC tile and supports up to 8k60 10-bit HDR encode and decode of MPEG2, AVC, VP9, HEVC and AV1. The display engine is also in the SoC tile and supports HDMI 2.1 and DisplayPort 2.1 20G with up to 8K60 HDR.
The GPU Tile of the Meteor Lake chip is manufactured at TSMC on 5nm (5N process).
Intel Arc A350M ► remove from comparison
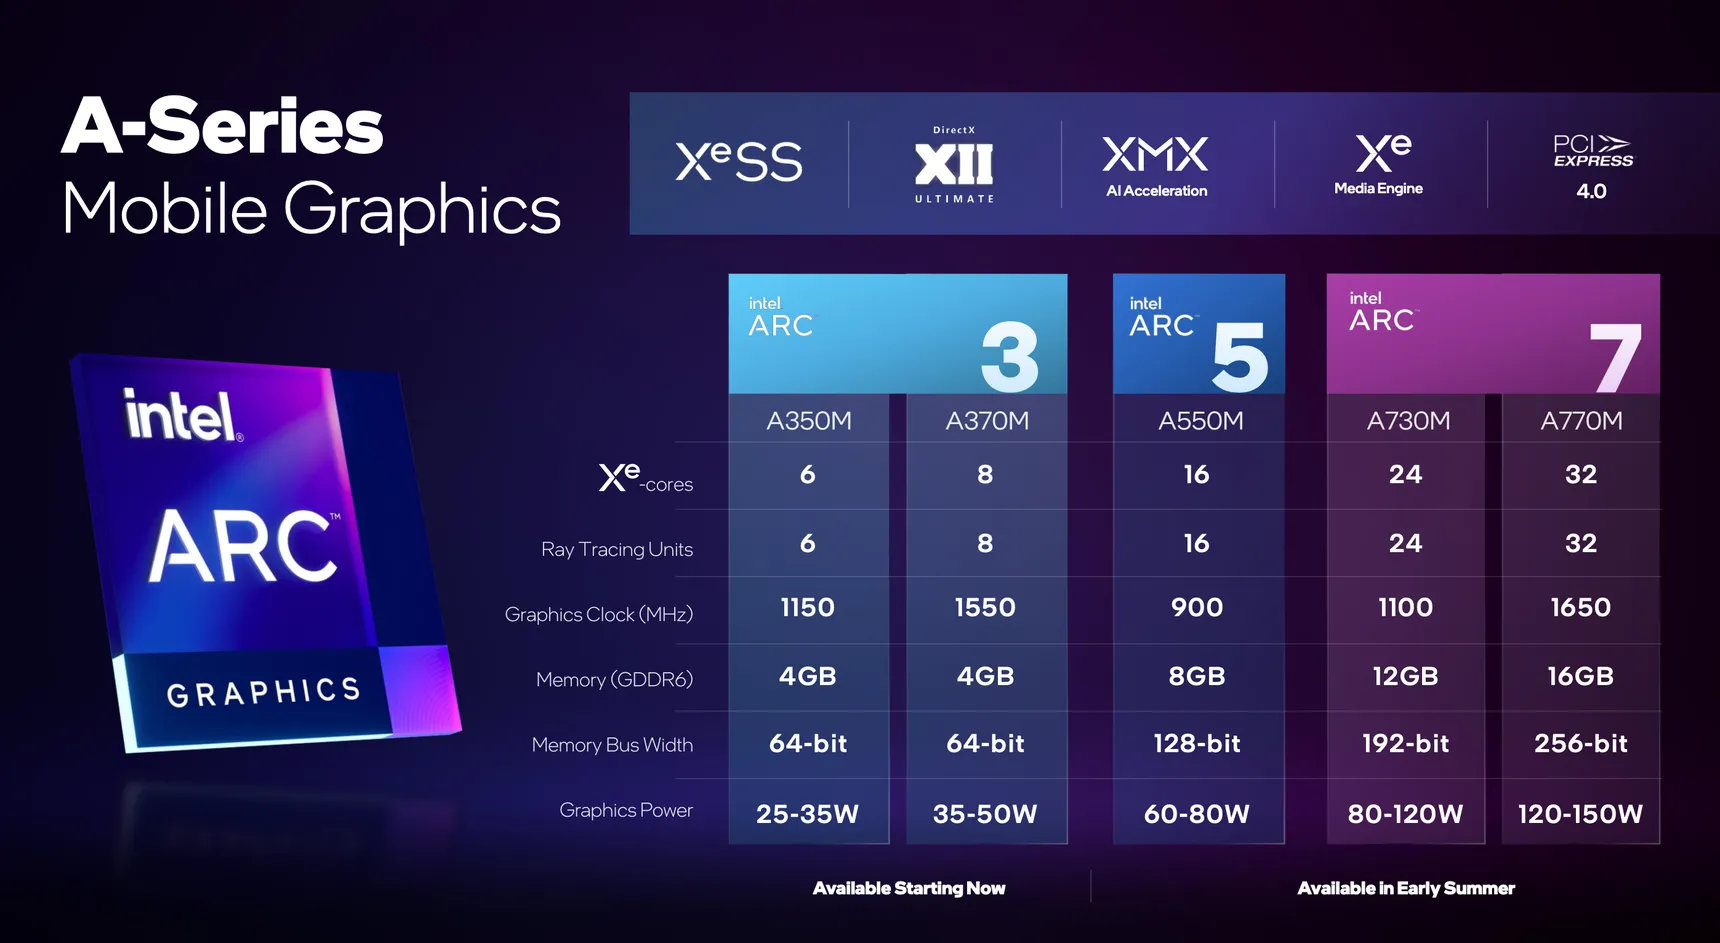
The Intel Arc A350M is a dedicated mobile entry level graphics card for laptops based on Xe HPG microarchitecture. It uses the ACM-G11 chip and offers 6 of the 8 Xe-cores (95 ALUs), 6 of the 8 ray tracing units and a 64-bit memory bus for 4 GB GDDR6 graphics memory. The chip integrates 7.2 billion transistors and the die measures 157 mm2.
The chip also integrates two media engines for VP9, AVC, HEVC, and AV1 8k en- and decoding. The 4 display pipes support up to 4x 4k120 HDR via DMI 2.0B or DisplayPort 2.0 10G.
The A350M is produced in 6nm at TSMC (N6 process) and supports dynamic power share (using Deep Link) with 12th gen Intel CPUs (Alder Lake).
Intel Arc 8-Core iGPU Intel Arc A350M Arc Series Arc A770 4096 @ 2.1 - 2.4 GHz 256 Bit @ 16000 MHz Arc A750 3584 @ 2.05 - 2.4 GHz 256 Bit @ 16000 MHz Arc A580 3072 @ 1.7 - 2 GHz 256 Bit @ 16000 MHz A770M 4096 @ 1.65 GHz 256 Bit @ 16000 MHz A730M 3072 @ 1.1 GHz 192 Bit @ 14000 MHz A570M 16 @ 0.9 - 1.3 GHz 128 Bit @ 14000 MHz A550M 16 @ 0.9 - 2.01 GHz 128 Bit @ 14000 MHz A530M 12 @ 0.9 - 1.3 GHz 128 Bit @ 14000 MHz A370M 8 @ 1.55 GHz 64 Bit @ 14000 MHz Arc A380 1024 @ 2 GHz 96 Bit @ 15500 MHz A310 6 @ 2 GHz 64 Bit @ 15500 MHz A350M 6 @ 1.15 GHz 64 Bit @ 14000 MHz
Codename Meteor Lake iGPU Alchemist Architecture Xe LPG Xe HPG Pipelines 8 - unified 6 - unified Raytracing Cores 8 6 Core Speed 2300 (Boost) MHz 1150 MHz Cache L1: 1.5 MB L1: 1.1 MB, L2: 4 MB Shared Memory yes no API DirectX 12_2, OpenGL 4.6, Vulkan 1.3 DirectX 12_2, OpenGL 4.6, Vulkan 1.3 technology 5 nm 6 nm Displays HDMI 2.1b, DisplayPort 2.0 20G 4 Displays (max.), HDMI 2.0b, DisplayPort 2.0 10G Ready Date of Announcement 14.12.2023 30.03.2022 Memory Speed 14000 MHz Memory Bus Width 64 Bit Memory Type GDDR6 Max. Amount of Memory 4 GB Memory Bandwidth 112 GB/s Power Consumption 35 Watt (25 - 35 Watt TGP) Transistors 7.2 Billion Die Size 157 mm² PCIe 4 8x Link to Manufacturer Page ark.intel.com
Benchmarks Performance Rating - 3DMark 11 + Fire Strike + Time Spy - Arc 8-Core
3.9 pt (12%)
...
...
max:
3DMark - 3DMark Time Spy Score
min: 2178 avg: 3496 median: 3569 (10%) max: 4176 Points
min: 2976 avg: 3289 median: 3397 (10%) max: 3494 Points
GPU TDP ? TDP 35 W 100% 85%
3DMark - 3DMark Time Spy Graphics
min: 2018 avg: 3190 median: 3206 (8%) max: 3770 Points
min: 2731 avg: 2993 median: 3050 (8%) max: 3197 Points
GPU TDP ? TDP 35 W 100% 86%
3DMark - 3DMark Ice Storm Unlimited Graphics
397122 Points (45%)
3DMark - 3DMark Ice Storm Extreme Graphics
min: 78589 avg: 119169 median: 119168 (15%) max: 159748 Points
3DMark - 3DMark Cloud Gate Score
min: 18794 avg: 30583 median: 31105 (33%) max: 37020 Points
min: 23965 avg: 25147 median: 25146.5 (27%) max: 26328 Points
GPU TDP ? TDP 35 W 100% 88%
3DMark - 3DMark Cloud Gate Graphics
min: 35698 avg: 43120 median: 43977.5 (12%) max: 51286 Points
min: 28623 avg: 36315 median: 36314.5 (10%) max: 44006 Points
GPU TDP ? TDP 35 W 95% 100%
3DMark - 3DMark Fire Strike Standard Score
min: 5203 avg: 7583 median: 7896.5 (14%) max: 9084 Points
min: 5961 avg: 6267 median: 6009 (11%) max: 6832 Points
GPU TDP ? TDP 35 W 100% 80%
3DMark - 3DMark Fire Strike Standard Graphics
min: 5568 avg: 8283 median: 8537 (10%) max: 9692 Points
min: 6800 avg: 7088 median: 7147 (8%) max: 7318 Points
GPU TDP ? TDP 35 W 100% 83%
3DMark - 3DMark Ice Storm Graphics
min: 88046 avg: 166280 median: 166923 (20%) max: 215292 Points
3DMark - 3DMark Wild Life Unlimited
19449 Points (10%)
3DMark - 3DMark Wild Life Extreme Unlimited
min: 4294 avg: 5985 median: 6116 (7%) max: 6686 Points
min: 5189 avg: 5300 median: 5299.5 (6%) max: 5410 Points
GPU TDP ? TDP 35 W 100% 87%
3DMark - 3DMark Night Raid
min: 13461 avg: 24491 median: 26194 (25%) max: 28337 Points
3DMark - 3DMark Night Raid Graphics Score
min: 25821 avg: 31603 median: 32382.5 (12%) max: 35338 Points
3DMark 11 - 3DM11 Performance Score
min: 7756 avg: 11904 median: 12271 (17%) max: 13943 Points
min: 10123 avg: 10766 median: 10766 (15%) max: 11409 Points
GPU TDP ? TDP 35 W 100% 85%
3DMark 11 - 3DM11 Performance GPU
min: 8064 avg: 11956 median: 12230 (11%) max: 13716 Points
min: 10687 avg: 10730 median: 10730 (9%) max: 10773 Points
GPU TDP ? TDP 35 W 100% 90%
3DMark Vantage + Intel Arc 8-Core iGPU 3DMark Vantage - 3DM Vant. Perf. total
min: 38739 avg: 40267 median: 38877 (11%) max: 43185 Points
3DM Vant. Perf. total + Intel Arc A350M
31023 Points (9%)
GPU TDP ? TDP 35 W 100% 77%
3DM Vant. Perf. GPU no PhysX + Intel Arc 8-Core iGPU 3DMark Vantage - 3DM Vant. Perf. GPU no PhysX
min: 33028 avg: 35245 median: 33524 (19%) max: 39184 Points
3DM Vant. Perf. GPU no PhysX + Intel Arc A350M
28186 Points (16%)
GPU TDP ? TDP 35 W 100% 80%
3DMark 05 - 3DMark 05 - Standard
min: 42967 avg: 44045 median: 44044.5 (48%) max: 45122 Points
3DMark 06 3DMark 06 - Standard 1280x1024 + Intel Arc 8-Core iGPU
min: 36831 avg: 37523 median: 37522.5 (49%) max: 38214 Points
3DMark 06 - Standard 1280x1024 + Intel Arc A350M
31625 Points (41%)
GPU TDP ? TDP 35 W 79% 100%
Unigine Valley 1.0 - Unigine Valley 1.0 DX
min: 17.1 avg: 17.8 median: 17.8 (6%) max: 18.5 fps
19.5 fps (6%)
GPU TDP ? TDP 35 W 91% 100%
SPECviewperf 12 + Intel Arc 8-Core iGPU SPECviewperf 12 - specvp12 sw-03
min: 42.7 avg: 42.9 median: 42.9 (11%) max: 43 fps
specvp12 snx-02 + Intel Arc 8-Core iGPU SPECviewperf 12 - specvp12 snx-02
min: 3.29 avg: 3.4 median: 3.4 (1%) max: 3.56 fps
specvp12 showcase-01 + Intel Arc 8-Core iGPU SPECviewperf 12 - specvp12 showcase-01
min: 18.2 avg: 19.1 median: 19.1 (4%) max: 19.9 fps
specvp12 mediacal-01 + Intel Arc 8-Core iGPU SPECviewperf 12 - specvp12 mediacal-01
min: 15.9 avg: 16.4 median: 16.4 (4%) max: 16.9 fps
specvp12 maya-04 + Intel Arc 8-Core iGPU SPECviewperf 12 - specvp12 maya-04
min: 54.9 avg: 56.5 median: 56.5 (15%) max: 58 fps
specvp12 energy-01 + Intel Arc 8-Core iGPU SPECviewperf 12 - specvp12 energy-01
min: 0.67 avg: 0.8 median: 0.8 (1%) max: 0.91 fps
specvp12 creo-01 + Intel Arc 8-Core iGPU SPECviewperf 12 - specvp12 creo-01
min: 22.7 avg: 22.9 median: 22.9 (9%) max: 23.1 fps
specvp12 catia-04 + Intel Arc 8-Core iGPU SPECviewperf 12 - specvp12 catia-04
min: 48.2 avg: 49.8 median: 49.8 (8%) max: 51.3 fps
specvp12 3dsmax-05 + Intel Arc 8-Core iGPU SPECviewperf 12 - specvp12 3dsmax-05
min: 49.7 avg: 49.8 median: 49.8 (9%) max: 49.8 fps
SPECviewperf 13 specvp13 sw-04 + Intel Arc 8-Core iGPU SPECviewperf 13 - specvp13 sw-04
min: 44.8 avg: 45.2 median: 45.2 (12%) max: 45.6 fps
specvp13 sw-04 + Intel Arc A350M
57.6 fps (15%)
GPU TDP ? TDP 35 W 79% 100%
specvp13 snx-03 + Intel Arc 8-Core iGPU SPECviewperf 13 - specvp13 snx-03
min: 5.9 avg: 6.2 median: 6.2 (1%) max: 6.43 fps
specvp13 snx-03 + Intel Arc A350M 3.2 fps (0%)
GPU TDP ? TDP 35 W 100% 52%
specvp13 showcase-02 + Intel Arc 8-Core iGPU SPECviewperf 13 - specvp13 showcase-02
min: 18.2 avg: 19.1 median: 19.1 (4%) max: 19.9 fps
specvp13 showcase-02 + Intel Arc A350M
27.7 fps (6%)
GPU TDP ? TDP 35 W 69% 100%
specvp13 medical-02 + Intel Arc 8-Core iGPU SPECviewperf 13 - specvp13 medical-02
min: 25 avg: 27.4 median: 27.4 (6%) max: 29.7 fps
specvp13 medical-02 + Intel Arc A350M
19.9 fps (4%)
GPU TDP ? TDP 35 W 100% 73%
specvp13 maya-05 + Intel Arc 8-Core iGPU SPECviewperf 13 - specvp13 maya-05
min: 59.5 avg: 61 median: 61 (7%) max: 62.5 fps
specvp13 maya-05 + Intel Arc A350M
63.6 fps (7%)
GPU TDP ? TDP 35 W 96% 100%
specvp13 energy-02 + Intel Arc 8-Core iGPU SPECviewperf 13 - specvp13 energy-02
min: 5.27 avg: 5.5 median: 5.5 (2%) max: 5.69 fps
specvp13 energy-02 + Intel Arc A350M
11.8 fps (4%)
GPU TDP ? TDP 35 W 46% 100%
specvp13 creo-02 + Intel Arc 8-Core iGPU SPECviewperf 13 - specvp13 creo-02
min: 29.3 avg: 29.5 median: 29.5 (4%) max: 29.6 fps
specvp13 creo-02 + Intel Arc A350M
49.1 fps (7%)
GPU TDP ? TDP 35 W 60% 100%
specvp13 catia-05 + Intel Arc 8-Core iGPU SPECviewperf 13 - specvp13 catia-05
min: 71.6 avg: 74.2 median: 74.2 (8%) max: 76.8 fps
specvp13 catia-05 + Intel Arc A350M
77 fps (9%)
GPU TDP ? TDP 35 W 96% 100%
specvp13 3dsmax-06 + Intel Arc 8-Core iGPU SPECviewperf 13 - specvp13 3dsmax-06
min: 46.4 avg: 47.5 median: 47.5 (8%) max: 48.5 fps
specvp13 3dsmax-06 + Intel Arc A350M
55.7 fps (10%)
GPU TDP ? TDP 35 W 85% 100%
SPECviewperf 2020 specvp2020 solidworks-05 4k + Intel Arc 8-Core iGPU SPECviewperf 2020 - specvp2020 solidworks-05 4k
min: 11 avg: 11.6 median: 11.6 (3%) max: 12.1 fps
specvp2020 snx-04 4k + Intel Arc 8-Core iGPU SPECviewperf 2020 - specvp2020 snx-04 4k
min: 5.7 avg: 6 median: 6 (1%) max: 6.24 fps
specvp2020 medical-03 4k + Intel Arc 8-Core iGPU SPECviewperf 2020 - specvp2020 medical-03 4k
min: 4.23 avg: 4.6 median: 4.6 (4%) max: 5.05 fps
specvp2020 maya-06 4k + Intel Arc 8-Core iGPU SPECviewperf 2020 - specvp2020 maya-06 4k
min: 35.4 avg: 36.6 median: 36.6 (6%) max: 37.7 fps
specvp2020 energy-03 4k + Intel Arc 8-Core iGPU SPECviewperf 2020 - specvp2020 energy-03 4k
min: 4.61 avg: 5.3 median: 5.3 (1%) max: 6.03 fps
specvp2020 creo-03 4k + Intel Arc 8-Core iGPU SPECviewperf 2020 - specvp2020 creo-03 4k
min: 17.9 avg: 18.2 median: 18.2 (9%) max: 18.5 fps
specvp2020 catia-06 4k + Intel Arc 8-Core iGPU SPECviewperf 2020 - specvp2020 catia-06 4k
min: 10 avg: 10.6 median: 10.6 (7%) max: 11.1 fps
specvp2020 3dsmax-07 4k + Intel Arc 8-Core iGPU SPECviewperf 2020 - specvp2020 3dsmax-07 4k
min: 12.9 avg: 13.9 median: 13.9 (6%) max: 14.9 fps
specvp2020 solidworks-05 1080p + Intel Arc A350M SPECviewperf 2020 - specvp2020 solidworks-05 1080p
17.2 fps (3%)
specvp2020 snx-04 1080p + Intel Arc A350M SPECviewperf 2020 - specvp2020 snx-04 1080p
3.2 fps (1%)
specvp2020 medical-03 1080p + Intel Arc A350M SPECviewperf 2020 - specvp2020 medical-03 1080p
9.1 fps (6%)
specvp2020 maya-06 1080p + Intel Arc A350M SPECviewperf 2020 - specvp2020 maya-06 1080p
72 fps (10%)
specvp2020 energy-03 1080p + Intel Arc A350M SPECviewperf 2020 - specvp2020 energy-03 1080p
12 fps (10%)
specvp2020 creo-03 1080p + Intel Arc A350M SPECviewperf 2020 - specvp2020 creo-03 1080p
30.8 fps (15%)
specvp2020 catia-06 1080p + Intel Arc A350M SPECviewperf 2020 - specvp2020 catia-06 1080p
17.4 fps (11%)
specvp2020 3dsmax-07 1080p + Intel Arc A350M SPECviewperf 2020 - specvp2020 3dsmax-07 1080p
20.9 fps (9%)
Cinebench R10 Cinebench R10 Shading (32bit) + Intel Arc 8-Core iGPU Cinebench R10 - Cinebench R10 Shading (32bit)
min: 17440 avg: 18121 median: 18429 (13%) max: 18495 Points
Cinebench R11.5 Cinebench R11.5 OpenGL 64 Bit + Intel Arc 8-Core iGPU Cinebench R11.5 - Cinebench R11.5 OpenGL 64 Bit
min: 101.92 avg: 106 median: 107.1 (37%) max: 108.87 fps
Cinebench R15 + Intel Arc 8-Core iGPU Cinebench R15 - Cinebench R15 OpenGL 64 Bit
min: 135.3 avg: 152.6 median: 152.5 (9%) max: 176.3 fps
Cinebench R15 OpenGL 64 Bit + Intel Arc A350M
min: 138.13 avg: 149.3 median: 149.3 (9%) max: 160.4 fps
GPU TDP ? TDP 35 W 95% 100%
Cinebench R15 OpenGL Ref. Match 64 Bit + Intel Arc 8-Core iGPU Cinebench R15 - Cinebench R15 OpenGL Ref. Match 64 Bit
97.8 % (98%)
Cinebench R15 OpenGL Ref. Match 64 Bit + Intel Arc A350M
97.8 % (98%)
GPU TDP ? TDP 35 W 100% 100%
GFXBench - GFXBench 5.0 4K Aztec Ruins High Tier Offscreen
min: 36.6 avg: 39.6 median: 40.5 (16%) max: 41.6 fps
29.6 fps (12%)
GPU TDP ? TDP 35 W 100% 75%
GFXBench - GFXBench 5.0 Aztec Ruins High Tier Offscreen
min: 83.4 avg: 87.5 median: 87.5 (16%) max: 91.5 fps
62.8 fps (11%)
GPU TDP ? TDP 35 W 100% 72%
GFXBench - GFXBench 5.0 Aztec Ruins Normal Tier Offscreen
min: 206.4 avg: 216.5 median: 210 (16%) max: 233.2 fps
160 fps (12%)
GPU TDP ? TDP 35 W 100% 74%
GFXBench - GFXBench Car Chase Offscreen
167.1 fps (19%)
125 fps (14%)
GPU TDP ? TDP 35 W 100% 75%
GFXBench 3.1 - GFXBench Manhattan ES 3.1 Offscreen
194 fps (4%)
GFXBench 3.0 - GFXBench 3.0 Manhattan Offscreen
309 fps (18%)
GFXBench (DX / GLBenchmark) 2.7 + Intel Arc 8-Core iGPU GFXBench (DX / GLBenchmark) 2.7 - GFXBench T-Rex HD Offscreen C24Z16
817 fps (7%)
GFXBench T-Rex HD Offscreen C24Z16 + Intel Arc A350M
640 fps (5%)
GPU TDP ? TDP 35 W 100% 78%
Basemark GPU 1.2 - Basemark GPU 1.2 Vulkan Official Medium Offscreen 1080
min: 104.6 avg: 226.7 median: 279 (2%) max: 345 fps
Basemark GPU 1.2 - Basemark GPU 1.2 Vulkan Official High Offscreen 2160
3.6 fps (1%)
Geekbench 6.2 - Geekbench 6.2 GPU OpenCL
min: 17911 avg: 32012 median: 34669 (10%) max: 36741 Points
Geekbench 6.2 - Geekbench 6.2 GPU Vulkan
min: 16515 avg: 30887 median: 33079 (11%) max: 35076 Points
LuxMark v2.0 64Bit - LuxMark v2.0 Room GPU
min: 549 avg: 634 median: 640 (3%) max: 714 Samples/s
1062 Samples/s (5%)
GPU TDP ? TDP 35 W 60% 100%
LuxMark v2.0 64Bit - LuxMark v2.0 Sala GPU
min: 2319 avg: 2554 median: 2611 (5%) max: 2732 Samples/s
2796 Samples/s (5%)
GPU TDP ? TDP 35 W 91% 100%
ComputeMark v2.1 - ComputeMark v2.1 Result
min: 6270 avg: 7126 median: 7480 (8%) max: 7627 Points
4447 Points (5%)
GPU TDP ? TDP 35 W 100% 62%
Power Consumption - Furmark Stress Test Power Consumption - external Monitor *
min: 35 avg: 48.9 median: 49.7 (7%) max: 66.8 Watt
min: 60.5 avg: 69.4 median: 69.4 (10%) max: 78.3 Watt
GPU TDP ? TDP 35 W 102% 100%
Power Consumption - The Witcher 3 Power Consumption - external Monitor *
min: 27 avg: 43.5 median: 44 (6%) max: 61 Watt
min: 53.2 avg: 65.1 median: 65.1 (9%) max: 77 Watt
GPU TDP ? TDP 35 W 101% 100%
Power Consumption - Witcher 3 Power Consumption *
min: 29.7 avg: 47.7 median: 46.7 (10%) max: 64.6 Watt
min: 56.7 avg: 71.2 median: 71.2 (16%) max: 85.6 Watt
GPU TDP ? TDP 35 W 102% 100%
Power Consumption - Witcher 3 ultra Power Efficiency
min: 0.3826 avg: 0.5 median: 0.5 (45%) max: 1.108 fps per Watt
min: 0.2395 avg: 0.3 median: 0.3 (25%) max: 0.3245 fps per Watt
GPU TDP ? TDP 35 W 100% 65%
Power Consumption - Witcher 3 ultra Power Efficiency - external Monitor
min: 0.4246 avg: 0.6 median: 0.5 (44%) max: 1.207 fps per Watt
0.3 fps per Watt (29%)
GPU TDP ? TDP 35 W 100% 62%
Power Consumption - Cyberpunk 2077 Power Consumption 150cd *
54.4 Watt (35%)
Emissions Witcher 3 Fan Noise + Intel Arc 8-Core iGPU Emissions - Witcher 3 Fan Noise
min: 27 avg: 38.1 median: 38 (61%) max: 46.3 dB(A)
Witcher 3 Fan Noise + Intel Arc A350M
47.5 dB(A) (76%)
GPU TDP ? TDP 35 W 80% 100%
Average Benchmarks Intel Arc 8-Core iGPU → 100% n=32 Average Benchmarks Intel Arc A350M → 98% n=32
- Range of benchmark values for this graphics card
- Average benchmark values for this graphics card
* Smaller numbers mean a higher performance
1 This benchmark is not used for the average calculation
Game Benchmarks The following benchmarks stem from our benchmarks of review laptops. The performance depends on the used graphics memory, clock rate, processor, system settings, drivers, and operating systems. So the results don't have to be representative for all laptops with this GPU. For detailed information on the benchmark results, click on the fps number.
100%
Arc 8-Core:
82 [X] Lenovo Yoga Pro 7 14 Intel Core Ultra 7 155H 3.8GHz
Arc 8-Core
min:
68 fps
fps
100%
Arc 8-Core:
74 [X] Lenovo Yoga Pro 7 14 Intel Core Ultra 7 155H 3.8GHz
Arc 8-Core
min:
62 fps
fps
100%
Arc 8-Core:
53 [X] Lenovo Yoga Pro 7 14 Intel Core Ultra 7 155H 3.8GHz
Arc 8-Core
min:
43 fps
fps
100%
Arc 8-Core:
14 [X] Lenovo Yoga Pro 7 14 Intel Core Ultra 7 155H 3.8GHz
Arc 8-Core
min:
10 fps
fps
100%
Arc 8-Core:
17.8 [X] Lenovo Yoga Pro 7 14 Intel Core Ultra 7 155H 3.8GHz
Arc 8-Core
min:
14.3 fps, P0.1:
14.4 fps, P1:
15.5 fps, max:
24.4 fps
fps
100%
Arc 8-Core:
14.9 [X] Lenovo Yoga Pro 7 14 Intel Core Ultra 7 155H 3.8GHz
Arc 8-Core
min:
11.5 fps, P0.1:
11.8 fps, P1:
13.1 fps, max:
20.8 fps
fps
100%
Arc 8-Core:
12.1 [X] Lenovo Yoga Pro 7 14 Intel Core Ultra 7 155H 3.8GHz
Arc 8-Core
min:
9.82 fps, P0.1:
9.88 fps, P1:
10.6 fps, max:
15.4 fps
fps
100%
Arc 8-Core:
33.6 [X] Lenovo Yoga Pro 7 14 Intel Core Ultra 7 155H 3.8GHz
Arc 8-Core
min:
26.7 fps, P0.1:
26.8 fps, P1:
28.7 fps, max:
43.8 fps
fps
100%
Arc 8-Core:
28 [X] Lenovo Yoga Pro 7 14 Intel Core Ultra 7 155H 3.8GHz
Arc 8-Core
min:
22.5 fps, P0.1:
23.3 fps, P1:
24.1 fps, max:
35.6 fps
fps
100%
Arc 8-Core:
25.2 [X] Lenovo Yoga Pro 7 14 Intel Core Ultra 7 155H 3.8GHz
Arc 8-Core
min:
20.9 fps, P0.1:
20.9 fps, P1:
21.9 fps, max:
31 fps
fps
100%
Arc 8-Core:
19 [X] Lenovo Yoga Pro 7 14 Intel Core Ultra 7 155H 3.8GHz
Arc 8-Core
min:
16.4 fps, P0.1:
16.5 fps, P1:
16.9 fps, max:
22.5 fps
fps
100%
Arc 8-Core:
18 [X] Lenovo Yoga Pro 7 14 Intel Core Ultra 7 155H 3.8GHz
Arc 8-Core
min:
13.1 fps, P0.1:
13.6 fps, P1:
14.8 fps, max:
22.7 fps
fps
100%
Arc 8-Core:
14.5 [X] Lenovo Yoga Pro 7 14 Intel Core Ultra 7 155H 3.8GHz
Arc 8-Core
min:
2.52 fps, P0.1:
2.78 fps, P1:
10.3 fps, max:
18.6 fps
fps
100%
Arc 8-Core:
0 (!) 30.6 [X] Lenovo Yoga Pro 7 14 Intel Core Ultra 7 155H 3.8GHz
Arc 8-Core
min:
24 fps, P0.1:
24 fps, P1:
24.5 fps, max:
44.3 fps
52 ~ 28 fps
100%
Arc 8-Core:
27.1 [X] Lenovo Yoga Pro 7 14 Intel Core Ultra 7 155H 3.8GHz
Arc 8-Core
min:
20.1 fps, P0.1:
20.3 fps, P1:
21.6 fps, max:
41.7 fps
34 ~ 31 fps
100%
Arc 8-Core:
18.5 [X] Lenovo Yoga Pro 7 14 Intel Core Ultra 7 155H 3.8GHz
Arc 8-Core
min:
13.2 fps, P0.1:
13.4 fps, P1:
14.9 fps, max:
23.3 fps
29 ~ 24 fps
100%
Arc 8-Core:
16.2 [X] Lenovo Yoga Pro 7 14 Intel Core Ultra 7 155H 3.8GHz
Arc 8-Core
min:
12.3 fps, P0.1:
12.3 fps, P1:
13.5 fps, max:
21.9 fps
25 ~ 21 fps
100%
Arc 8-Core:
69 [X] Lenovo Yoga Pro 7 14 Intel Core Ultra 7 155H 3.8GHz
Arc 8-Core
min:
28 fps
fps
100%
Arc 8-Core:
56 [X] Lenovo Yoga Pro 7 14 Intel Core Ultra 7 155H 3.8GHz
Arc 8-Core
min:
20 fps
fps
100%
Arc 8-Core:
49 [X] Lenovo Yoga Pro 7 14 Intel Core Ultra 7 155H 3.8GHz
Arc 8-Core
min:
8 fps
fps
100%
Arc 8-Core:
29 [X] Lenovo Yoga Pro 7 14 Intel Core Ultra 7 155H 3.8GHz
Arc 8-Core
min:
7 fps
fps
100%
Arc 8-Core:
45.8 [X] Acemagic F2A Intel Core Ultra 7 155H 3.8GHz
Arc 8-Core
min:
14.5 fps, P0.1:
37.2 fps, P1:
38.5 fps, max:
92.5 fps
73.9 ~ 60 fps
100%
Arc 8-Core:
39.1 [X] Acemagic F2A Intel Core Ultra 7 155H 3.8GHz
Arc 8-Core
min:
13.6 fps, P0.1:
30.9 fps, P1:
33.7 fps, max:
100.7 fps
52.4 ~ 46 fps
100%
Arc 8-Core:
33.9 [X] Acemagic F2A Intel Core Ultra 7 155H 3.8GHz
Arc 8-Core
min:
10.5 fps, P0.1:
22.8 fps, P1:
29.4 fps, max:
108.3 fps
46.4 ~ 40 fps
100%
Arc 8-Core:
27.6 [X] Acemagic F2A Intel Core Ultra 7 155H 3.8GHz
Arc 8-Core
min:
13.3 fps, P0.1:
18.8 fps, P1:
24.3 fps, max:
102.3 fps
40.3 ~ 34 fps
100%
Arc 8-Core:
152.6 183.9 [X] Acemagic F2A Intel Core Ultra 7 155H 3.8GHz
Arc 8-Core
min:
19.6 fps, P0.1:
45.2 fps, P1:
128.5 fps, max:
834 fps
208 ~ 182 fps
100%
Arc 8-Core:
111.5 128.6 [X] Acemagic F2A Intel Core Ultra 7 155H 3.8GHz
Arc 8-Core
min:
17.2 fps, P0.1:
40.4 fps, P1:
90.9 fps, max:
415 fps
142.8 ~ 128 fps
100%
Arc 8-Core:
108.6 120.9 [X] Acemagic F2A Intel Core Ultra 7 155H 3.8GHz
Arc 8-Core
min:
18 fps, P0.1:
32.4 fps, P1:
93.7 fps, max:
461 fps
134.2 ~ 121 fps
100%
Arc 8-Core:
111.1 fps
100%
Arc 8-Core:
45.7 [X] Acemagic F2A Intel Core Ultra 7 155H 3.8GHz
Arc 8-Core
min:
11.6 fps, P0.1:
27.2 fps, P1:
39.8 fps, max:
116.8 fps
61 ~ 53 fps
100%
Arc 8-Core:
35.4 [X] Acemagic F2A Intel Core Ultra 7 155H 3.8GHz
Arc 8-Core
min:
17.3 fps, P0.1:
18.6 fps, P1:
30.4 fps, max:
93.9 fps
44.1 ~ 40 fps
100%
Arc 8-Core:
24.6 [X] Acemagic F2A Intel Core Ultra 7 155H 3.8GHz
Arc 8-Core
min:
5.68 fps, P0.1:
9.48 fps, P1:
20.2 fps, max:
90.6 fps
30.9 ~ 28 fps
100%
Arc 8-Core:
18.7 [X] Acemagic F2A Intel Core Ultra 7 155H 3.8GHz
Arc 8-Core
min:
7.17 fps, P0.1:
7.84 fps, P1:
16 fps, max:
58.8 fps
22.2 ~ 20 fps
100%
Arc 8-Core:
67.7 [X] Acemagic F2A 800660
Intel Core Ultra 7 155H 3.8GHz
Arc 8-Core
min:
33.1 fps, max:
113.8 fps
73 ~ 70 fps
100%
Arc 8-Core:
51.8 [X] Acemagic F2A 800660
Intel Core Ultra 7 155H 3.8GHz
Arc 8-Core
min:
31.2 fps, max:
99 fps
56.8 ~ 54 fps
100%
Arc 8-Core:
41.7 [X] Acemagic F2A 800660
Intel Core Ultra 7 155H 3.8GHz
Arc 8-Core
min:
24 fps, max:
88.6 fps
44.8 ~ 43 fps
100%
Arc 8-Core:
36.6 [X] Acemagic F2A 800660
Intel Core Ultra 7 155H 3.8GHz
Arc 8-Core
min:
19.9 fps, max:
58.1 fps
39.2 ~ 38 fps
100%
Arc 8-Core:
27 [X] Acemagic F2A Intel Core Ultra 7 155H 3.8GHz
Arc 8-Core
min:
22.1 fps, P0.1:
22.3 fps, P1:
23.6 fps, max:
36.5 fps
33.7 ~ 30 fps
100%
Arc 8-Core:
24 [X] Acemagic F2A Intel Core Ultra 7 155H 3.8GHz
Arc 8-Core
min:
20.6 fps, P0.1:
20.7 fps, P1:
21.5 fps, max:
27.6 fps
31.2 ~ 28 fps
100%
Arc 8-Core:
18.3 [X] Acemagic F2A Intel Core Ultra 7 155H 3.8GHz
Arc 8-Core
min:
10.5 fps, P0.1:
11 fps, P1:
15.2 fps, max:
28.6 fps
24 ~ 21 fps
100%
Arc 8-Core:
12.9 [X] Acemagic F2A Intel Core Ultra 7 155H 3.8GHz
Arc 8-Core
min:
9.37 fps, P0.1:
9.72 fps, P1:
11 fps, max:
17.4 fps
17.3 ~ 15 fps
100%
Arc 8-Core:
61.9 [X] Acemagic F2A Intel Core Ultra 7 155H 3.8GHz
Arc 8-Core
min:
52 fps, max:
68 fps
fps
100%
Arc 8-Core:
37.7 [X] Acemagic F2A Intel Core Ultra 7 155H 3.8GHz
Arc 8-Core
min:
35 fps, max:
41 fps
fps
100%
Arc 8-Core:
32.1 [X] Acemagic F2A Intel Core Ultra 7 155H 3.8GHz
Arc 8-Core
min:
29 fps, max:
34 fps
fps
100%
Arc 8-Core:
27.2 [X] Acemagic F2A Intel Core Ultra 7 155H 3.8GHz
Arc 8-Core
min:
21 fps, max:
30 fps
fps
100%
Arc 8-Core:
0 (!) 58 [X] Acemagic F2A Intel Core Ultra 7 155H 3.8GHz
Arc 8-Core
min:
43 fps, max:
83 fps
~ 29 fps
100%
Arc 8-Core:
33 35 [X] Acemagic F2A Intel Core Ultra 7 155H 3.8GHz
Arc 8-Core
min:
25 fps, max:
47 fps
~ 34 fps
100%
Arc 8-Core:
28 (!) [X] Acer Swift Go 14 SFG14-72 Intel Core Ultra 7 155H 3.8GHz
Arc 8-Core
30 [X] Acemagic F2A Intel Core Ultra 7 155H 3.8GHz
Arc 8-Core
min:
5 fps, max:
44 fps
~ 29 fps
100%
Arc 8-Core:
26 27 [X] Acemagic F2A Intel Core Ultra 7 155H 3.8GHz
Arc 8-Core
min:
8 fps, max:
36 fps
~ 27 fps
100%
Arc 8-Core:
139.1 fps
100%
Arc 8-Core:
68.5 93 ~ 81 fps
100%
Arc 8-Core:
65 [X] Acemagic F2A Intel Core Ultra 7 155H 3.8GHz
Arc 8-Core
min:
11 fps, max:
82 fps
69 ~ 67 fps
100%
Arc 8-Core:
39 [X] Acemagic F2A Intel Core Ultra 7 155H 3.8GHz
Arc 8-Core
min:
26 fps, max:
47 fps
41 ~ 40 fps
100%
Arc 8-Core:
37 [X] Acemagic F2A Intel Core Ultra 7 155H 3.8GHz
Arc 8-Core
min:
25 fps, max:
44 fps
39 ~ 38 fps
100%
Arc 8-Core:
35 [X] Acemagic F2A Intel Core Ultra 7 155H 3.8GHz
Arc 8-Core
min:
28 fps, max:
42 fps
36 ~ 36 fps
100%
Arc 8-Core:
52.2 [X] Acemagic F2A Intel Core Ultra 7 155H 3.8GHz
Arc 8-Core
min:
27.79 fps, max:
85.54 fps
63.1 ~ 58 fps
100%
Arc 8-Core:
33.9 [X] Acemagic F2A Intel Core Ultra 7 155H 3.8GHz
Arc 8-Core
min:
19.97 fps, max:
51.8 fps
37.6 ~ 36 fps
100%
Arc 8-Core:
25 [X] Acemagic F2A Intel Core Ultra 7 155H 3.8GHz
Arc 8-Core
min:
14.2 fps, max:
40.08 fps
27.1 ~ 26 fps
100%
Arc 8-Core:
19.7 [X] Acemagic F2A Intel Core Ultra 7 155H 3.8GHz
Arc 8-Core
min:
11.97 fps, max:
28.47 fps
21.7 ~ 21 fps
115%
A350M:
65 89 ~ 77 fps
105%
A350M:
39 44 ~ 42 fps
108%
A350M:
37 41 ~ 39 fps
109%
A350M:
35 38 ~ 37 fps
100%
Arc 8-Core:
32 33 ~ 33 fps
Average Gaming Intel Arc 8-Core iGPU → 100% Average Gaming 30-70 fps → 100%
Average Gaming Intel Arc A350M → 90% Average Gaming 30-70 fps → 91%
 Deutsch
 English
 Español
 Français
 Italiano
 Nederlands
 Polski
 Português
 Русский
 Türkçe
 Svenska
 Chinese
 Magyar