 Deutsch
 English
 Español
 Français
 Italiano
 Nederlands
 Polski
 Português
 Русский
 Türkçe
 Svenska
 Chinese
 Magyar
Apple iPad Air 13 (2024) review - The most affordable 13-inch tablet from Apple
The sixth generation of the iPad Air is also available in a 13-inch version for the first time. Until now, those who wanted such a large Apple tablet had to spend a lot of money and purchase a model from the iPad Pro series. The iPad Pro 13 (2024) costs at least 1,549 Euros ($1,299 in the US). With the Apple iPad Air 13 (2024), on the other hand, you can save 500 Euros, since that starts from 949 Euros ($799 in the US).
The iPad Air 13 (2024) inherited the manufacturer's own Apple M2 chipset from the 2022 Pro models. Although compared to the iPad Pro 13 (2024) with its M4 processor, the performance is not as good, it is significantly faster than its Apple iPad Air 5 (2022) predecessor with the M1 processor.
In addition to the new 13-inch form factor, a few other smaller equipment upgrades were also introduced with the Apple iPad Air 13 (2024). The WLAN module was upgraded from WiFi 6 to WiFi 6E, and instead of Bluetooth 5.0, now Bluetooth 5.3 is available. The selfie camera has moved from the short to the long side, so during video calls you won't get the impression anymore that the user is looking past the camera.
Possible Competitors in Comparison
Version | Rating | Date | Model | Weight | Height | Size | Resolution | Best Price |
|---|---|---|---|---|---|---|---|---|
| v8 (new) | 85.7 % | 06/2024 | Apple iPad Air 13 2024 M2, M2 10-Core GPU | 617 g | 6.1 mm | 13.00" | 2732x2048 | |
| v7 (old) | 91.7 % | 03/2022 | Apple iPad Air 5 2022 M1, M1 8-Core GPU | 461 g | 6.1 mm | 10.90" | 2360x1640 | |
| v7 (old) | 90 % | 05/2024 | Apple iPad Air 6 2024 M2, M2 10-Core GPU | 462 g | 6.1 mm | 10.86" | 2360x1640 | |
| v7 (old) | 93.2 % | 05/2024 | Apple iPad Pro 11 2024 M4 (9 cores), M4 10-Core GPU | 444 g | 5.3 mm | 11.00" | 2420x1668 | |
| v7 (old) | 91.3 % | 10/2023 | Samsung Galaxy Tab S9+ SD 8 Gen 2 for Galaxy, Adreno 740 | 586 g | 5.7 mm | 12.40" | 2800x1752 | |
| v7 (old) | 89.3 % | 05/2024 | Xiaomi Pad 6S Pro SD 8 Gen 2, Adreno 740 | 590 g | 6.26 mm | 12.40" | 3048x2032 |
Note that we have updated our rating system, so the results from version 8 are not comparable anymore with those from version 7. You can find additional information on this here.
Case - iPad Air 13 (2024) with an aluminum case
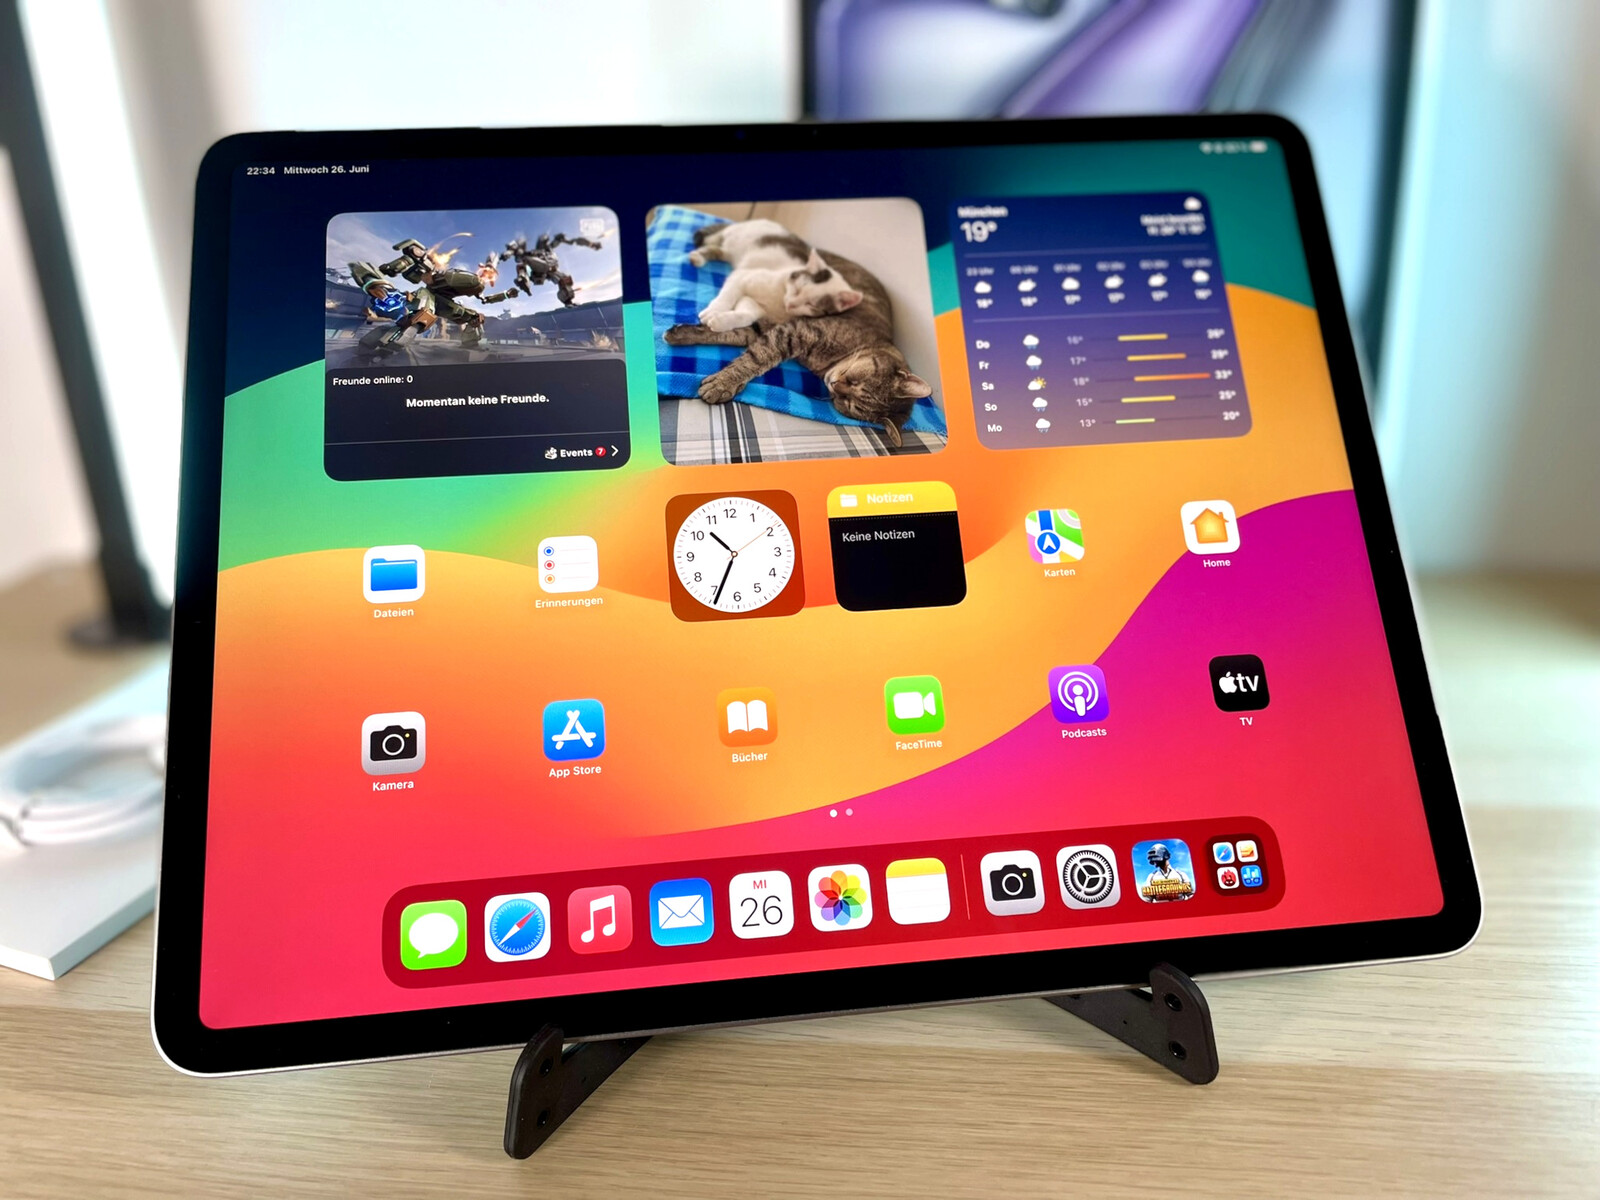
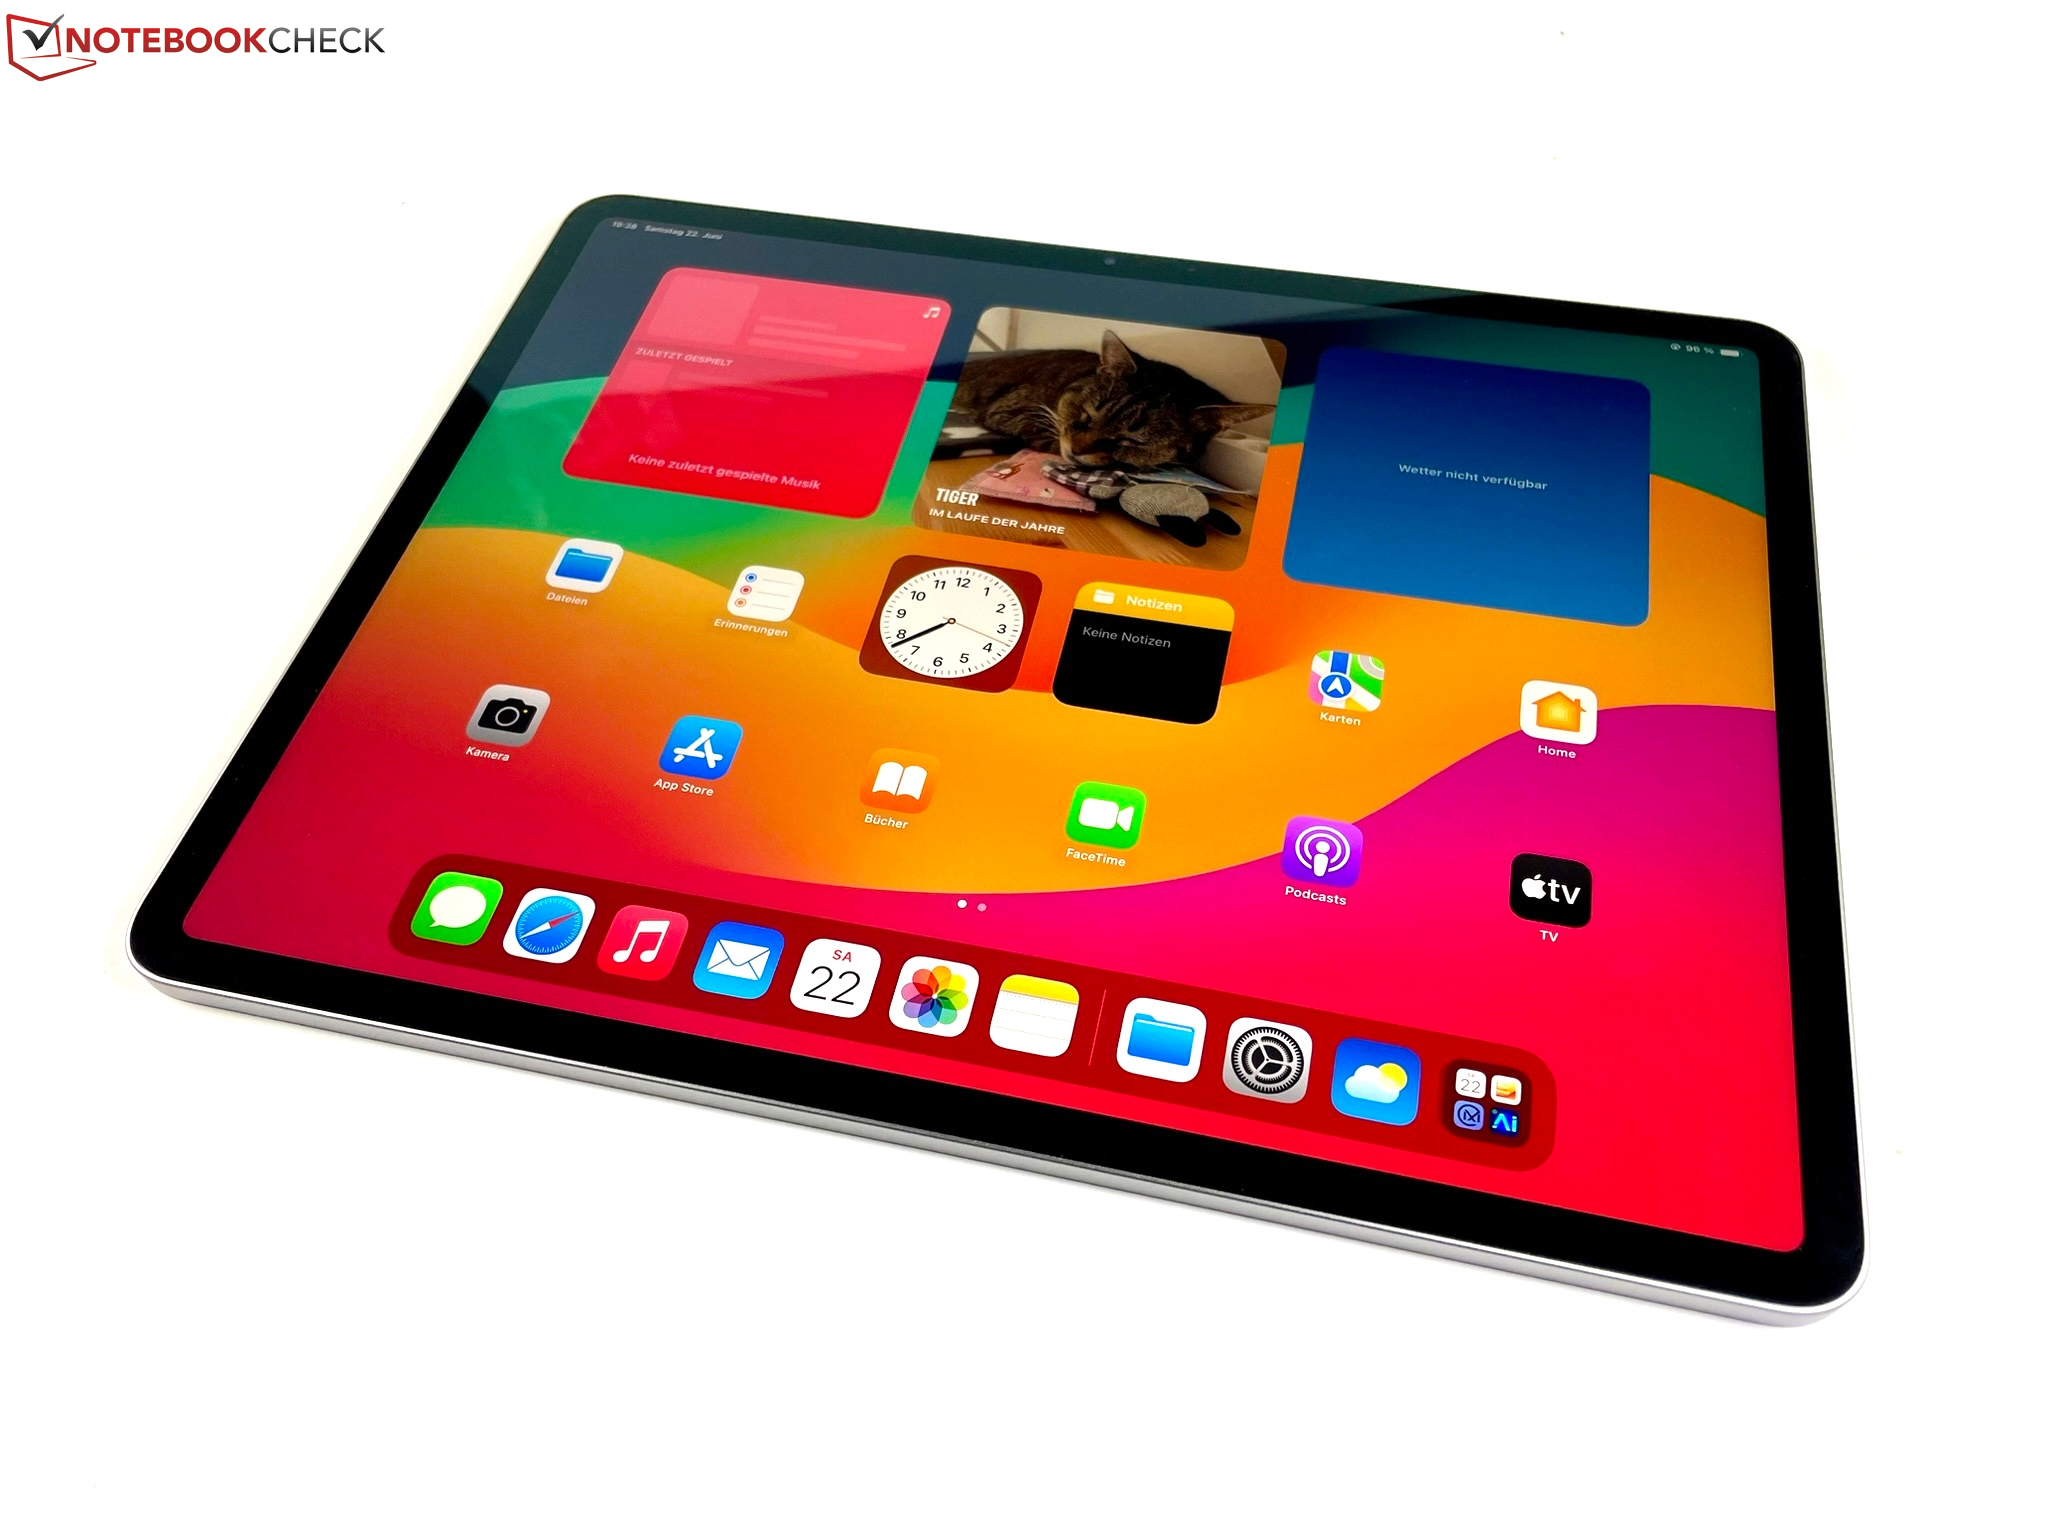
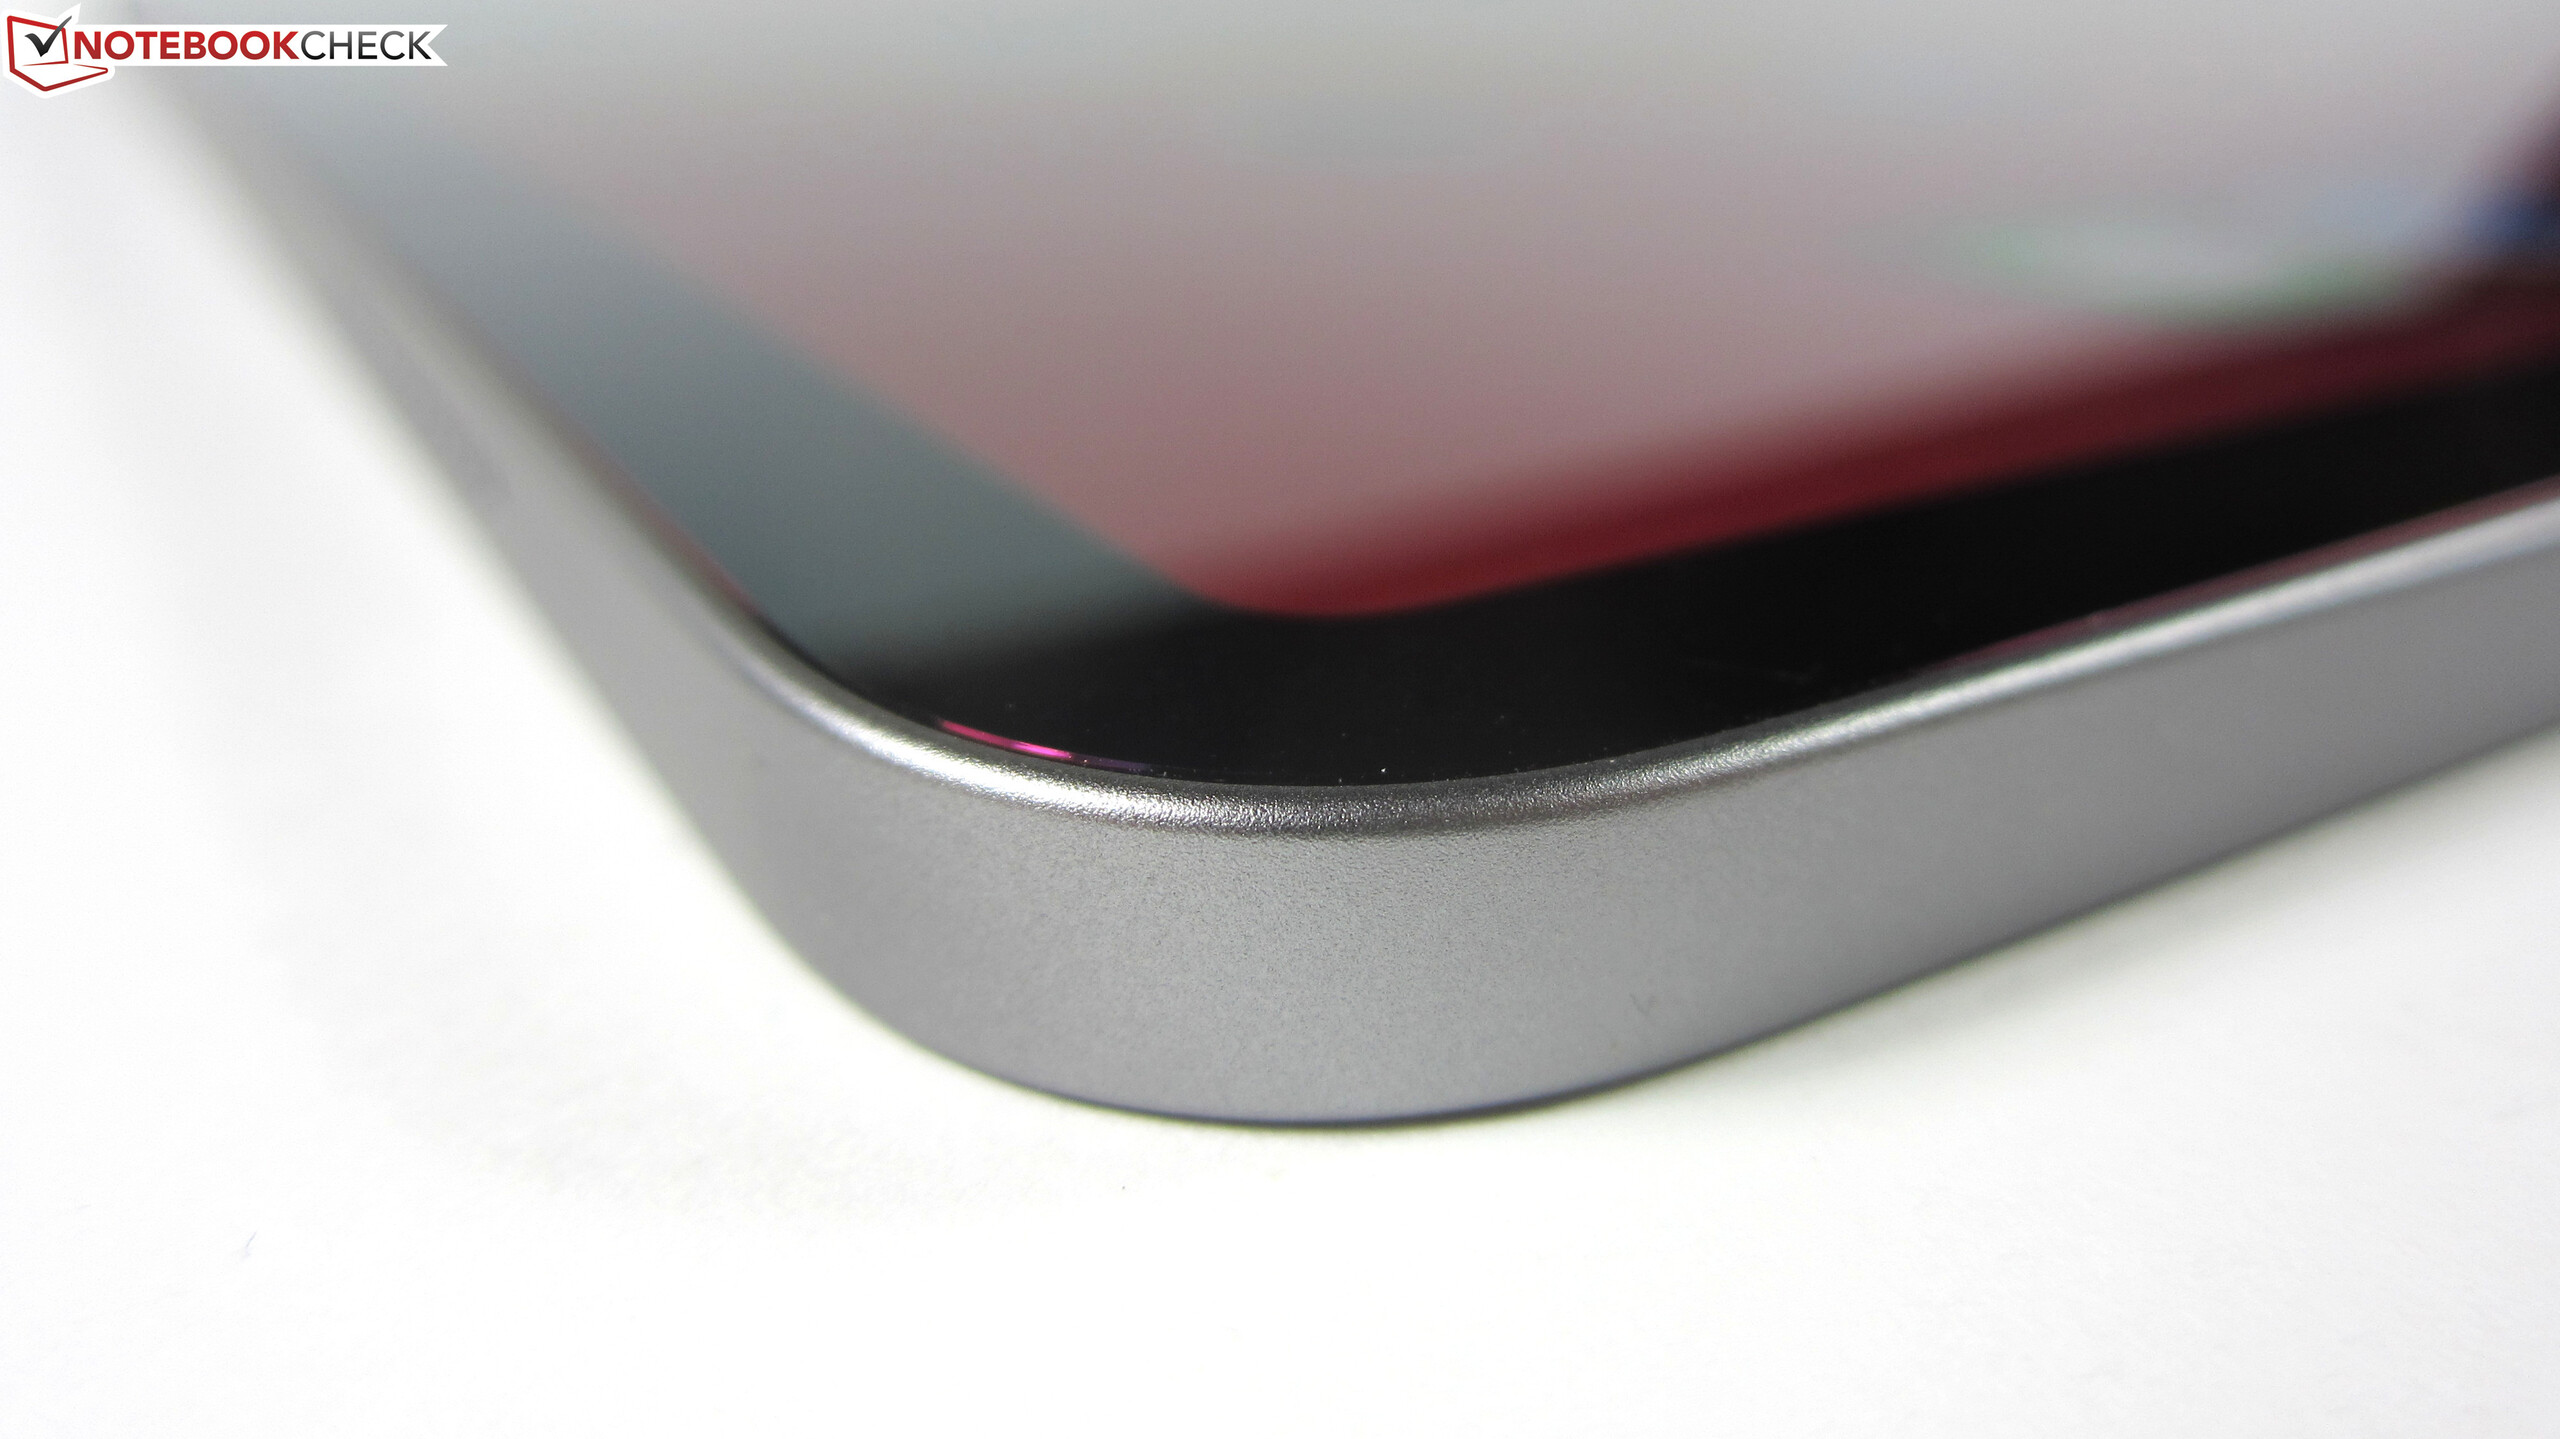
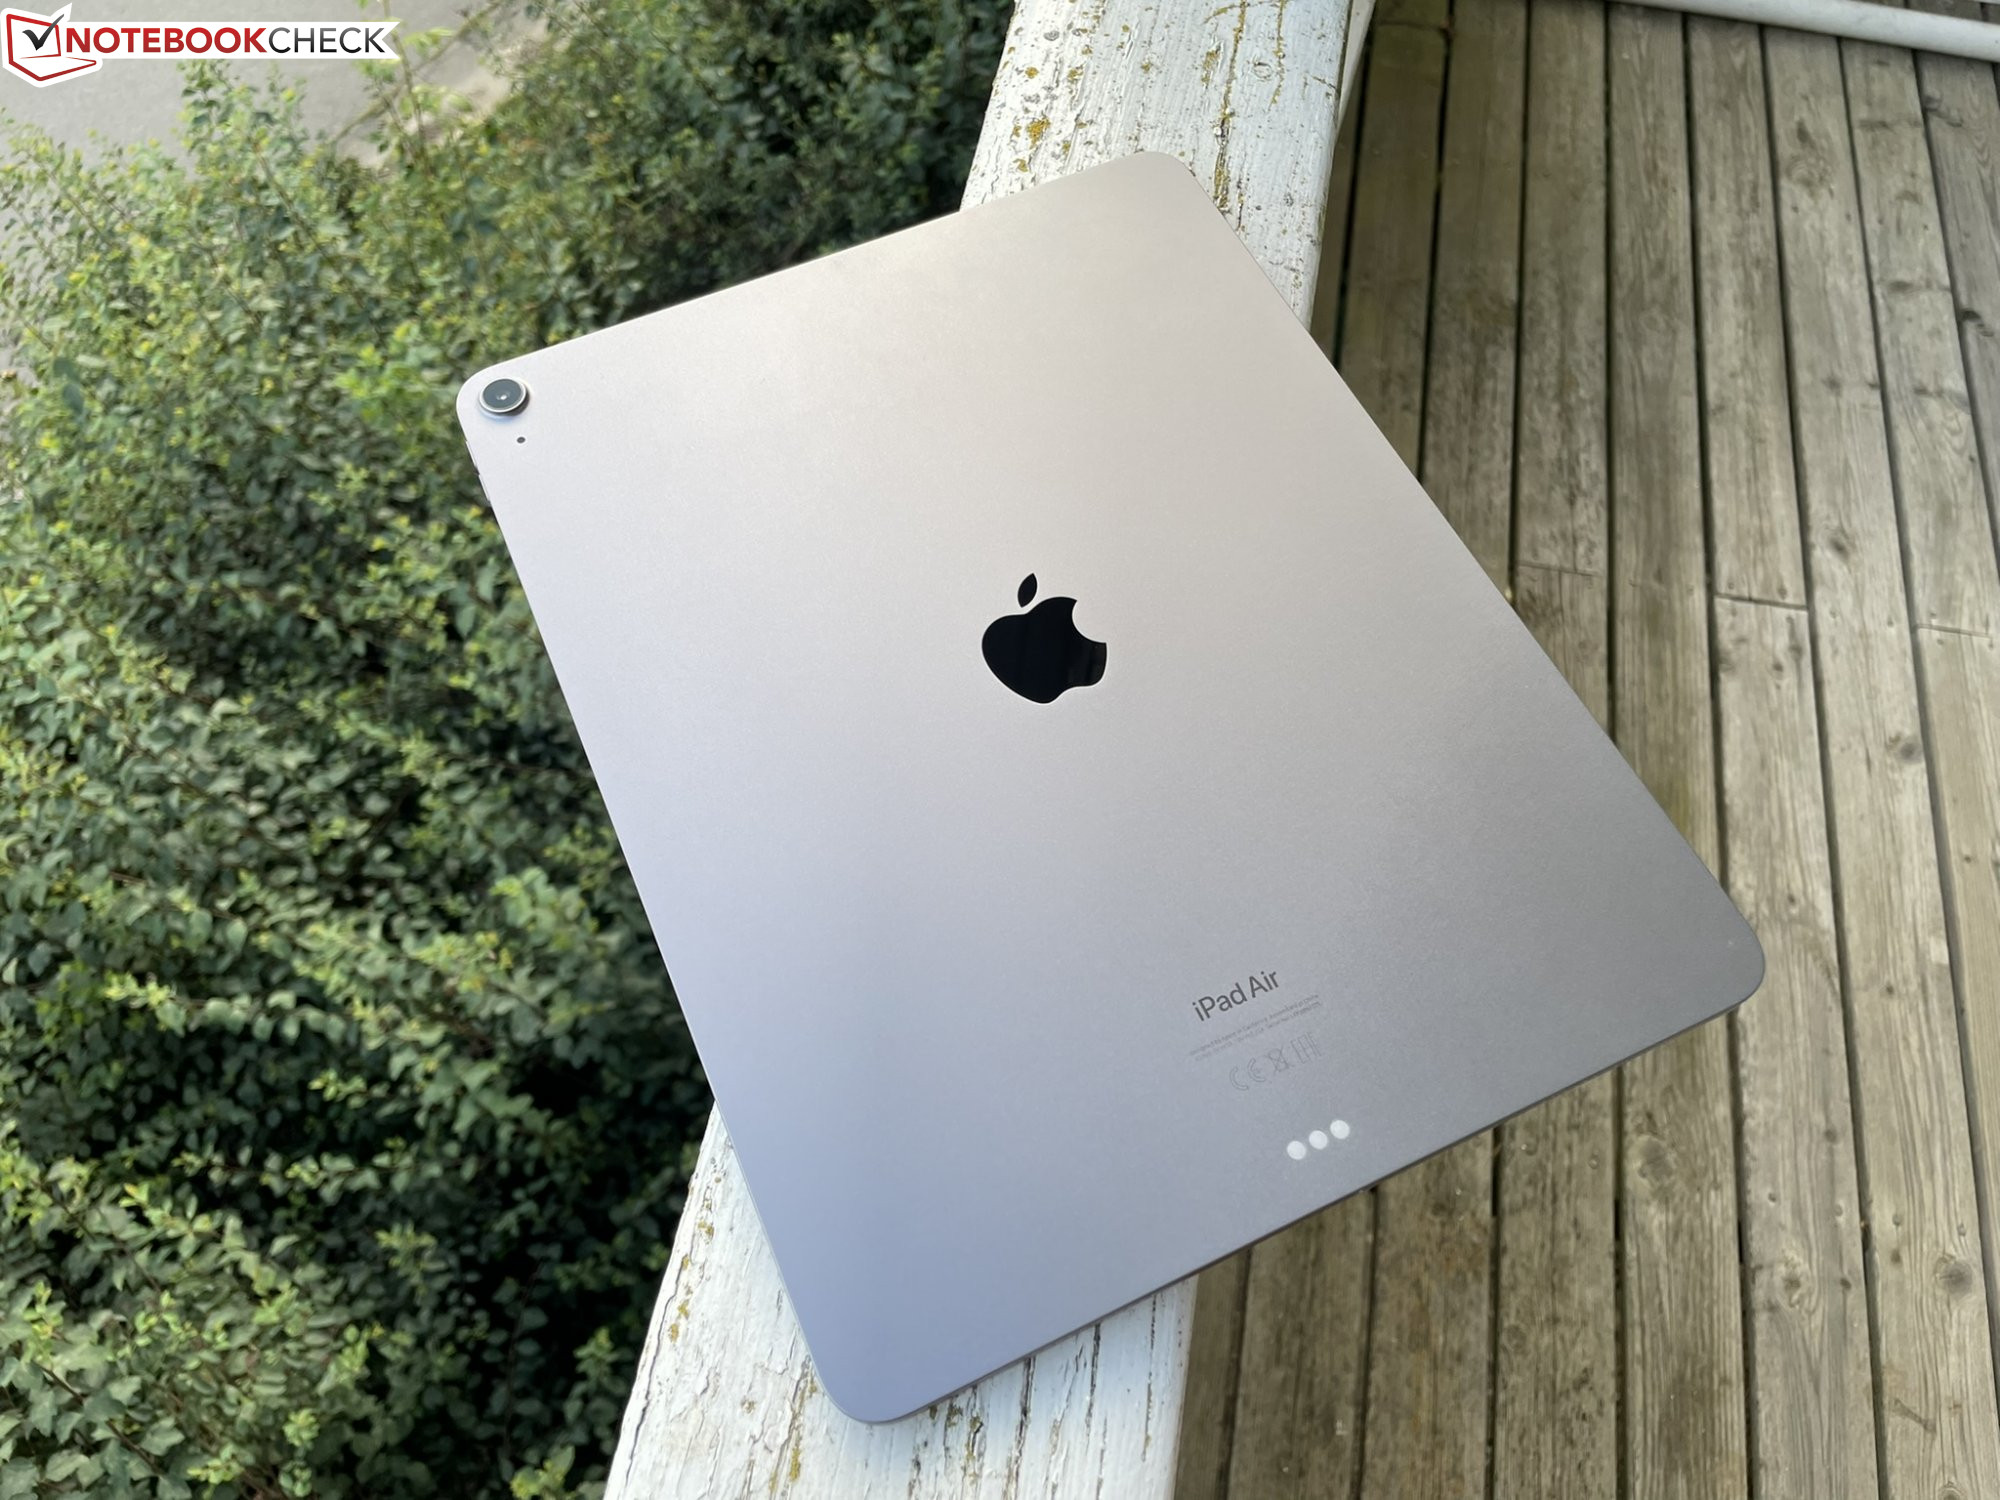
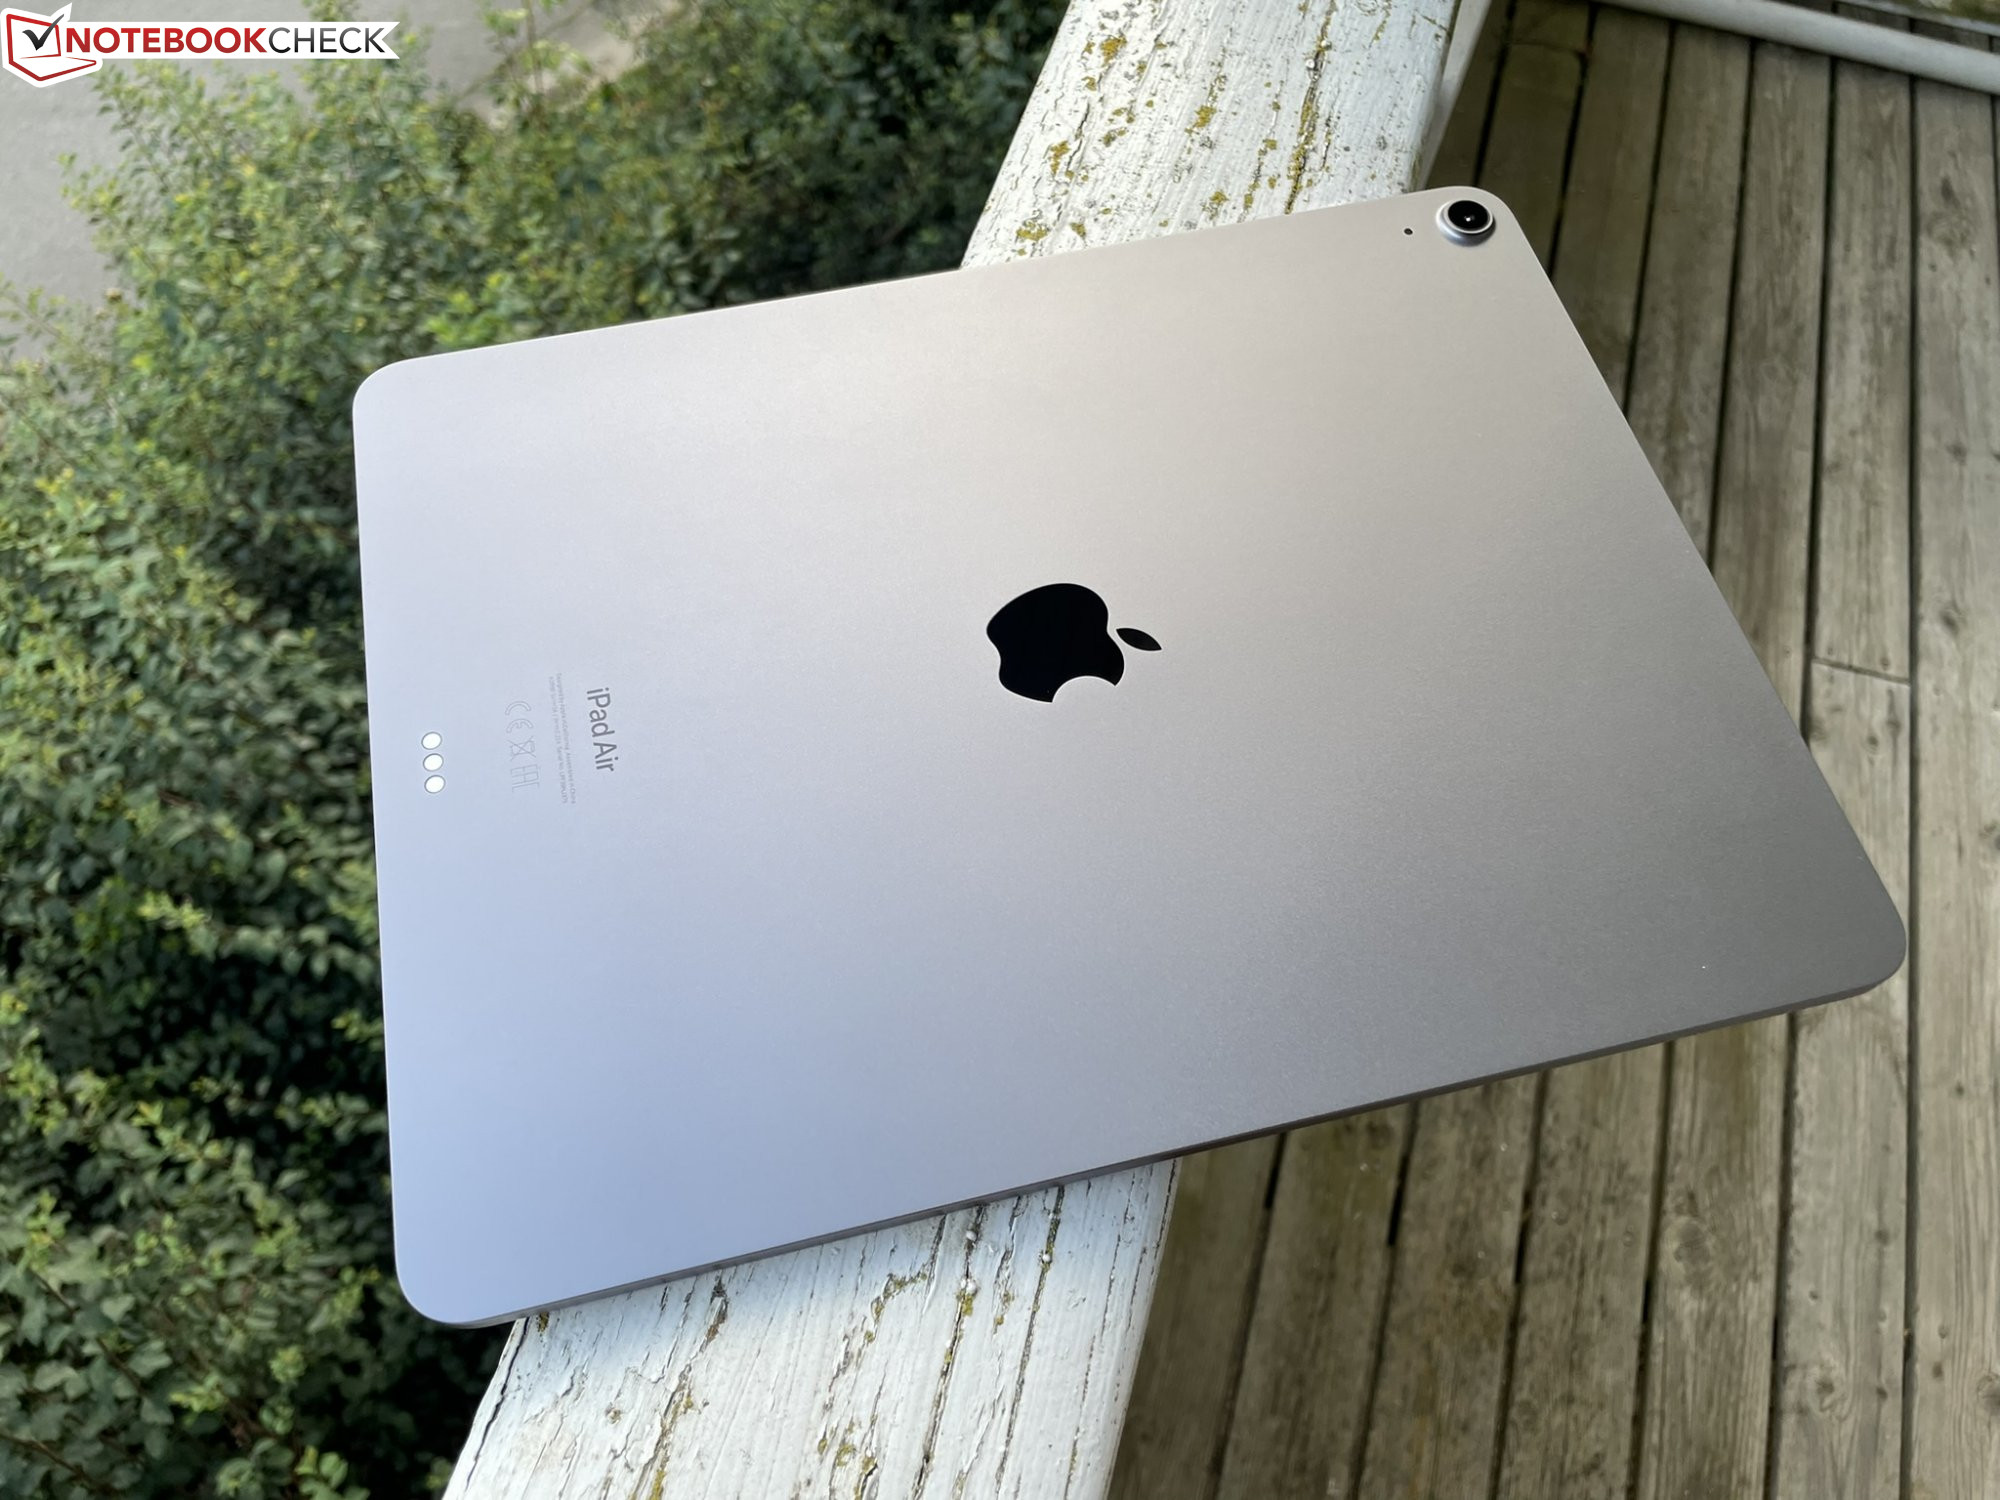
The metal case of the Apple iPad Air 13 (2024) remains basically unchanged from that of the Apple iPad Air 5 (2022). Buyers continue to receive a high-quality unibody tablet made of recycled aluminum. Apple offers the colors Blue, Violet, Polar Star, and Space Gray, and we chose Space Gray for our test unit.
The iPad Air 13 (2024) shows excellent workmanship with tight and even transitions between the materials and also resists any attempts of warping in our test. However, stronger pressure on the IPS panel is sufficient to cause some image artifacts. The tablet doesn't offer an IP certification. Even though the camera in the back sticks out by about 2 mm (~0.08 in), it hardly causes the XXL tablet to wobble when placed on a table.
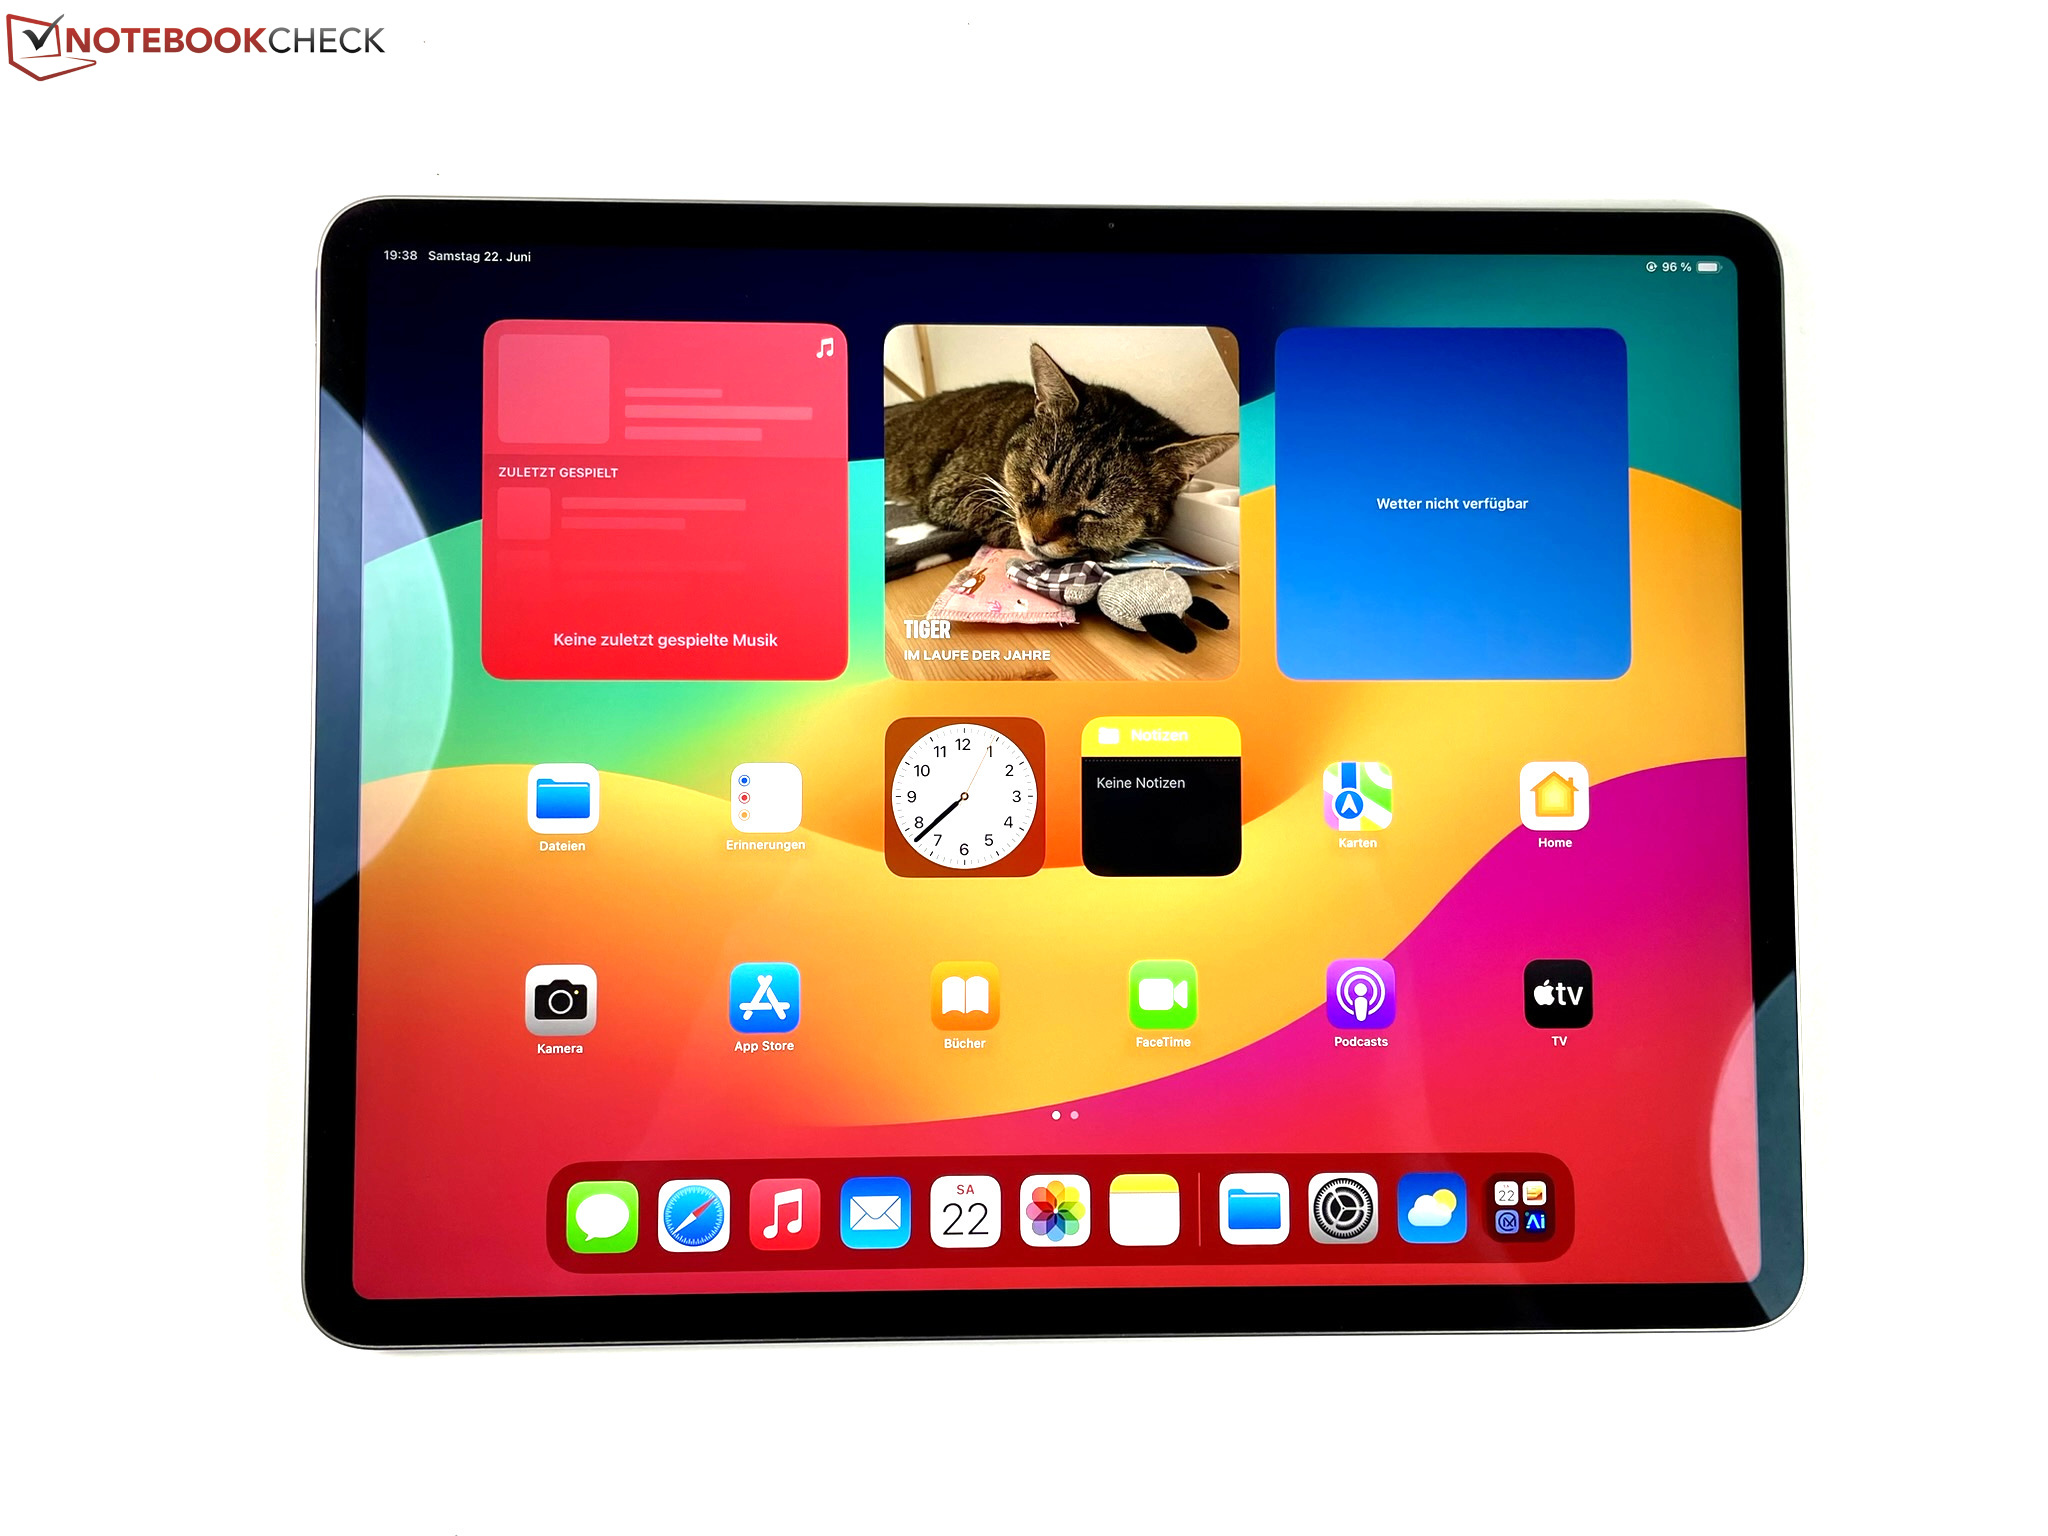
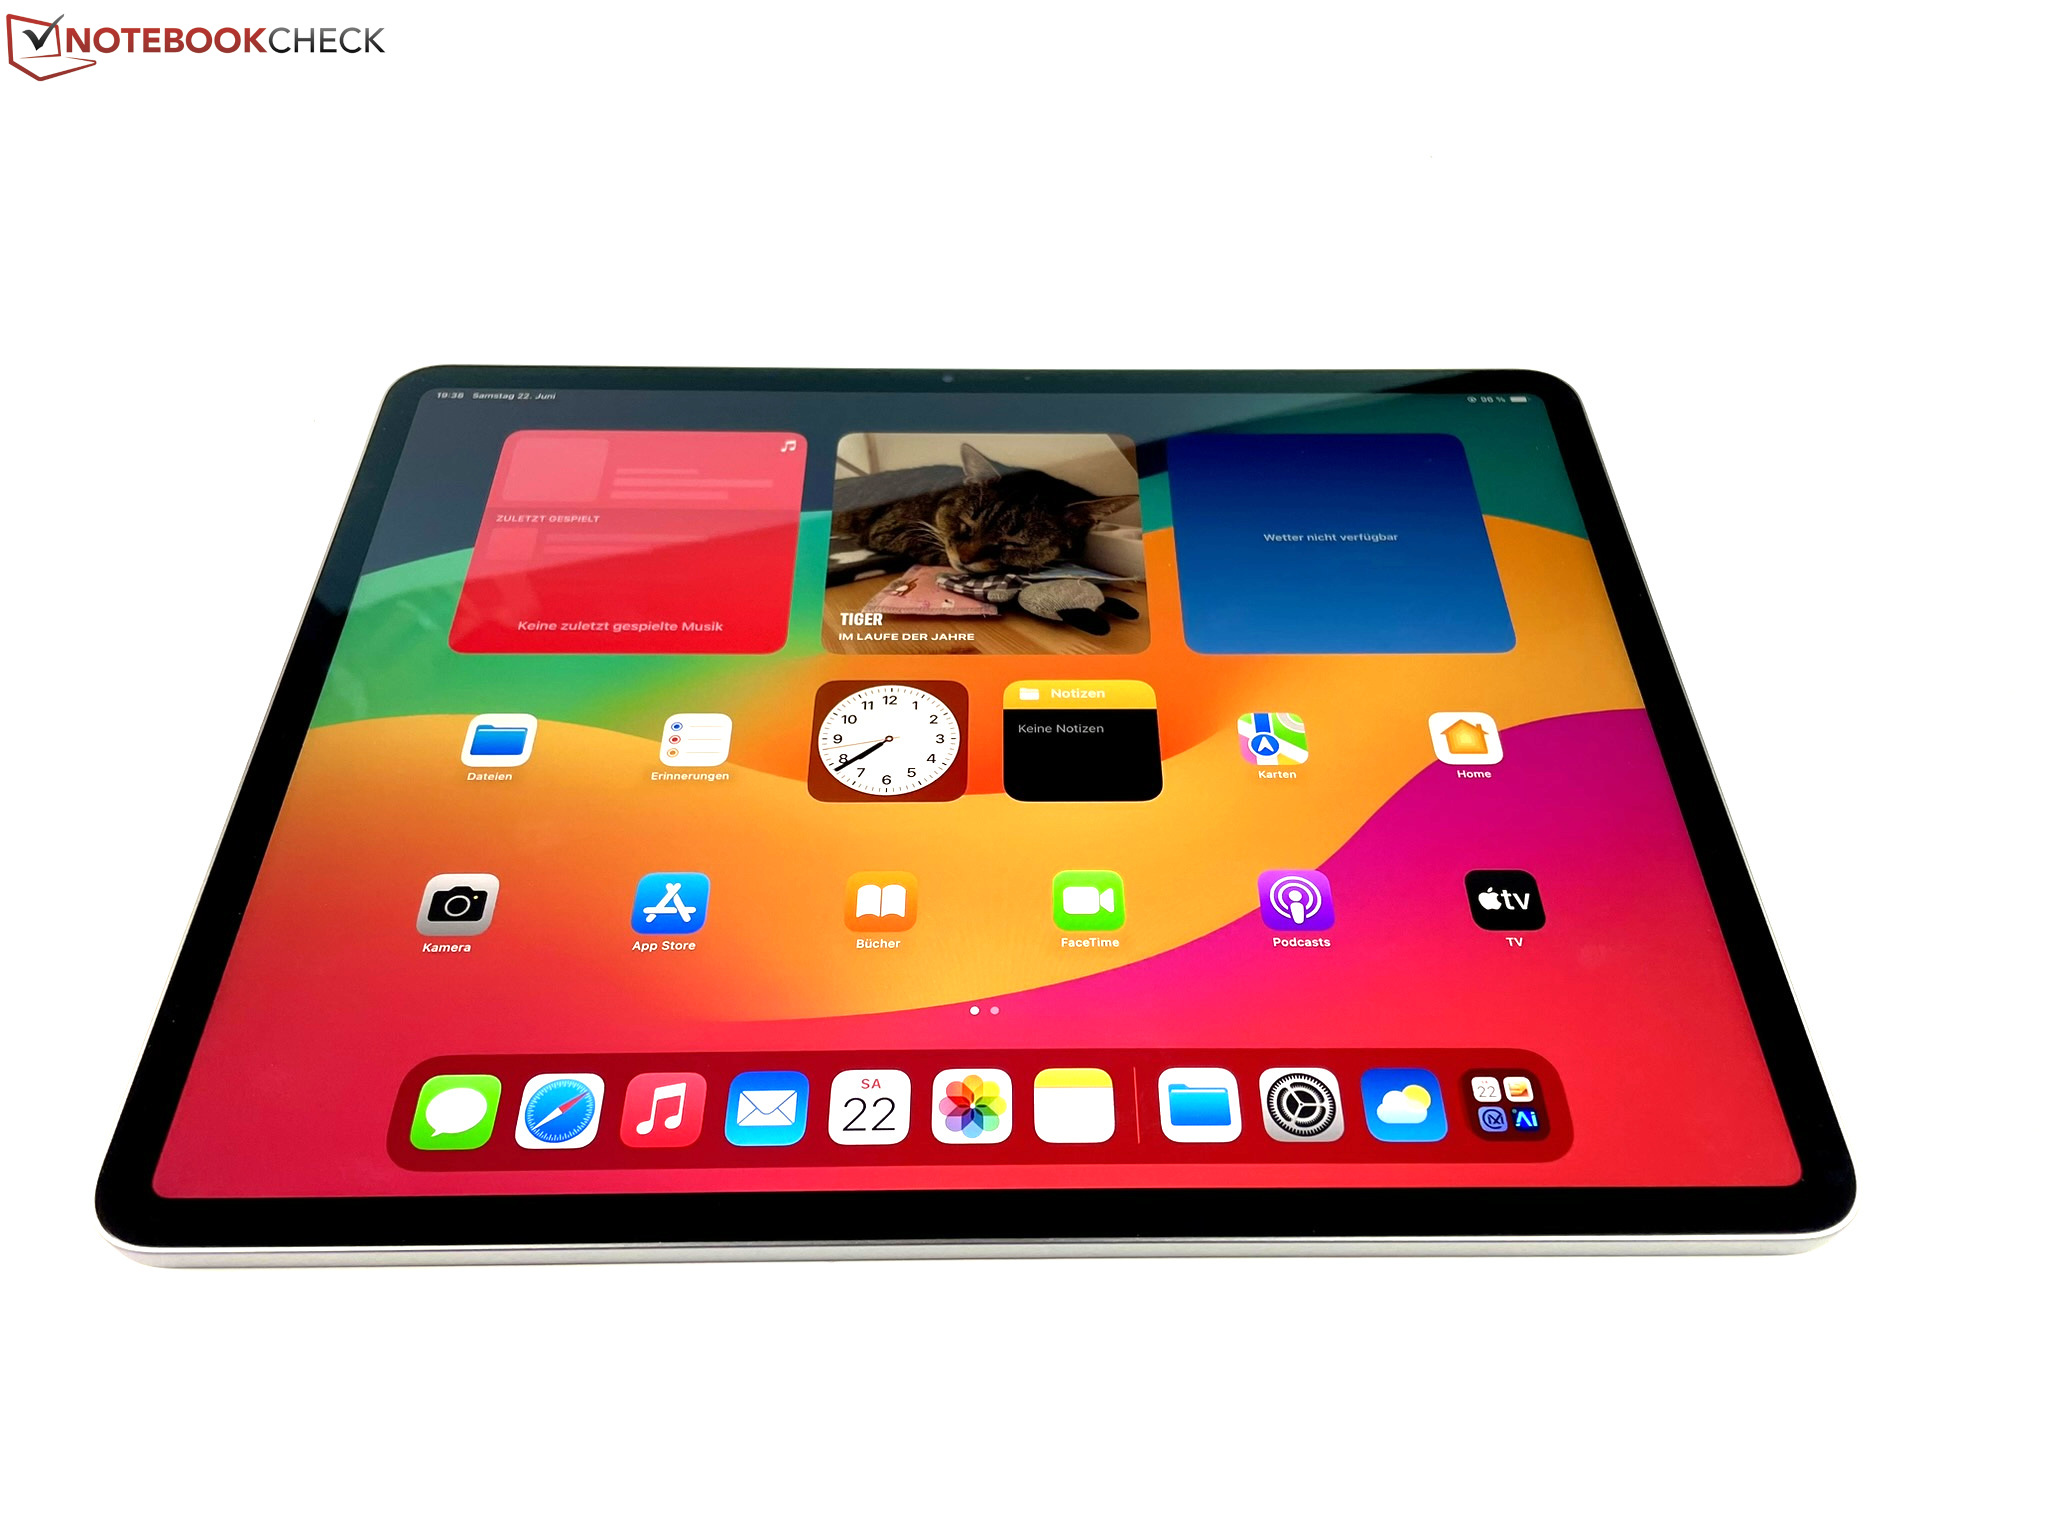
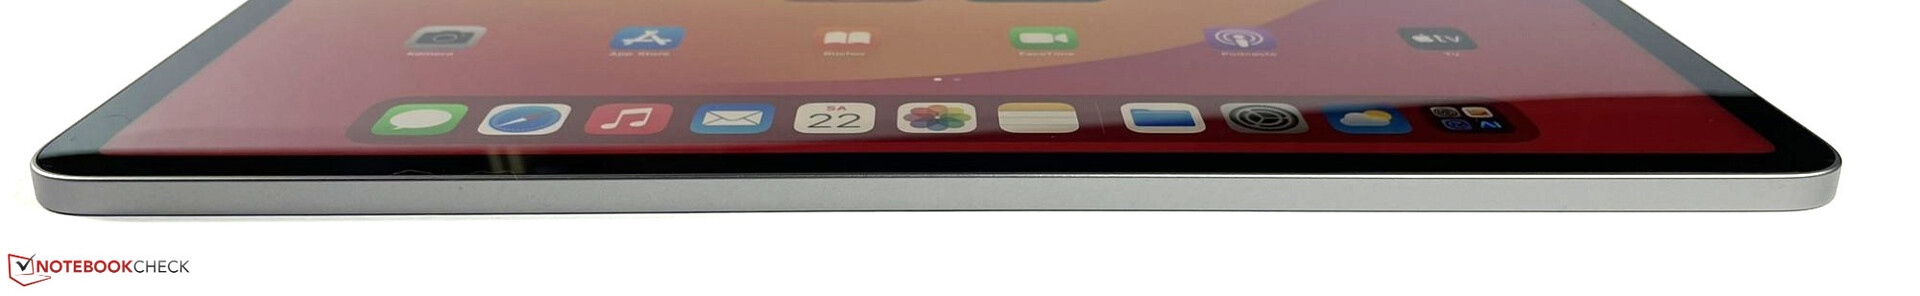
With its 8-mm (~0.3 in) bezels all around, the iPad Air 13 (2024) achieves a good display-to-surface ratio of 87% and looks significantly more modern than its 11-inch iPad Air 11 (2024) sibling model that only reaches about 81%. On the other hand, our test unit still hasn't arrived completely in the modern era, since only the iPad Pro models offer face recognition via Face ID.
The label "Air" stands for the slimmest and lightest tablet series from Apple. However, both of those characteristics are not true anymore for the slim 6.1-mm (~0.24 in) iPad Air 13 (2024) weighing 671 grams (~23.7 oz) in the WiFi version, even though that still makes it very comfortable to hold. With a thickness of 5.1 mm (~0.2 in) and weight of 582 grams (~20.5 oz), the iPad Pro 13 (2024) established the new top values in the 13-inch segment.
Equipment - At least 128 GB of storage for the iPad Air
Apple offers the iPad Air 13 (2024) in the four storage versions of 128 GB, 256 GB, 512 GB, and 1 TB. WiFi 6E is always included. With the WiFi + Cellular version, you can optionally also choose a version with a 5G mobile connection. In contrast to the iPad Pro models, all the iPad Air configurations are equipped with 8 GB of RAM.
The price tiers in the Apple web shop in German-speaking countries are listed as follows, and they are very similar in other EU countries:
- 8 GB RAM, 128 GB ROM: 949 Euros WiFi ($799 in the US) / 1,119 Euros WiFi + Cellular ($949 in the US)
- 8 GB RAM, 256 GB ROM: 1,079 Euros WiFi ($899 in the US) / 1,249 Euros WiFi + Cellular ($1,049 in the US)
- 8 GB RAM, 512 GB ROM: 1,329 Euros WiFi ($1,099 in the US) / 1,499 Euros WiFi + Cellular ($1,249 in the US)
- 8 GB RAM, 1 TB ROM: 1,579 Euros WiFi ($1,299 in the US) / 1,749 Euros WiFi + Cellular ($1,449 in the US)
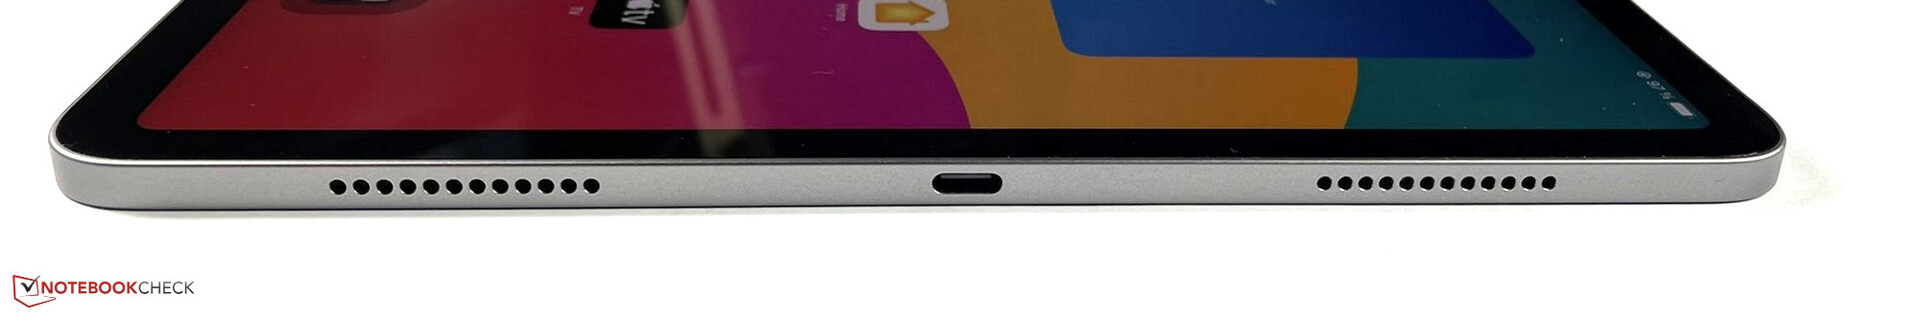
The USB-C port of the iPad Air 13 (2024) runs at USB 3.1 Gen.2 speed, reaching up to 10 Gb/s during data transfers. Using the external Samsung 980 Pro SSD, we measure a transfer rate of 587.5 MB/s for the USB-C port. Native DisplayPort image output is also supported via the USB-C port, but you cannot use the included USB-C cable since it is limited to USB 2.0. The output for external displays can have a resolution of up to 6K at 60 Hz.
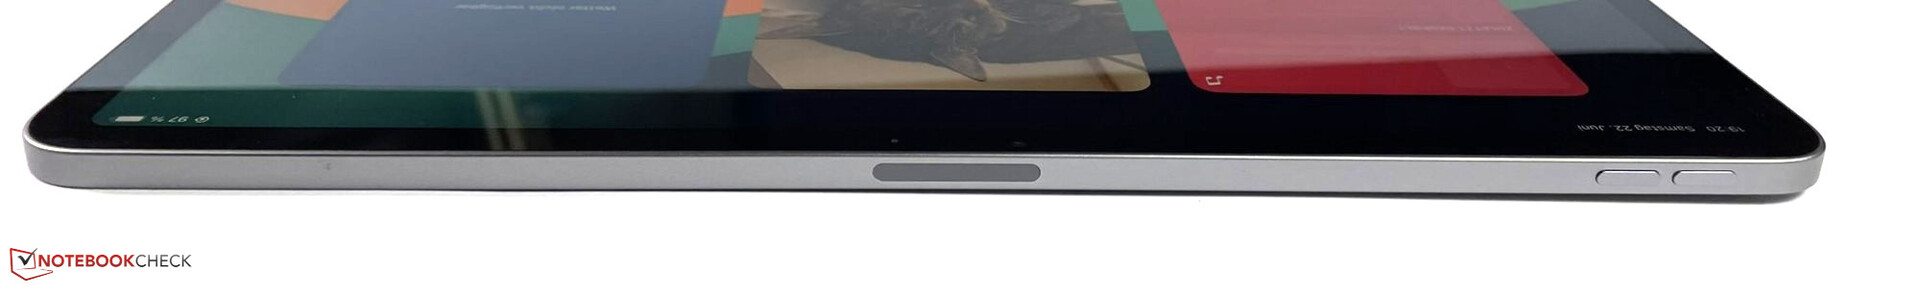
The top of the tablet includes a magnetic holding area for the Apple Pencil Pro or Apple Pencil (USB-C), and you can also connect an optional Apple Magic Keyboard using the 3-pinned Smart Connector in the back.
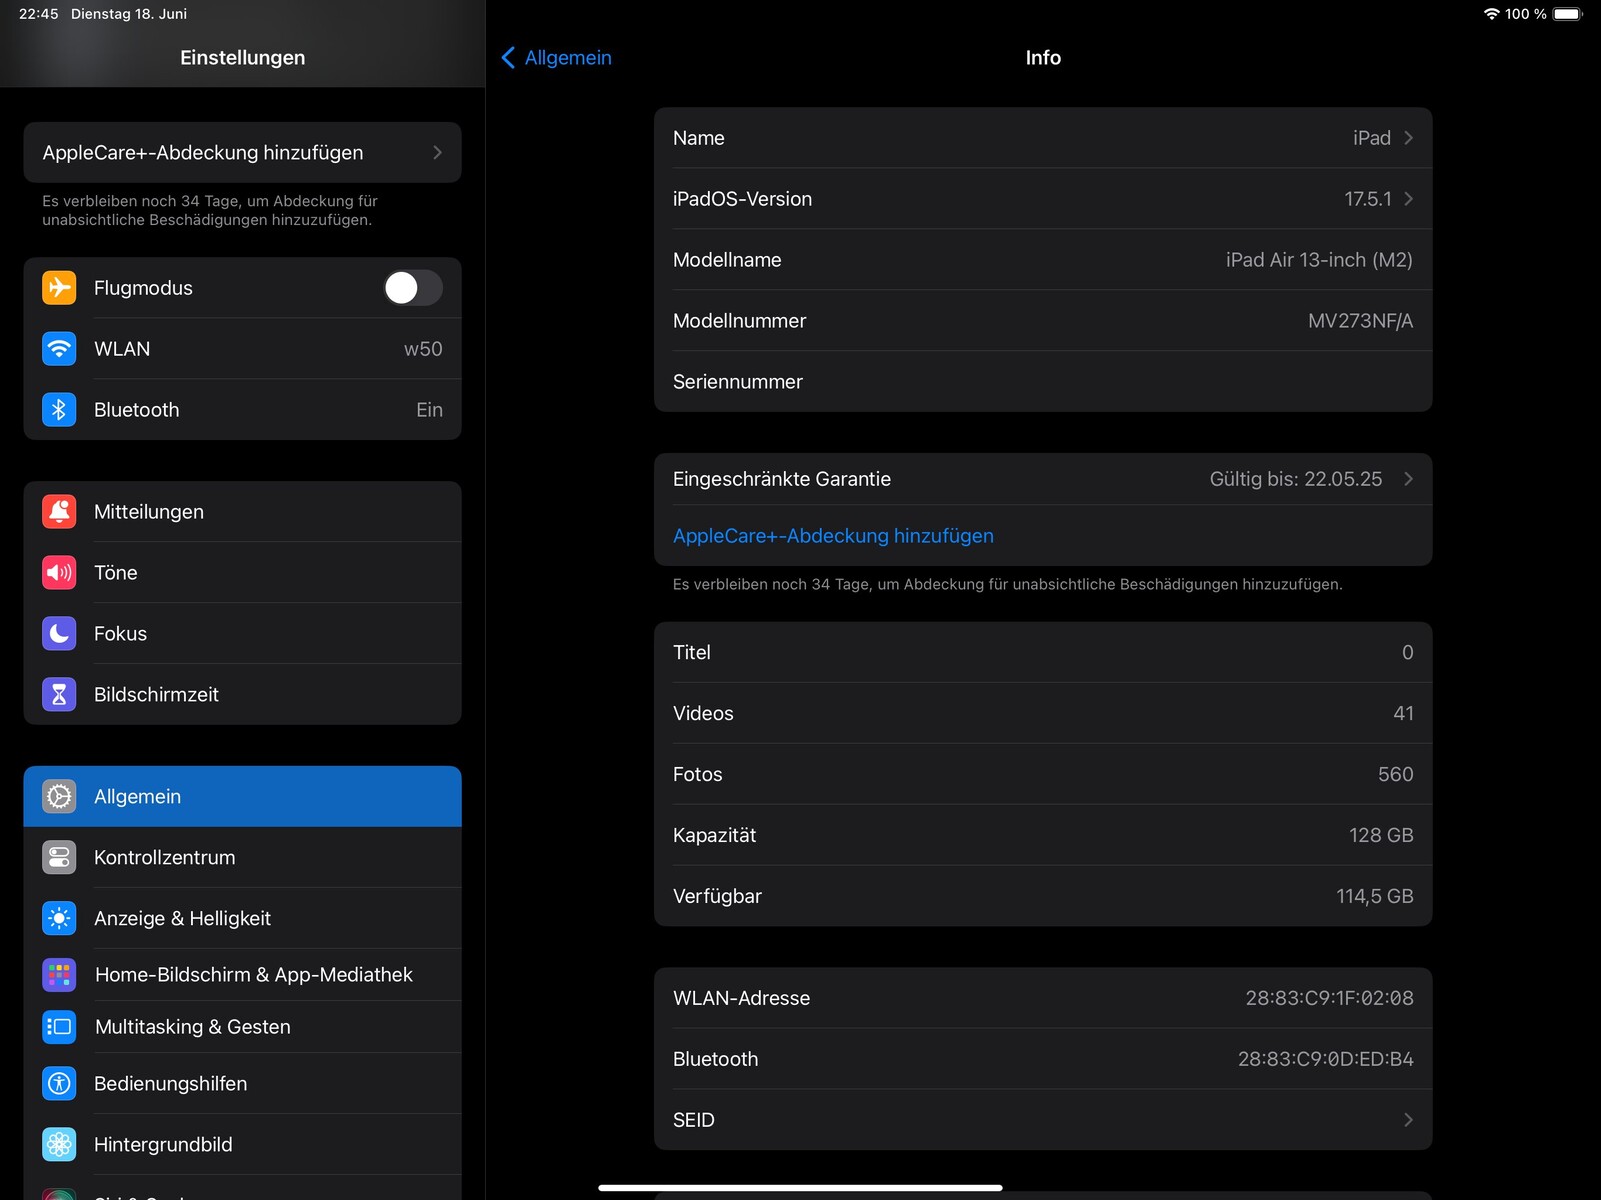
Software - iPad Air with iPadOS 17.5
The Apple iPad Air 13 (2024) includes the iPadOS 17.5 operating system. Even though the manufacturer doesn't offer any official statements on how long the tablet will be provided with updates, we can assume a period of at least 5 years. This has been the case in the past and should also be true now, as for example Apple’s preview of iPadOS 18 shows. The newest operating system version will also run on the 7th generation of the iPad and on the 5th generation of the iPad Mini, which are tablets that were already introduced in 2019.
Communication - GPS only in the WiFi + Cellular version
While its predecessor is limited to WiFi 6, the iPad Air 13 (2024) also supports WiFi 6E and is able to connect to 6-GHz networks. In combination with our Asus ROG Rapture GT-AXE11000 reference router, the tablet reaches high and fairly stable transfer rates with top values of almost 1500 Mb/s.
The WiFi version of the Apple iPad Air 13 (2024) doesn't include a GPS module. Although the WLAN, digital compass, and iBeacon micro-locating are available, this is not sufficient for navigation and recording a route. This is only possible with the WiFi + Cellular version that also includes a GPS module in addition to 5G mobile communication. However, you cannot insert physical SIM cards into the tablet, and only eSIMs can be used.
| Networking | |
| Apple iPad Air 13 2024 | |
| iperf3 receive AXE11000 |
|
| iperf3 transmit AXE11000 |
|
| iperf3 transmit AXE11000 6GHz |
|
| iperf3 receive AXE11000 6GHz |
|
| Apple iPad Air 5 2022 | |
| iperf3 receive AXE11000 |
|
| iperf3 transmit AXE11000 |
|
| Apple iPad Air 6 2024 | |
| iperf3 receive AXE11000 6GHz |
|
| iperf3 receive AXE11000 6GHz |
|
| Apple iPad Pro 11 2024 | |
| iperf3 transmit AXE11000 6GHz |
|
| iperf3 receive AXE11000 6GHz |
|
| Samsung Galaxy Tab S9+ | |
| iperf3 transmit AXE11000 6GHz |
|
| iperf3 receive AXE11000 6GHz |
|
| Xiaomi Pad 6S Pro | |
| iperf3 receive AXE11000 |
|
| iperf3 transmit AXE11000 |
|
| iperf3 transmit AXE11000 6GHz |
|
| iperf3 receive AXE11000 6GHz |
|
Cameras - Single cams with 12 MP

Besides the new placement (on the long instead of the short side), nothing much has changed in the ultrawide-angle selfie camera in terms of technology. The 12-MP camera uses an f/2 aperture and offers a solid image quality. You can record videos in a maximum of 1080p at up to 60 frames per second. During video calls, the convenient Center Stage function also follows the people recognized in the image automatically, when they move around.
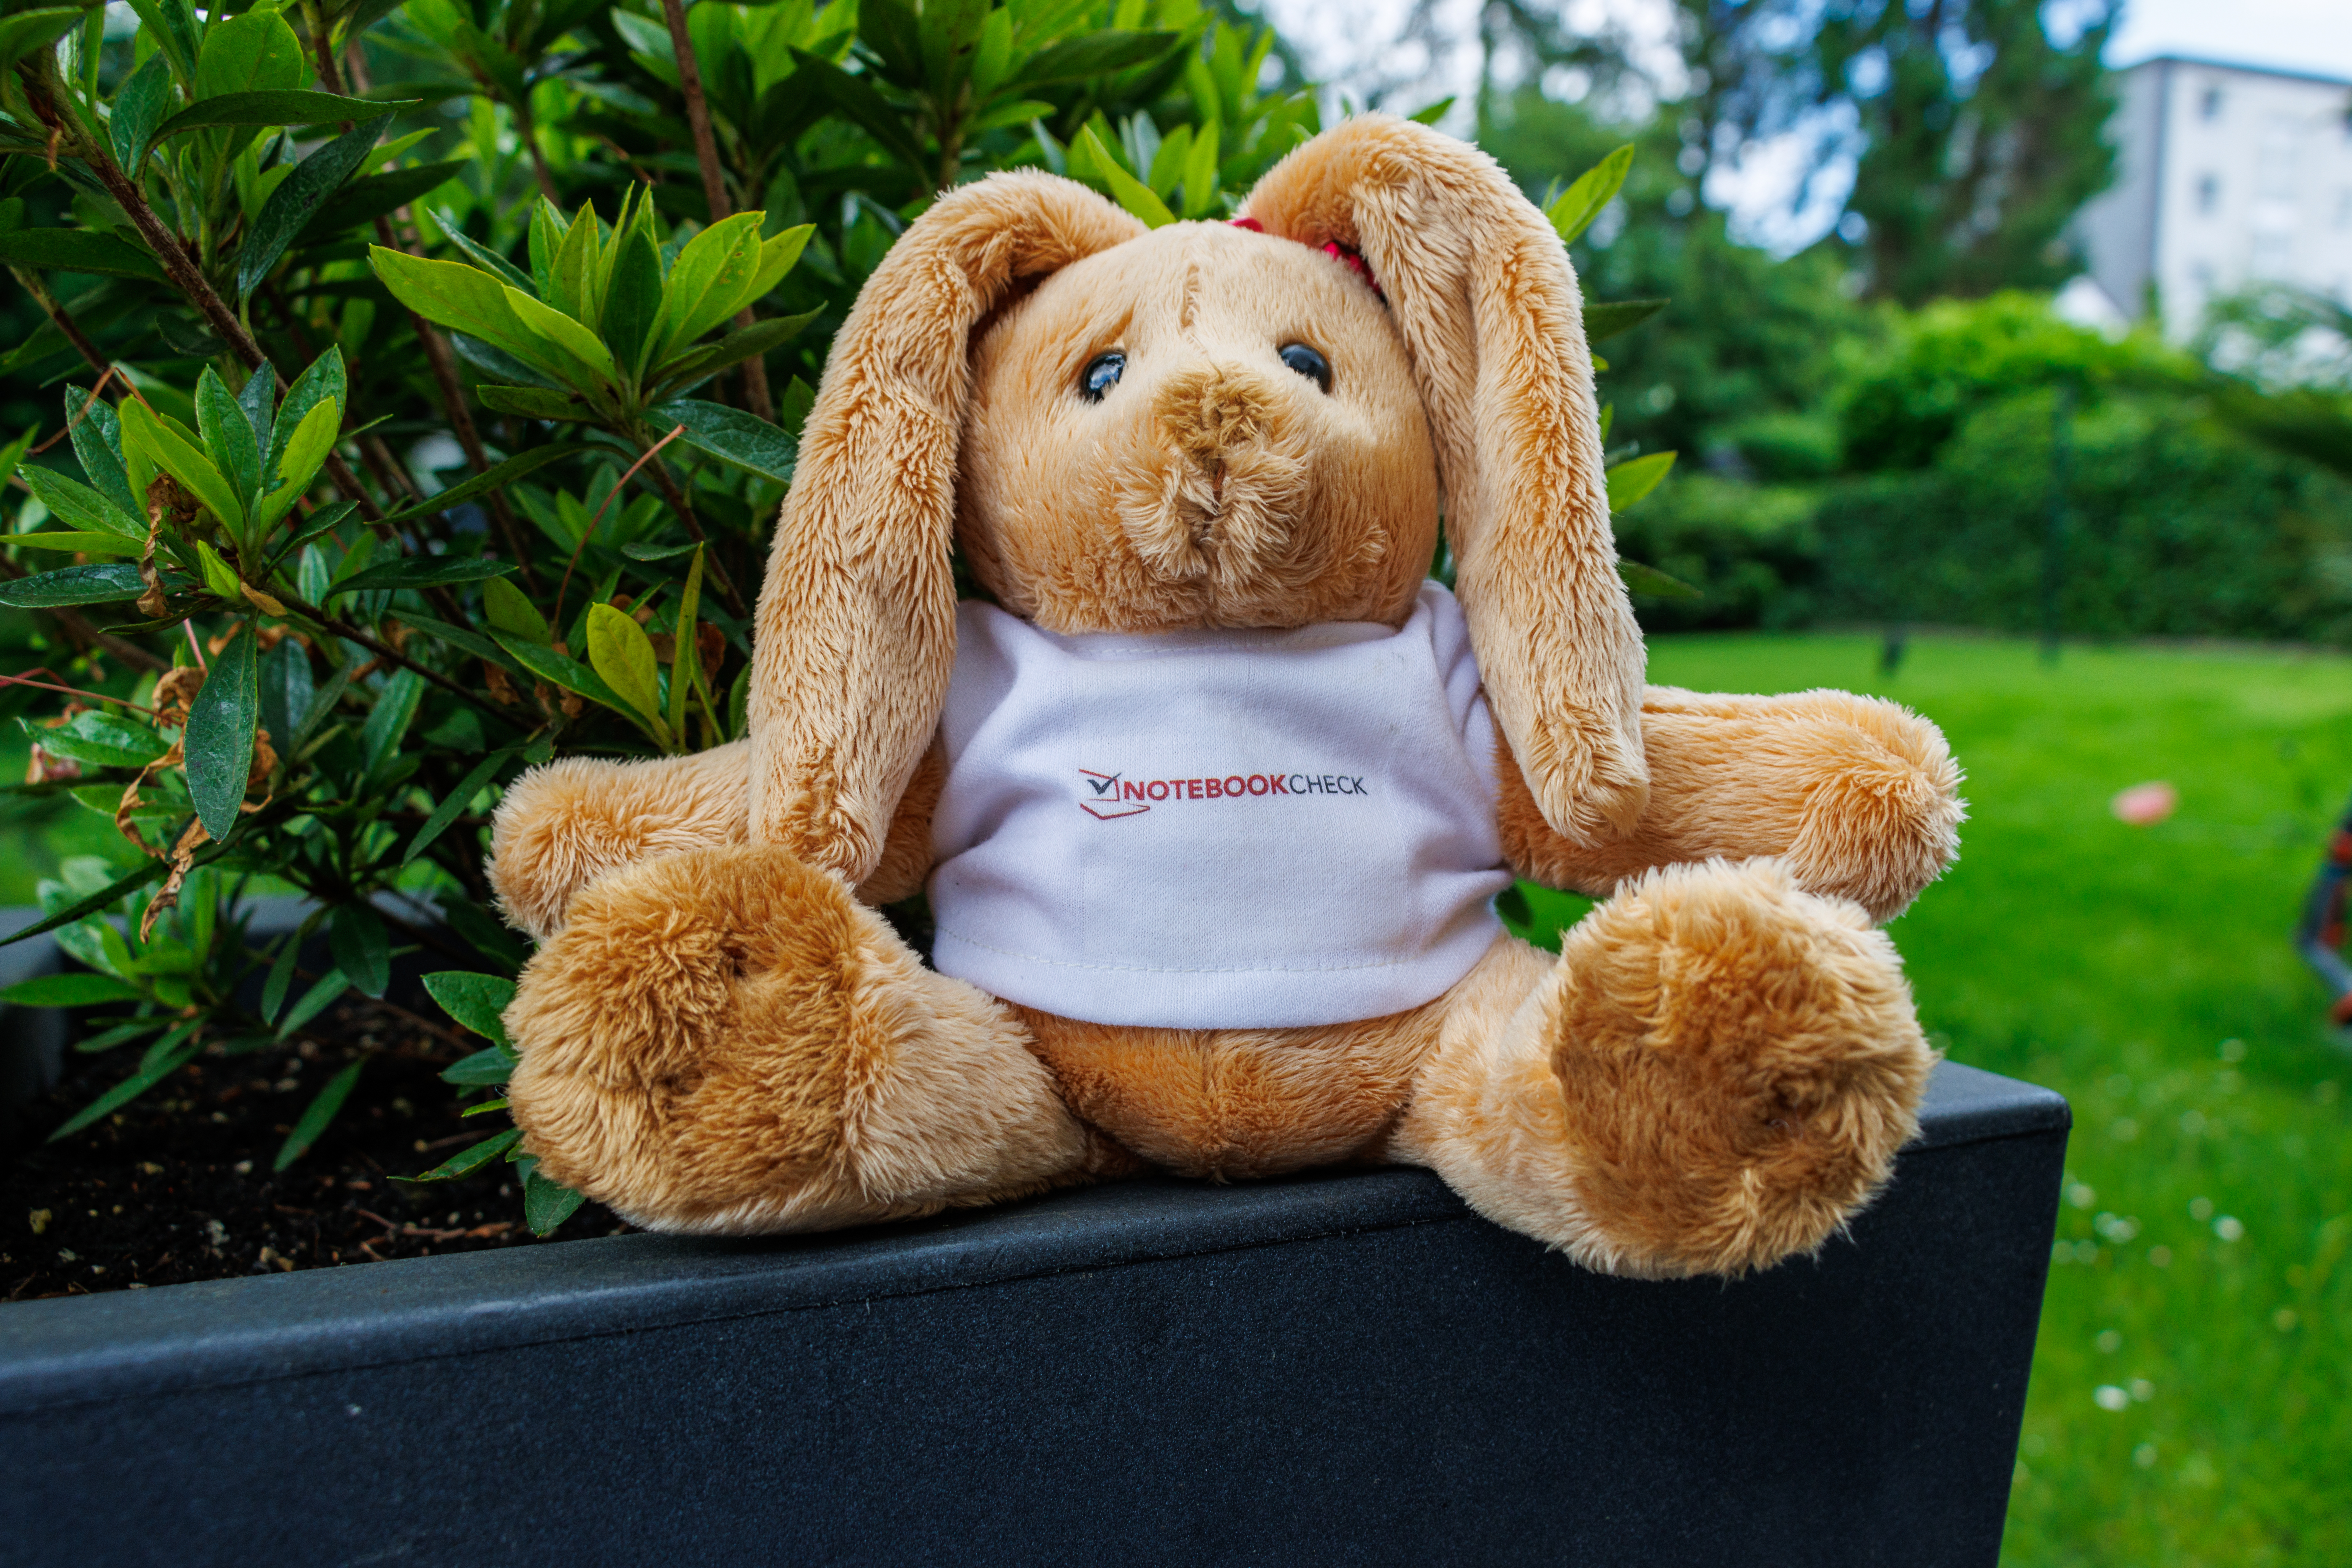
The back houses the 12-MP camera with an f/1.8 aperture, autofocus, and 5x digital zoom that we already know from the Apple iPad Air 5. It achieves good results in daylight and produces above-average results for a tablet, although the amount of detail and image sharpness still remain far from the image quality of current iPhones. This becomes particularly noticeable in bad light conditions, where the tablet only captures the scenes in gloomy colors. The main camera records videos in a maximum of 4K at 60 frames per second.


Image Comparison
Choose a scene and navigate within the first image. One click changes the position on touchscreens. One click on the zoomed-in image opens the original in a new window. The first image shows the scaled photograph of the test device.
Daylight picture 1Daylight picture 25x zoomLow light picture


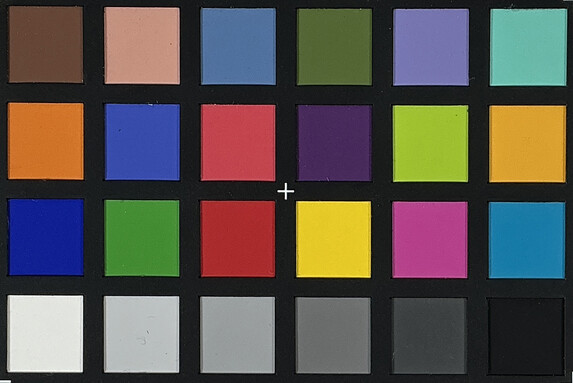
We take another look at the main camera in our test lab. In optimal light conditions, the colors are reproduced accurately, and the picture of the test chart is sharp. But this changes at 1 Lux of remaining light: The color accuracy is lost, and we can only see the outlines of the test chart.


Accessories and Warranty - Meager box contents
Apple limits the box contents of the iPad Air to the minimum. In addition to the iPad, the box only includes a 1-meter (~3 ft) fabric-wrapped USB-C cable and a few leaflets with info material.
In addition to protective covers, chargers, and charging cables, Apple also offers the optional Apple Pencil Pro (MSRP 149 Euros, $129 in the US) for its tablet. Like the Apple Pencil (USB-C), which is also compatible with our test unit and much more affordable at 89 Euros ($79 in the US), it can also be magnetically attached to the tablet. The Apple Magic Keyboard also costs extra, with the manufacturer asking a hefty 399 Euros ($299 in the US) for it.
Apple offers a 12-month warranty on the iPad Air 13 (2024), but this doesn't affect the manufacturer warranty required by law (in Germany).
You can expand the manufacturer warranty with the AppleCare+ insurance package that lasts for two years and costs 5.49 Euros a month ($3.99 in the US) or a one-time fee of 109 Euros ($79 in the US). During this time, AppleCare+ covers unlimited instances of accidental damage, although you have to pay a 29 Euro service fee ($29 in the US) for each instance.
Input Devices and Operation - Fingerprint sensor but no Face ID
The large 13-inch IPS panel implements inputs very accurately and without any noticeable delays. But with its low refresh rate of 60 Hz, the iPad Air 13 (2024) doesn't display animations and scroll movements as smoothly as an iPad Pro or competitors such as the Samsung Galaxy Tab S9+. In addition to finger input, you can also use your pen for input. To do this, you can either use an Apple Pencil (USB-C) or an Apple Pencil Pro, which offers an additional pressure sensor.
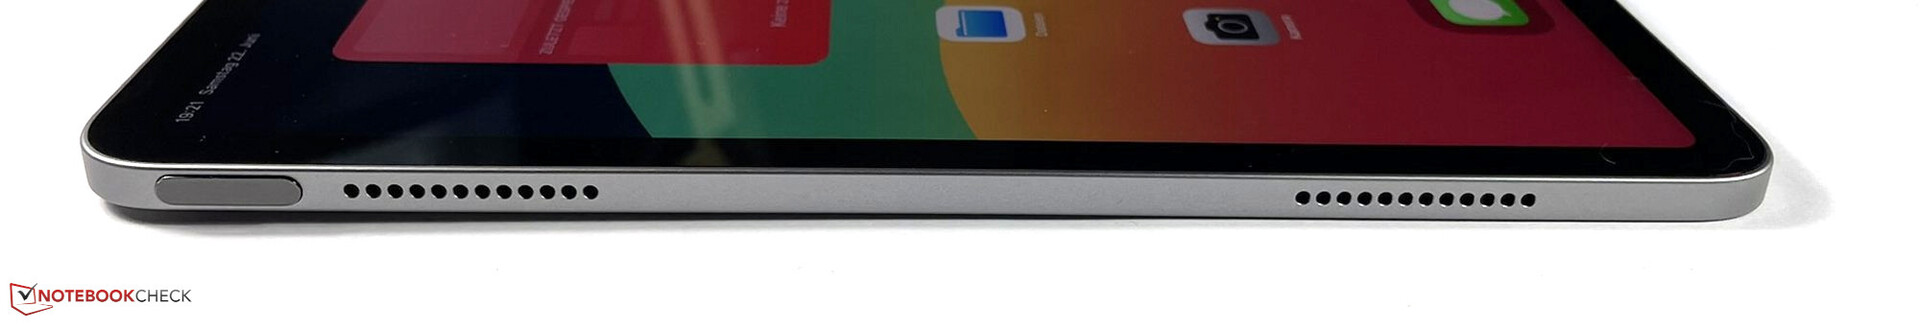
The Touch ID fingerprint sensor that is integrated into the Power key works flawlessly, unlocking the iPad Air 13 (2024) quickly. But it only runs passively, so you have to press it twice when the screen is turned off: the first time to turn on the screen and the second time for authentication.
Since the large size of the tablet makes the power key hard to reach at times, face recognition would be a very useful feature for the Apple tablet. However, the iPad Air continues to lack Face ID, because biometric face recognition remains reserved to the iPad Pro models.
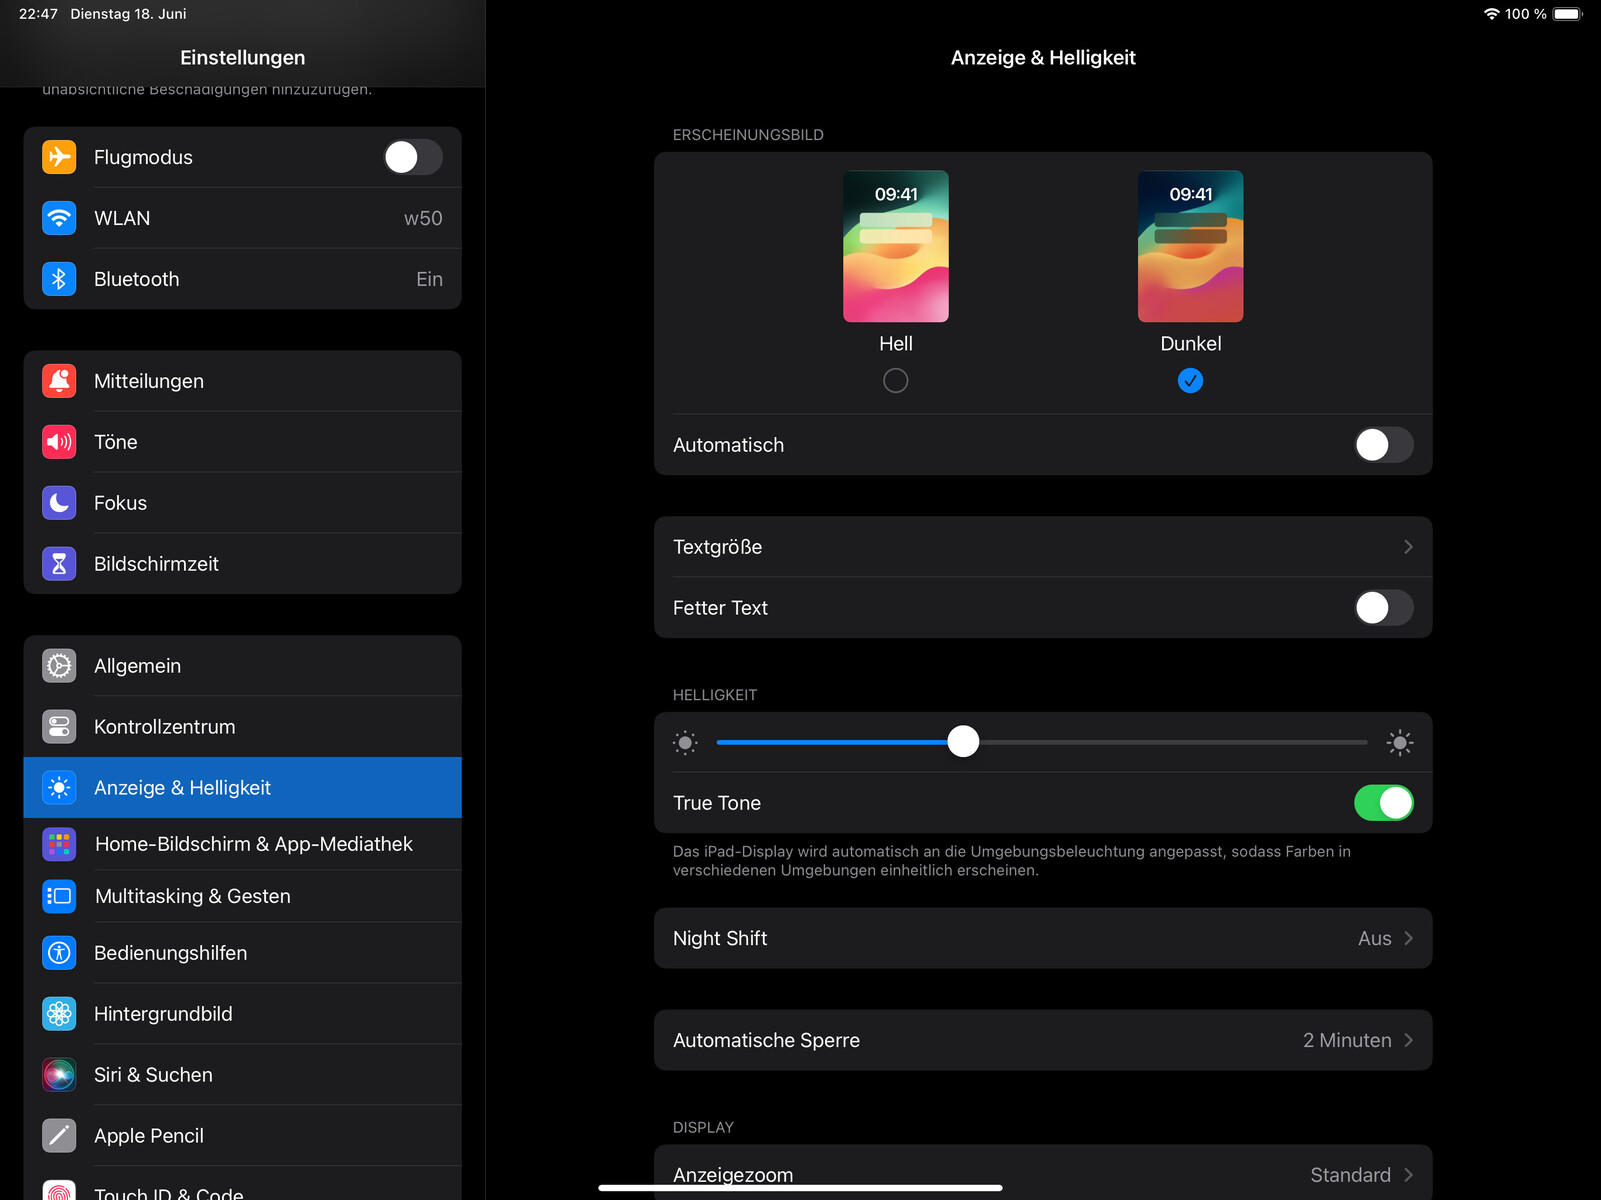
Display - IPS panel without PWM
The 13-inch IPS panel of the iPad Air 13 (2024) has a resolution of 2732x2048 pixels, which corresponds to a 4:3 image format. Not only does it have the larger display compared to the iPad Air 11 (2024), but it is also slightly brighter. Although the difference isn't very large - according to the specs it offers 600 compared to 500 Nits – in our test, the iPad Air 13 (2024) delivers what it promised.
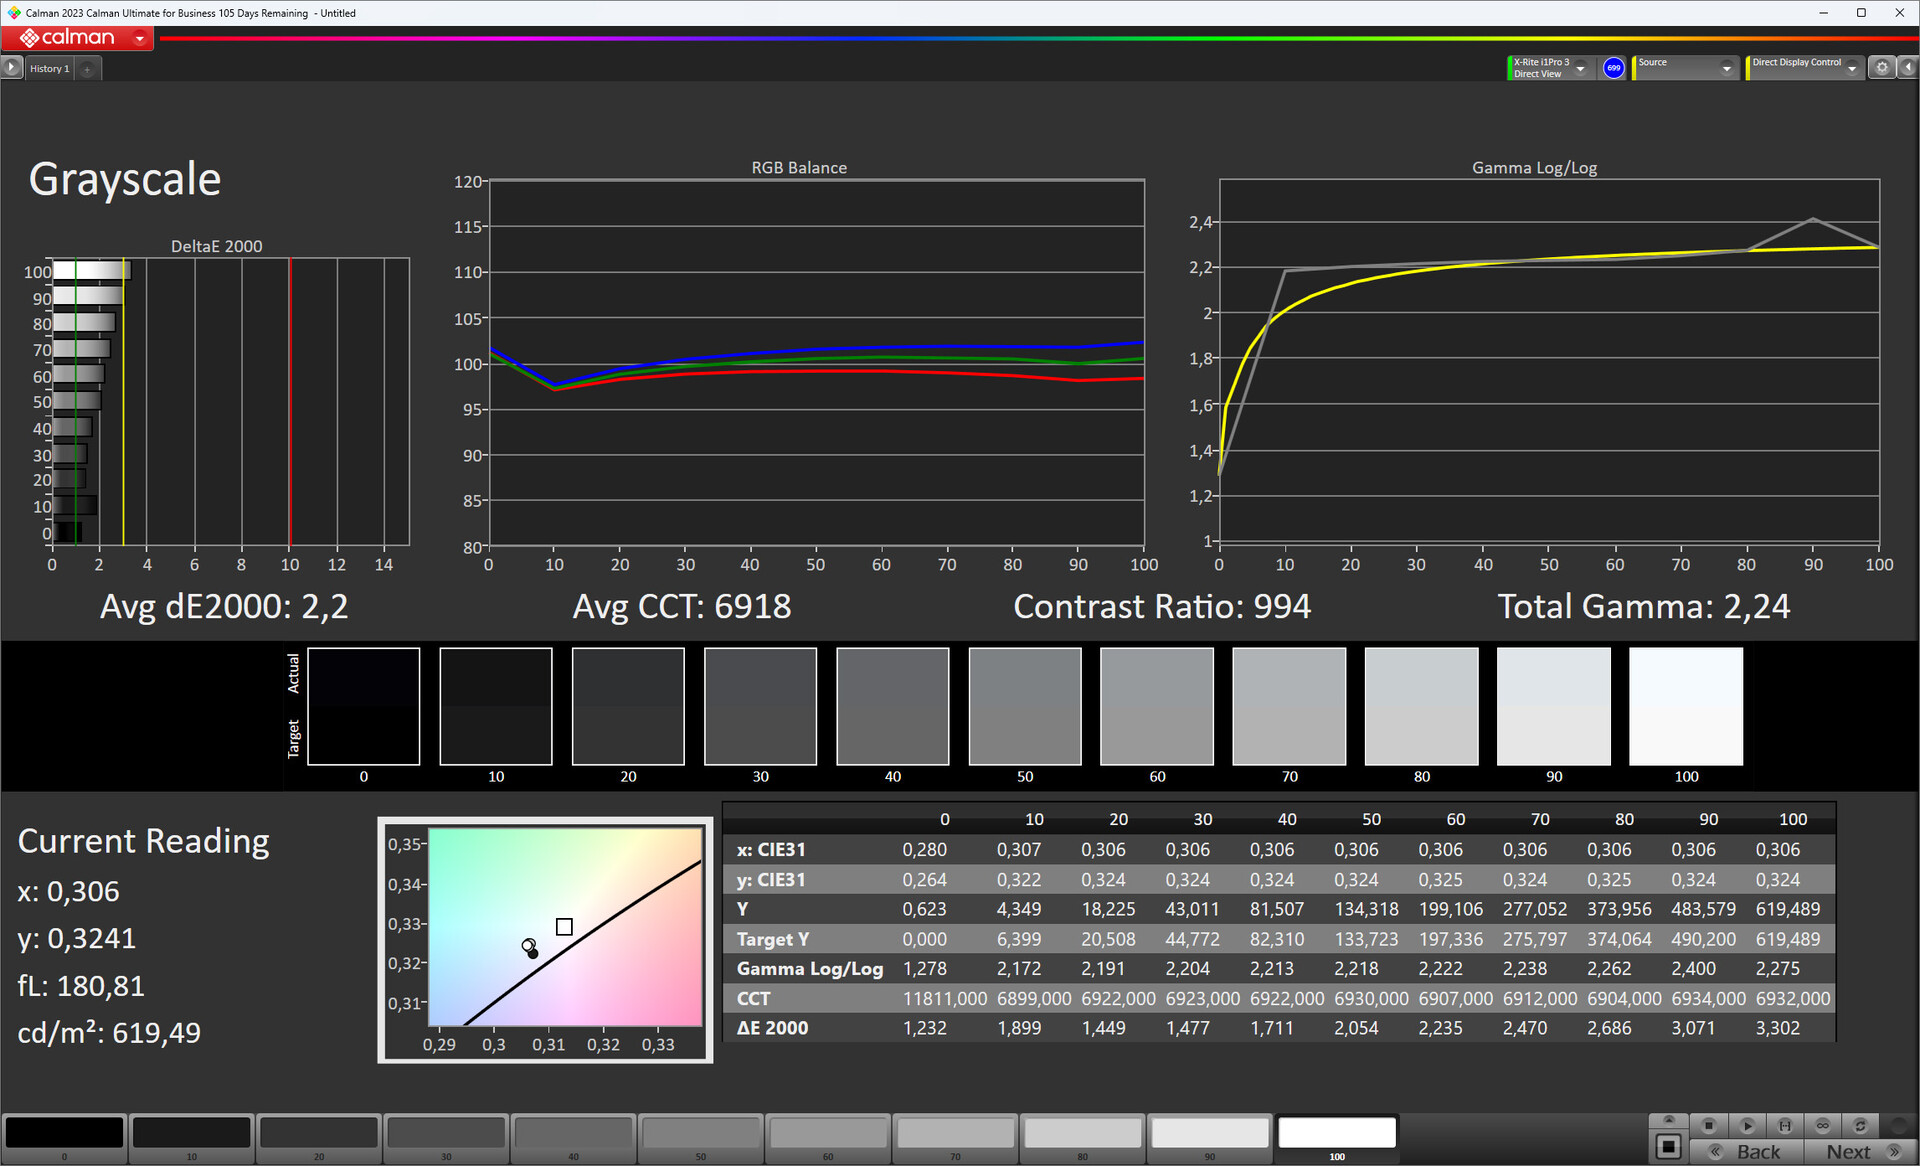
With a white background, the display offers a brightness of 589.4 cd/m² on average, which increases up to 631 cd/m² with an even distribution of light and dark image areas (APL18). With this, the IPS panel isn't able to reach "real" HDR, since that would require a four-digit brightness level, like with the Apple iPad Pro 11 (2024), for example. Nonetheless, in addition to HDR10, the IPS-Panel also supports Dolby Vision. The lowest brightness level still produces 2.13 cd/m².
The IPS panel does without using pulse-width modulation (PWM) to adjust the brightness. This makes the Apple tablet also very suitable for users that are sensitive to PWM flickering.
| |||||||||||||||||||||||||
Brightness Distribution: 88 %
Center on Battery: 631 cd/m²
Contrast: 1018:1 (Black: 0.62 cd/m²)
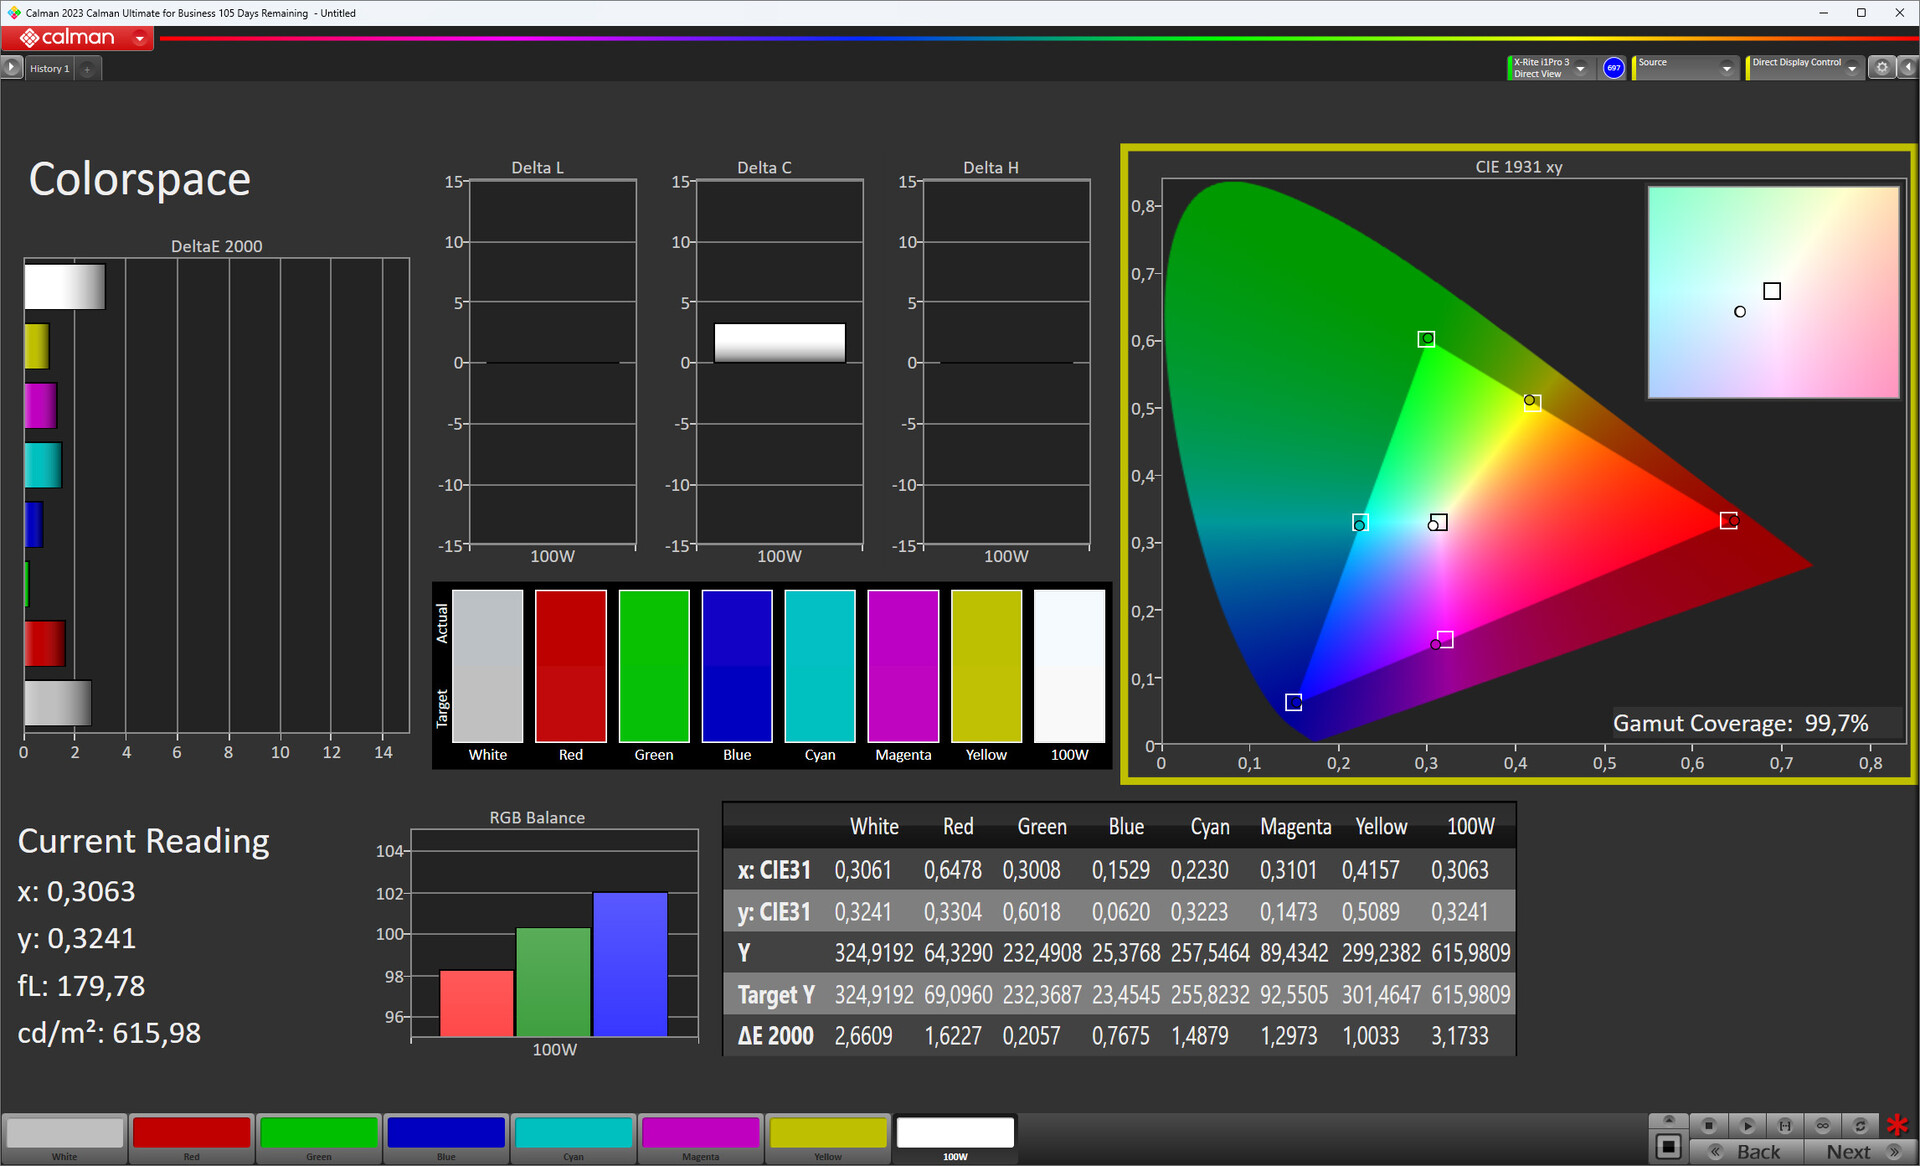
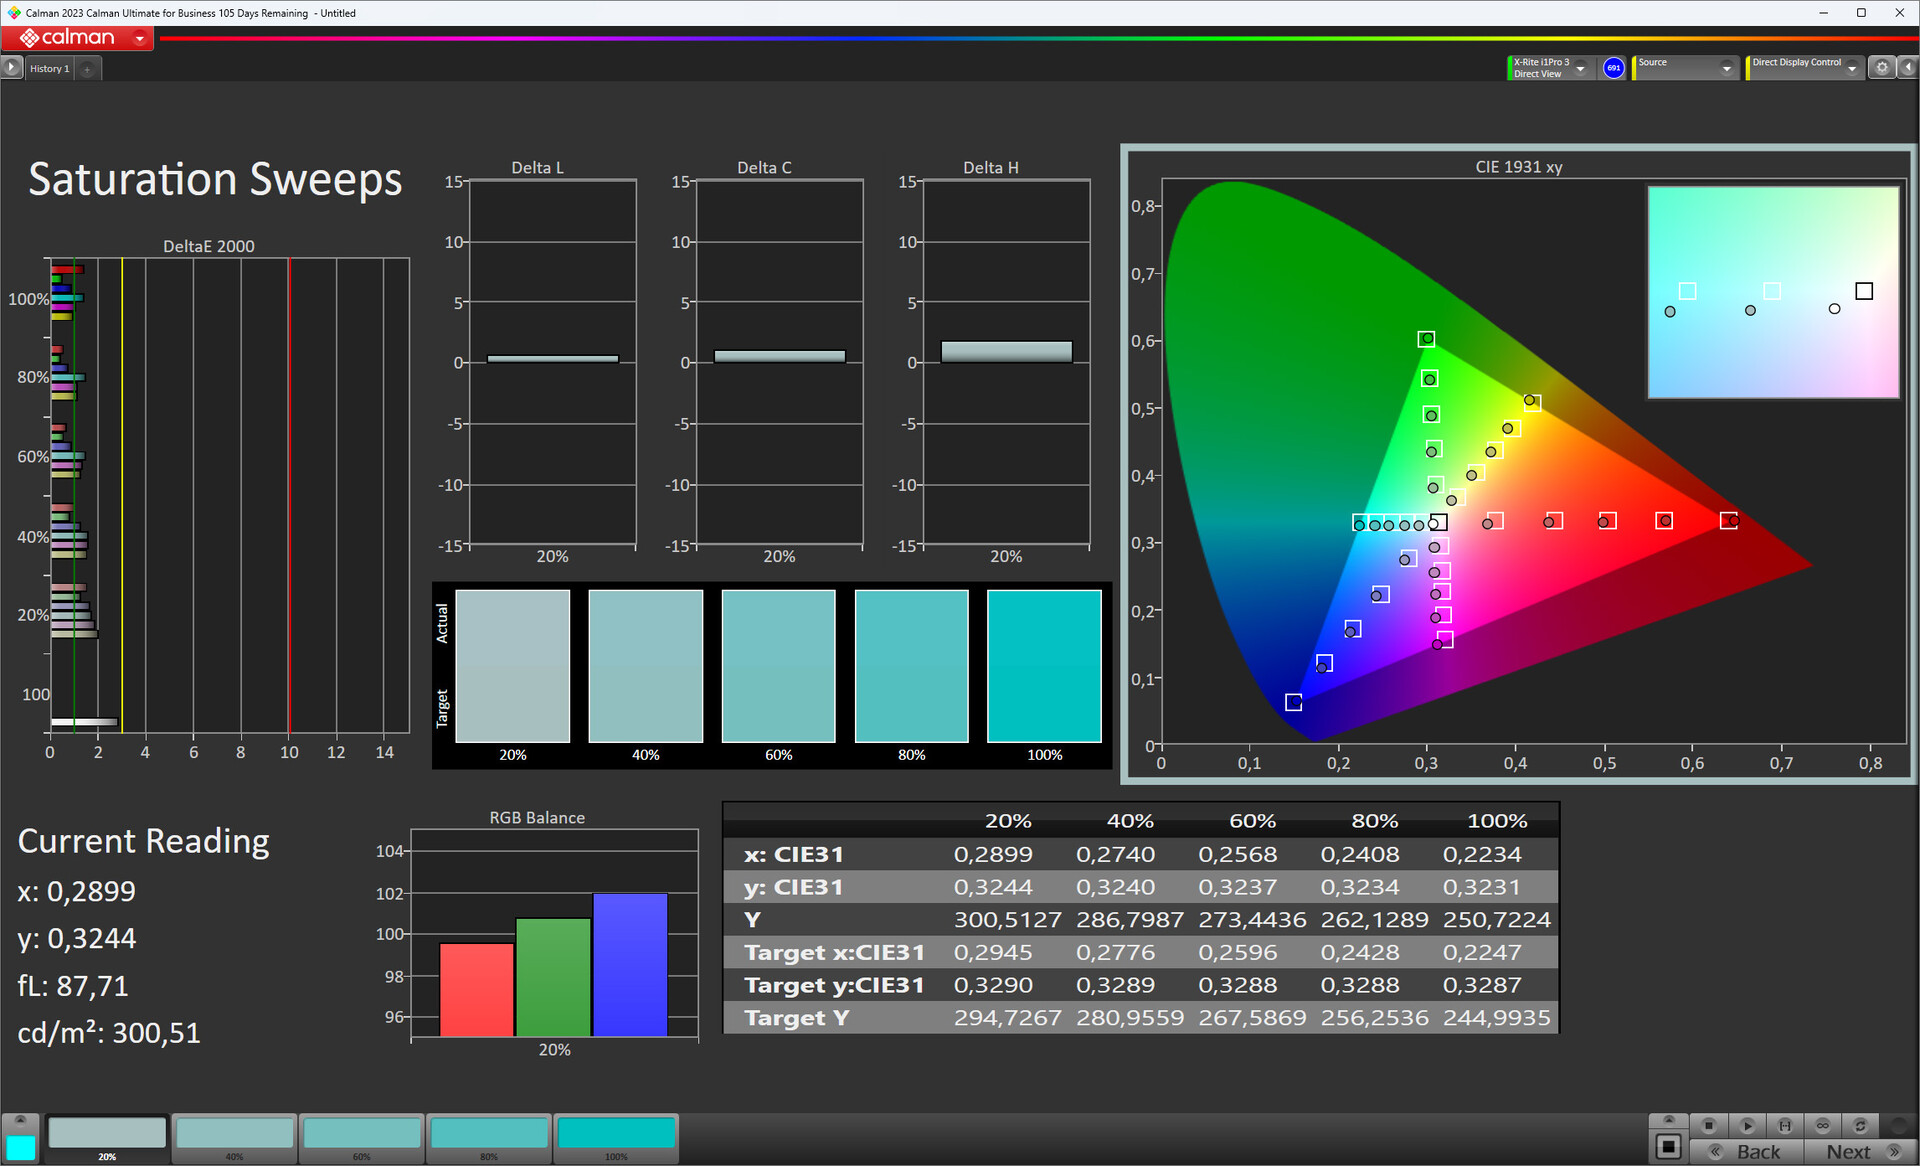
ΔE Color 1.5 | 0.5-29.43 Ø4.99
ΔE Greyscale 2.2 | 0.57-98 Ø5.2
99.7% sRGB (Calman 2D)
Gamma: 2.24
| Apple iPad Air 13 2024 IPS, 2732x2048, 13.00 | Apple iPad Air 5 2022 IPS, 2360x1640, 10.90 | Apple iPad Air 6 2024 IPS, 2360x1640, 10.86 | Apple iPad Pro 11 2024 OLED, 2420x1668, 11.00 | Samsung Galaxy Tab S9+ AMOLED, 2800x1752, 12.40 | Xiaomi Pad 6S Pro IPS, 3048x2032, 12.40 | |
|---|---|---|---|---|---|---|
| Screen | 10% | 1% | 41% | -23% | -3% | |
| Brightness middle | 631 | 529 -16% | 506 -20% | 1005 59% | 574 -9% | 867 37% |
| Brightness | 589 | 490 -17% | 474 -20% | 1004 70% | 551 -6% | 810 38% |
| Brightness Distribution | 88 | 86 -2% | 87 -1% | 99 13% | 89 1% | 87 -1% |
| Black Level * | 0.62 | 0.37 40% | 0.4 35% | 0.58 6% | ||
| Contrast | 1018 | 1430 40% | 1265 24% | 1495 47% | ||
| Colorchecker dE 2000 * | 1.5 | 1.35 10% | 1.48 1% | 0.92 39% | 2.01 -34% | 2 -33% |
| Colorchecker dE 2000 max. * | 3 | 2.45 18% | 3.12 -4% | 2 33% | 4.93 -64% | 5.5 -83% |
| Greyscale dE 2000 * | 2.2 | 2.1 5% | 2.3 -5% | 1.5 32% | 2.8 -27% | 3 -36% |
| Gamma | 2.24 98% | 2.183 101% | 2.204 100% | 2.224 99% | 2.066 106% | 2.29 96% |
| CCT | 6918 94% | 6939 94% | 6954 93% | 6604 98% | 6566 99% | 6957 93% |
* ... smaller is better
Screen Flickering / PWM (Pulse-Width Modulation)
| Screen flickering / PWM not detected | 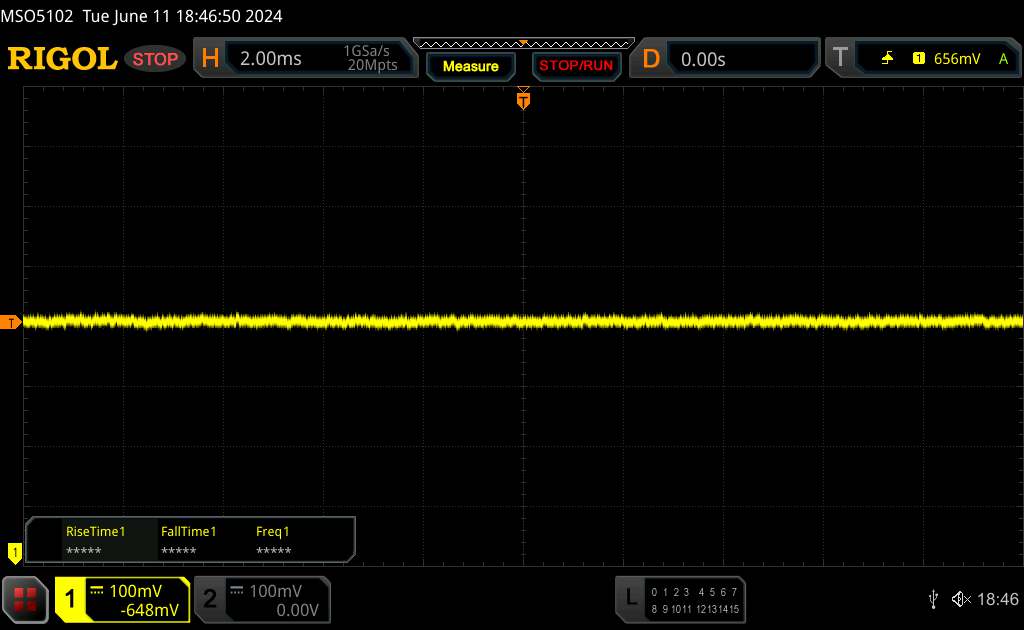 | ||
In comparison: 53 % of all tested devices do not use PWM to dim the display. If PWM was detected, an average of 17637 (minimum: 5 - maximum: 3846000) Hz was measured. | |||
The IPS panel adjusts its color temperature and brightness automatically to the current light conditions via True Tone. In order to prevent color deviations, we therefore have to deactivate this feature for our measurements with the Calman analysis software and photo spectrometer. Without True Tone, the IPS panel achieves a very good color reproduction where the deviations from the ideal target values cannot be recognized with the bare eyes anymore. However, the iPad Pro does even better in this area, also producing significantly more vibrant colors with its OLED panel.

Display Response Times
| ↔ Response Time Black to White | ||
|---|---|---|
| 35.21 ms ... rise ↗ and fall ↘ combined | ↗ 18.76 ms rise | 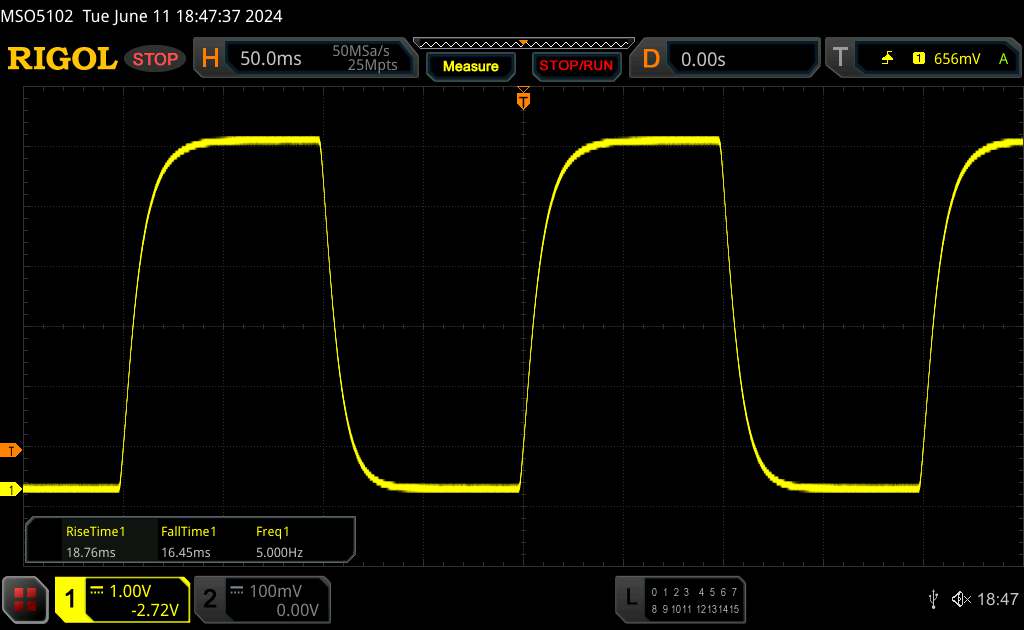 |
| ↘ 16.45 ms fall | ||
| The screen shows slow response rates in our tests and will be unsatisfactory for gamers. In comparison, all tested devices range from 0.1 (minimum) to 240 (maximum) ms. » 93 % of all devices are better. This means that the measured response time is worse than the average of all tested devices (21.3 ms). | ||
| ↔ Response Time 50% Grey to 80% Grey | ||
| 54.3 ms ... rise ↗ and fall ↘ combined | ↗ 25.04 ms rise | 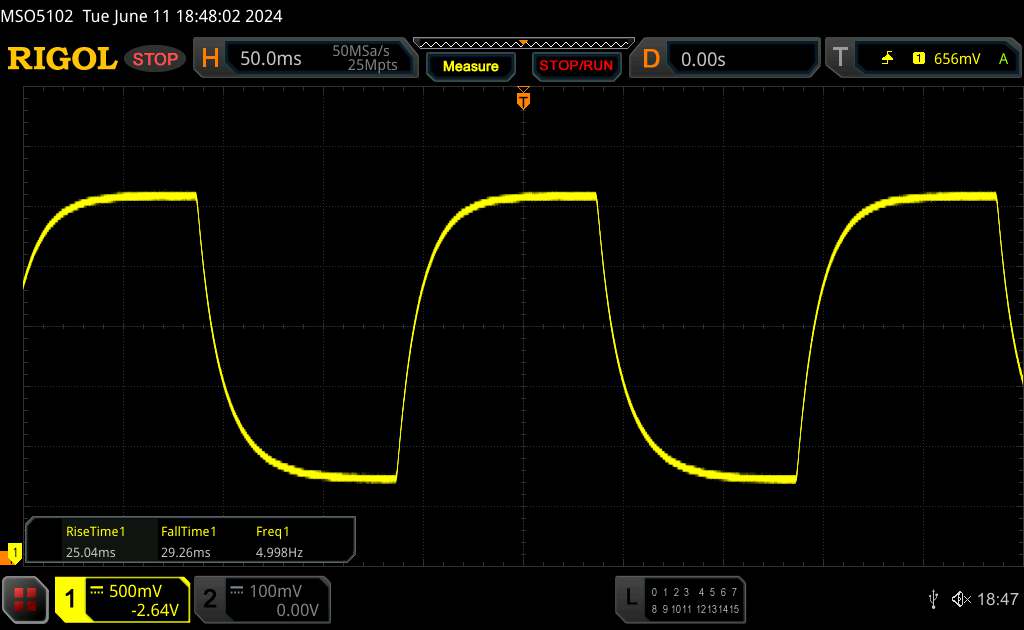 |
| ↘ 29.26 ms fall | ||
| The screen shows slow response rates in our tests and will be unsatisfactory for gamers. In comparison, all tested devices range from 0.2 (minimum) to 636 (maximum) ms. » 90 % of all devices are better. This means that the measured response time is worse than the average of all tested devices (33.5 ms). | ||
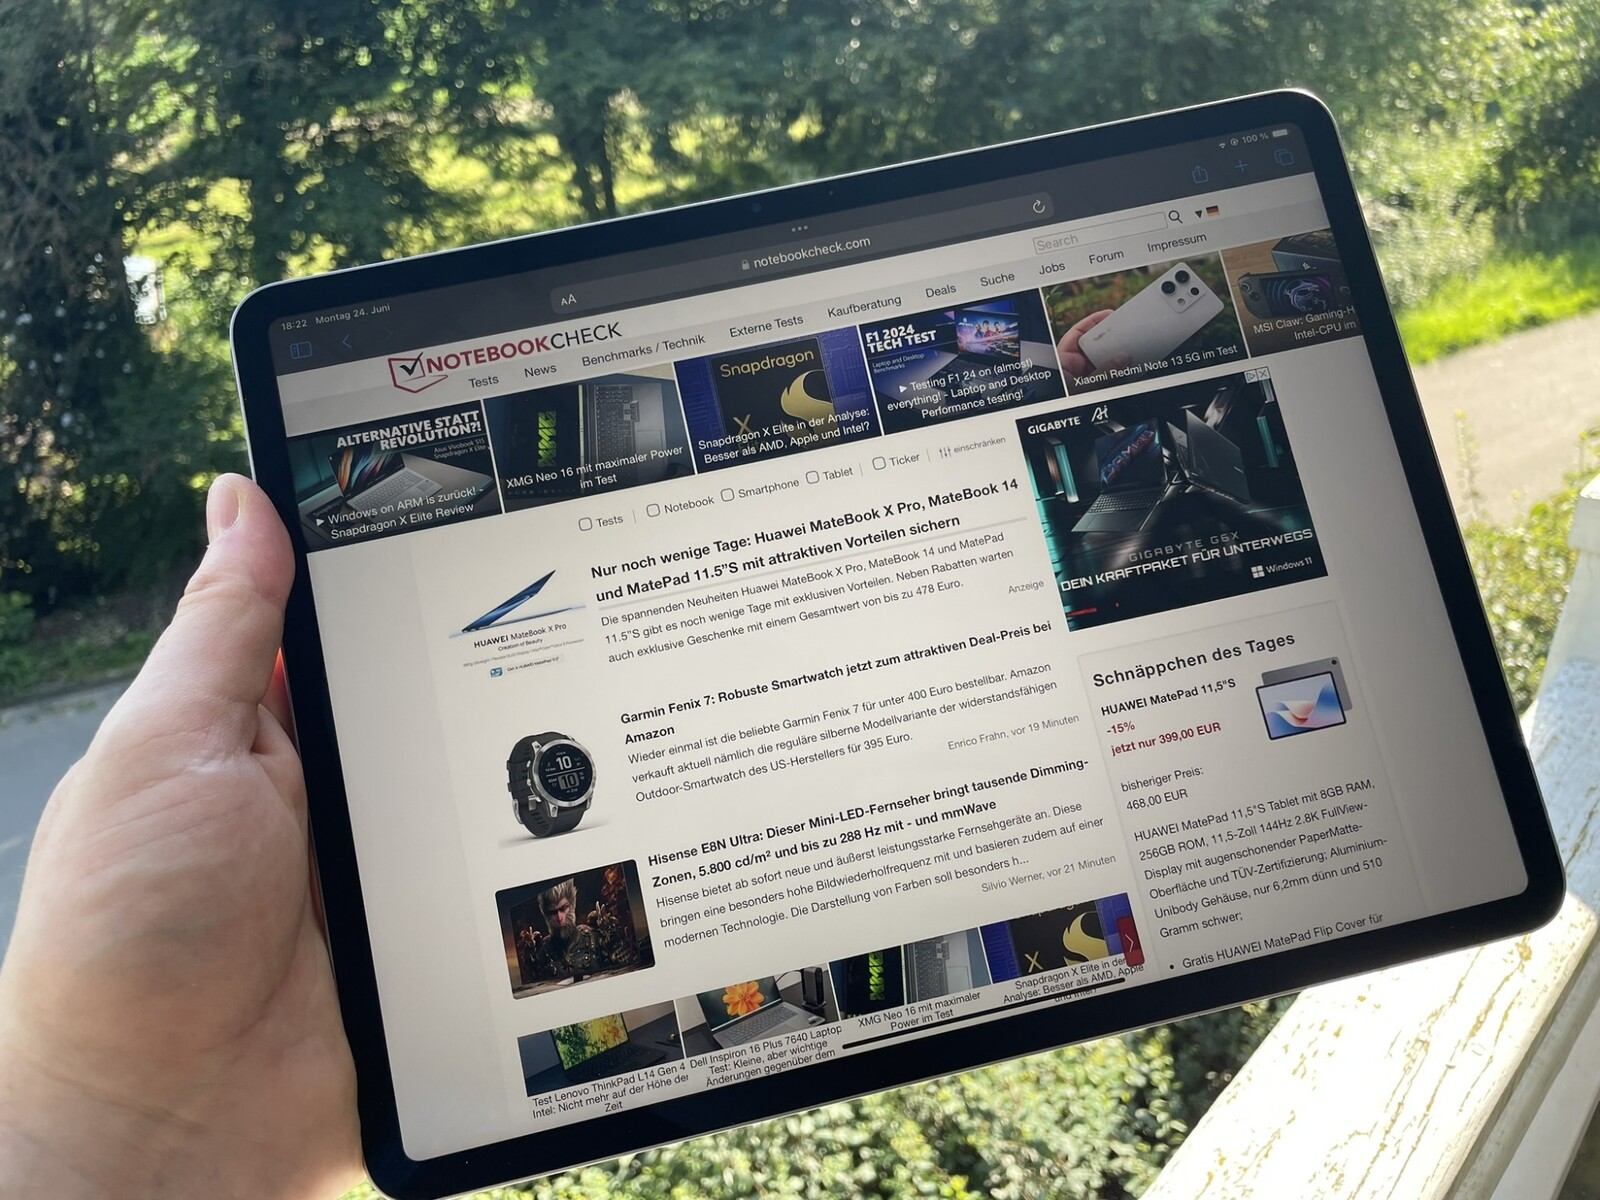
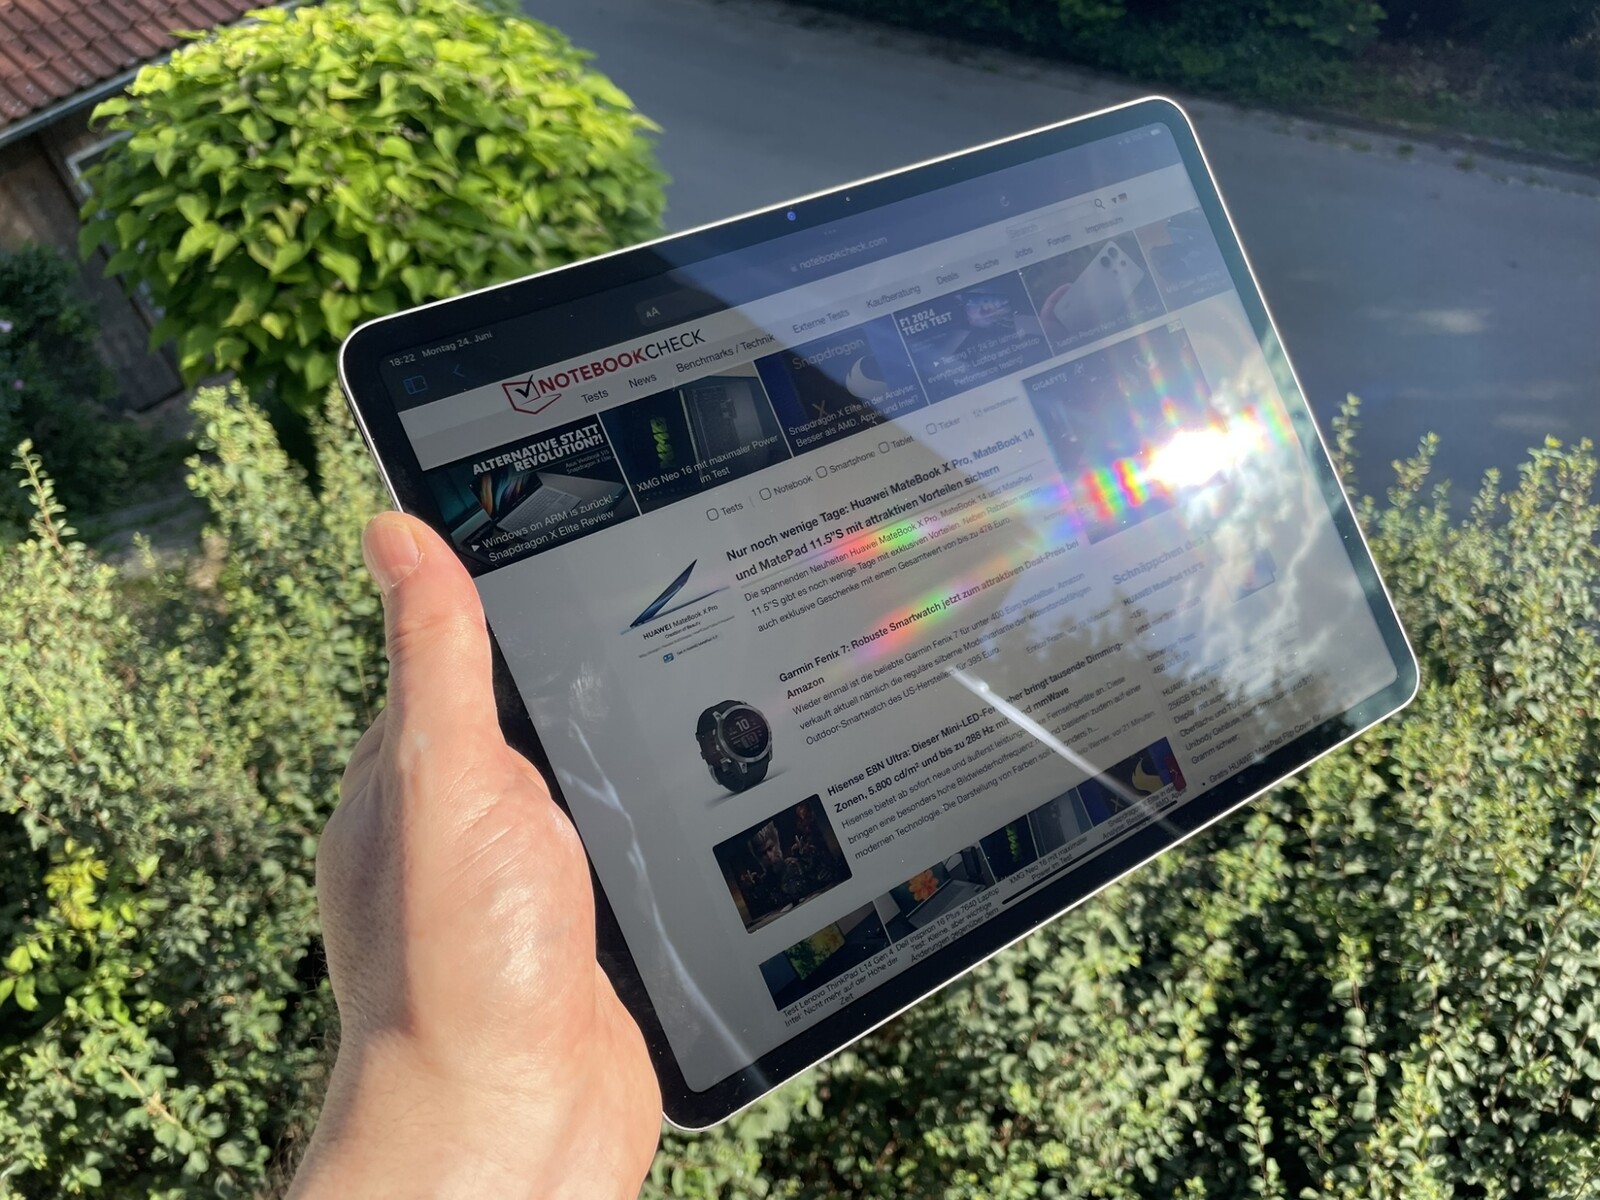
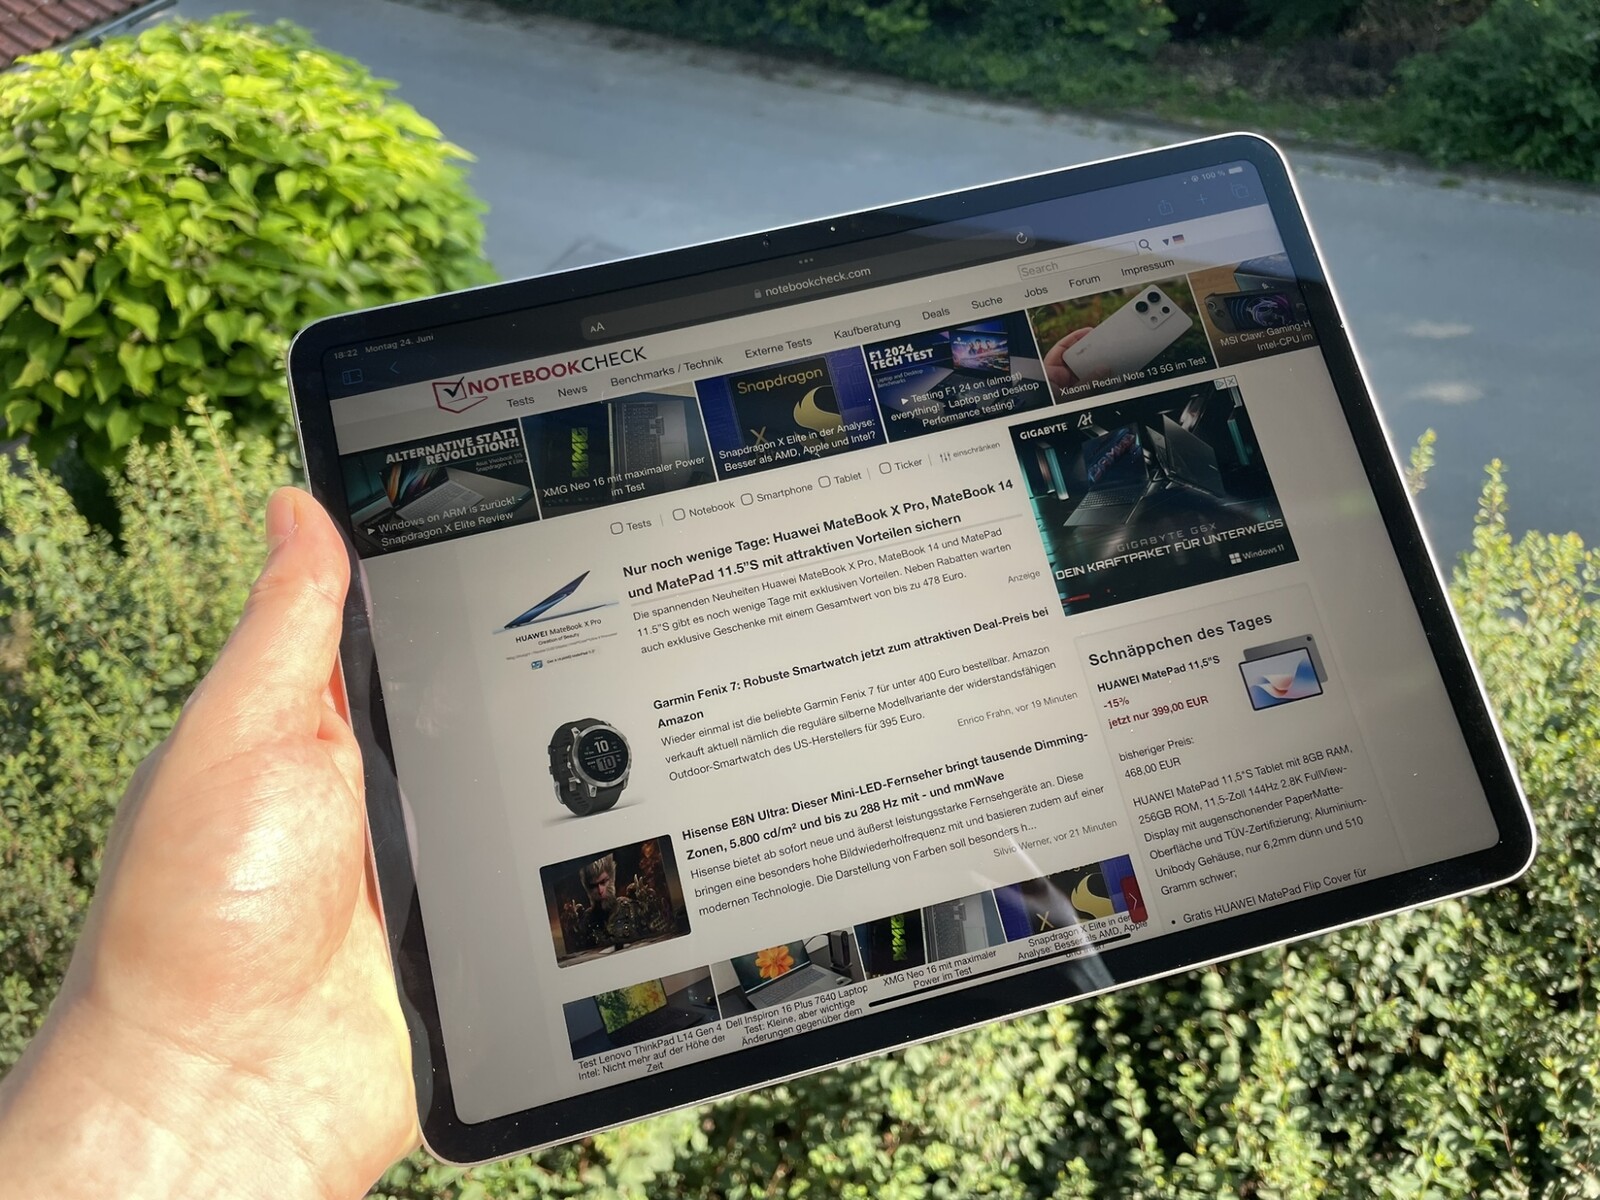
Due to the anti-reflective coating of its display, the iPad Air 13 (2024) does well outdoors and can also be used more flexibly with its higher brightness reserves than the iPad Air 11 (2024). But when the sun shines directly on the screen, even the brightness of the 13-inch tablet is hardly sufficient to outshine the reflections on the display surface.

Performance - iPad Air 13 (2024) with Apple M2
The CPU performance of the iPad Air 13 (2024) offers abundant reserves, since it has inherited the Apple M2 from the iPad Pro 11 (2022). Compared to the Apple M1 that was used in the predecessor, the M2 delivers a significantly higher performance and is one of the currently fastest mobile processors. Fired up by its brute performance, the iPad Air 13 (2024) effortlessly surpasses all the Android tablets and offers more than sufficient power for any usage scenario. But what is even faster is the Apple M4 that runs in the current iPad Pro generation.
| Geekbench ML - 0.6 Core ML Neural Engine | |
| Average of class Tablet (6978 - 9283, n=3, last 2 years) | |
| Average Apple M2 (6978 - 7586, n=2) | |
| Apple iPad Air 13 2024 | |
As far as GPU performance is concerned, the Apple tablets again compete for the first places amongst themselves. The iPad Air 13 (2024) again places after the iPad Pro, leaving the high-end competitors from the Android camp far behind, including the Samsung Galaxy Tab S9+ and Xiaomi Pad 6S Pro. Both are only ahead in some of the onscreen tests of GFXBench, but that's only because the Apple tablet is unable to display more than 60 frames per second.
GFXBench (DX / GLBenchmark) 2.7: T-Rex Onscreen | 1920x1080 T-Rex Offscreen
GFXBench 3.0: on screen Manhattan Onscreen OGL | 1920x1080 1080p Manhattan Offscreen
GFXBench 3.1: on screen Manhattan ES 3.1 Onscreen | 1920x1080 Manhattan ES 3.1 Offscreen
GFXBench: on screen Car Chase Onscreen | 1920x1080 Car Chase Offscreen | on screen Aztec Ruins High Tier Onscreen | 2560x1440 Aztec Ruins High Tier Offscreen | on screen Aztec Ruins Normal Tier Onscreen | 1920x1080 Aztec Ruins Normal Tier Offscreen | 3840x2160 4K Aztec Ruins High Tier Offscreen
| 3DMark / Wild Life Extreme Unlimited | |
| Apple iPad Pro 11 2024 | |
| Apple iPad Air 13 2024 | |
| Apple iPad Air 6 2024 | |
| Apple iPad Air 5 2022 | |
| Samsung Galaxy Tab S9+ | |
| Xiaomi Pad 6S Pro | |
| 3DMark / Wild Life Extreme | |
| Apple iPad Pro 11 2024 | |
| Apple iPad Air 13 2024 | |
| Apple iPad Air 6 2024 | |
| Apple iPad Air 5 2022 | |
| Samsung Galaxy Tab S9+ | |
| Xiaomi Pad 6S Pro | |
| 3DMark / Wild Life Unlimited Score | |
| Apple iPad Pro 11 2024 | |
| Apple iPad Air 13 2024 | |
| Apple iPad Air 6 2024 | |
| Apple iPad Air 5 2022 | |
| Xiaomi Pad 6S Pro | |
| 3DMark / Solar Bay Unlimited Score | |
| Apple iPad Pro 11 2024 | |
| Apple iPad Air 6 2024 | |
| Apple iPad Air 13 2024 | |
| Samsung Galaxy Tab S9+ | |
| Xiaomi Pad 6S Pro | |
| 3DMark / Solar Bay Score | |
| Apple iPad Pro 11 2024 | |
| Apple iPad Air 13 2024 | |
| Apple iPad Air 6 2024 | |
| Samsung Galaxy Tab S9+ | |
| Xiaomi Pad 6S Pro | |
| GFXBench (DX / GLBenchmark) 2.7 / T-Rex Onscreen | |
| Xiaomi Pad 6S Pro | |
| Samsung Galaxy Tab S9+ | |
| Apple iPad Air 5 2022 | |
| Apple iPad Pro 11 2024 | |
| Apple iPad Air 6 2024 | |
| Apple iPad Air 13 2024 | |
| GFXBench (DX / GLBenchmark) 2.7 / T-Rex Offscreen | |
| Apple iPad Air 13 2024 | |
| Apple iPad Pro 11 2024 | |
| Apple iPad Air 6 2024 | |
| Apple iPad Air 5 2022 | |
| Samsung Galaxy Tab S9+ | |
| Xiaomi Pad 6S Pro | |
| GFXBench 3.0 / Manhattan Onscreen OGL | |
| Xiaomi Pad 6S Pro | |
| Apple iPad Pro 11 2024 | |
| Samsung Galaxy Tab S9+ | |
| Apple iPad Air 5 2022 | |
| Apple iPad Air 6 2024 | |
| Apple iPad Air 13 2024 | |
| GFXBench 3.0 / 1080p Manhattan Offscreen | |
| Apple iPad Air 13 2024 | |
| Apple iPad Pro 11 2024 | |
| Apple iPad Air 6 2024 | |
| Samsung Galaxy Tab S9+ | |
| Apple iPad Air 5 2022 | |
| Xiaomi Pad 6S Pro | |
| GFXBench 3.1 / Manhattan ES 3.1 Onscreen | |
| Apple iPad Pro 11 2024 | |
| Samsung Galaxy Tab S9+ | |
| Xiaomi Pad 6S Pro | |
| Apple iPad Air 5 2022 | |
| Apple iPad Air 6 2024 | |
| Apple iPad Air 13 2024 | |
| GFXBench 3.1 / Manhattan ES 3.1 Offscreen | |
| Apple iPad Pro 11 2024 | |
| Apple iPad Air 13 2024 | |
| Apple iPad Air 6 2024 | |
| Apple iPad Air 5 2022 | |
| Samsung Galaxy Tab S9+ | |
| Xiaomi Pad 6S Pro | |
| GFXBench / Car Chase Onscreen | |
| Apple iPad Pro 11 2024 | |
| Samsung Galaxy Tab S9+ | |
| Apple iPad Air 5 2022 | |
| Apple iPad Air 6 2024 | |
| Apple iPad Air 13 2024 | |
| Xiaomi Pad 6S Pro | |
| GFXBench / Car Chase Offscreen | |
| Apple iPad Pro 11 2024 | |
| Apple iPad Air 13 2024 | |
| Apple iPad Air 6 2024 | |
| Apple iPad Air 5 2022 | |
| Samsung Galaxy Tab S9+ | |
| Xiaomi Pad 6S Pro | |
| GFXBench / Aztec Ruins High Tier Onscreen | |
| Apple iPad Pro 11 2024 | |
| Apple iPad Air 5 2022 | |
| Apple iPad Air 6 2024 | |
| Apple iPad Air 13 2024 | |
| Samsung Galaxy Tab S9+ | |
| Xiaomi Pad 6S Pro | |
| GFXBench / Aztec Ruins High Tier Offscreen | |
| Apple iPad Pro 11 2024 | |
| Apple iPad Air 13 2024 | |
| Apple iPad Air 6 2024 | |
| Samsung Galaxy Tab S9+ | |
| Apple iPad Air 5 2022 | |
| Xiaomi Pad 6S Pro | |
| GFXBench / Aztec Ruins Normal Tier Onscreen | |
| Apple iPad Pro 11 2024 | |
| Samsung Galaxy Tab S9+ | |
| Apple iPad Air 5 2022 | |
| Apple iPad Air 6 2024 | |
| Apple iPad Air 13 2024 | |
| Xiaomi Pad 6S Pro | |
| GFXBench / Aztec Ruins Normal Tier Offscreen | |
| Apple iPad Pro 11 2024 | |
| Apple iPad Air 13 2024 | |
| Apple iPad Air 6 2024 | |
| Samsung Galaxy Tab S9+ | |
| Apple iPad Air 5 2022 | |
| Xiaomi Pad 6S Pro | |
| GFXBench / 4K Aztec Ruins High Tier Offscreen | |
| Apple iPad Pro 11 2024 | |
| Apple iPad Air 13 2024 | |
| Apple iPad Air 6 2024 | |
| Samsung Galaxy Tab S9+ | |
| Xiaomi Pad 6S Pro | |
The iPad Air 13 (2024) renders websites very quickly, which is no surprise considering the performance capabilities of the Apple M2 SoC. In the browser benchmarks, the tablet finishes significantly ahead of the Android competitors.
| Jetstream 2 - Total Score | |
| Apple iPad Pro 11 2024 (Safari 17) | |
| Apple iPad Air 6 2024 (Safari 17) | |
| Apple iPad Air 13 2024 (Safari 17) | |
| Average Apple M2 (220 - 257, n=9) | |
| Samsung Galaxy Tab S9+ (Chrome 117) | |
| Apple iPad Air 5 2022 (Safari 15) | |
| Xiaomi Pad 6S Pro (Chrome 125.0.6422.52) | |
| Average of class Tablet (19.9 - 334, n=69, last 2 years) | |
| WebXPRT 4 - Overall | |
| Apple iPad Air 13 2024 (Safari 17) | |
| Apple iPad Air 6 2024 | |
| Average Apple M2 (223 - 256, n=8) | |
| Samsung Galaxy Tab S9+ (Chrome 117) | |
| Xiaomi Pad 6S Pro (Chrome 125.0.6422.52) | |
| Average of class Tablet (21 - 315, n=67, last 2 years) | |
| WebXPRT 3 - Overall | |
| Apple iPad Pro 11 2024 (Safari 17) | |
| Average Apple M2 (342 - 387, n=8) | |
| Apple iPad Air 13 2024 (Safari 17) | |
| Apple iPad Air 5 2022 (Safari 15) | |
| Samsung Galaxy Tab S9+ (Chrome 117) | |
| Xiaomi Pad 6S Pro (Chrome 125.0.6422.52) | |
| Average of class Tablet (34 - 435, n=51, last 2 years) | |
| Speedometer 2.0 - Result | |
| Apple iPad Pro 11 2024 (Safari 17) | |
| Apple iPad Air 13 2024 (Safari 17) | |
| Apple iPad Air 6 2024 (Safari 17) | |
| Apple iPad Air 6 2024 | |
| Average Apple M2 (437 - 445, n=10) | |
| Apple iPad Air 5 2022 (Safari 15) | |
| Xiaomi Pad 6S Pro (Chrome 125.0.6422.52) | |
| Samsung Galaxy Tab S9+ (Chrome 117) | |
| Average of class Tablet (48 - 572, n=63, last 2 years) | |
| Octane V2 - Total Score | |
| Apple iPad Pro 11 2024 (Safari 17) | |
| Apple iPad Air 13 2024 (Safari 17) | |
| Apple iPad Air 6 2024 (Safari 17) | |
| Average Apple M2 (72484 - 78736, n=9) | |
| Apple iPad Air 5 2022 (Safari 15) | |
| Samsung Galaxy Tab S9+ (Chrome 117) | |
| Xiaomi Pad 6S Pro (Chrome 125.0.6422.52) | |
| Average of class Tablet (2672 - 105178, n=84, last 2 years) | |
| Mozilla Kraken 1.1 - Total | |
| Average of class Tablet (319 - 34733, n=70, last 2 years) | |
| Samsung Galaxy Tab S9+ (Chrome 117) | |
| Xiaomi Pad 6S Pro (Chrome 125.0.6422.52) | |
| Apple iPad Air 5 2022 (Safari 15) | |
| Average Apple M2 (440 - 467, n=9) | |
| Apple iPad Air 6 2024 (Safari 17) | |
| Apple iPad Air 13 2024 (Safari 17) | |
| Apple iPad Pro 11 2024 (Safari 17) | |
* ... smaller is better
Games - A powerful gaming tablet
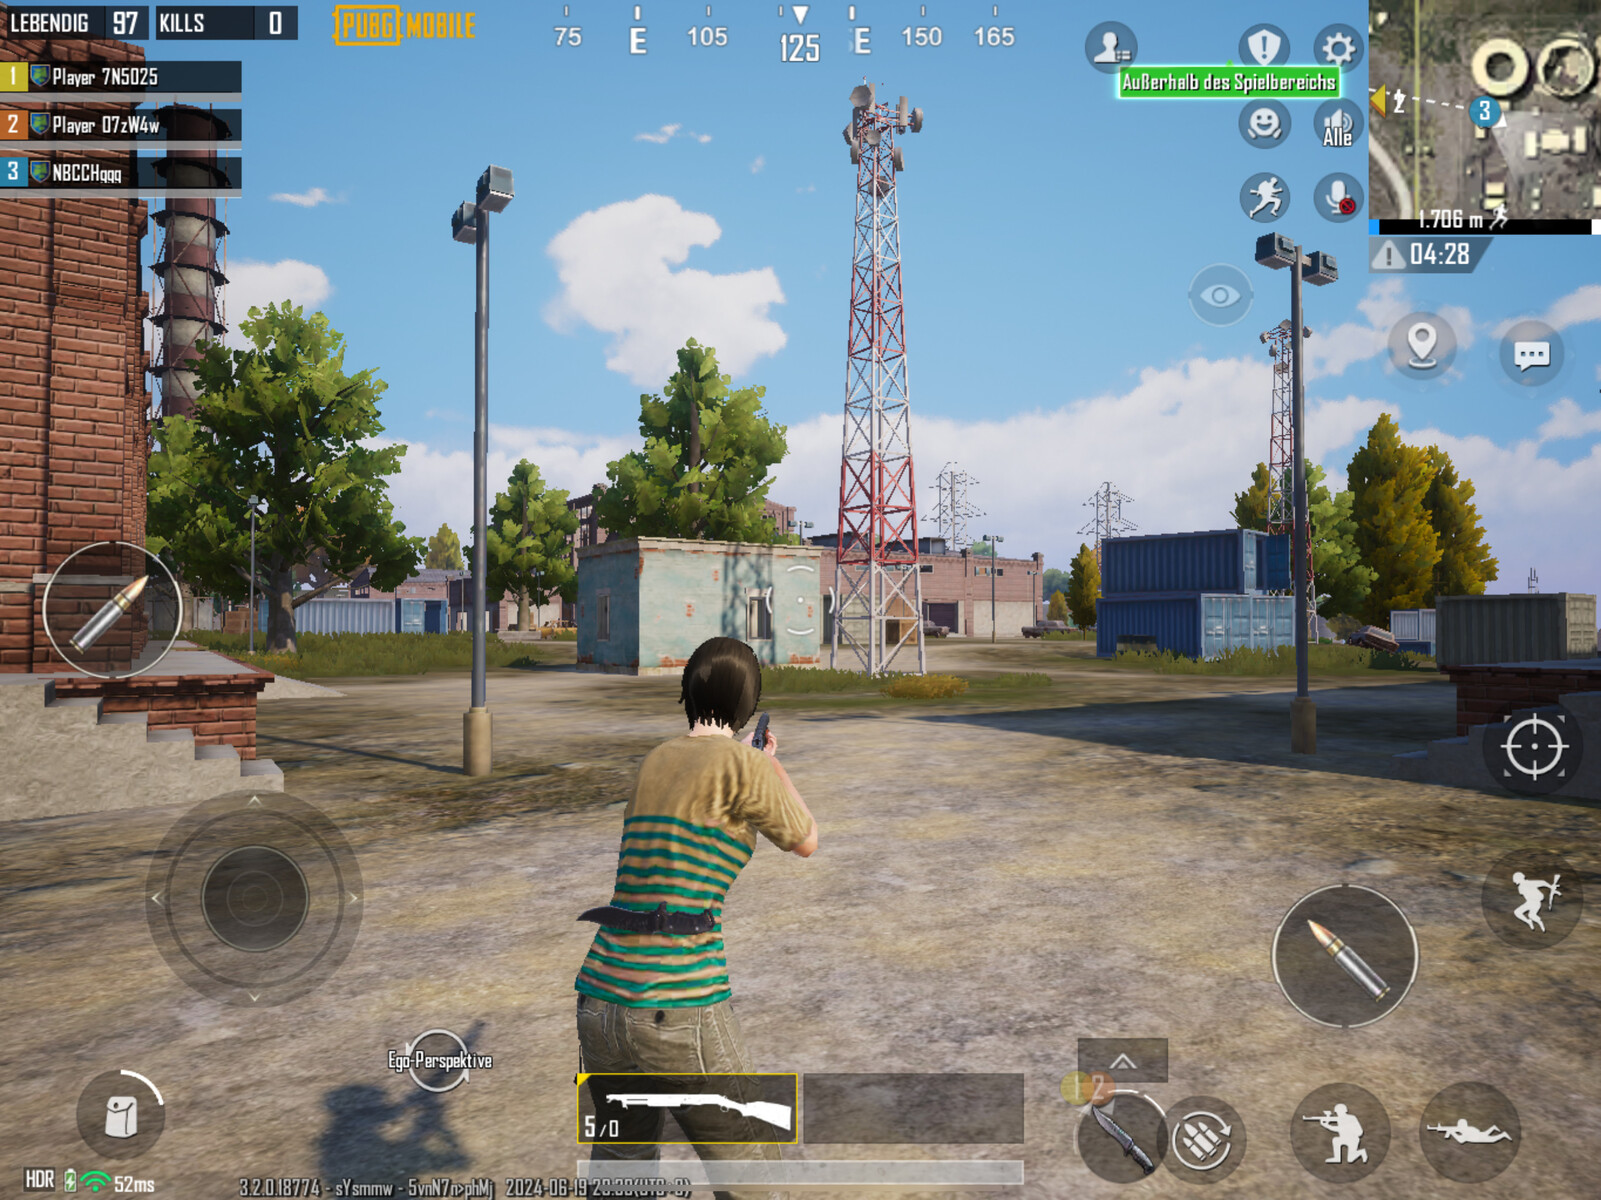
The iPad Air 13 (2024) is very well suited for gaming, and even graphically demanding games such as PUBG Mobile or Genshin Impact run absolutely smoothly at high detail settings. Currently there is probably no game in the App Store that can really push the tablet to the limits of its capabilities. We usually perform an additional evaluation of the gaming performance using our Gamebench test tool that measures actual frame rates, but this is currently not possible with iOS 17.5.

Emissions - Stereo speakers with a powerful sound
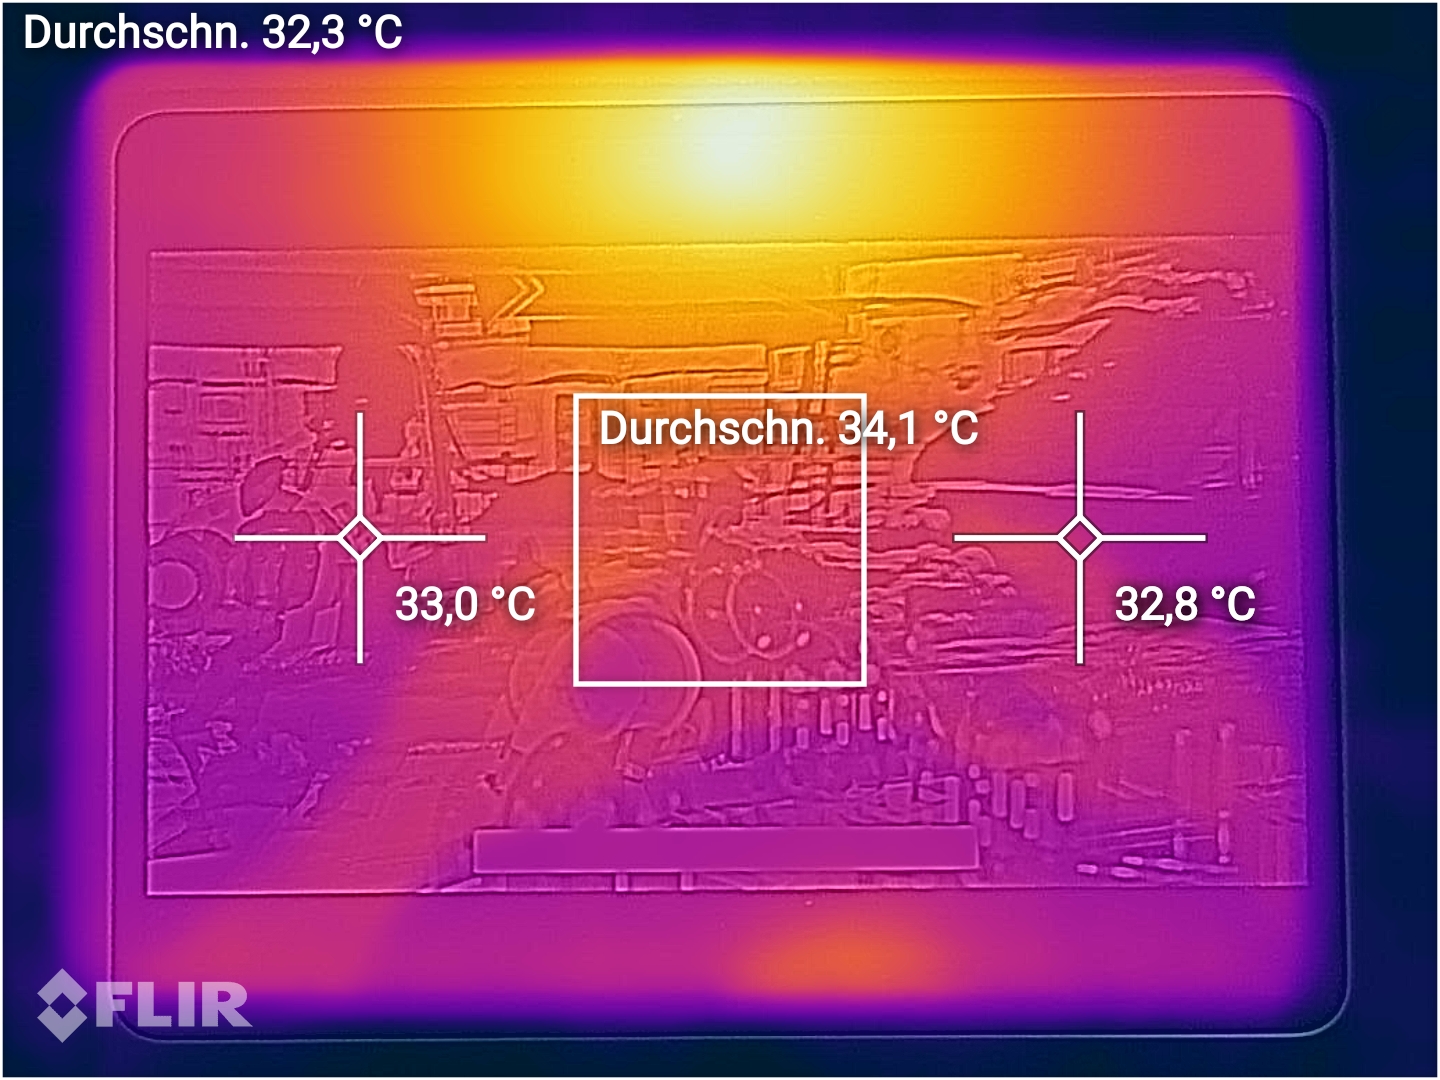
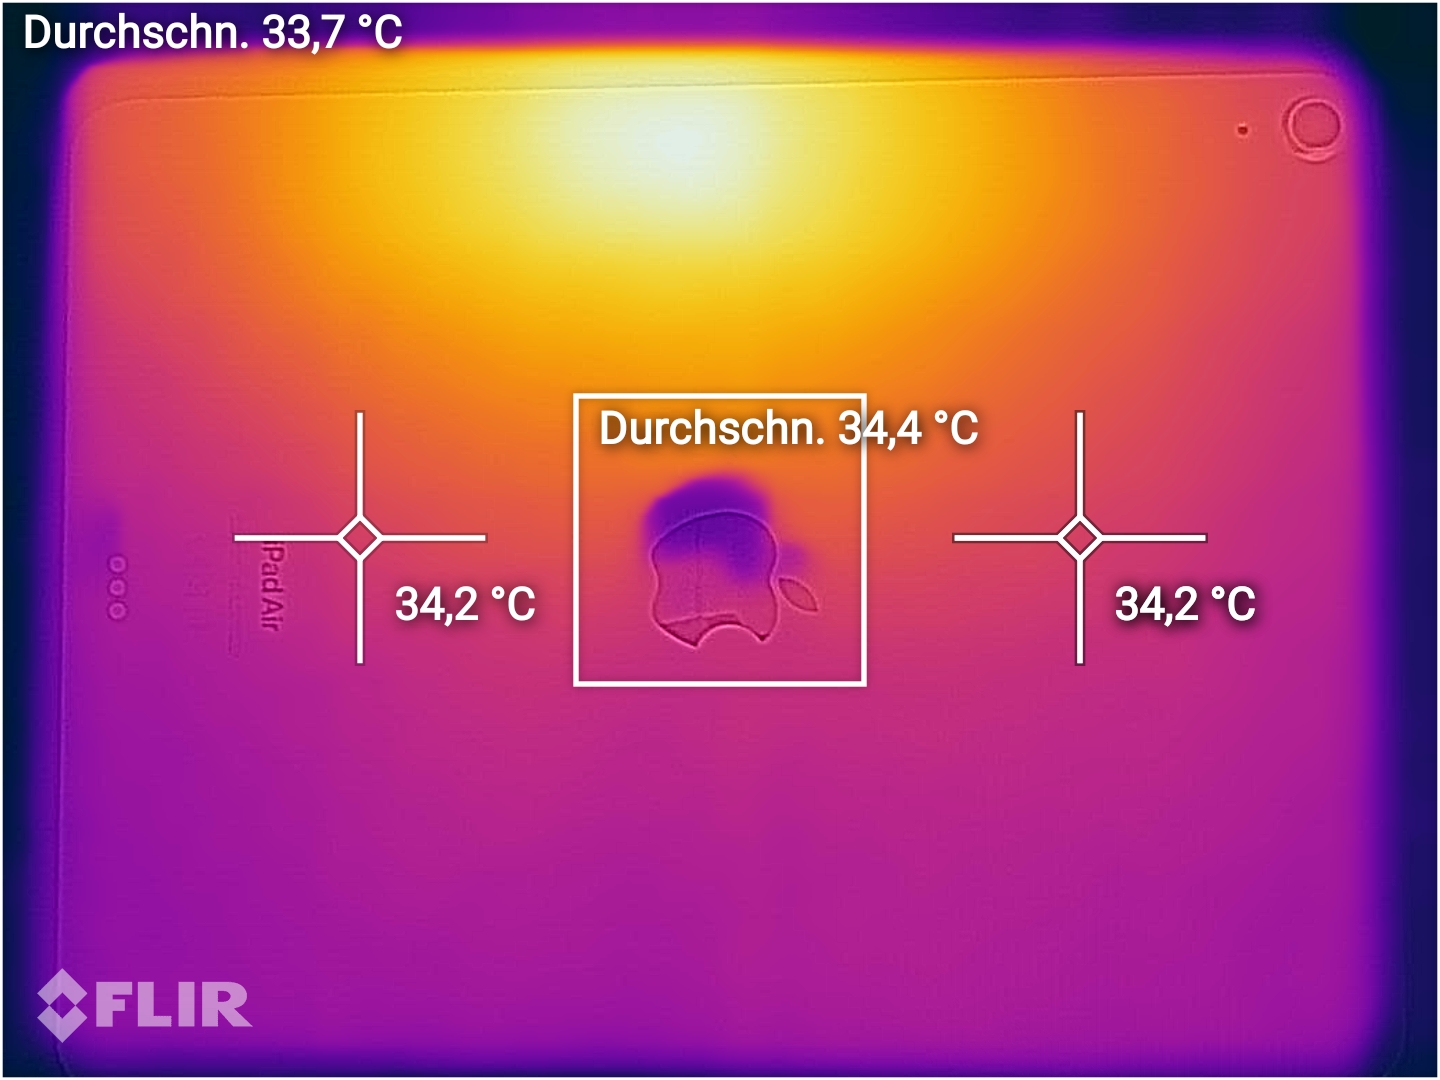
Temperatures
Many powerful tablets are only able to use their full performance for a short time before the SoC power is throttled for thermal reasons. As the stress tests of 3DMark show, this also happens for the iPad Air 13 (2024). But even with this throttling, the tablet still offers sufficient performance reserves and the reduced performance won't be very noticeable in everyday operation. Particularly, since the iPad Air 13 (2024) hardly gets more than hand warm even under load. We measure a moderate 41.7 °C (107 °F) at the hotspot on the back of the tablet.
(±) The maximum temperature on the upper side is 40.6 °C / 105 F, compared to the average of 33.8 °C / 93 F, ranging from 20.7 to 53.2 °C for the class Tablet.
(±) The bottom heats up to a maximum of 41.7 °C / 107 F, compared to the average of 33.3 °C / 92 F
(±) In idle usage, the average temperature for the upper side is 32.9 °C / 91 F, compared to the device average of 30 °C / 86 F.
3DMark Wild Life Stress Test
| 3DMark | |
| Wild Life Extreme Stress Test | |
| Xiaomi Pad 6S Pro | |
| Samsung Galaxy Tab S9+ | |
| Apple iPad Pro 11 2024 | |
| Apple iPad Air 5 2022 | |
| Apple iPad Air 6 2024 | |
| Apple iPad Air 13 2024 | |
| Wild Life Stress Test Stability | |
| Apple iPad Pro 11 2024 | |
| Apple iPad Air 6 2024 | |
| Apple iPad Air 13 2024 | |
| Xiaomi Pad 6S Pro | |
| Samsung Galaxy Tab S9+ | |
| Solar Bay Stress Test Stability | |
| Samsung Galaxy Tab S9+ | |
| Xiaomi Pad 6S Pro | |
| Apple iPad Pro 11 2024 | |
| Apple iPad Air 6 2024 | |
| Apple iPad Air 13 2024 | |
Speakers
The Apple tablet outputs stereo sound from four speaker openings, two on each short side. Even though, as any mobile device, it has a hard time producing any real bass, we don't see much reason for complaint, since the tablet scores with a balanced and full sound. Besides AAC and SBC, there are hardly any other Bluetooth audio codecs that are supported, though.
Apple iPad Air 13 2024 audio analysis
(±) | speaker loudness is average but good (80.1 dB)
Bass 100 - 315 Hz
(±) | reduced bass - on average 6.6% lower than median
(±) | linearity of bass is average (13.8% delta to prev. frequency)
Mids 400 - 2000 Hz
(+) | balanced mids - only 3.7% away from median
(+) | mids are linear (6.3% delta to prev. frequency)
Highs 2 - 16 kHz
(+) | balanced highs - only 2.4% away from median
(+) | highs are linear (2.6% delta to prev. frequency)
Overall 100 - 16.000 Hz
(+) | overall sound is linear (10.4% difference to median)
Compared to same class
» 5% of all tested devices in this class were better, 2% similar, 93% worse
» The best had a delta of 7%, average was 22%, worst was 129%
Compared to all devices tested
» 4% of all tested devices were better, 1% similar, 95% worse
» The best had a delta of 4%, average was 25%, worst was 134%
Samsung Galaxy Tab S9+ audio analysis
(+) | speakers can play relatively loud (82.2 dB)
Bass 100 - 315 Hz
(±) | reduced bass - on average 12.3% lower than median
(±) | linearity of bass is average (7.6% delta to prev. frequency)
Mids 400 - 2000 Hz
(+) | balanced mids - only 2% away from median
(+) | mids are linear (4.2% delta to prev. frequency)
Highs 2 - 16 kHz
(+) | balanced highs - only 4.1% away from median
(+) | highs are linear (6.2% delta to prev. frequency)
Overall 100 - 16.000 Hz
(+) | overall sound is linear (11.9% difference to median)
Compared to same class
» 10% of all tested devices in this class were better, 5% similar, 85% worse
» The best had a delta of 7%, average was 22%, worst was 129%
Compared to all devices tested
» 7% of all tested devices were better, 2% similar, 91% worse
» The best had a delta of 4%, average was 25%, worst was 134%
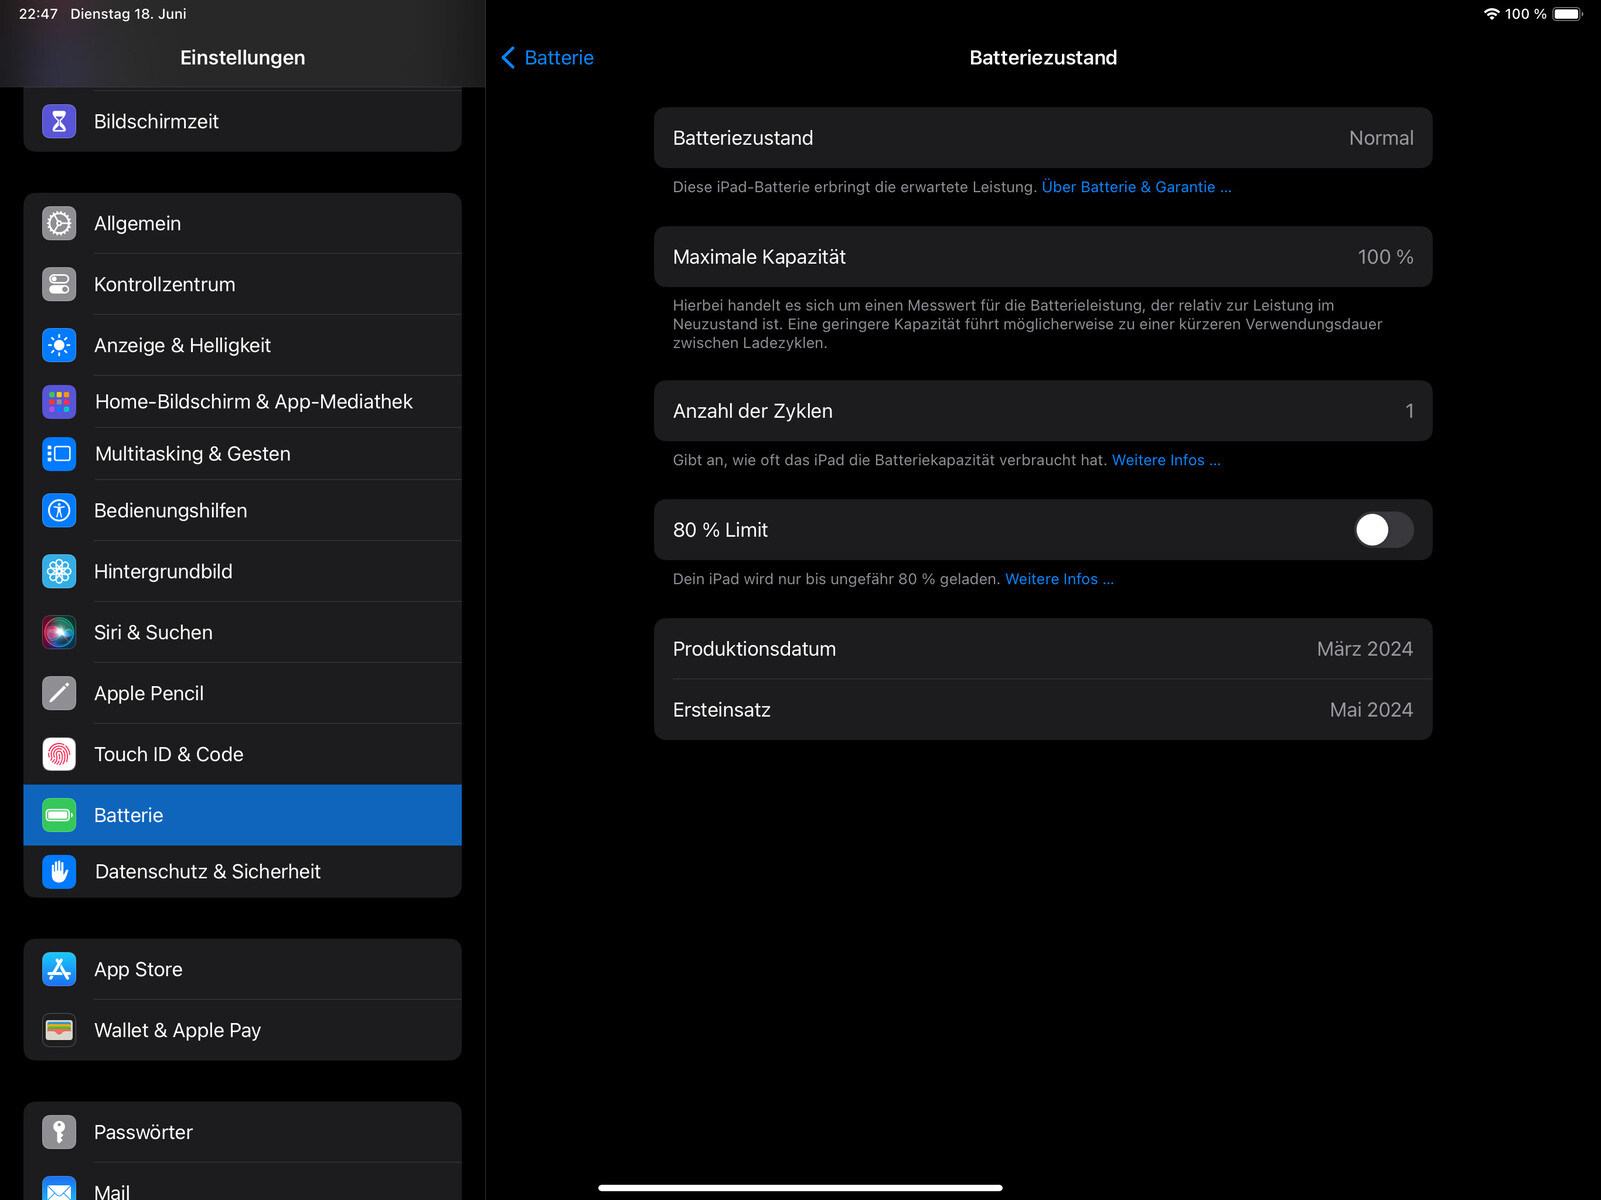
Power Management - Fully recharged within 2.5 hours
Power Consumption
The 36.59-Wh battery of the iPad Air 13 (2024) can be charged at up to 20 watts, but you have to find the corresponding charger yourself. In our test, the Apple tablet doesn't appear to be too picky and is able to get its maximum charging power of 20 watts from chargers made by various manufacturers. It takes around 2.5 hours to completely recharge the battery.
During idle operation, the Apple tablet appears power hungry, consuming more power than similarly sized comparison devices such as the Samsung Galaxy Tab S9+ or Xiaomi Pad 6S Pro. Under load, it doesn't stand out, although it is still able to consume up to 16.8 watts from the battery, which doesn't leave much power reserves.
| Off / Standby | |
| Idle | |
| Load |
|
| Apple iPad Air 13 2024 mAh | Apple iPad Air 5 2022 mAh | Apple iPad Air 6 2024 mAh | Apple iPad Pro 11 2024 8340 mAh | Samsung Galaxy Tab S9+ 10090 mAh | Xiaomi Pad 6S Pro 10000 mAh | |
|---|---|---|---|---|---|---|
| Power Consumption | 16% | 27% | -3% | 14% | 14% | |
| Idle Minimum * | 2.23 | 1.65 26% | 1.5 33% | 3.5 -57% | 3.4 -52% | 1.22 45% |
| Idle Average * | 8.45 | 8.1 4% | 3.6 57% | 4.8 43% | 3.6 57% | 7.18 15% |
| Idle Maximum * | 8.53 | 9.4 -10% | 4.6 46% | 5.9 31% | 3.9 54% | 8.22 4% |
| Load Average * | 12.52 | 9.5 24% | 12.8 -2% | 15.6 -25% | 11.7 7% | 13.63 -9% |
| Load Maximum * | 16.76 | 10.4 38% | 16.8 -0% | 17.6 -5% | 15.8 6% | 14.56 13% |
* ... smaller is better
Power Consumption: Geekbench (150 cd/m²)
Power Consumption: GFXBench (150 cd/m²)
Battery Life
The iPad Air 13 (2024) gets good runtimes from its 36.59-Wh battery. In our realistic WLAN test and when playing videos in a constant loop, it lasts around 13 hours respectively. With this, it is able to just surpass its 11-inch sibling model, and it also lasts slightly longer than the 12.4-inch Samsung Galaxy Tab S9+.
| Apple iPad Air 13 2024 mAh | Apple iPad Air 5 2022 mAh | Apple iPad Air 6 2024 mAh | Apple iPad Pro 11 2024 8340 mAh | Samsung Galaxy Tab S9+ 10090 mAh | Xiaomi Pad 6S Pro 10000 mAh | |
|---|---|---|---|---|---|---|
| Battery Runtime | -13% | -9% | 23% | -9% | 19% | |
| Reader / Idle | 1519 | 1508 -1% | 2253 48% | 996 -34% | 2565 69% | |
| H.264 | 783 | 768 -2% | 966 23% | 693 -11% | 773 -1% | |
| WiFi v1.3 | 771 | 646 -16% | 683 -11% | 911 18% | 584 -24% | 959 24% |
| Load | 272 | 245 -10% | 211 -22% | 276 1% | 365 34% | 224 -18% |
Pros
Cons
Verdict on the Apple iPad Air 13 (2024)


Apple breaks new ground with the iPad Air 13 (2024), since a 13-inch tablet has been available only in the Pro series until now. With its Apple M2 SoC, the 6th generation of the iPad Air also recommends itself as an iPad Pro alternative, since it delivers an abundance of performance, easily leaving the Android competitors far behind in the dust. In addition, the 13-inch tablet is able to score with its bright IPS display, good battery life, and modern connections.
However, besides the larger form factor, there are hardly any arguments to update from its 11-inch predecessor, since the rest of the innovations are limited to details such as a more current Bluetooth version, a more ergonomic placement of the selfie camera, and the support of the Apple Pencil Pro. An upgrade solely for the sake of the higher performance isn't worth it. The Apple M1 of the predecessor already offered a very high performance and continues to be hardly reaching its limits when challenged by any of the apps in the App Store.
The 6th generation of the iPad Air is available as a 13-inch version for the first time and offers an abundance of performance with its Apple M2. Otherwise, not much has changed compared to the predecessor.
With the iPad Air, Apple is also presented with the dilemma of not making its tablet be too good, since it isn't supposed to compete with the iPad Pro on its own turf. Those who want Pro features such as an OLED panel, a 120-Hz refresh rate, and Face ID, therefore have to spend more money for the iPad Pro. In contrast, the iPad Air 13 (2024) is several hundred Euros more affordable than the iPad Pro that starts from 1,549 Euros ($1,299 in the US) in the 13-inch version and quickly surpasses the 2000 Euro mark if you consider the accessories such as the Magic Keyboard.
If it doesn't necessarily have to be an Apple tablet, there are many good - although not quite as powerful - alternatives available on the Android side. Those include the Samsung Galaxy Tab S9+ and the Xiaomi Pad 6S Pro, for example. Both of these 12.4-inch tablets are significantly better equipped in parts than the iPad Air 13 (2024).
Price and Availability
The Apple iPad Air 13 (2024) is available with an MSRP starting from $799 in the US directly from the manufacturer or from other vendors such as Amazon starting from $769.
Note that we have updated our rating system and the results of version 8 are not comparable with those of version 7. You can find additional information on this here.
Apple iPad Air 13 2024
-
06/27/2024 v8 (new)
Manuel Masiero
 Total Sustainability Score:
 Transparency
The present review sample was made available to the author as a loan by the manufacturer or a shop for the purposes of review. The lender had no influence on this review, nor did the manufacturer receive a copy of this review before publication. There was no obligation to publish this review.
Price comparison

