 Deutsch
 English
 Español
 Français
 Italiano
 Nederlands
 Polski
 Português
 Русский
 Türkçe
 Svenska
 Chinese
 Magyar
Apple M3 Max 14-Core vs Intel Core i5-1030NG7 vs Apple M3
Apple M3 Max 14-Core
► remove from comparison
The Apple M3 Max 14 core CPU is a system on a chip (SoC) from Apple for notebooks that was introduced towards the end of 2023. It integrates a new 14-core CPU with 10 performance cores with up to 4.06 GHz and 4 efficiency cores with 2.8 GHz. There is also a more powerful 16-core variant with 40 GPU cores.
Thanks to the higher clock rates and architectural improvements, the processor performance is also significantly better than the M2 Max in benchmarks and can keep up with the fastest mobile CPUs.
The M3 also integrates a new graphics card with dynamic caching, mesh shading and ray tracing acceleration via hardware. In the cheaper model, 30 of the chip's 40 cores are used and support up to 5 displays simultaneously (internal and 4 external).
GPU and CPU can jointly access the shared memory on the package (unified memory). This is available in 36 and 96 GB variants and offers 400 GB/s maximum bandwidth (512 bit bus).
The integrated 16-core Neural Engine has also been revised and now offers 18 TOPS peak performance (compared to 15.8 TOPS in the M2 but 35 TOPS in the new A17 Pro). The video engine now also supports AV1 decoding in hardware. H.264, HEVC and ProRes (RAW) can still be decoded and encoded. Like its predecessor, the Max chip offers two video engines and can therefore encode and decode two streams simultaneously.
Unfortunately, the integrated WLAN only continues to support WiFi 6E (no WiFi 7), unlike the small M3 SoC thunderbolt 4 is also supported (max 40 Gbit/s).
The chip is manufactured in the current 3nm process (N3B) at TSMC and contains 92 billion transistors (+37% vs. Apple M2 Max).
Intel Core i5-1030NG7
► remove from comparisonThe Intel Core i5-1030NG7 is a power efficient quad-core SoC for laptops and Ultrabooks based on the Ice -Lake-Y generation that was announced in Mai 2019 (Computex). It integrates four Sunnycove processor cores (8 threads thanks to HyperThreading) clocked at 1.1 (base) - 3.8 (single core Turbo) GHz. All four cores can turbo up to 3.2 GHz using Turbo Boost. According to Intel the Sunnycove cores achieve 18% more IPCs (Instructions per Clock).
Compared to the normal Core i5-1030G7, the i5-1030NG7 offers a smaller package size (22 x 16.5 versus 26.5 x 18.5 mm), a higher base clock of 1100 versus 800 MHz and a 1 Watt higher TDP.
Combined with the two additional cores, the previous Y-series dual core processors (Amber Lake-Y) should be always slower. Short burst performance should be excellent, long workloads will depend on the TDP settings and cooling solution in the laptop / tablet.
The biggest improvement for Ice-Lake is the integrated Gen 11 graphics card called Iris Plus Graphics. The Core i5-1030NG7 integrates the biggest G7 variant with 64 CUs clocked at 300 - 1050 MHz. The Iris Plus G7 should be twice as fast as the predecessors and best the AMD Vega 10 GPU in current Ryzen APUs. However, in the Y-series the gaming performance will be again depending on the cooling solution and may degrade clearly over time (compared to the Core i7-1065G7 with 15 - 25 Watt e.g.).
Other improvements for Ice Lake are the AI hardware acceleration and the partial integration of Thunderbolt and Wifi 6 in the chip. The integrated DDR4 memory controller supports modules with up to 3200 MHz (and LPDDDR4 3733).
The Core i5-1030NG7 is produced in the new 10nm process at Intel (2nd generation) that should offer a comparable performance to the 7nm process at TSMC. The TDP is specified at 10 Watts and therefore the CPU can be used in thin and light laptops. Intel offers a configurable TDP of up to 12 Watts for the partners resulting in significant performance differences (due to longer periods of Turbo Boost).
Apple M3
► remove from comparison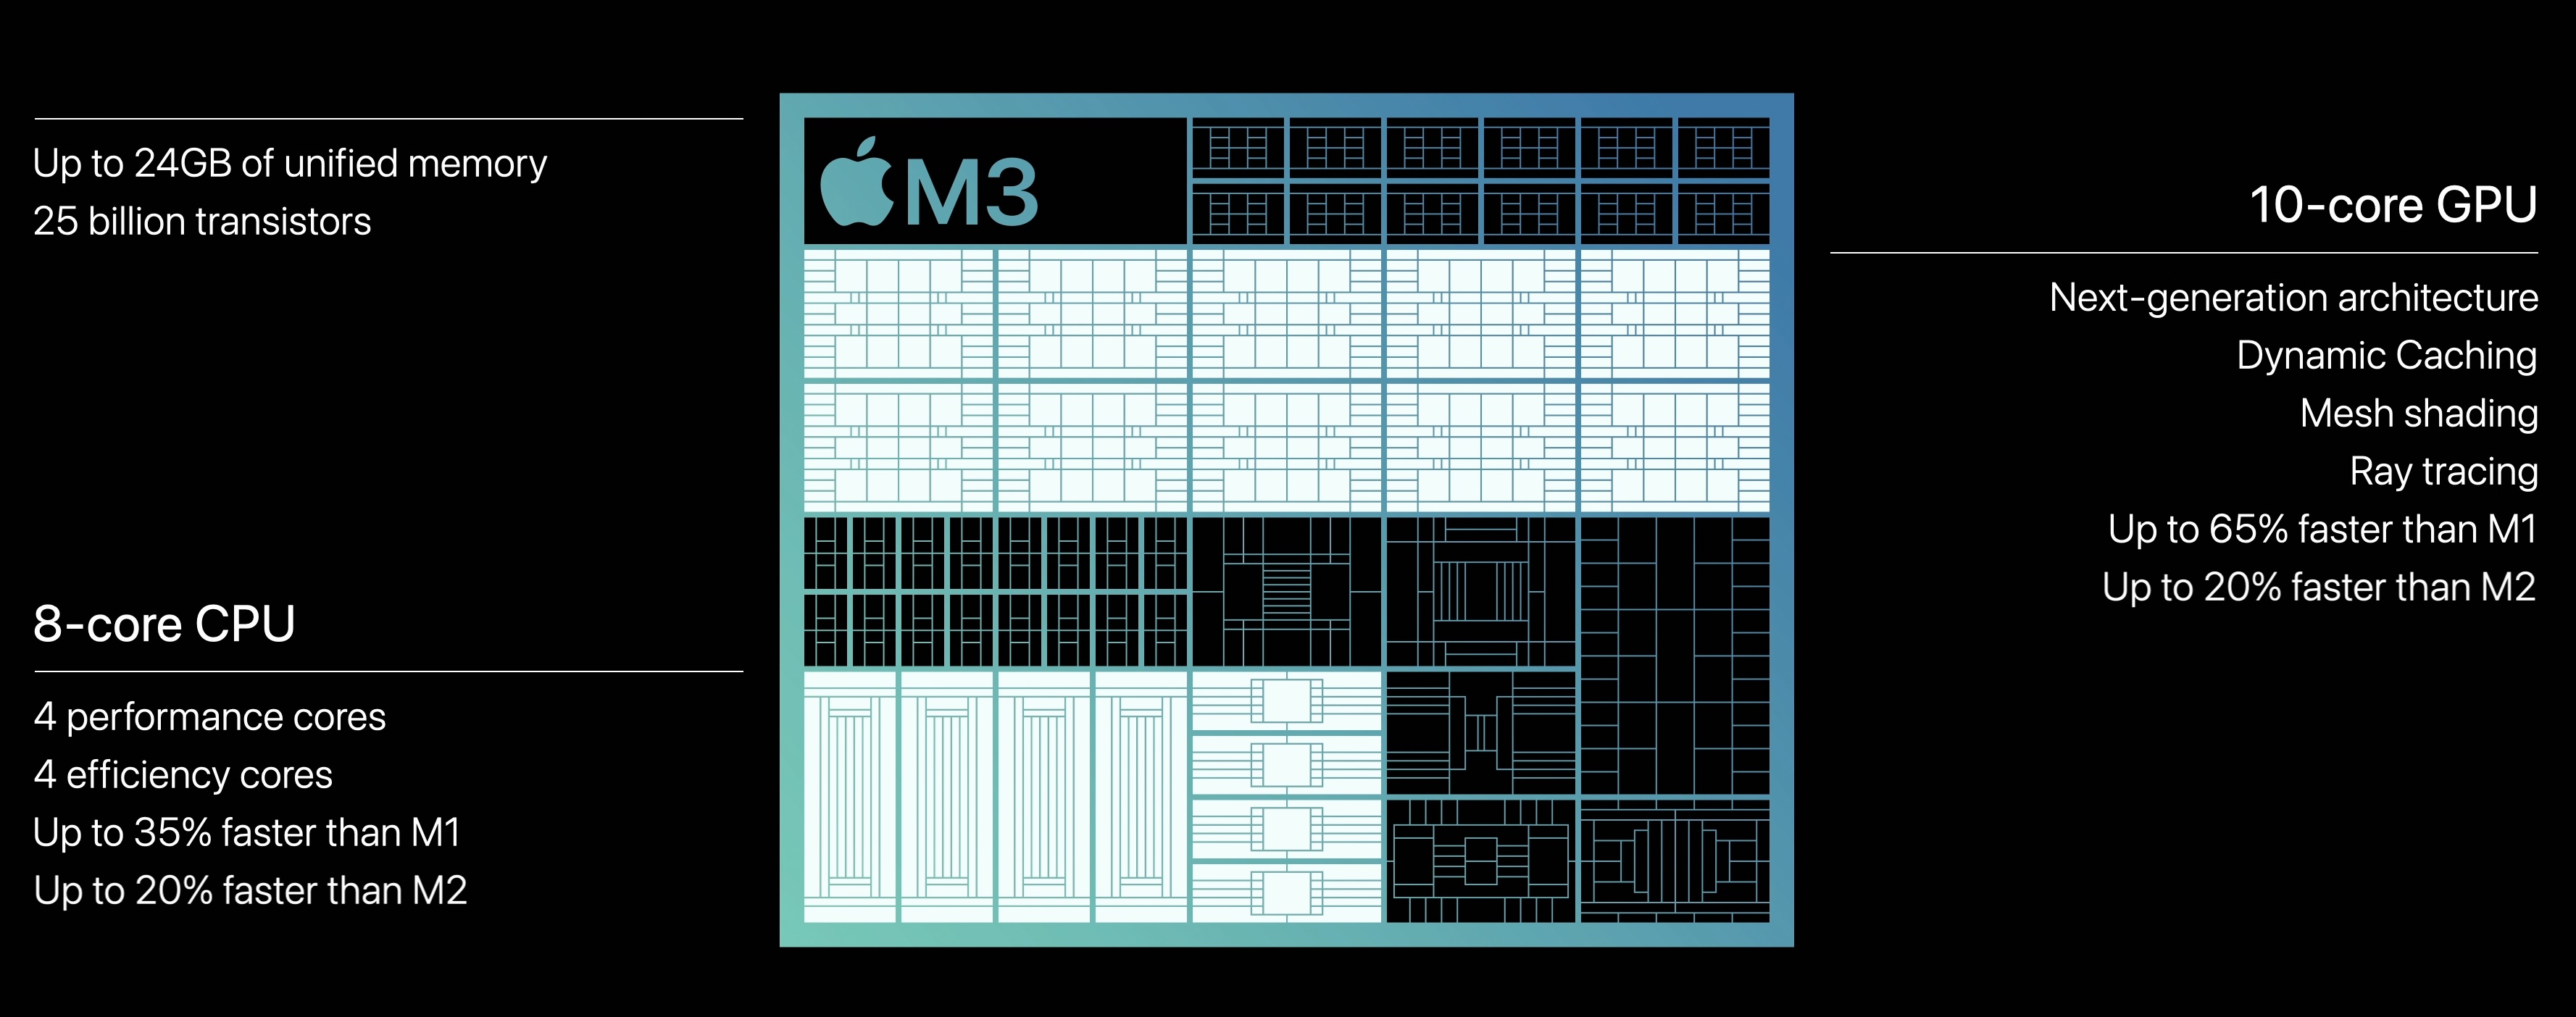
The Apple M3 is a system on a chip (SoC) from Apple for notebooks that was introduced in late 2023. It integrates a new 8-core CPU with 4 performance cores with up to 4.06 GHz and 4 efficiency cores running at up to 2.75 GHz. Apple claims that the CPU is up to 20% faster than in the old Apple M2 (3.5 GHz).
Due to the higher clock speeds and architecture improvements, the processor performance is also significantly better than the M2 in benchmarks (see e.g. Geekbench below) and can keep up with the fastest CPUs in short single-core tests (like the Raptor Lake i9-13950HX).
The M3 also integrates a new graphics adapter with dynamic caching, mesh shading and ray tracing acceleration. According to Apple, it is 20% faster than the GPU in the M2. The chip integrates again 10 GPU cores, but the cheaper variant only offers 8 cores (e.g. in the entry iMac). Furthermore, the GPU only supports 2 displays (an additional 6K60 display to the internal one).
Both GPU and CPU can access the unified memory on the package together. It is still available in 8, 16 and 24 GB variants and offers the same 100 GB/s maximum bandwidth (unlike the Pro models that feature a reduced memory bandwidth).
The integrated 16-core Neural Engine has also been revised and now offers 18 TOPS peak performance (versus 15.8 TOPS in the M2 but 35 TOPS in the new A17 Pro). The video engine now supports AV1 decoding in hardware. H.264, HEVC and ProRes (RAW) can still be decoded and encoded.
Unfortunately, the integrated wireless network module only supports Wi-Fi 6E (no Wi-Fi 7) and due to the support of only a single external monitor, the chip also has to make do with no Thunderbolt 4 (Thunderbolt 3 / USB 4 support only for up to 40 Gbit/s).
The chip is manufactured on the current 3nm TSMC process (N3B most likely) and contains 25 billion transistors (+25% vs. Apple M2). The 3nm process should also contribute to the excellent efficiency of the chip. Under load, the M3 CPU consumes approximately 20 Watt.
| Model | Apple M3 Max 14-Core | Intel Core i5-1030NG7 | Apple M3 | ||||||||||||||||||||||||||||||||||||||||||||||||||||||||
| Series | Apple Apple M3 | Intel Ice Lake | Apple Apple M3 | ||||||||||||||||||||||||||||||||||||||||||||||||||||||||
| Series: Apple M3 |
|
|
| ||||||||||||||||||||||||||||||||||||||||||||||||||||||||
| Clock | 2748 - 4056 MHz | 1100 - 3500 MHz | 2748 - 4056 MHz | ||||||||||||||||||||||||||||||||||||||||||||||||||||||||
| Cores / Threads | 14 / 14 10 x 4.1 GHz Apple M3 P-Core 4 x 2.7 GHz Apple M3 E-Core | 4 / 8 | 8 / 8 4 x 4.1 GHz Apple M3 P-Core 4 x 2.7 GHz Apple M3 E-Core | ||||||||||||||||||||||||||||||||||||||||||||||||||||||||
| TDP | 78 Watt | 10 Watt | |||||||||||||||||||||||||||||||||||||||||||||||||||||||||
| Transistors | 92000 Million | 25000 Million | |||||||||||||||||||||||||||||||||||||||||||||||||||||||||
| Technology | 3 nm | 10 nm | 3 nm | ||||||||||||||||||||||||||||||||||||||||||||||||||||||||
| Features | ARMv8 Instruction Set | AVX512, DL Boost, Turbo Boost 2.0 | ARMv8 Instruction Set | ||||||||||||||||||||||||||||||||||||||||||||||||||||||||
| iGPU | Apple M3 Max 30-Core GPU | Intel Iris Plus Graphics G7 (Ice Lake 64 EU) (300 - 1050 MHz) | Apple M3 10-Core GPU | ||||||||||||||||||||||||||||||||||||||||||||||||||||||||
| Architecture | ARM | x86 | ARM | ||||||||||||||||||||||||||||||||||||||||||||||||||||||||
| Announced | |||||||||||||||||||||||||||||||||||||||||||||||||||||||||||
| Manufacturer | www.apple.com | www.apple.com | |||||||||||||||||||||||||||||||||||||||||||||||||||||||||
| Codename | Ice Lake Y | ||||||||||||||||||||||||||||||||||||||||||||||||||||||||||
| L1 Cache | 192 KB | ||||||||||||||||||||||||||||||||||||||||||||||||||||||||||
| L2 Cache | 2 MB | 4 MB | |||||||||||||||||||||||||||||||||||||||||||||||||||||||||
| L3 Cache | 6 MB |
