Notebookcheck Logo

Qualcomm Adreno 510 vs Apple M2 8-Core GPU

Qualcomm Adreno 510

► remove from comparison Qualcomm Adreno 510

The Qualcomm Adreno 510 is a mobile graphics card for mid-range smartphones and tablets (mostly Android based). It is included in the Qualcomm Snapdragon 650 and 652 SoCs and based on the Adreno 500 architecture (like the Adreno 520 in the S820, which should be fully compatible in software).

The GPU supports modern standards like Vulkan 1.0 (according to Wikipedia), OpenGL ES 3.1 + AE (3.2 in other sources), OpenCL 2.0 and DirectX 12 (FL 12.1 according to Wikipedia, 11.1 according to Qualcomm). Furthermore, the GPU supports Universal Bandwidth Compression (UBWC) to save memory bandwidth.

Compared the the faster Adreno 530, the 510 is currently produced in the older 28nm process (650 and 652) and should offer less ALUs. The clock speed is not disclosed.

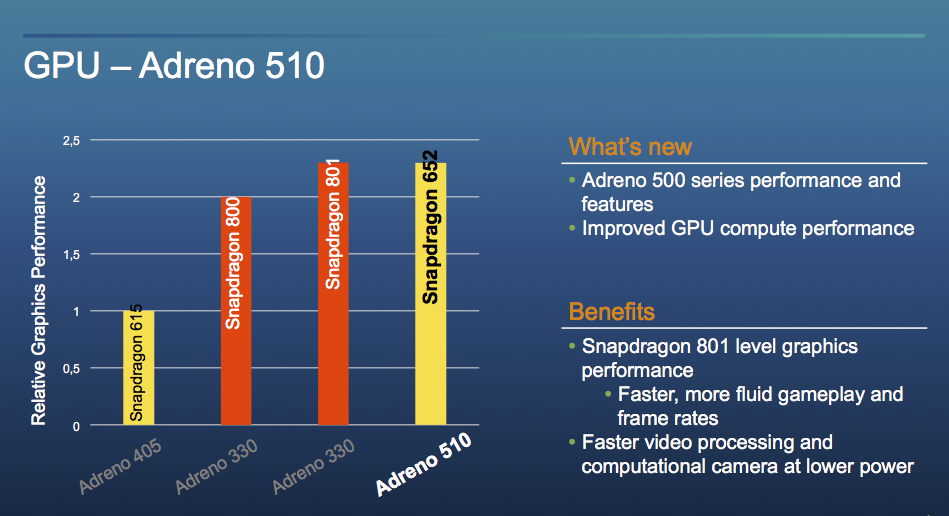
Early benchmarks and performance ratings from Qualcomm position the GPU on a level with the old Adreno 330 (former high end GPU) in the Snapdragon 810. Therefore, it should be able to handle most Android games up to Full HD fluently.

Apple M2 8-Core GPU

► remove from comparison Apple M2 8-Core GPU

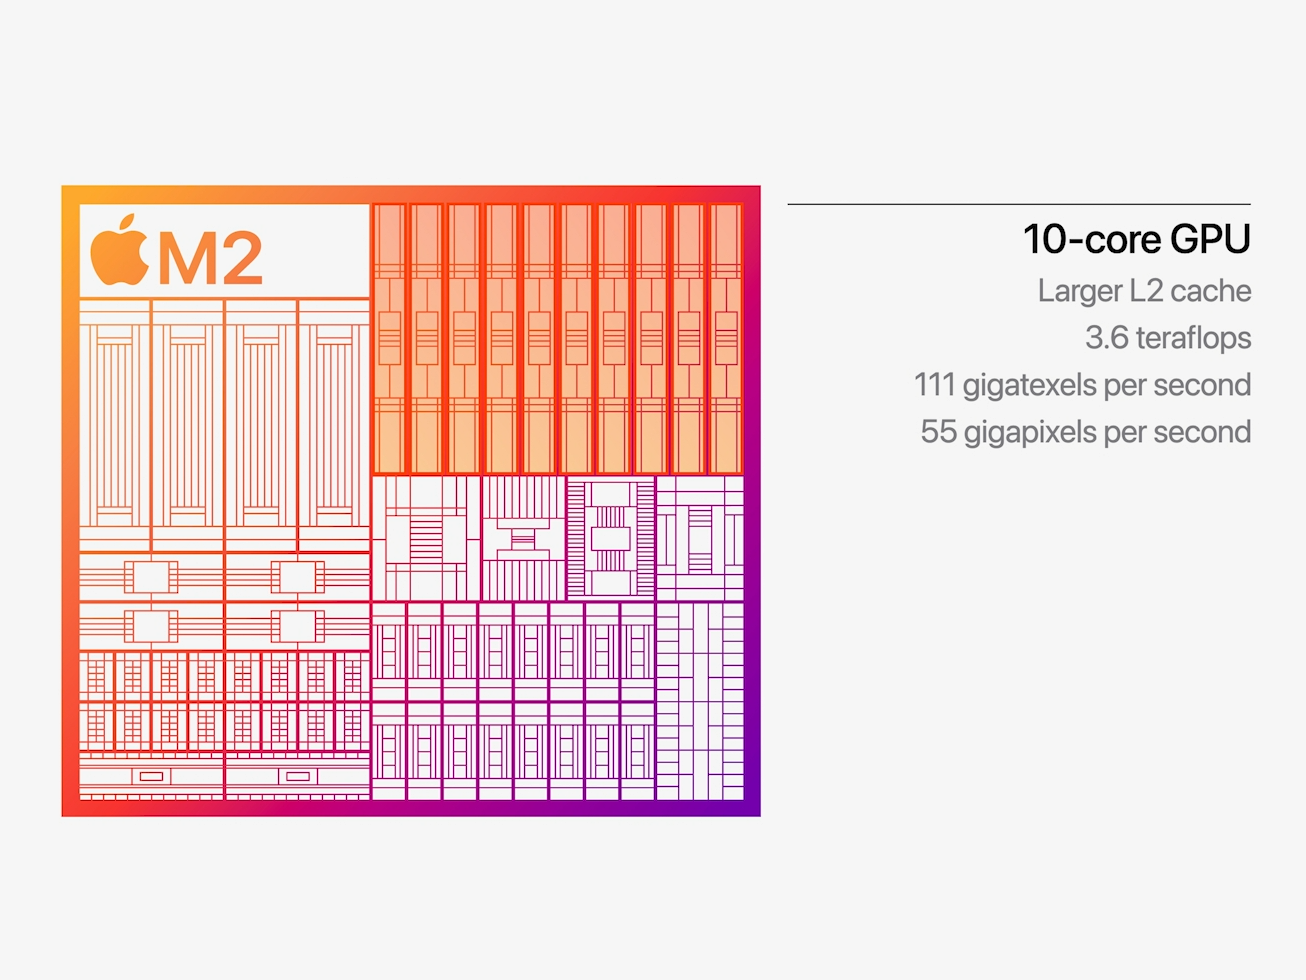
The Apple M2 8-core GPU is an integrated graphics card offering 8 of the 10 cores designed by Apple and integrated in the Apple M2 SoC. It uses the unified memory architecture of the M2 SoC (up to 24 GB LPDDR5-6400 with 100 GB/s bandwidth) and should offer 128 execution units.

The performance is positioned right between the old 8-core model in the M1 GPU and the higher end 10-core model in the M2. The theoretical performance should be around 2.9 Teraflops, as the 8-core version offers the same 1,398 MHz maximum clock rate as the 10-core version. Compared to other iGPUs from AMD and Intel, the M2 benefits greatly from the unified memory architecture and the high bandwidth.

The M2 chip is manufactured in the second generation 5nm process at TSMC (most likely N5P). The power consumption is around 10 Watt (in our tests under load of the MBP13) compared to the 13.5W of the 10-core version.

Qualcomm Adreno 510Apple M2 8-Core GPU
Apple M2 Series
Adreno 540 compare @ 0.71 GHz
Adreno 530 compare @ 0.62 GHz
Adreno 512 compare
Adreno 510
Adreno 509 compare
Adreno 508 compare @ 0.65 GHz
Adreno 506 compare @ 0.65 GHz
Adreno 505 compare @ 0.45 GHz
Adreno 504 compare @ 0.45 GHz
M2 Max 38-Core GPU compare 38
M2 Max 30-Core GPU compare 30
M2 Pro 19-Core GPU compare 19 @ 0.44 - 1.4 GHz
M2 Pro 16-Core GPU compare 16
M2 10-Core GPU compare 10 @ 1.4 GHz
M2 8-Core GPU 8 @ 1.4 GHz
ArchitectureAdreno 500
Shared Memoryyesno
APIDirectX 12.1, OpenGL ES 3.2, Vulkan
technology14 nm5 nm
FeaturesOpenGL ES 3.2, OpenCL 2.0, Direct3D 12 (FL 12_1)
Date of Announcement15.12.2015 06.06.2022
Pipelines8 - unified
Core Speed1398 (Boost) MHz
Memory TypeLPDDR5-6400
Power Consumption10 Watt
PredecessorM1 8-Core GPU
CPU in Adreno 510GPU Base SpeedGPU Boost / Turbo
Qualcomm Snapdragon 652 MSM89768 x 1800 MHz? MHz? MHz
Qualcomm Snapdragon 650 MSM89566 x 1800 MHz? MHz? MHz
min. - max.? MHz? MHz

Benchmarks

3DMark - 3DMark Ice Storm Unlimited Graphics
min: 21087     avg: 21766     median: 21533 (2%)     max: 23175 Points
3DMark - 3DMark Sling Shot (ES 3.0) Unlimited
min: 1381     avg: 1454     median: 1441.5 (6%)     max: 1579 Points
3DMark - 3DMark Sling Shot (ES 3.0) Unlimited Graphics
min: 1354     avg: 1395     median: 1389.5 (3%)     max: 1459 Points
3DMark - 3DMark Sling Shot Extreme (ES 3.1) Unlimited
971 Points (5%)
3DMark - 3DMark Sling Shot Extreme (ES 3.1) Unlimited Graphics
867 Points (3%)
3DMark - 3DMark Wild Life Unlimited
21009 Points (11%)
3DMark - 3DMark Wild Life Extreme Unlimited
5689 Points (7%)
Cinebench R15
Cinebench R15 OpenGL 64 Bit + Apple M2 8-Core GPU
Cinebench R15 - Cinebench R15 OpenGL 64 Bit
128.6 fps (8%)
Cinebench R15 OpenGL Ref. Match 64 Bit + Apple M2 8-Core GPU
Cinebench R15 - Cinebench R15 OpenGL Ref. Match 64 Bit
99.5 % (100%)
GFXBench - GFXBench 5.0 4K Aztec Ruins High Tier Offscreen
39.8 fps (16%)
GFXBench - GFXBench 5.0 Aztec Ruins High Tier Offscreen
91 fps (17%)
GFXBench - GFXBench 5.0 Aztec Ruins Normal Tier Offscreen
247 fps (18%)
199.9 fps (23%)
306.9 fps (6%)
483.7 fps (28%)
GFXBench (DX / GLBenchmark) 2.7
GFXBench T-Rex HD Offscreen C24Z16 + Qualcomm Adreno 510
GFXBench (DX / GLBenchmark) 2.7 - GFXBench T-Rex HD Offscreen C24Z16
min: 22     avg: 30.8     median: 31 (0%)     max: 36 fps
GFXBench T-Rex HD Offscreen C24Z16 + Apple M2 8-Core GPU
839 fps (7%)
Basemark ES 2.0 - Basemark ES 2.0
44.8 fps (74%)
Basemark X 1.1 - Basemark X 1.1 High Quality
15120 Points (34%)
Basemark X 1.1 - Basemark X 1.1 Medium Quality
26078 Points (58%)
PassMark PerformanceTest Mobile V1 - PerformanceTest Mobile V1 2D Graphics Tests
6078 Points (6%)
PassMark PerformanceTest Mobile V1 - PerformanceTest Mobile V1 3D Graphics Tests
2559 Points (4%)
Smartbench 2012 - Smartbench 2012 Gaming Index
4270 Points (93%)
Power Consumption - The Witcher 3 Power Consumption - external Monitor *
24.4 Watt (3%)
Power Consumption - Witcher 3 Power Consumption *
27.4 Watt (6%)

Average Benchmarks Qualcomm Adreno 510 → 100% n=4

Average Benchmarks Apple M2 8-Core GPU → 3248% n=4

- Range of benchmark values for this graphics card
- Average benchmark values for this graphics card
* Smaller numbers mean a higher performance
1 This benchmark is not used for the average calculation

Game Benchmarks

The following benchmarks stem from our benchmarks of review laptops. The performance depends on the used graphics memory, clock rate, processor, system settings, drivers, and operating systems. So the results don't have to be representative for all laptops with this GPU. For detailed information on the benchmark results, click on the fps number.

low 1280x720
M2 8-Core GPU:
43  fps
med. 1920x1080
M2 8-Core GPU:
29.7  fps
high 1920x1080
M2 8-Core GPU:
16.6  fps
ultra 1920x1080
M2 8-Core GPU:
13.4  fps
low 1280x720
M2 8-Core GPU:
77  fps
med. 1920x1080
M2 8-Core GPU:
39  fps
high 1920x1080
M2 8-Core GPU:
18  fps
ultra 1920x1080
M2 8-Core GPU:
14  fps
low 1280x720
M2 8-Core GPU:
62  fps
med. 1920x1080
M2 8-Core GPU:
28  fps
high 1920x1080
M2 8-Core GPU:
24  fps
ultra 1920x1080
M2 8-Core GPU:
20  fps
Dead Trigger 2

Dead Trigger 2

2013
high
100%
Adreno 510:
30 50 57 60 ~ 49 fps
Asphalt 8: Airborne

Asphalt 8: Airborne

2013
low
100%
Adreno 510:
29 30 30 ~ 30 fps
high
100%
Adreno 510:
20 29 30 30 ~ 27 fps

Average Gaming Qualcomm Adreno 510 → 100%

Average Gaming 30-70 fps → 100%

Apple M2 8-Core GPUlowmed.highultraQHD4K
Borderlands 34329.716.613.4
Total War: Three Kingdoms77391814
Shadow of the Tomb Raider62282420
< 30 fps
< 60 fps
< 120 fps
≥ 120 fps

1
2
2
1

3


3


Qualcomm Adreno 510lowmed.highultraQHD4K
Dead Trigger 249
Asphalt 8: Airborne3027
< 30 fps
< 60 fps
< 120 fps
≥ 120 fps

1


1
1


For more games that might be playable and a list of all games and graphics cards visit our Gaming List

Add one or more devices and compare

In the following list you can select (and also search for) devices that should be added to the comparison. You can select more than one device.

restrict list:

show all (including archived), 2024, 2023
v1.28
log 02. 02:54:49

#0 checking url part for id 7360 +0s ... 0s

#1 checking url part for id 11375 +0s ... 0s

#2 redirected to Ajax server, took 1719881689 +0s ... 0s

#3 did not recreate cache, as it is less than 5 days old! Created at Mon, 01 Jul 2024 05:16:07 +0200 +0s ... 0s

#4 composed specs +0.054s ... 0.055s

#5 did output specs +0s ... 0.055s

#6 start showIntegratedCPUs +0s ... 0.055s

#7 getting avg benchmarks for device 7360 +0.019s ... 0.074s

#8 got single benchmarks 7360 +0.014s ... 0.088s

#9 getting avg benchmarks for device 11375 +0s ... 0.088s

#10 got single benchmarks 11375 +0.003s ... 0.092s

#11 got avg benchmarks for devices +0s ... 0.092s

#12 min, max, avg, median took s +0.015s ... 0.107s

#13 before gaming benchmark output +0s ... 0.107s

#14 Got 35 rows for game benchmarks. +0.006s ... 0.113s

#15 composed SQL query for gamebenchmarks +0s ... 0.113s

#16 got data and put it in $dataArray +0s ... 0.113s

#17 benchmarks composed for output. +0.002s ... 0.115s

#18 calculated avg scores. +0s ... 0.115s

#19 return log +0.002s ... 0.117s

Please share our article, every link counts!
> Expert Reviews and News on Laptops, Smartphones and Tech Innovations > Benchmarks / Tech > Graphics Card Comparison - Head 2 Head
Redaktion, 2017-09- 8 (Update: 2023-07- 1)