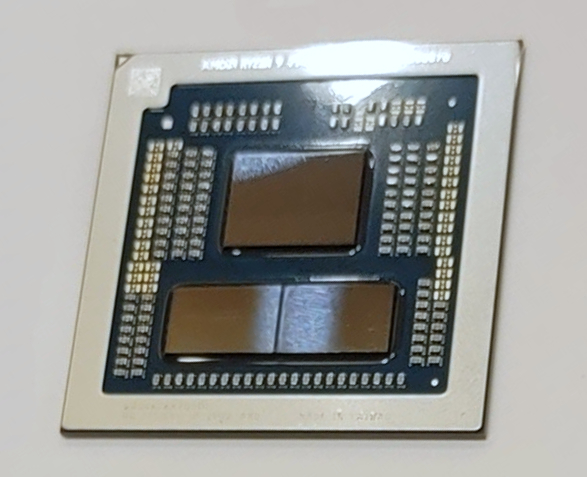
The Dragon Range series still uses a chiplet design with two CCD-clusters (each with 8 possible cores) in 5nm and an IO-die (including the memory controller and the Radeon 610M iGPU ) in 6nm. The chip integrates 4x USB 3.2 Gen2 (10 Gbps) ports (no USB4), 28 PCIe 5.0 lanes (for GPU and SSDs) and a dual-channel DDR5-5200 memory controller.
The Ryzen 9 7945HX is among the fastest processors in our database, as of August 2023. It is in the same league as the Ryzen 9 7945HX3D and noticeably ahead of the Core i9-13980HX , as far as multi-thread benchmark scores are concerned. It is outrageously, unbelievably fast, and those fortunate enough to purchase a laptop built around this CPU will have no performance issues for at least three years.
Thanks to its powerful cooling solution and a long-term CPU power limit of 128 W, the ROG Strix Scar 17 G733PY-XS96 is one of the fastest laptops built around the 7945HX that we know of.
The R9 7945HX is rated at a TDP of 55 Watt and can be configured up to 75 Watt (cTDP).
Codename Dragon Range-HX (Zen 4) Series AMD Dragon Range Series: Dragon Range Dragon Range-HX (Zen 4) Clock Rate 2500 - 5400 MHz Level 1 Cache 1 MB Level 2 Cache 16 MB Level 3 Cache 64 MB Number of Cores / Threads 16 / 32 Power Consumption (TDP = Thermal Design Power) 55 Watt Transistor Count 9900 Million Manufacturing Technology CCD = 5 nm, I/O = 6 nm Max. Temperature 100 °C Socket FL1 Features DDR5-5200 RAM, PCIe 5, MMX, SSE, SSE2, SSE3, SSSE3, SSE4A, SSE4.1, SSE4.2, AVX, AVX2, AVX-512, BMI2, ABM, FMA, ADX, SMEP, SMAP, SMT, CPB, AES-NI, RDRAND, RDSEED, SHA, SME GPU AMD Radeon 610M (400 - 2200 MHz)64 Bit 64 Bit support Architecture x86 Announcement Date 01/05/2023 Product Link (external) www.amd.com
Performance Rating - CB R15 + R20 + 7-Zip + X265 + Blender + 3DM11 CPU
Cinebench 2026 - Cinebench 2026 CPU Single Thread
Cinebench 2026 - Cinebench 2026 CPU Multi
...
max:
Intel Core Ultra 7 270K Plus
Cinebench 2024 - Cinebench 2024 CPU Single Core
min: 109.6 avg: 113 median: 113.6 (56%) max: 116 Points
CPU TDP 85 W TDP 100 W TDP 128 W 98% 100% 97%
Cinebench 2024 - Cinebench 2024 CPU Multi Core
min: 1677 avg: 1739 median: 1716 (32%) max: 1828 Points
CPU TDP 85 W TDP 100 W TDP 128 W 93% 100% 95%
Cinebench R23 - Cinebench R23 Multi Core
min: 30783 avg: 33078 median: 33459 (31%) max: 34613 Points
CPU TDP ? TDP 85 W TDP 90 W TDP 100 W TDP 120 W TDP 128 W TDP 148 W 99% 89% 94% 96% 100% 98% 100%
Cinebench R23 - Cinebench R23 Single Core
min: 1861 avg: 1919 median: 1940 (79%) max: 1957 Points
CPU TDP ? TDP 85 W TDP 90 W TDP 100 W TDP 120 W TDP 128 W TDP 148 W 99% 98% 96% 100% 100% 96% 100%
Cinebench R20 - Cinebench R20 CPU (Single Core)
min: 712 avg: 742 median: 753 (82%) max: 760 Points
CPU TDP ? TDP 85 W TDP 90 W TDP 100 W TDP 120 W TDP 128 W TDP 148 W 99% 97% 94% 100% 100% 95% 98%
...
...
max:
Intel Core Ultra 7 270K Plus
Cinebench R20 - Cinebench R20 CPU (Multi Core)
min: 10025 avg: 12651 median: 13057 (32%) max: 13769 Points
CPU TDP ? TDP 85 W TDP 90 W TDP 100 W TDP 120 W TDP 128 W TDP 148 W 100% 88% 73% 94% 98% 96% 97%
Cinebench R15 - Cinebench R15 CPU Multi 64 Bit
min: 4998 avg: 5363 median: 5289 (33%) max: 5663 Points
0 115 230 345 460 575 690 805 920 1035 1150 1265 1380 1495 1610 1725 1840 1955 2070 2185 2300 2415 2530 2645 2760 2875 2990 3105 3220 3335 3450 3565 3680 3795 3910 4025 4140 4255 4370 4485 4600 4715 4830 4945 5060 5175 5290 5405 5520 Tooltip Minisforum G7 PT: Ø4926 (4863.22-5192.11)
Asus ROG Strix G17 G713PI: Ø4920 (4749.47-5204.94)
Tuxedo Gemini 17 Gen3 AMD: Ø4784 (4600.87-5223.98)
Minisforum BD795i SE: Ø5187 (5161.96-5247.97)
Minisforum BD790i: Ø5075 (4988.15-5158.63)
Asus ROG Strix G17 G713PI Turbo-Mode: Ø5356 (5289.61-5457.77)
Asus ROG Strix Scar 17 G733PY-XS96: Ø5466 (5355.47-5521.05)
Alienware m18 R1 AMD: Ø5466 (5377.07-5540.93)
Asus Zephyrus Duo 16 GX650PY-NM006W: Ø5385 (5255.55-5554.01)
Cinebench R15 - Cinebench R15 CPU Single 64 Bit
min: 290 avg: 304.3 median: 308 (85%) max: 311 Points
CPU TDP ? TDP 85 W TDP 90 W TDP 100 W TDP 120 W TDP 125 W TDP 128 W TDP 148 W 97% 96% 95% 100% 99% 97% 99% 100%
Cinebench R11.5 - Cinebench R11.5 CPU Multi 64 Bit
min: 59.93 avg: 61.6 median: 61 (76%) max: 64.29 Points
CPU TDP 85 W TDP 100 W TDP 120 W 93% 95% 100%
...
max:
Intel Core Ultra 7 270K Plus
Cinebench R11.5 - Cinebench R11.5 CPU Single 64 Bit
min: 3.65 avg: 3.7 median: 3.7 (87%) max: 3.67 Points
CPU TDP 85 W TDP 100 W TDP 120 W 99% 100% 99%
Cinebench R10 - Cinebench R10 Rend. Single (32bit)
min: 8262 avg: 8390 median: 8408.5 (51%) max: 8481 points
CPU TDP 85 W TDP 100 W TDP 120 W 99% 99% 100%
AMD Geode LX 800
...
...
max:
Cinebench R10 - Cinebench R10 Rend. Multi (32bit)
min: 68510 avg: 70846 median: 71596.5 (52%) max: 71681 points
CPU TDP 85 W TDP 100 W TDP 120 W 100% 98% 100%
Cinebench R10 - Cinebench R10 Rend. Multi (64bit)
min: 127197 avg: 128938 median: 128360 (80%) max: 131256 Points
CPU TDP 85 W TDP 100 W 98% 100%
...
max:
Intel Core Ultra 7 270K Plus
Cinebench R10 - Cinebench R10 Rend. Single (64bit)
min: 15601 avg: 15764 median: 15801 (19%) max: 15889 Points
CPU TDP 85 W TDP 100 W 98% 100%
...
...
max:
Intel Core Ultra 7 270K Plus
wPrime 2.10 - wPrime 2.0 1024m *
min: 34.561 avg: 66.2 median: 35.8 (0%) max: 158.7 s
CPU TDP 85 W TDP 100 W TDP 120 W 101% 101% 100%
wPrime 2.10 - wPrime 2.0 32m *
min: 1.917 avg: 2.7 median: 2.1 (0%) max: 4.9 s
CPU TDP 85 W TDP 100 W TDP 120 W 101% 101% 100%
WinRAR - WinRAR 4.0
min: 10253 avg: 13106 median: 13822 (22%) max: 15242 points
CPU TDP 85 W TDP 100 W 100% 92%
7-Zip 18.03 - 7-Zip 18.03 Multi Thread 4 runs
min: 123364 avg: 135923 median: 139757 (80%) max: 140932 MIPS
CPU TDP ? TDP 85 W TDP 90 W TDP 100 W TDP 120 W TDP 128 W TDP 148 W 100% 93% 88% 99% 96% 100% 100%
7-Zip 18.03 - 7-Zip 18.03 Single Thread 4 runs
min: 7319 avg: 7468 median: 7381 (84%) max: 7711 MIPS
CPU TDP ? TDP 85 W TDP 90 W TDP 100 W TDP 120 W TDP 128 W TDP 148 W 97% 98% 96% 100% 96% 99% 97%
...
max:
AMD Ryzen 7 9850X3D
X264 HD Benchmark 4.0 - x264 Pass 2
min: 228 avg: 236.7 median: 239 (6%) max: 243 fps
CPU TDP 85 W TDP 100 W 95% 100%
X264 HD Benchmark 4.0 - x264 Pass 1
min: 360.5 avg: 366.5 median: 362 (9%) max: 377 fps
CPU TDP 85 W TDP 100 W 98% 100%
HWBOT x265 Benchmark v2.2 - HWBOT x265 4k Preset
min: 33.8 avg: 35.8 median: 35.4 (62%) max: 37.6 fps
CPU TDP 85 W TDP 90 W TDP 100 W TDP 120 W TDP 128 W TDP 148 W 92% 90% 98% 93% 100% 100%
0 5 10 15 20 25 30 35 Tooltip Asus ROG Strix G17 G713PI: Ø31.8 (0.66-33.7)
Tuxedo Gemini 17 Gen3 AMD: Ø32.3 (0.71-34.2)
Minisforum G7 PT: Ø31.4 (0.45-34.3)
Asus Zephyrus Duo 16 GX650PY-NM006W: Ø33.8 (0.74-36)
Minisforum BD795i SE: Ø33.2 (0.63-35.9)
Alienware m18 R1 AMD: Ø34.5 (0.64-37.2)
Asus ROG Strix Scar 17 G733PY-XS96: Ø35.1 (0.78-37.1)
Minisforum BD790i: Ø35.5 (0.92-37.4)
TrueCrypt - TrueCrypt Serpent
min: 2.6 avg: 2.7 median: 2.7 (78%) max: 2.7 GB/s
CPU TDP 85 W TDP 100 W TDP 120 W 100% 96% 100%
TrueCrypt - TrueCrypt Twofish
min: 4 avg: 4.1 median: 4.1 (71%) max: 4.2 GB/s
CPU TDP 85 W TDP 100 W TDP 120 W 100% 98% 95%
TrueCrypt - TrueCrypt AES
min: 25.3 avg: 27.7 median: 27.7 (72%) max: 29.9 GB/s
CPU TDP 85 W TDP 100 W TDP 120 W 100% 93% 85%
Blender - Blender 3.3 Classroom CPU *
min: 138 avg: 151.4 median: 152 (2%) max: 160 Seconds
Blender - Blender 2.79 BMW27 CPU *
min: 87 avg: 95 median: 95 (1%) max: 100 Seconds
CPU TDP ? TDP 85 W TDP 90 W TDP 100 W TDP 120 W TDP 128 W TDP 148 W 100% 100% 100% 100% 100% 100% 100%
R Benchmark 2.5 - R Benchmark 2.5 *
min: 0.3884 avg: 0.4 median: 0.4 (9%) max: 0.4159 sec
3DMark 06 - CPU - 3DMark 06 - CPU
min: 19481 avg: 19804 median: 19820 (33%) max: 20110 Points
VIA C7-M C7-M-1200
...
...
max:
Super Pi mod 1.5 XS 1M - Super Pi mod 1.5 XS 1M *
min: 6.4 avg: 6.8 median: 6.6 (1%) max: 7.49 s
CPU TDP 85 W TDP 100 W TDP 120 W 100% 100% 100%
Super Pi mod 1.5 XS 2M - Super Pi mod 1.5 XS 2M *
min: 13.9 avg: 14.6 median: 14.2 (1%) max: 15.978 s
CPU TDP 85 W TDP 100 W TDP 120 W 100% 100% 100%
Super Pi Mod 1.5 XS 32M - Super Pi mod 1.5 XS 32M *
min: 336.106 avg: 339.6 median: 337 (1%) max: 345.75 s
CPU TDP 85 W TDP 100 W TDP 120 W 100% 100% 100%
3DMark Vantage - 3DM Vant. Perf. CPU no Physx
min: 97328 avg: 100508 median: 100877 (74%) max: 102949 Points
...
max:
Intel Core Ultra 7 270K Plus
3DMark 11 - 3DM11 Performance Physics
min: 24017 avg: 26697 median: 26667 (66%) max: 30404 Points
3DMark - 3DMark Ice Storm Physics
min: 79423 avg: 82378 median: 82128.5 (67%) max: 86375 Points
3DMark - 3DMark Ice Storm Extreme Physics
min: 79397 avg: 82262 median: 81750 (66%) max: 86844 Points
3DMark - 3DMark Ice Storm Unlimited Physics
min: 81621 avg: 84162 median: 83710 (67%) max: 89010 Points
...
...
max:
Intel Core Ultra 5 250K Plus
3DMark - 3DMark Cloud Gate Physics
min: 22457 avg: 23233 median: 23020 (58%) max: 24017 Points
...
max:
Intel Core Ultra 7 270K Plus
3DMark - 3DMark Fire Strike Standard Physics
min: 29626 avg: 38324 median: 39095 (70%) max: 42342 Points
...
max:
Intel Core Ultra 7 270K Plus
3DMark - 3DMark Time Spy CPU
min: 6283 avg: 12174 median: 12954.5 (55%) max: 13694 Points
...
...
max:
Intel Core Ultra 7 270K Plus
Geekbench 6.7 - Geekbench 6.7.1 Single-Core
min: 2797 avg: 2870 median: 2876 (66%) max: 2940 points
Geekbench 6.7 - Geekbench 6.7.1 Multi-Core
min: 16223 avg: 16828 median: 16765 (57%) max: 17892 points
Geekbench 6.0 - Geekbench 6.0 Single-Core
...
max:
Intel Core Ultra 7 270K Plus
Geekbench 6.0 - Geekbench 6.0 Multi-Core
Geekbench 5.5 - Geekbench 5.1 - 5.5 64 Bit Single-Core
min: 1960 avg: 2088 median: 2103 (71%) max: 2158 points
CPU TDP ? TDP 85 W TDP 90 W TDP 100 W TDP 120 W TDP 128 W TDP 148 W 99% 99% 96% 97% 100% 96% 100%
Geekbench 5.5 - Geekbench 5.1 - 5.5 64 Bit Multi-Core
min: 18372 avg: 19614 median: 19745 (35%) max: 20394 points
CPU TDP ? TDP 85 W TDP 90 W TDP 100 W TDP 120 W TDP 128 W TDP 148 W 99% 98% 92% 100% 98% 96% 99%
Geekbench 5.0 - Geekbench 5.0 64 Bit Single-Core
min: 1882 avg: 2002 median: 2014.5 (9%) max: 2095 points
CPU TDP 85 W TDP 100 W TDP 128 W 100% 97% 97%
...
...
max:
AMD Ryzen 7 9850X3D
Geekbench 5.0 - Geekbench 5.0 64 Bit Multi-Core
min: 19315 avg: 19802 median: 19649.5 (62%) max: 20593 points
CPU TDP 85 W TDP 100 W TDP 128 W 97% 100% 96%
Geekbench 4.4 - Geekbench 4.1 - 4.4 64 Bit Single-Core
min: 7646 avg: 8264 median: 8534 (77%) max: 8613 points
CPU TDP 85 W TDP 100 W 100% 95%
Geekbench 4.4 - Geekbench 4.1 - 4.4 64 Bit Multi-Core
min: 75652 avg: 77236 median: 76265 (73%) max: 79791 points
CPU TDP 85 W TDP 100 W 97% 100%
...
max:
Intel Core Ultra 7 270K Plus
Mozilla Kraken 1.1 - Kraken 1.1 Total Score *
min: 446 avg: 460.3 median: 457.5 (1%) max: 479 ms
Octane V2 - Octane V2 Total Score
min: 92275 avg: 96361 median: 97339 (64%) max: 99470 Points
WebXPRT 4 - WebXPRT 4 Score
min: 259 avg: 285.9 median: 289 (72%) max: 295 Points
WebXPRT 3 - WebXPRT 3 Score
min: 311 avg: 347.1 median: 351 (59%) max: 387 Points
CrossMark - CrossMark Overall
min: 1929 avg: 2067 median: 2061 (72%) max: 2240 Points
CPU TDP 85 W TDP 90 W TDP 100 W TDP 120 W TDP 128 W TDP 148 W 95% 94% 100% 96% 92% 89%
Power Consumption - Prime95 Power Consumption - external Monitor *
min: 134.4 avg: 163 median: 145 (25%) max: 225 Watt
0 5 10 15 20 25 30 35 40 45 50 55 60 65 70 75 80 85 90 95 100 105 110 115 120 125 130 135 140 145 150 155 160 165 170 175 180 185 190 195 200 205 210 215 220 225 230 235 240 245 Tooltip Minisforum G7 PT: Ø134.4 (129.4-245)
Asus ROG Strix G17 G713PI: Ø136.4 (120.5-141.1)
Tuxedo Gemini 17 Gen3 AMD: Ø142.3 (140-173.9)
Minisforum BD795i SE: Ø144.8 (139.6-151.4)
Minisforum BD790i: Ø145.2 (140.8-151.2)
Asus Zephyrus Duo 16 GX650PY-NM006W: Ø172.7 (170.1-207)
Asus ROG Strix Scar 17 G733PY-XS96: Ø203 (190.6-207)
Alienware m18 R1 AMD: Ø225 (217-238)
Power Consumption - Cinebench R15 Multi Power Consumption - external Monitor *
min: 139.1 avg: 173.2 median: 166.1 (30%) max: 221 Watt
0 5 10 15 20 25 30 35 40 45 50 55 60 65 70 75 80 85 90 95 100 105 110 115 120 125 130 135 140 145 150 155 160 165 170 175 180 185 190 195 200 205 210 215 220 225 230 235 240 Tooltip Minisforum BD790i: Ø139.1 (131.4-140.9)
Minisforum BD795i SE: Ø140.2 (139.8-141.1)
Asus ROG Strix G17 G713PI: Ø164.4 (141.8-177.7)
Minisforum G7 PT: Ø165.6 (129.2-188.6)
Tuxedo Gemini 17 Gen3 AMD: Ø166.6 (161.9-170.6)
Asus Zephyrus Duo 16 GX650PY-NM006W: Ø186.3 (185.9-186.7)
Asus ROG Strix Scar 17 G733PY-XS96: Ø202 (201-203)
Alienware m18 R1 AMD: Ø221 (156.3-244)
Power Consumption - Idle Power Consumption - external Monitor *
min: 13.9 avg: 38.7 median: 31.2 (21%) max: 71.2 Watt
0 5 10 15 20 25 30 35 40 45 50 55 60 65 70 75 80 Tooltip Asus ROG Strix Scar 17 G733PY-XS96: Ø13.9 (11.1-20.7)
Asus ROG Strix G17 G713PI: Ø23.3 (17.3-40.5)
Minisforum BD790i: Ø28.9 (27.2-32.8)
Minisforum G7 PT: Ø29.3 (27.8-40.4)
Minisforum BD795i SE: Ø30.3 (26.8-39.5)
Alienware m18 R1 AMD: Ø32.1 (29.2-46.7)
Tuxedo Gemini 17 Gen3 AMD: Ø39 (35.8-43.7)
Asus Zephyrus Duo 16 GX650PY-NM006W: Ø50.5 (37.5-59.8)
Minisforum BD790i, RTX 4090: Ø68.7 (67.5-72.1)
Minisforum BD795i SE, RTX 4090: Ø71.2 (69.1-82.2)
Power Consumption - Idle Power Consumption 150cd 1min *
min: 17.1 avg: 27 median: 24.1 (18%) max: 37 Watt
0 5 10 15 20 25 30 35 40 45 50 55 60 65 70 Tooltip Asus ROG Strix Scar 17 G733PY-XS96: Ø17.1 (12-31.9)
Asus ROG Strix G17 G713PI: Ø23.4 (16.3-70.4)
Asus Zephyrus Duo 16 GX650PY-NM006W: Ø24.1 (19.8-32.8)
Alienware m18 R1 AMD: Ø33.2 (28.6-52.4)
Tuxedo Gemini 17 Gen3 AMD: Ø37 (33.5-40.6)
Power Consumption - Power Efficiency - Cinebench R15 Multi external Monitor
min: 25.1 avg: 31.3 median: 30.2 (23%) max: 38 Points per Watt
- Range of benchmark values
- Average benchmark values
* Smaller numbers mean a higher performance
log 19. 04:03:11
#0 ran 0s before starting gpusingle class +0s ... 0s
#1 no ids found in url (should be separated by "_") +0s ... 0s
#2 not redirecting to Ajax server +0s ... 0s
#3 did not recreate cache, as it is less than 5 days old! Created at Tue, 16 Jun 2026 19:29:24 +0200 +0.005s ... 0.005s
#4 composed specs +0.041s ... 0.046s
#5 did output specs +0s ... 0.046s
#6 getting avg benchmarks for device 14936 +0.115s ... 0.161s
#7 got single benchmarks 14936 +0.039s ... 0.2s
#8 got avg benchmarks for devices +0s ... 0.2s
#9 min, max, avg, median took s +4.835s ... 5.034s
#10 return log +0.289s ... 5.324s