AMD Radeon RX 5700 review: With 7 nm to success? Competitive thanks to Navi! That AMD has 7-nm graphics cards on the market is no big secret since the Radeon VII was the pioneer in the matter of 7 nm with AMD. With the Navi graphics cards, AMD is also now bringing the small manufacturing process to the upper mid-range of desktop graphics cards. But it's not only the structural width that's received a makeover because the GPU itself is based on a new architecture called RDNA. You can find out how well the AMD Radeon RX 5700 performed in our review.
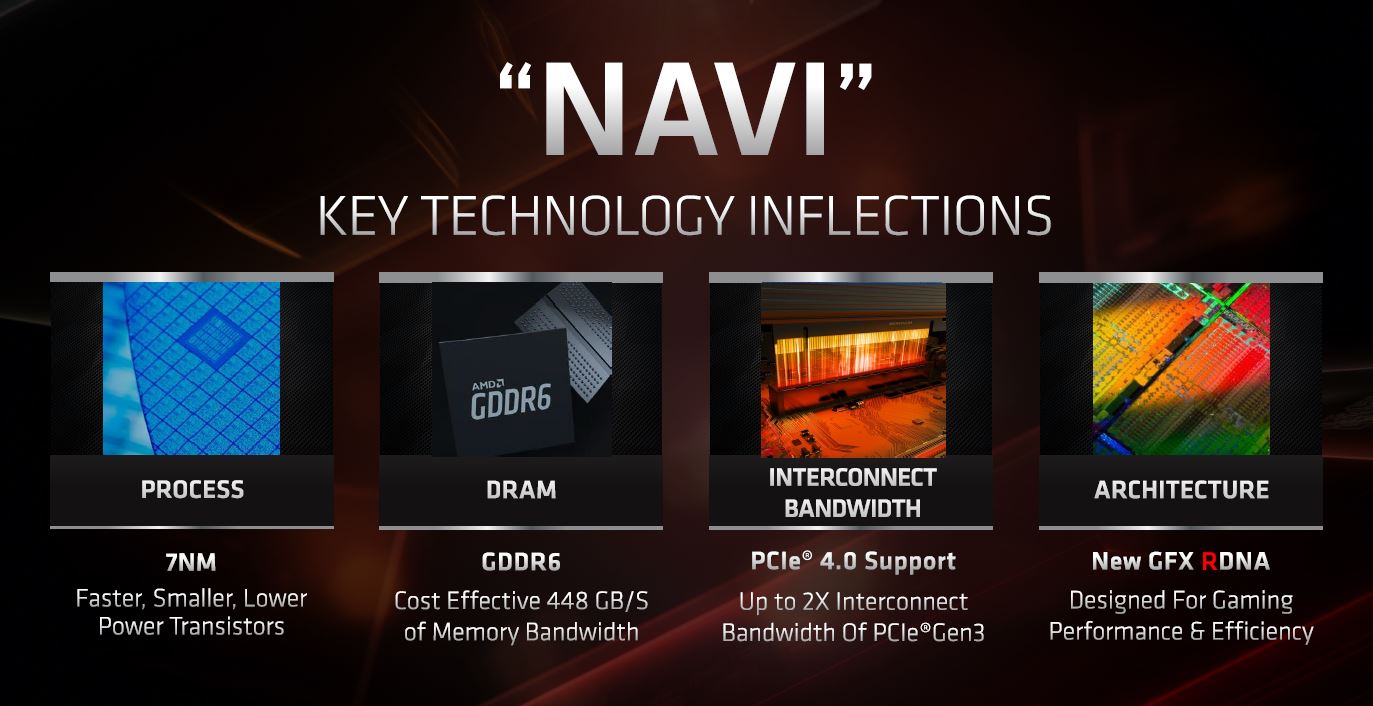
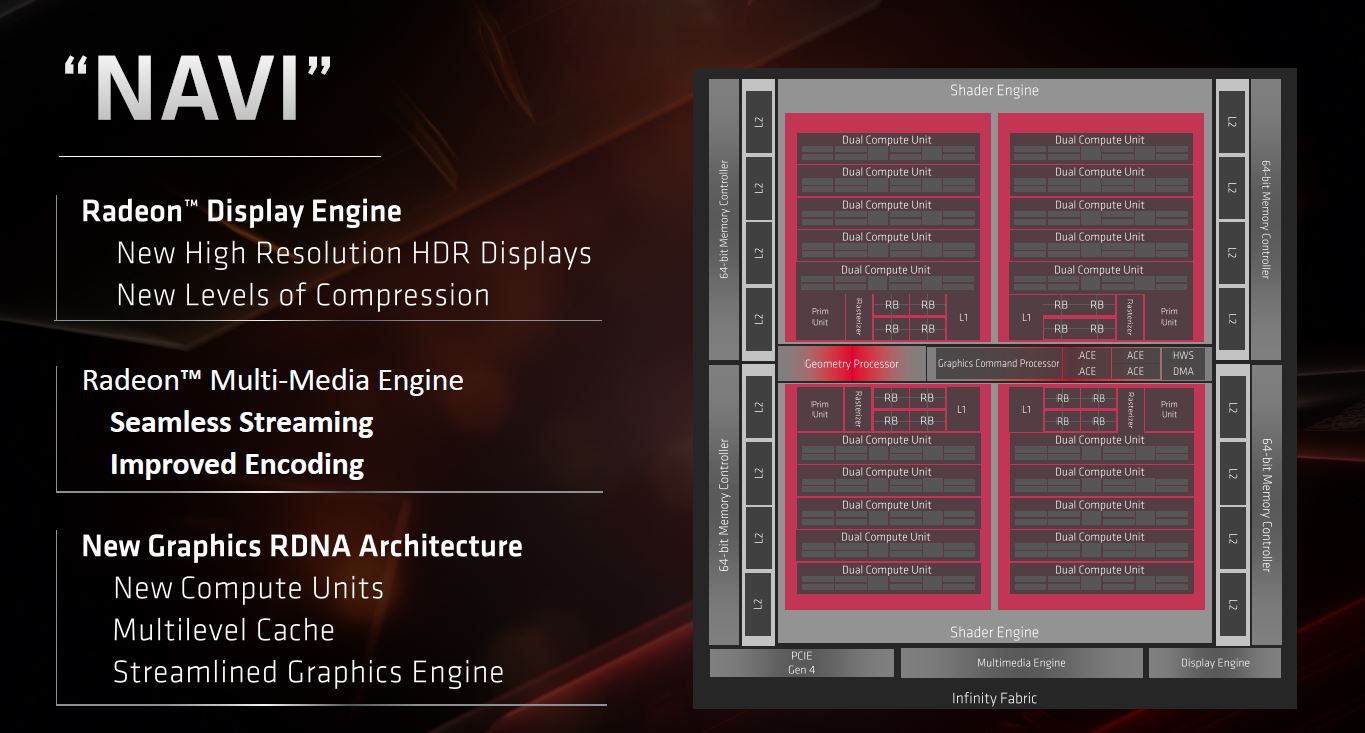
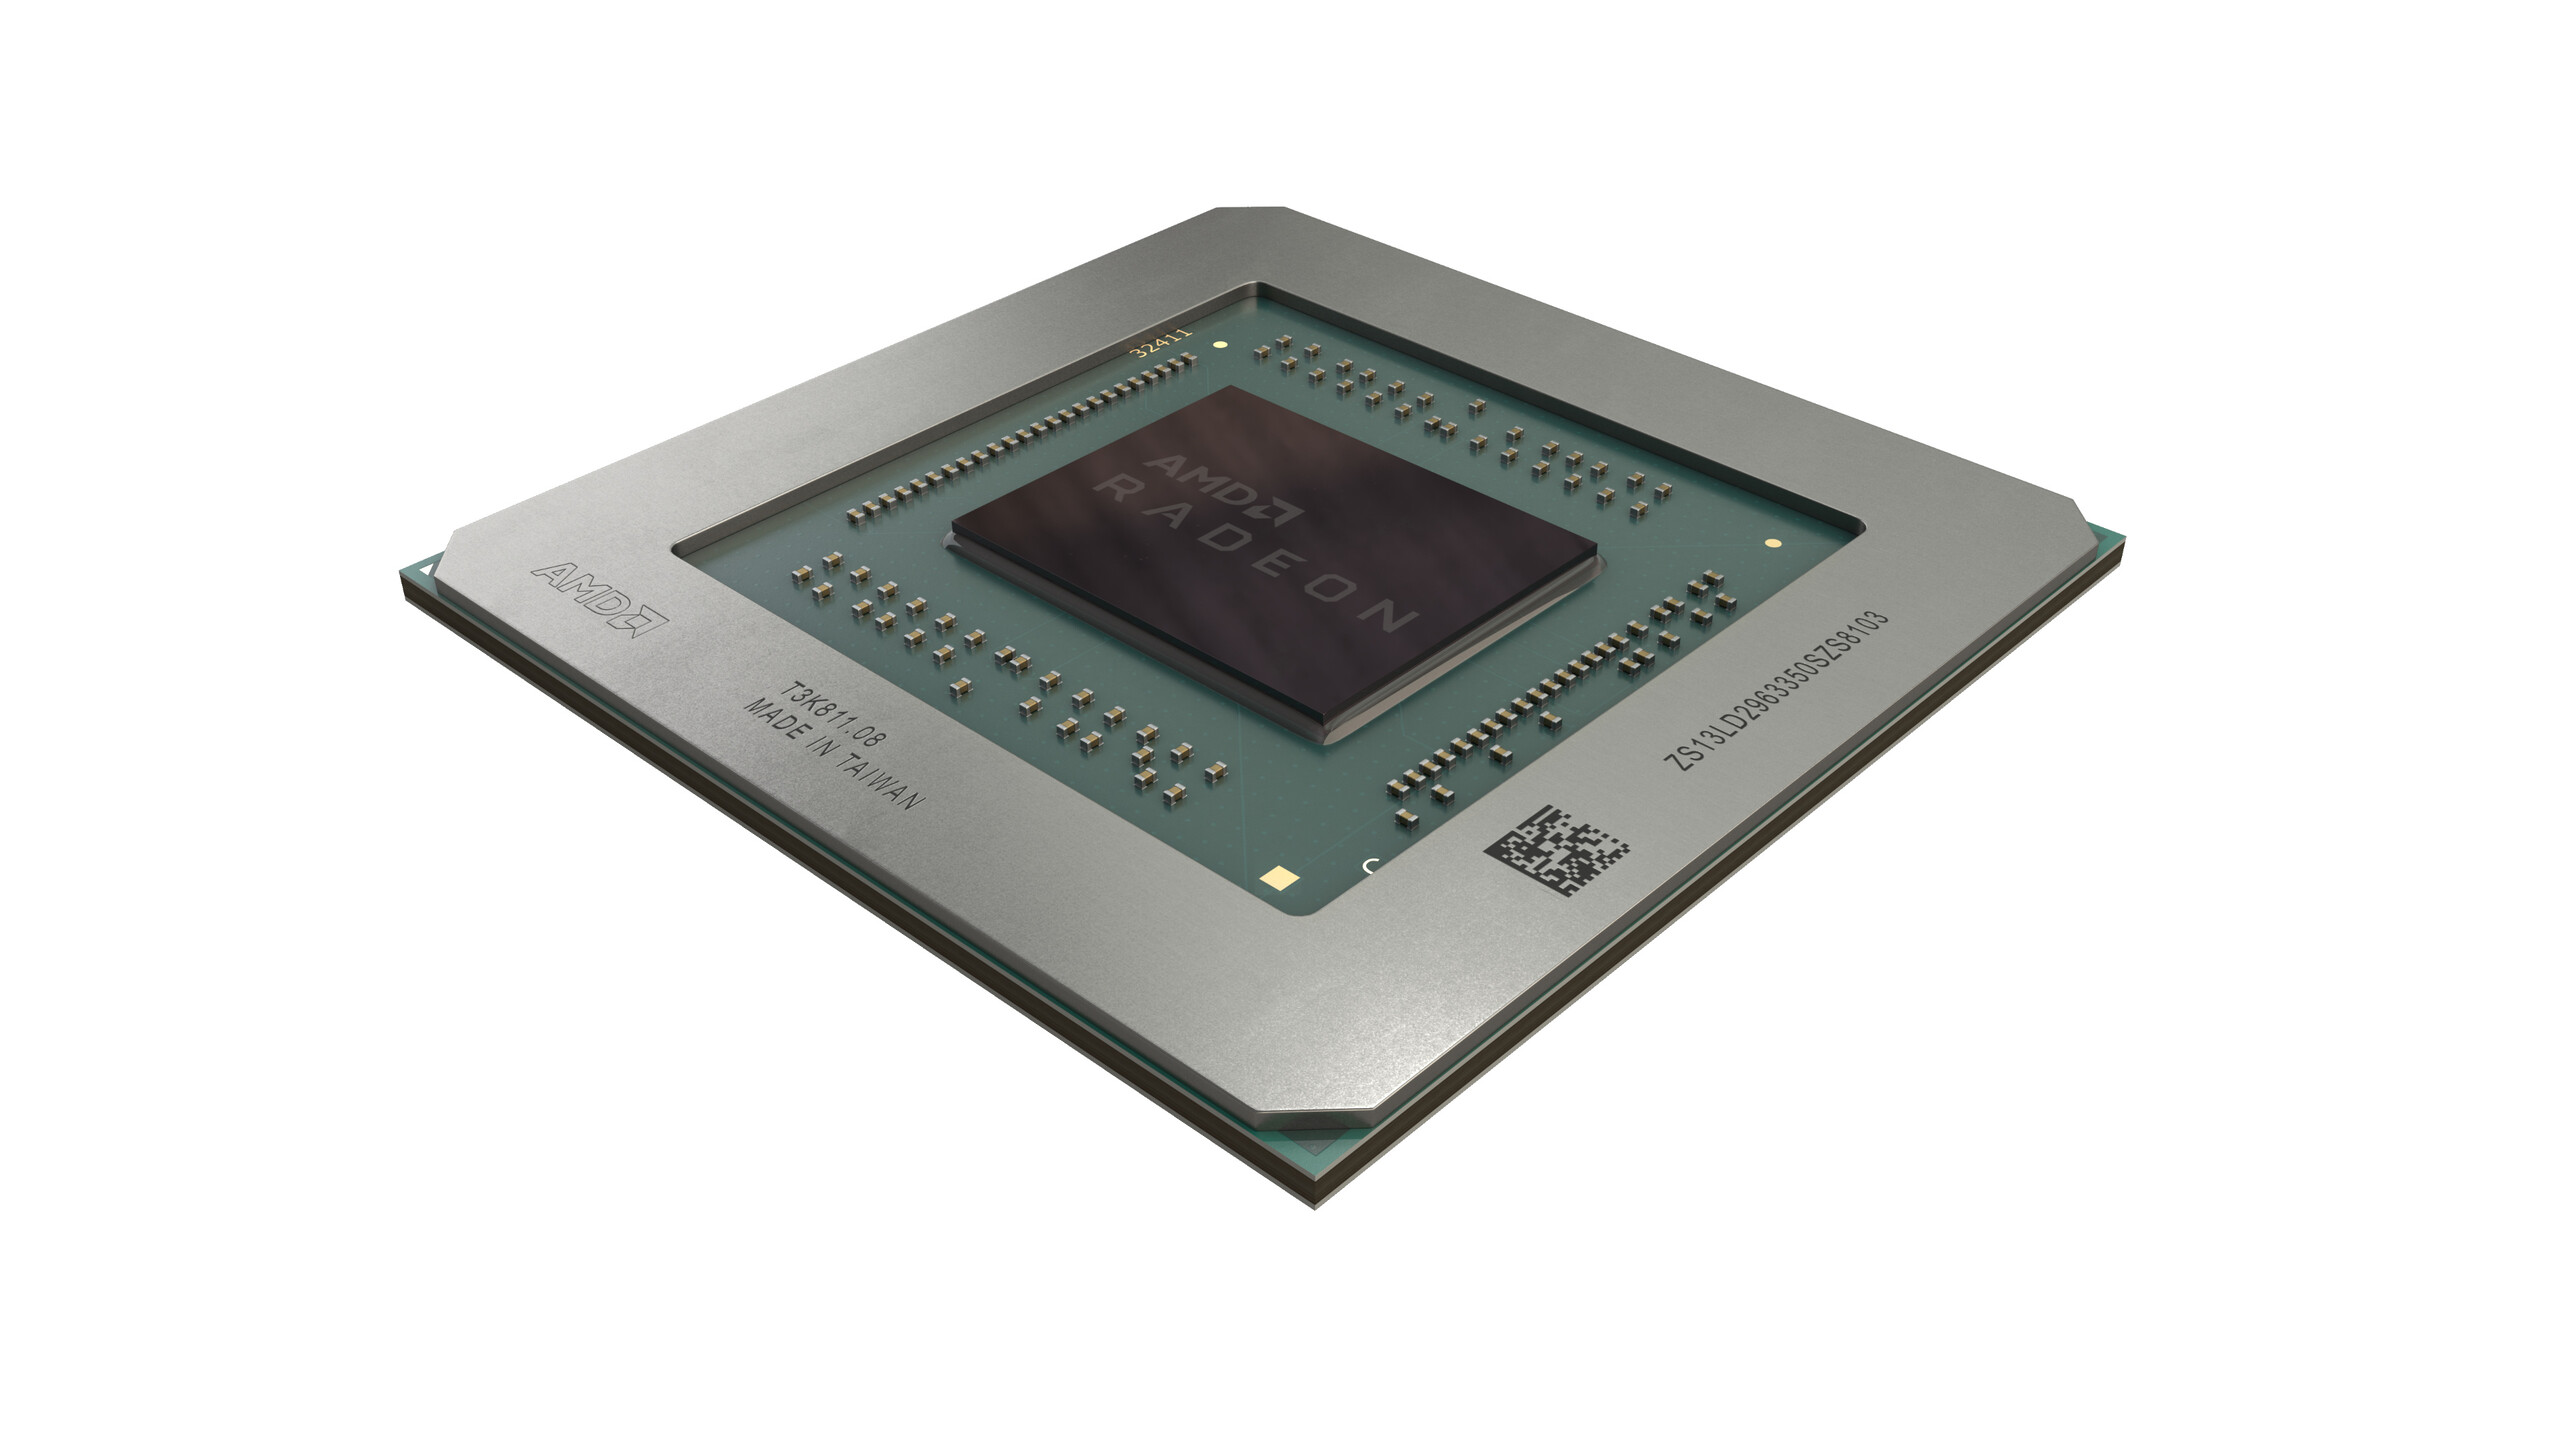
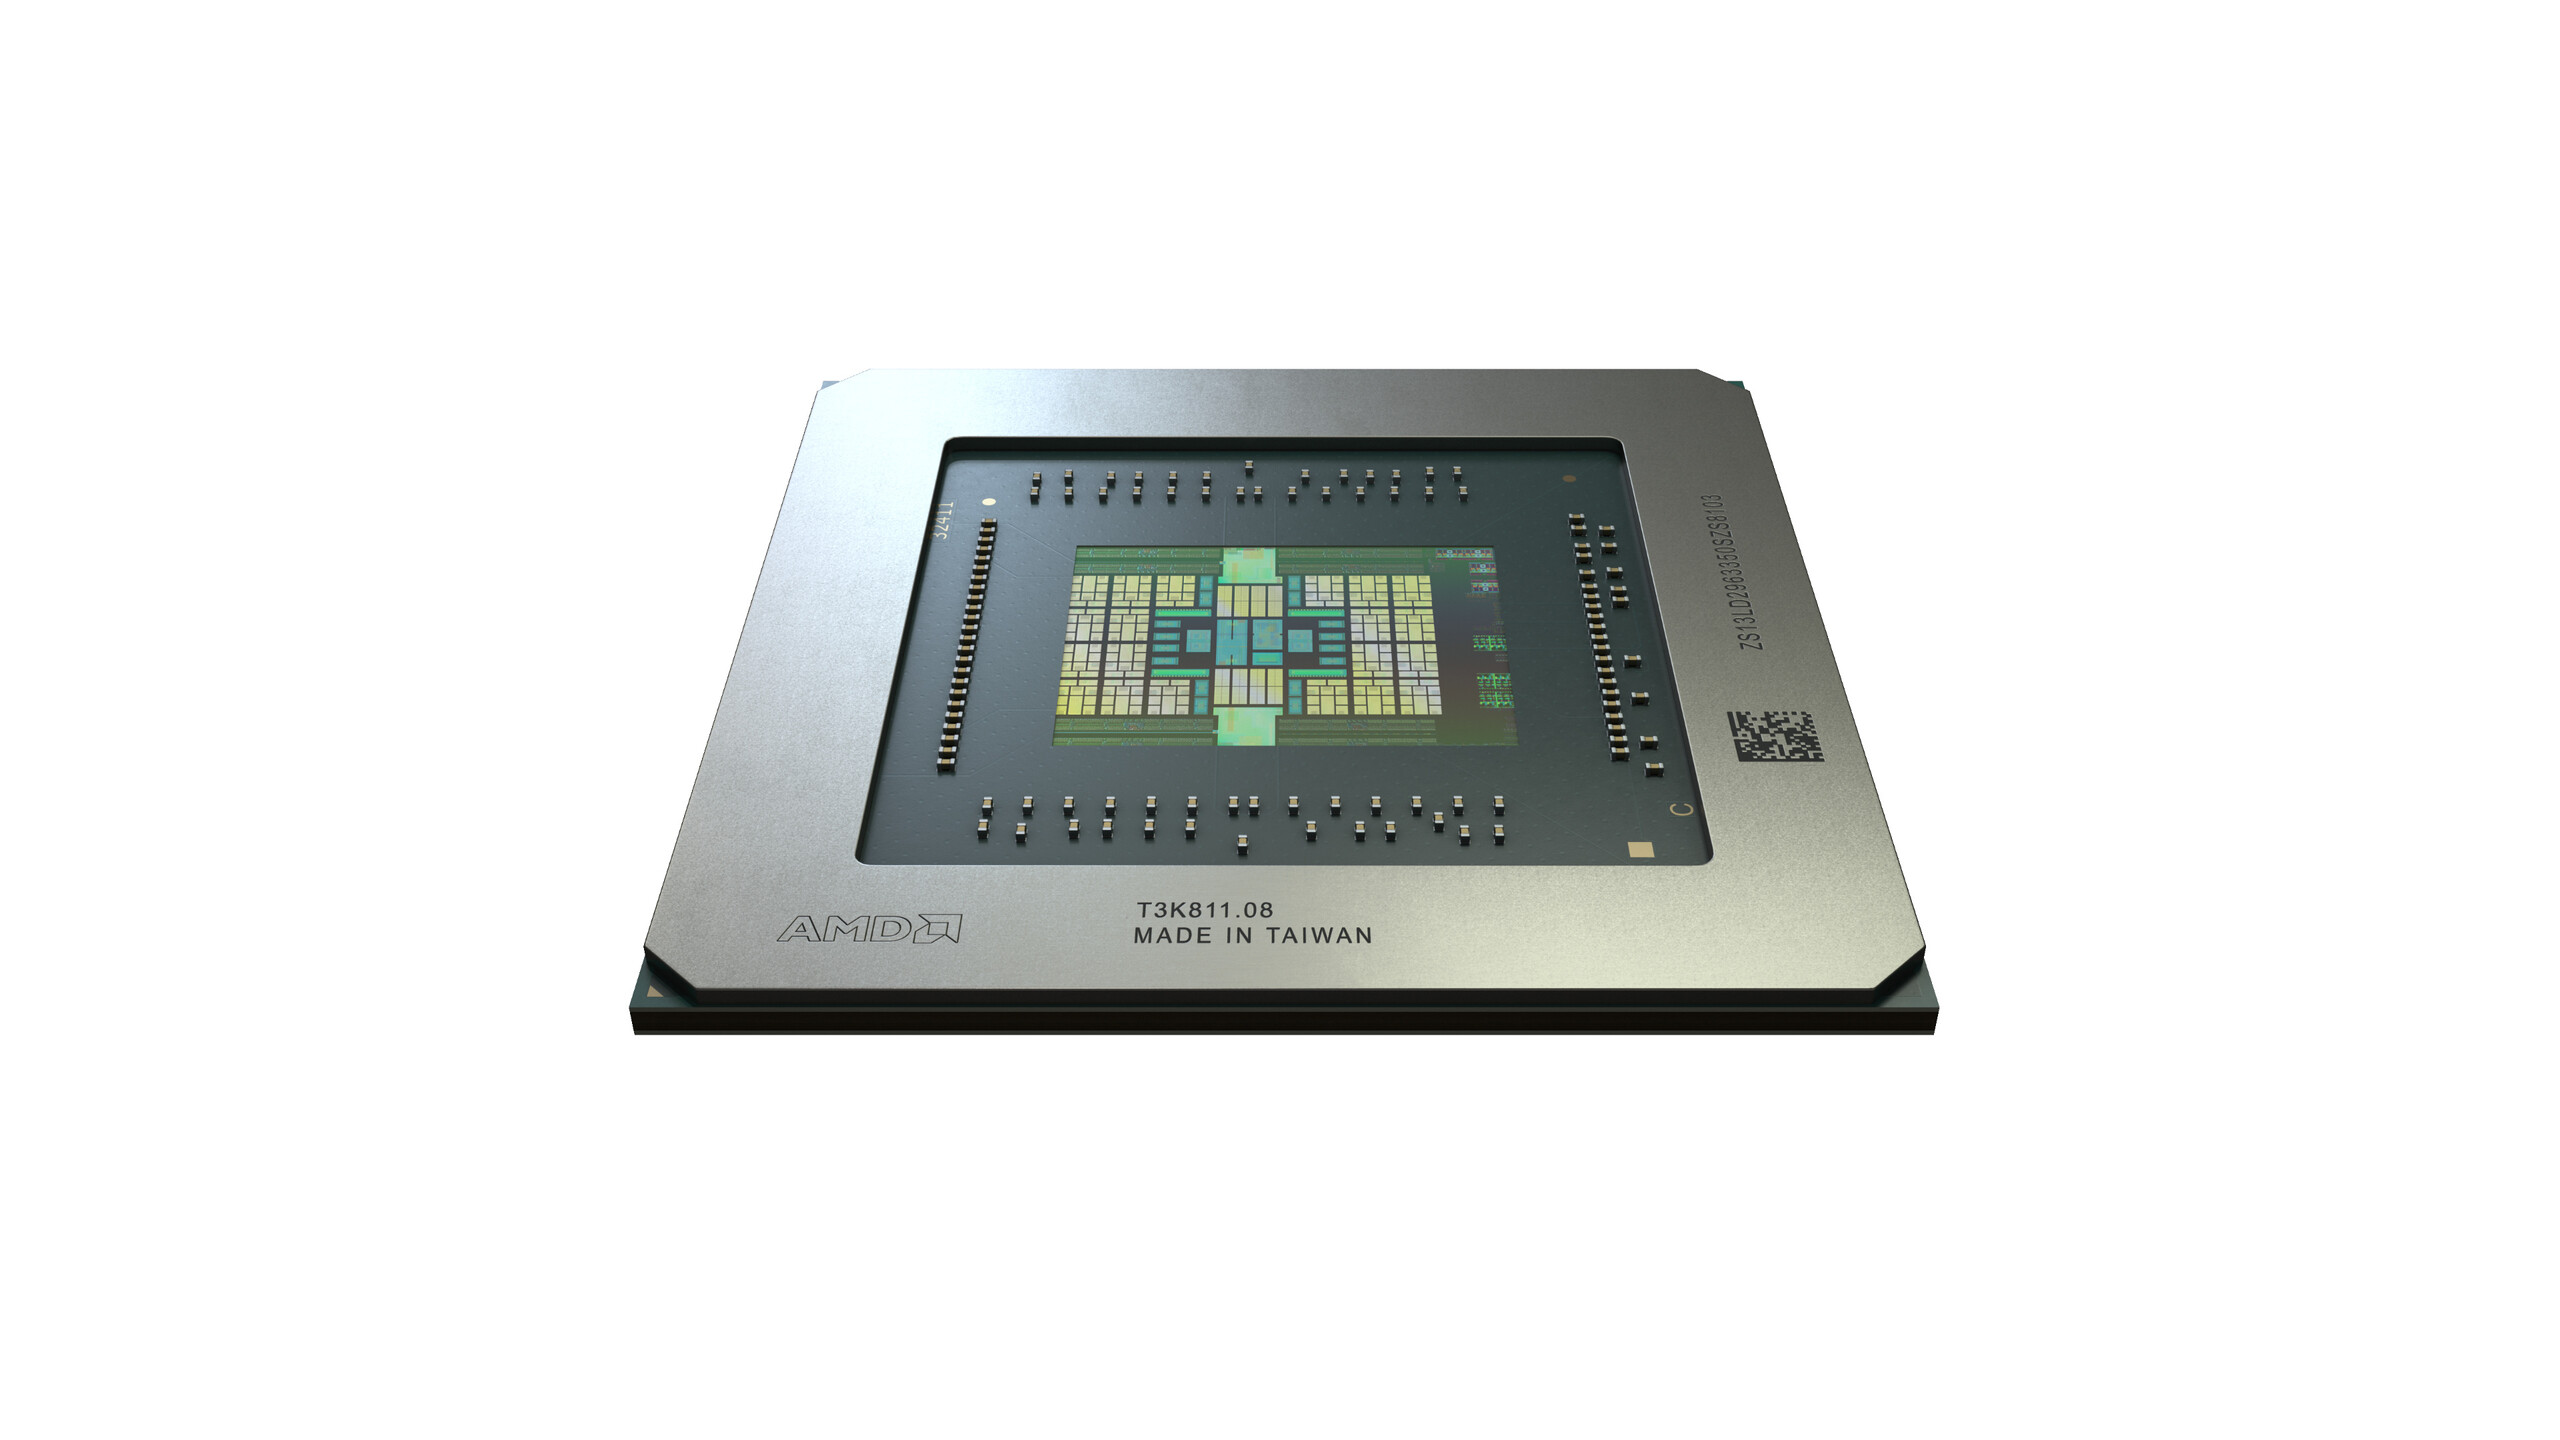
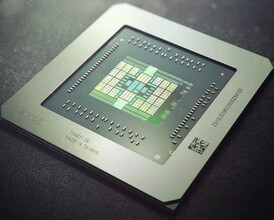
Navi key features (source: AMD) AMD Radeon RX 5700 specifications (source: AMD) Navi 10 chip design (source: AMD) AMD is heralding a new era in graphics card architecture with RDNA. The new architecture was developed from the ground up and optimized for performance and energy efficiency. With a structural width of only 7 nm, AMD continues the trend of pioneering technology. This applies to the PCI Express interface too since the 5700 series from AMD features the first GPUs to use PCI Express 4.0, which was an innovation with the introduction of the Ryzen 3000. This doubles the bandwidth so that more data can be transferred.
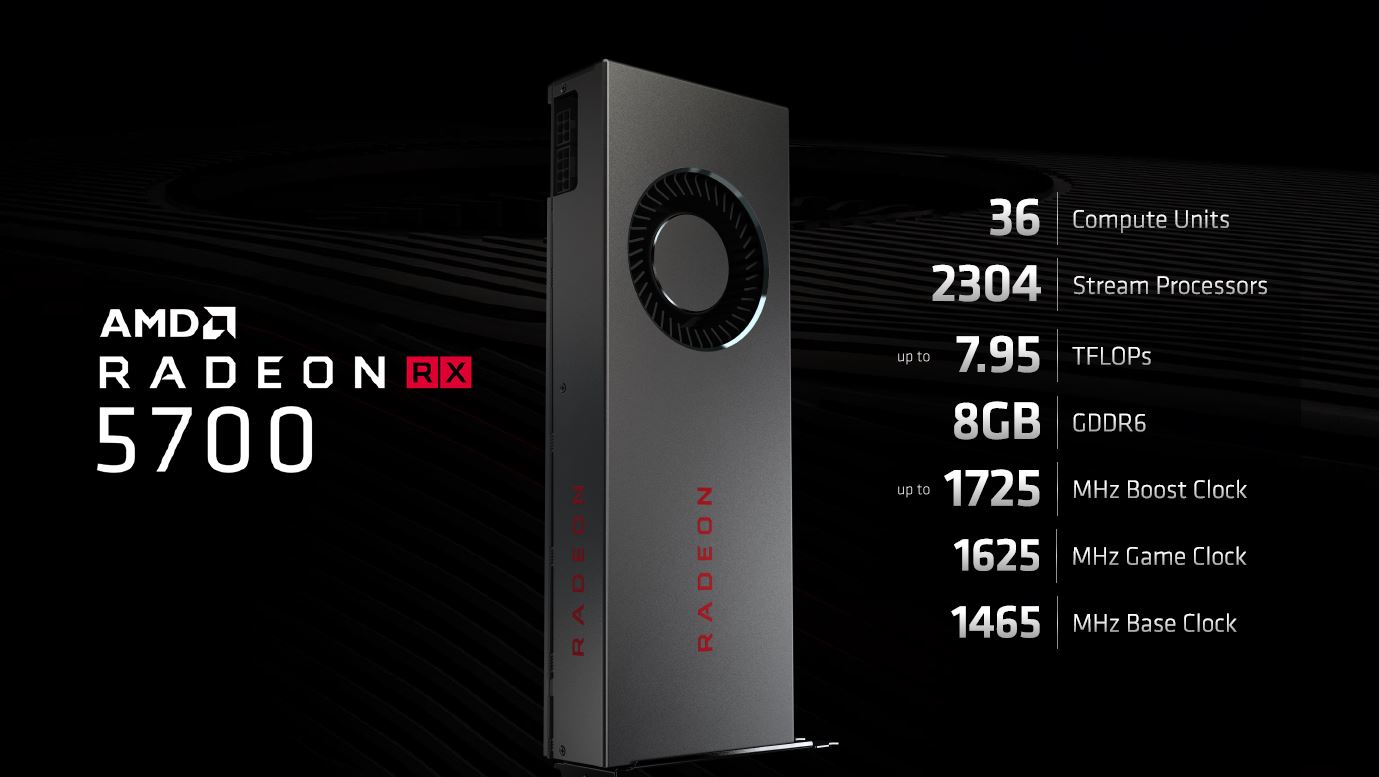
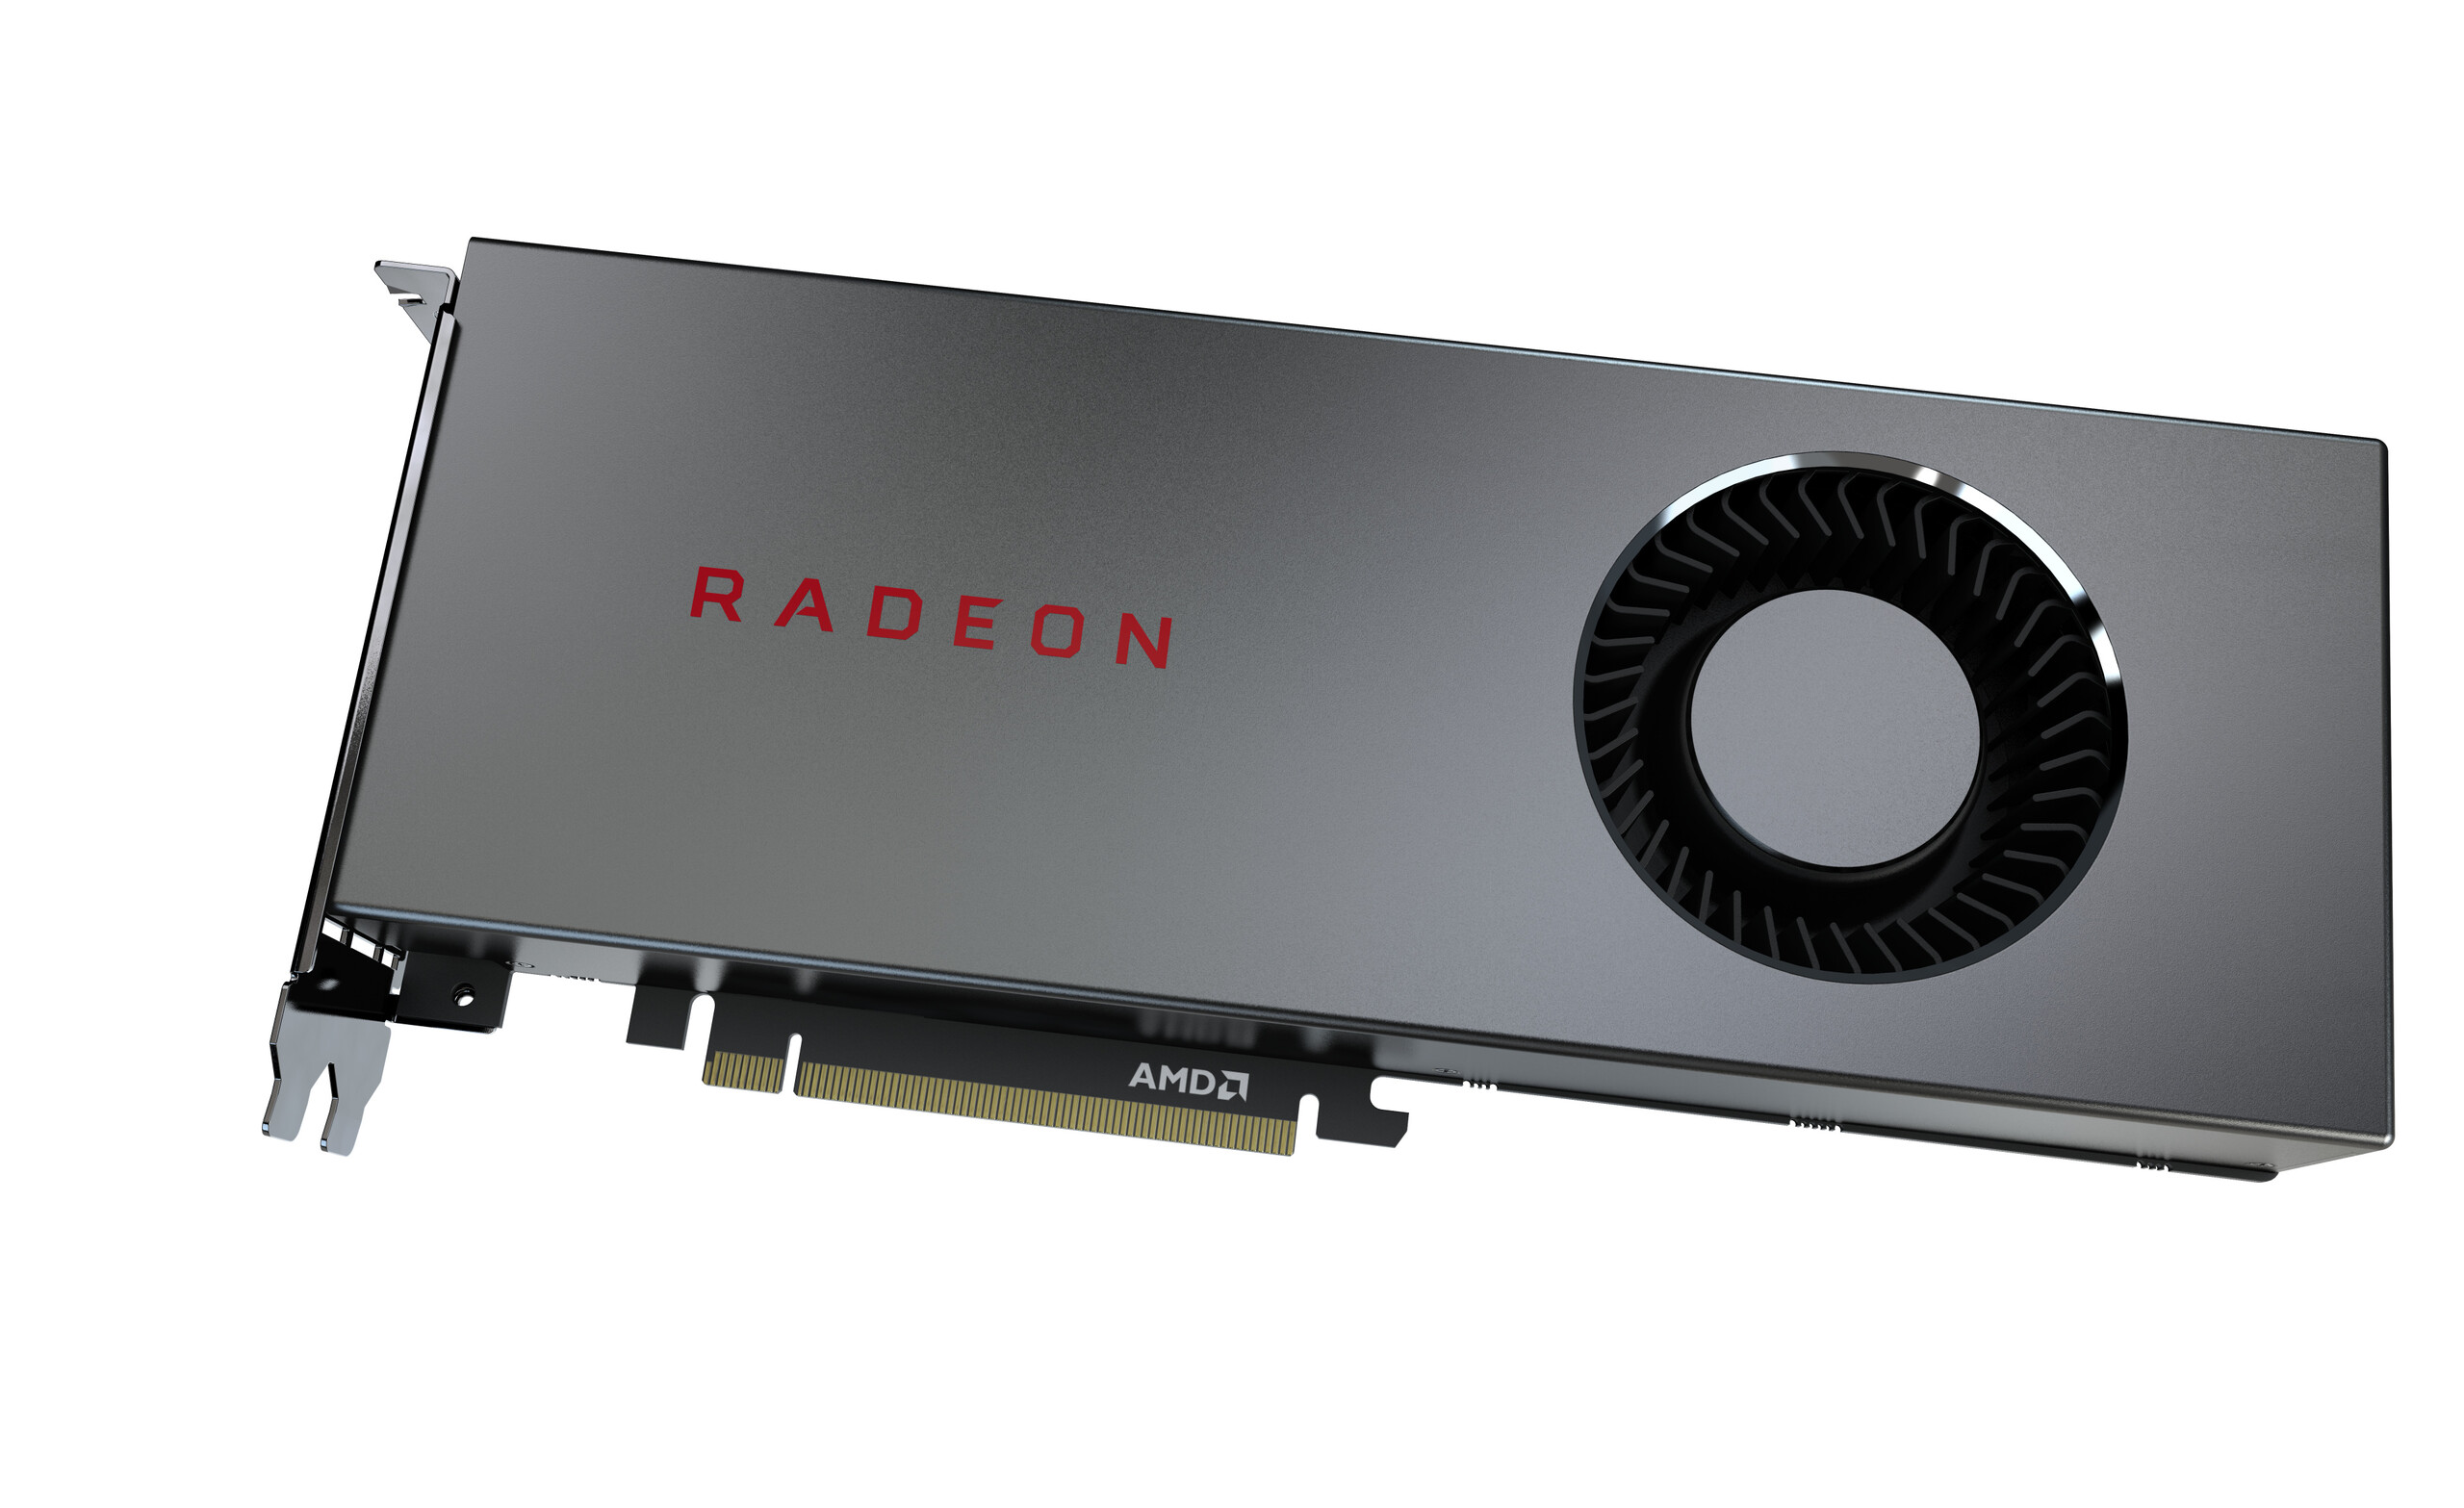
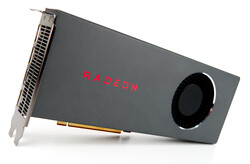
The Navi 10 graphics chip in the AMD Radeon RX 5700 is a weaker model since the complete version of the Navi 10 is found in the Radeon RX 5700 XT. With 2306 stream processors, the chip offers a bit more than the Nvidia RTX 2060S with the TU106 though. Both graphics cards are similar in terms of clock speeds because the biggest rival to the Radeon RX 5700 is the GeForce RTX 2060S. AMD has never really skimped on VRAM, and so we find 8 GB GDDR6 RAM in the new Navi cards too.
In terms of energy consumption, AMD especially wanted and needed to improve since the somewhat similarly fast AMD Radeon RX Vega 64 doesn't offer a good energy balance with its high TDP of about 300 watts. The panorama is very different if you look at the technical specifications of the RX 5700. With 180 watts, the AMD graphics card ranks on the same level as the competing model from Nvidia. We will discuss later whether this proved to be true in our review.
If you want to buy an RX 5700 model from AMD, you should expect to spend around 370 Euros (~$412) with taxes included. The RX 5700 is in this way a bit less expensive than the GeForce RTX 2060S Founders Edition (419 Euros, ~$466).
Specifications
AMD Radeon RX 5700 AMD Radeon RX 5700 XT
AMD Radeon VII
RX Vega 64
RTX 2060
RTX 2060S
RTX 2070
RTX 2070S
Chip
Navi 10 Navi 10
Vega 20
Vega 10
TU106
TU106
TU106
TU104
Manufactured
7 nm 7 nm
7 nm
14 nm
12 nm
12 nm
12 nm
12 nm
Shader
2304 2560
3840
4096
1920
2176
2304
2560
Texture Units
144 160
240
256
120
136
144
160
Tensor Cores
- -
-
-
240
272
288
320
RT Cores
- -
-
-
30
34
36
40
GPU Base Clock
1465 MHz 1605 MHz
1400 MHz
1200 MHz
1365 MHz
1470 MHz
1410 MHz
1605 MHz
GPU Boost Clock
1625 MHz 1755 MHz
1750 MHz
1536 MHz
1680 MHz
1650 MHz
1620 MHz
1770 MHz
Memory Bus
256 Bit 256 Bit
4096 Bit
2048 Bit
192 Bit
256 Bit
256 Bit
256 Bit
Memory Bandwidth
448 GB/s 448 GB/s
1024 GB/s
483.8 GB/s
336 GB/s
448 GB/s
448 GB/s
448 GB/s
Memory Size
8 GB GDDR6 8 GB GDDR6
16 GB HBM2
8 GB HBM2
6 GB GDDR6
8 GB GDDR6
8 GB GDDR6
8 GB GDDR6
Power (W)
180 W 225 W
295 W
295 W
160 W
175 W
175 W
215 W
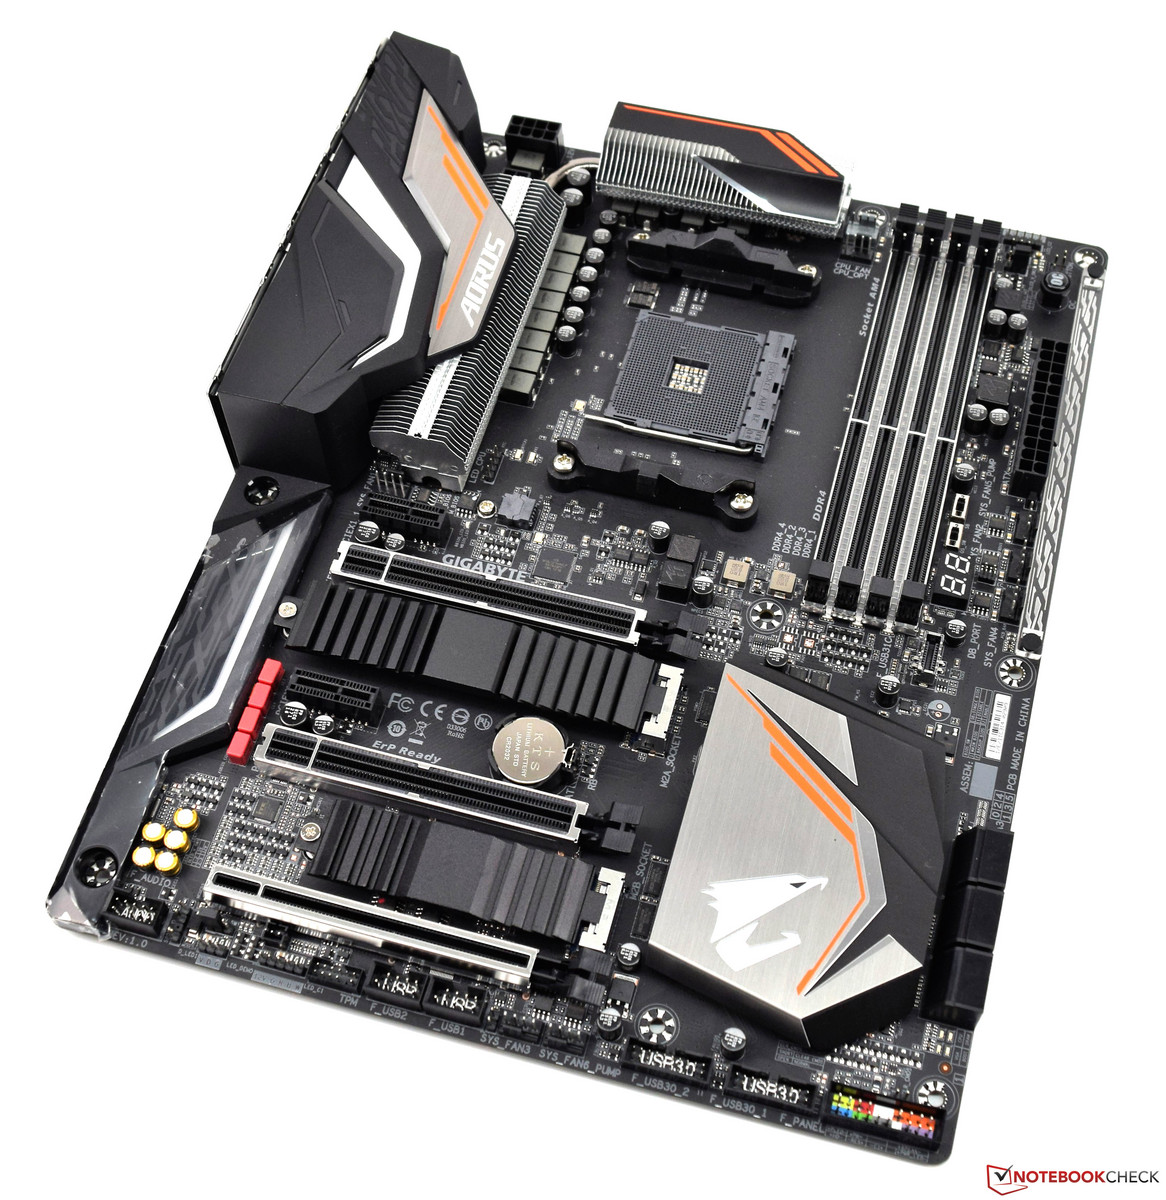
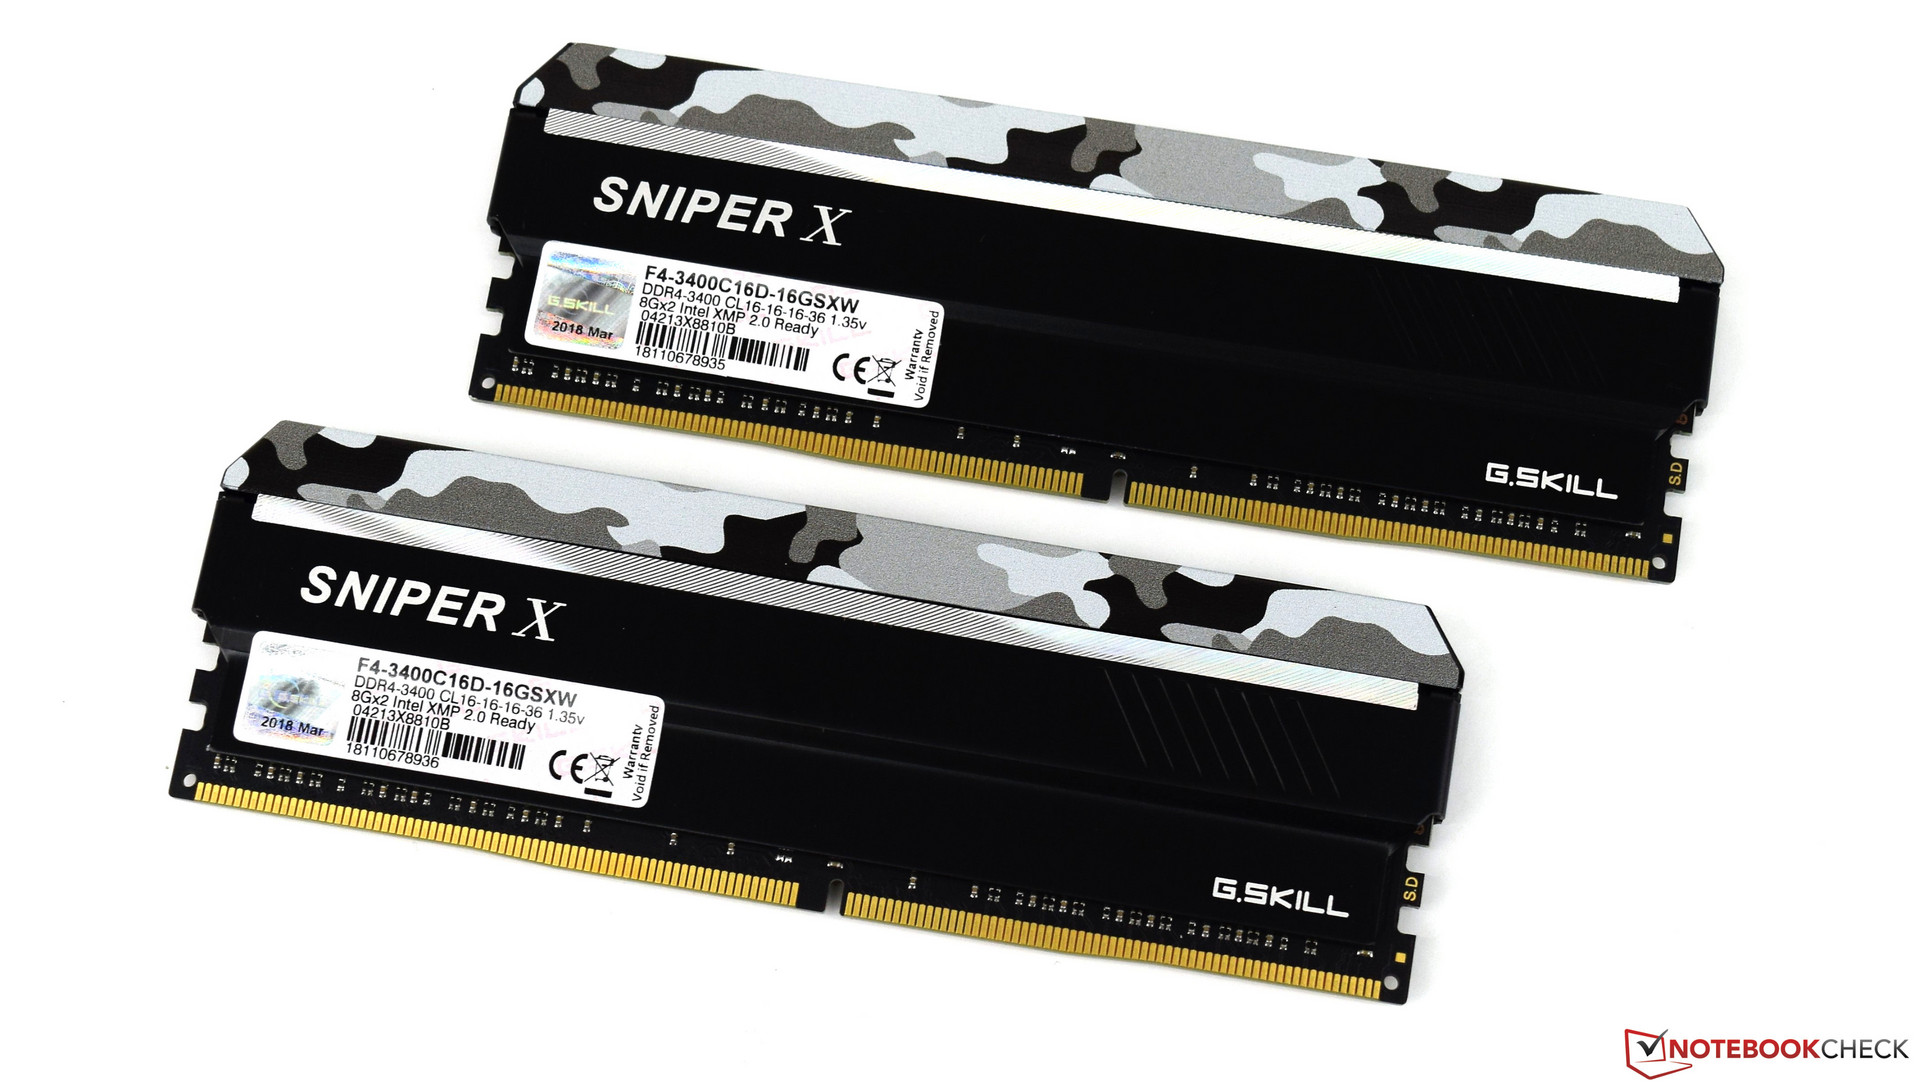
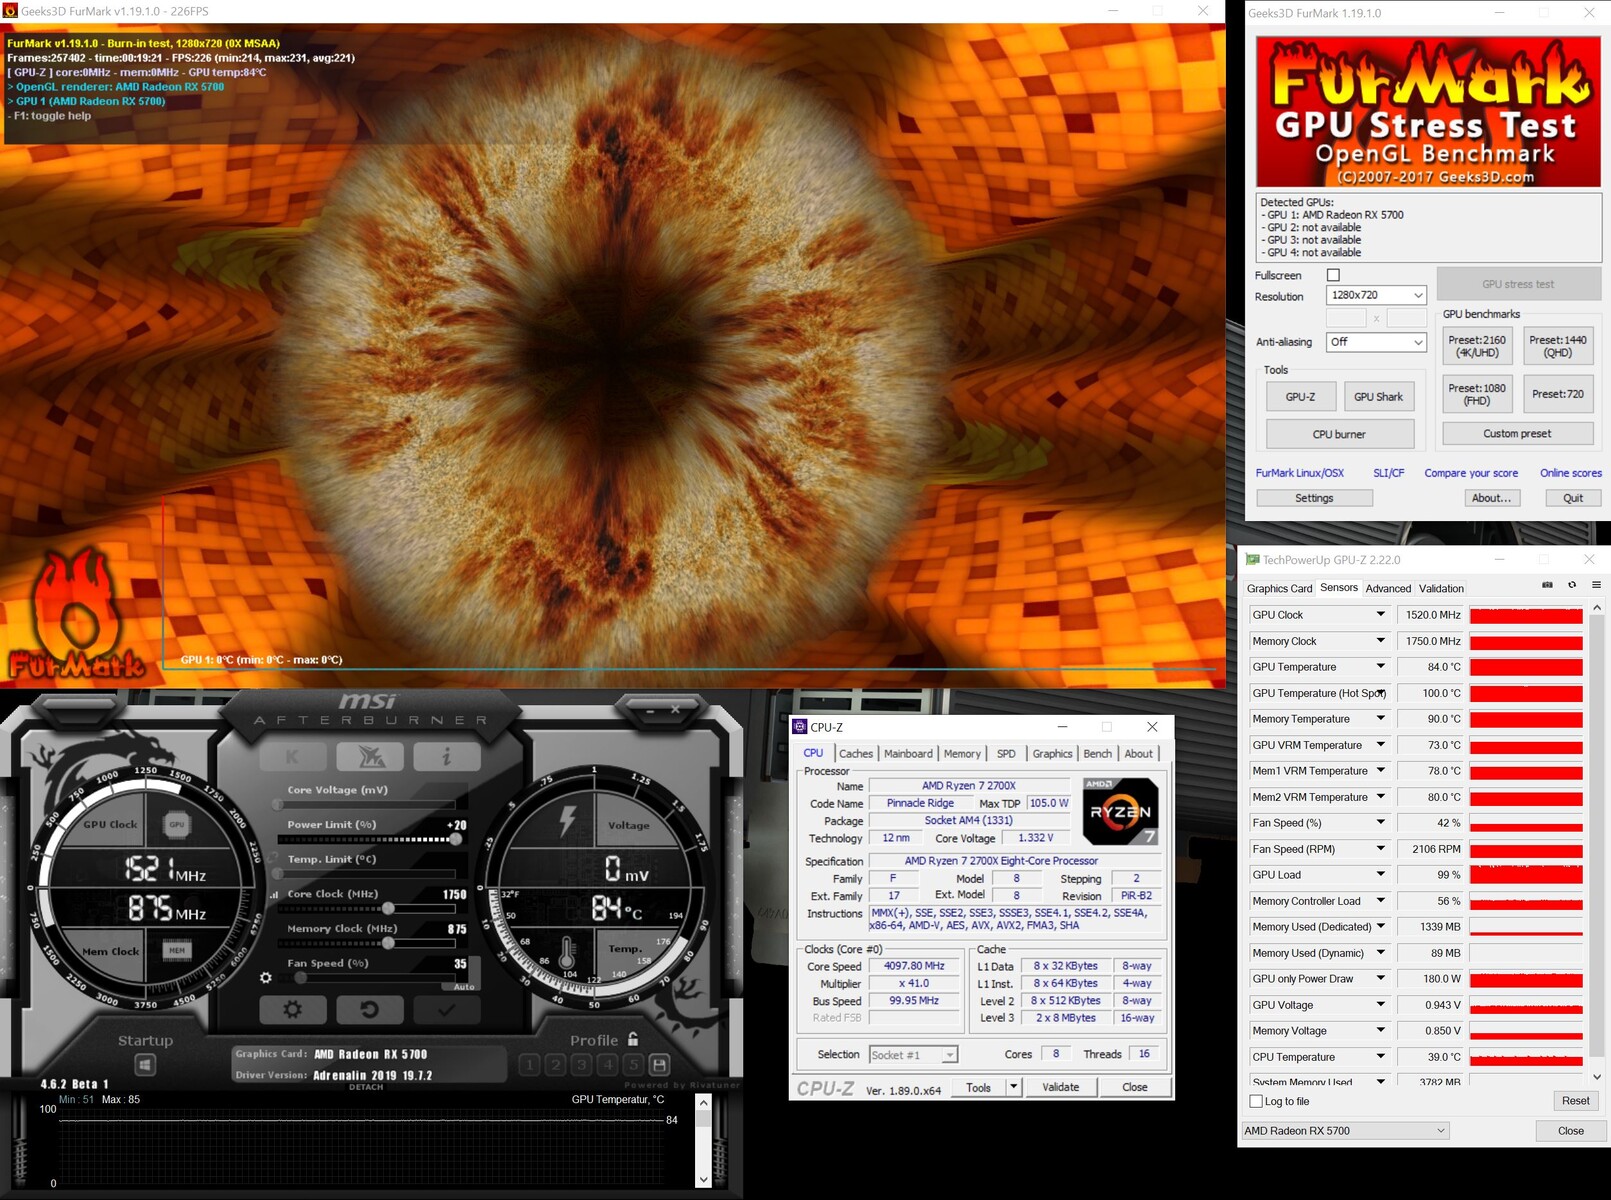
Gigabyte X470 Aorus Gaming 7 Wi-Fi. The CPU, an AMD Ryzen 7 2700X , provides good CPU performance, and we used an AIO (Be Quiet Silent Loop 280mm) for cooling. The 16 GB RAM comes from G-Skill and has a speed of 3400 MHz. We used the Acer Predator XB321HK as monitor. We don't have any limitations with it due to its UHD capability. A big thank you goes to AMD at this point for providing the test platform.
We made a deliberate choice not to use an X570 platform including a Ryzen 3900X so as not to alter the test conditions compared to the Nvidia Super graphics card.
Case
Corsair Carbide Air 540 ATX Cube
CPU
AMD Ryzen 7 2700X
CPU cooler
Be Quiet Silent Loop 280mm
RAM
G-Skill Sniper X 16 GB DDR4 3400 MHz
Mainboard
Gigabyte X470 Aorus Gaming 7 Wi-Fi
Monitor
Acer Predator XB321HK 4K
SSD
ADATA SP900 M.2 SSD 256 GB (system)
SSD
Western Digital PC SN720 NVMe SSD 512 GB (for games)
SSD
Crucial MX500 2 TB (for games)
Operating system
Microsoft Windows 10 Professional 64-Bit (version 1903)
AMD drivers
Adrenalin 19.7.2 (date: 07/20/2019)
AMD Radeon RX 5700 specifications (source: AMD) As can be gathered from the image on the right side, AMD provides three different clock speeds for the Radeon RX 5700. The base frequency of the smaller Navi 10 GPU is 1465 MHz, while the maximum boost frequency is 1725 MHz. AMD also gives the game frequency now, which can be expected when gaming. This is an average value since the full boost isn't reached all the time. In this way, the game frequency for the RX 5700 is 1625 MHz.
Regarding VRAM, AMD chose GDDR6 for the first time. Although using HBM2 would be possible, AMD went with the lower priced solution. That's good and also easy on the wallet. AMD isn't at a disadvantage here in comparison to Nvidia since the RTX 2060S is equipped with the same VRAM. They both have the same clock speeds of 7000 MHz too. The memory bandwidth is therefore 448 GB/s. In contrast to the RX Vega 64 with 483.8 GB/s, this is a drawback that can be accepted. The significantly higher production costs wouldn't have any relationship with the little increase in performance.
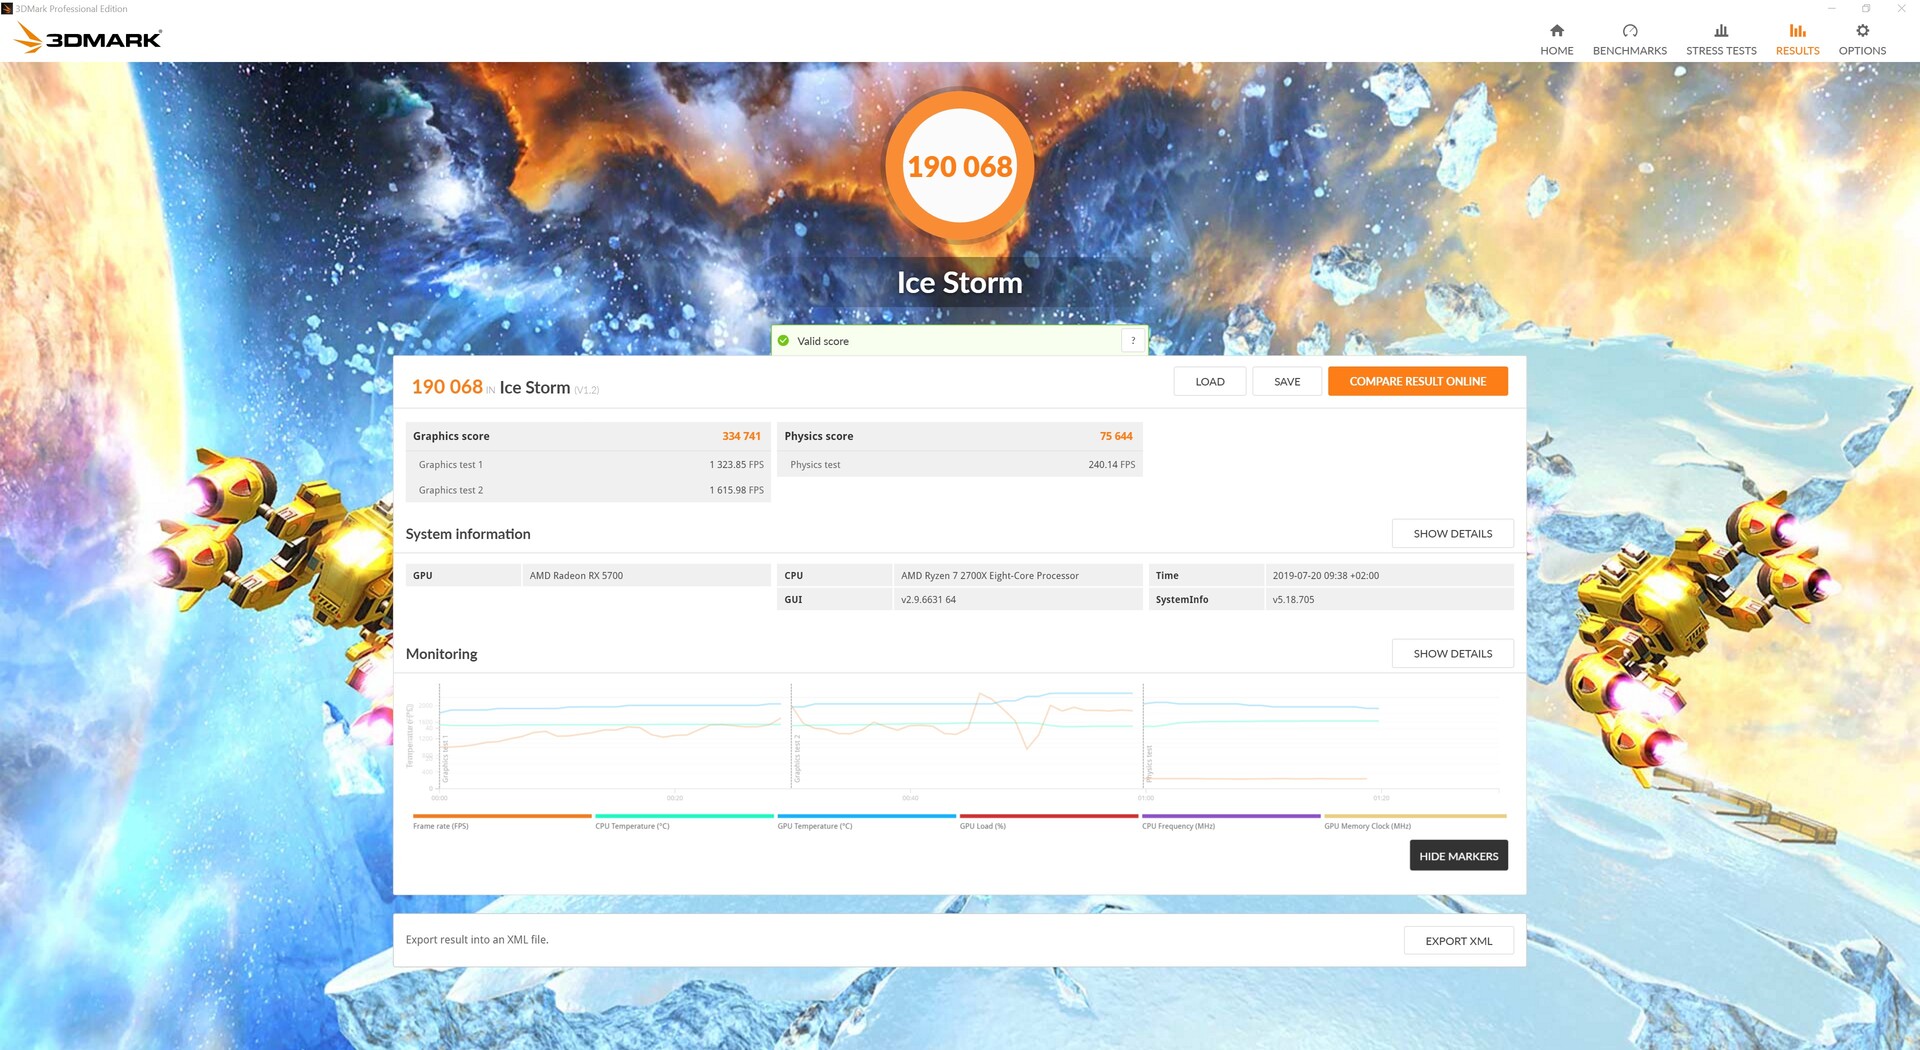
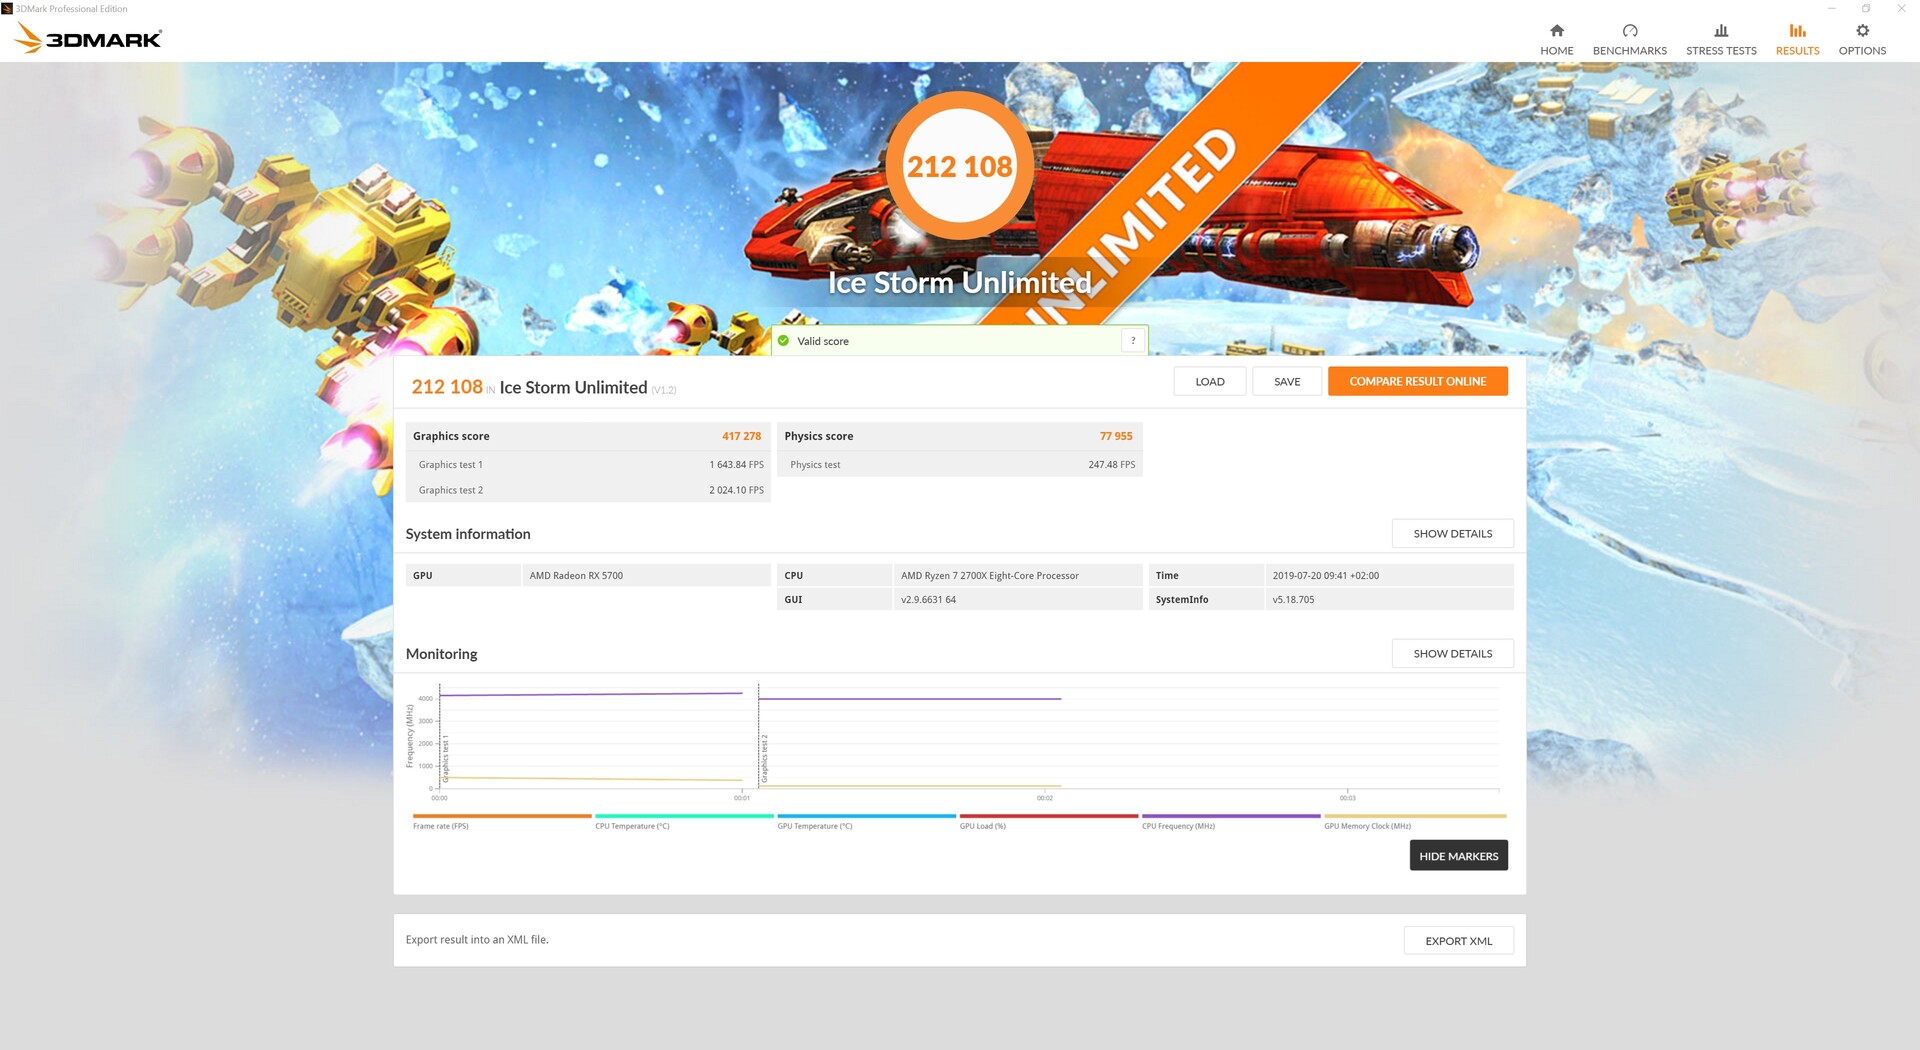
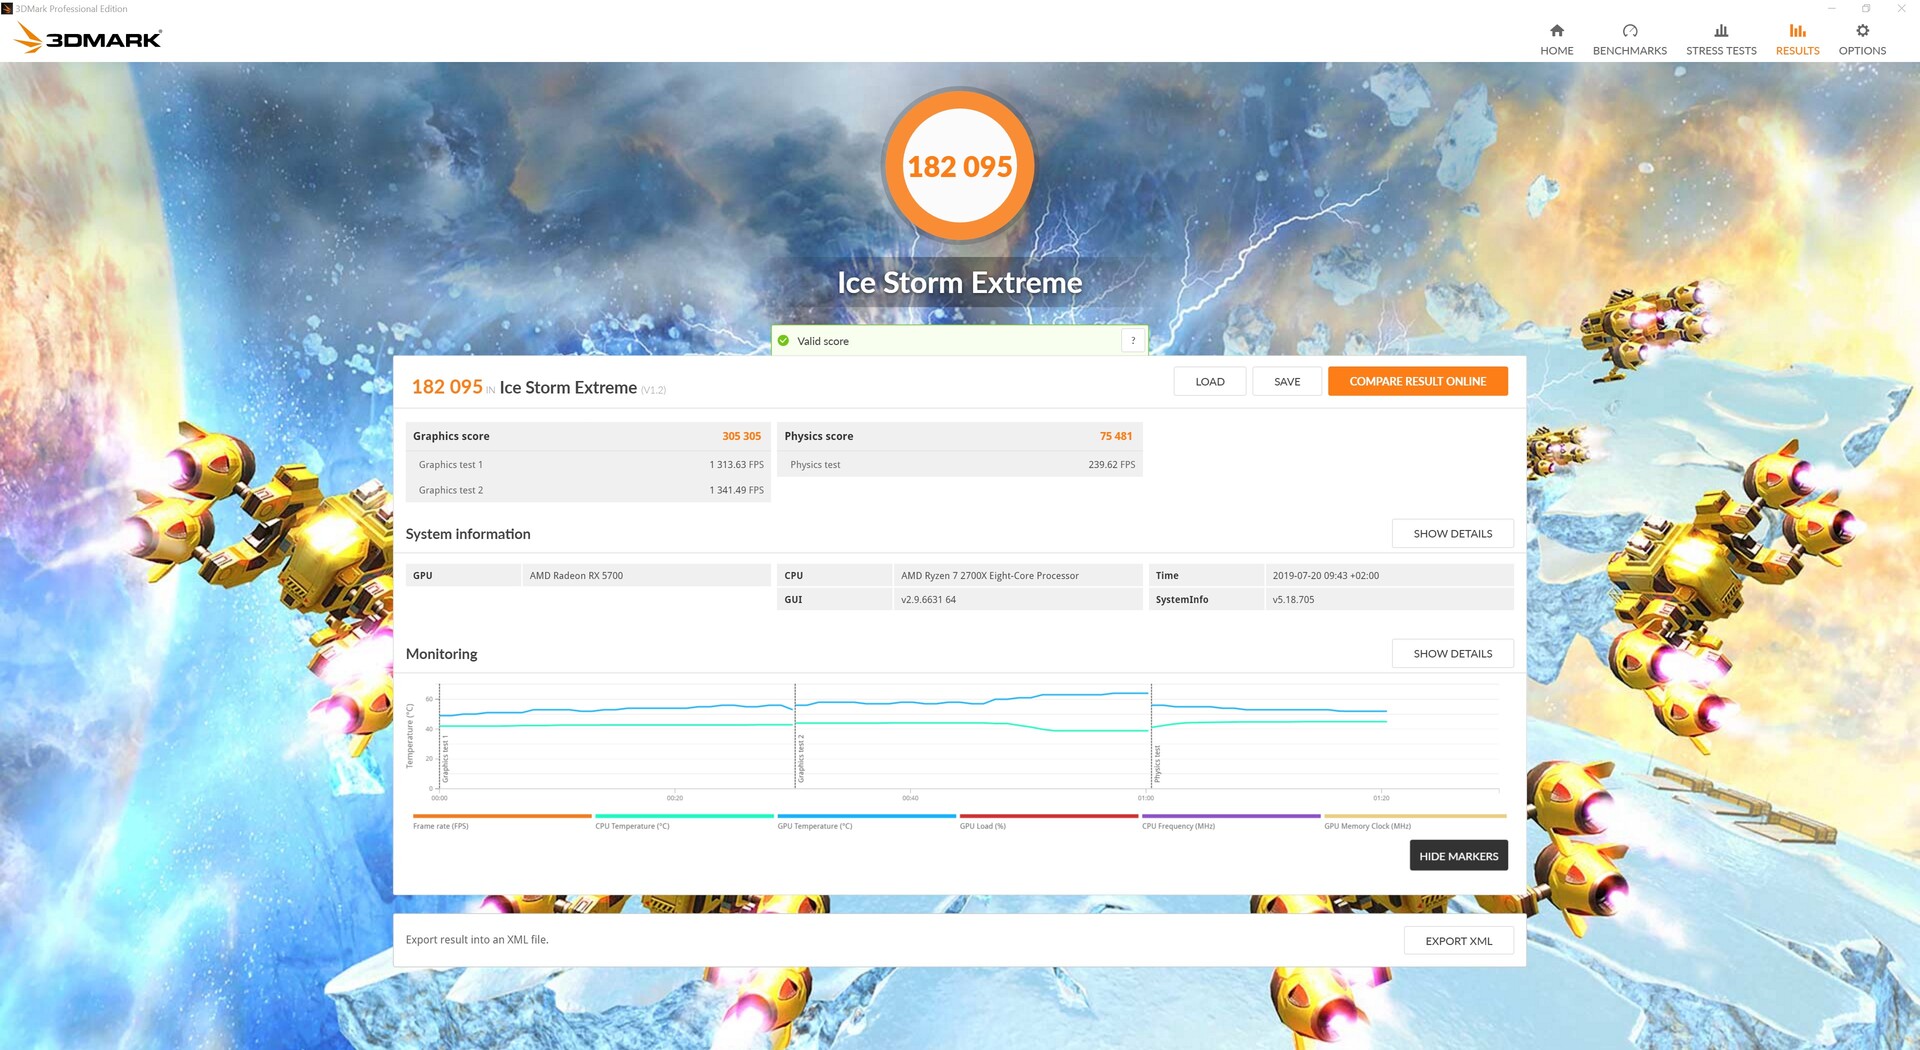
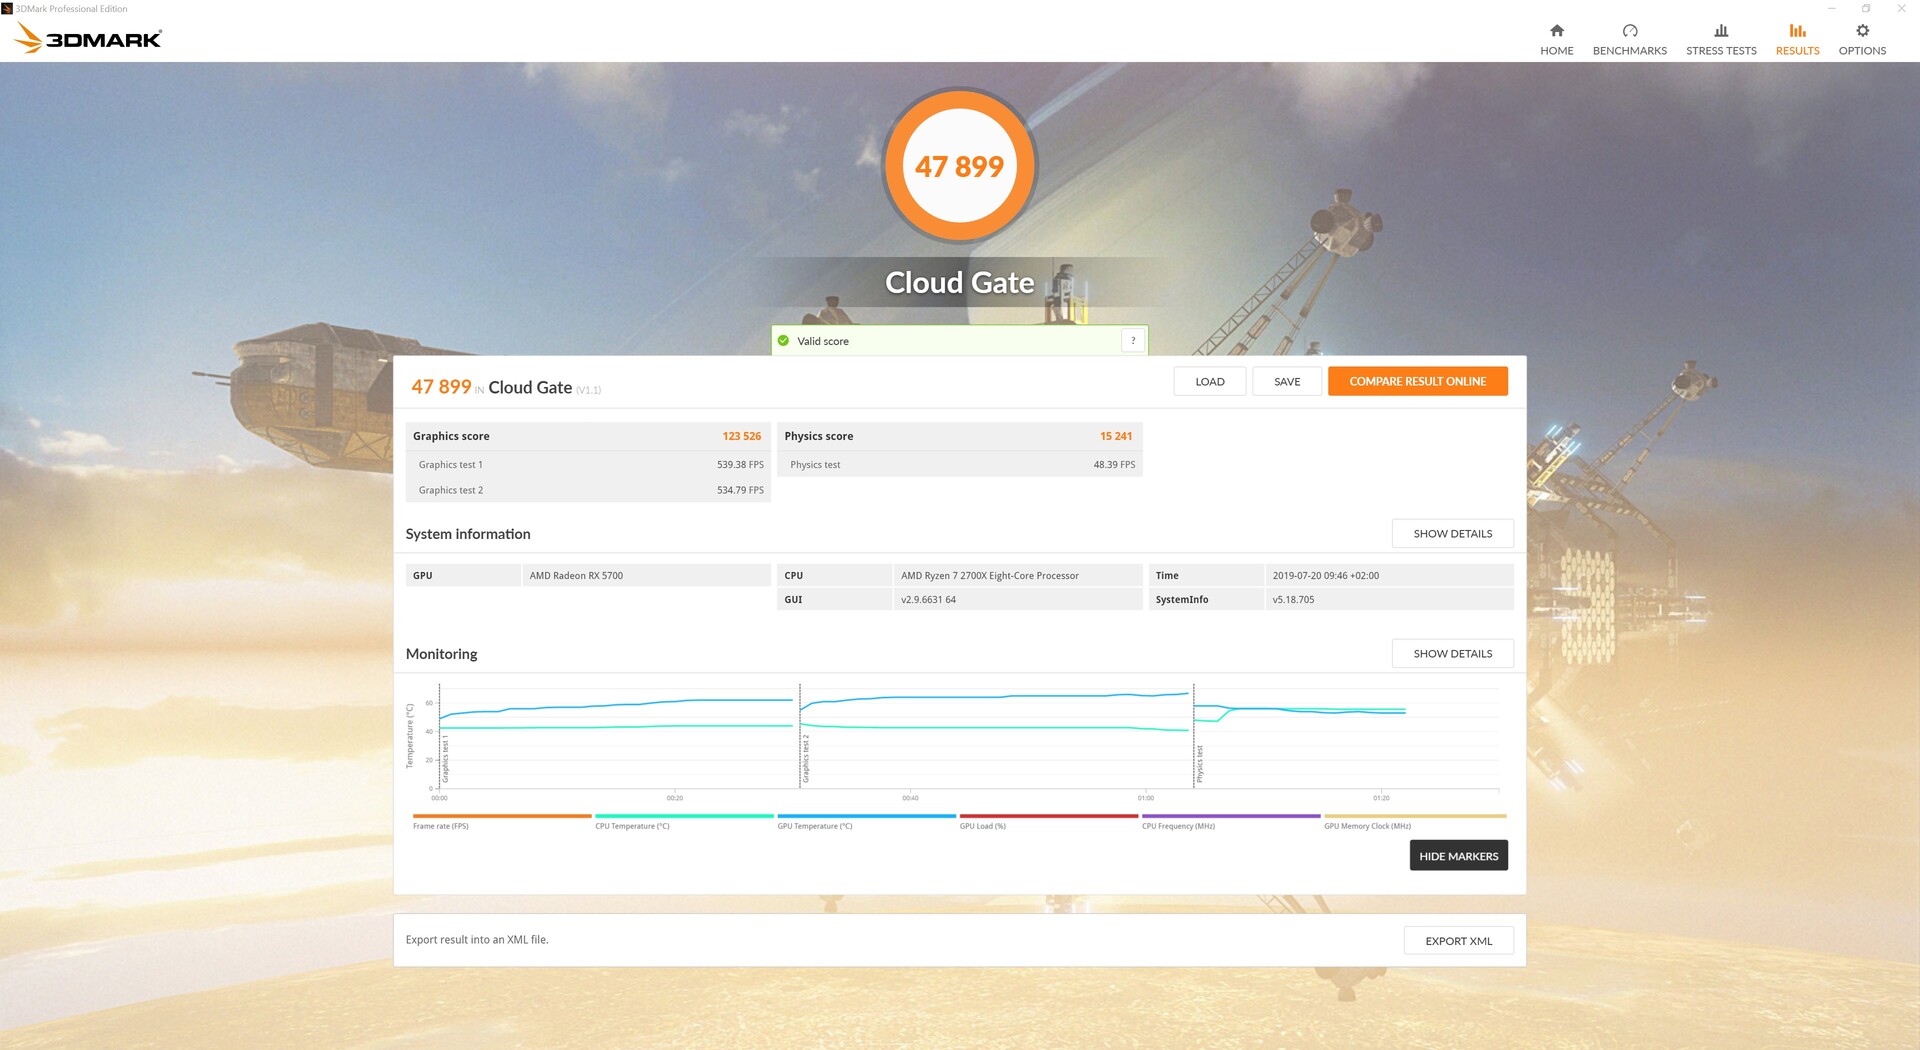
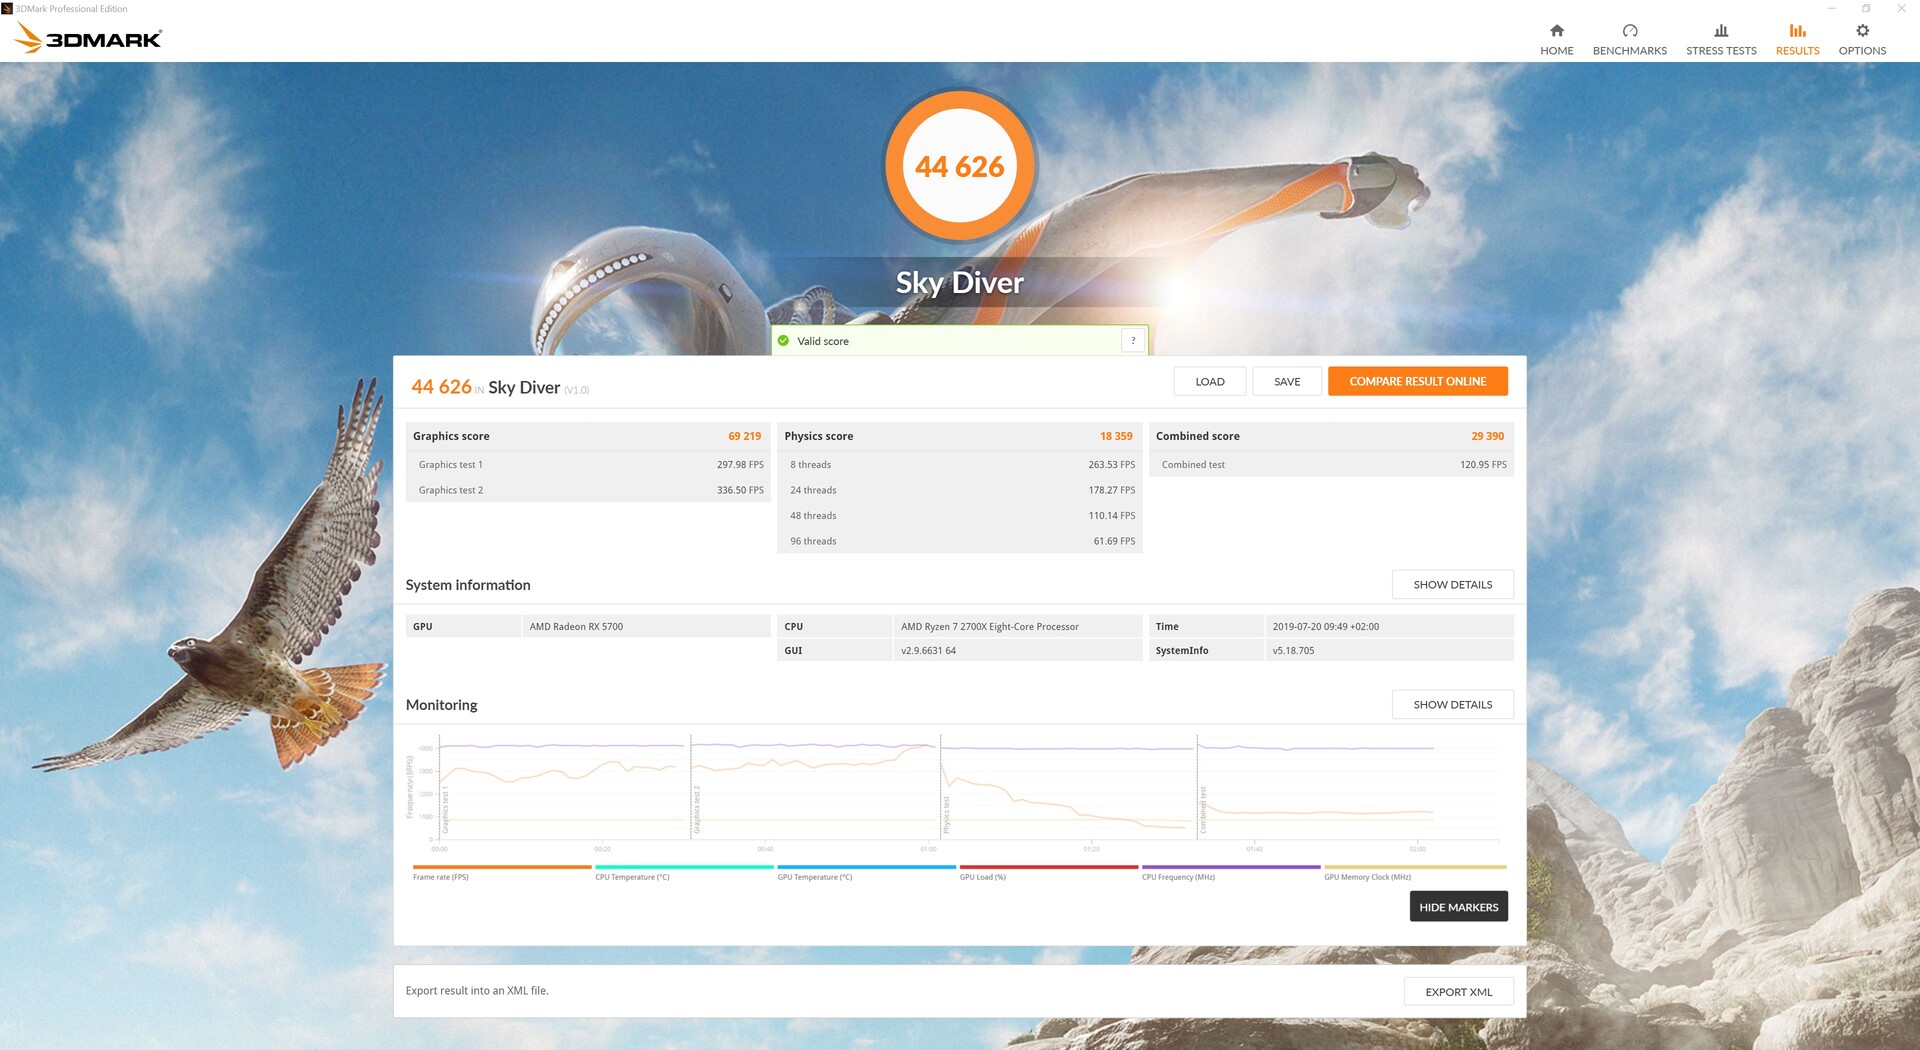
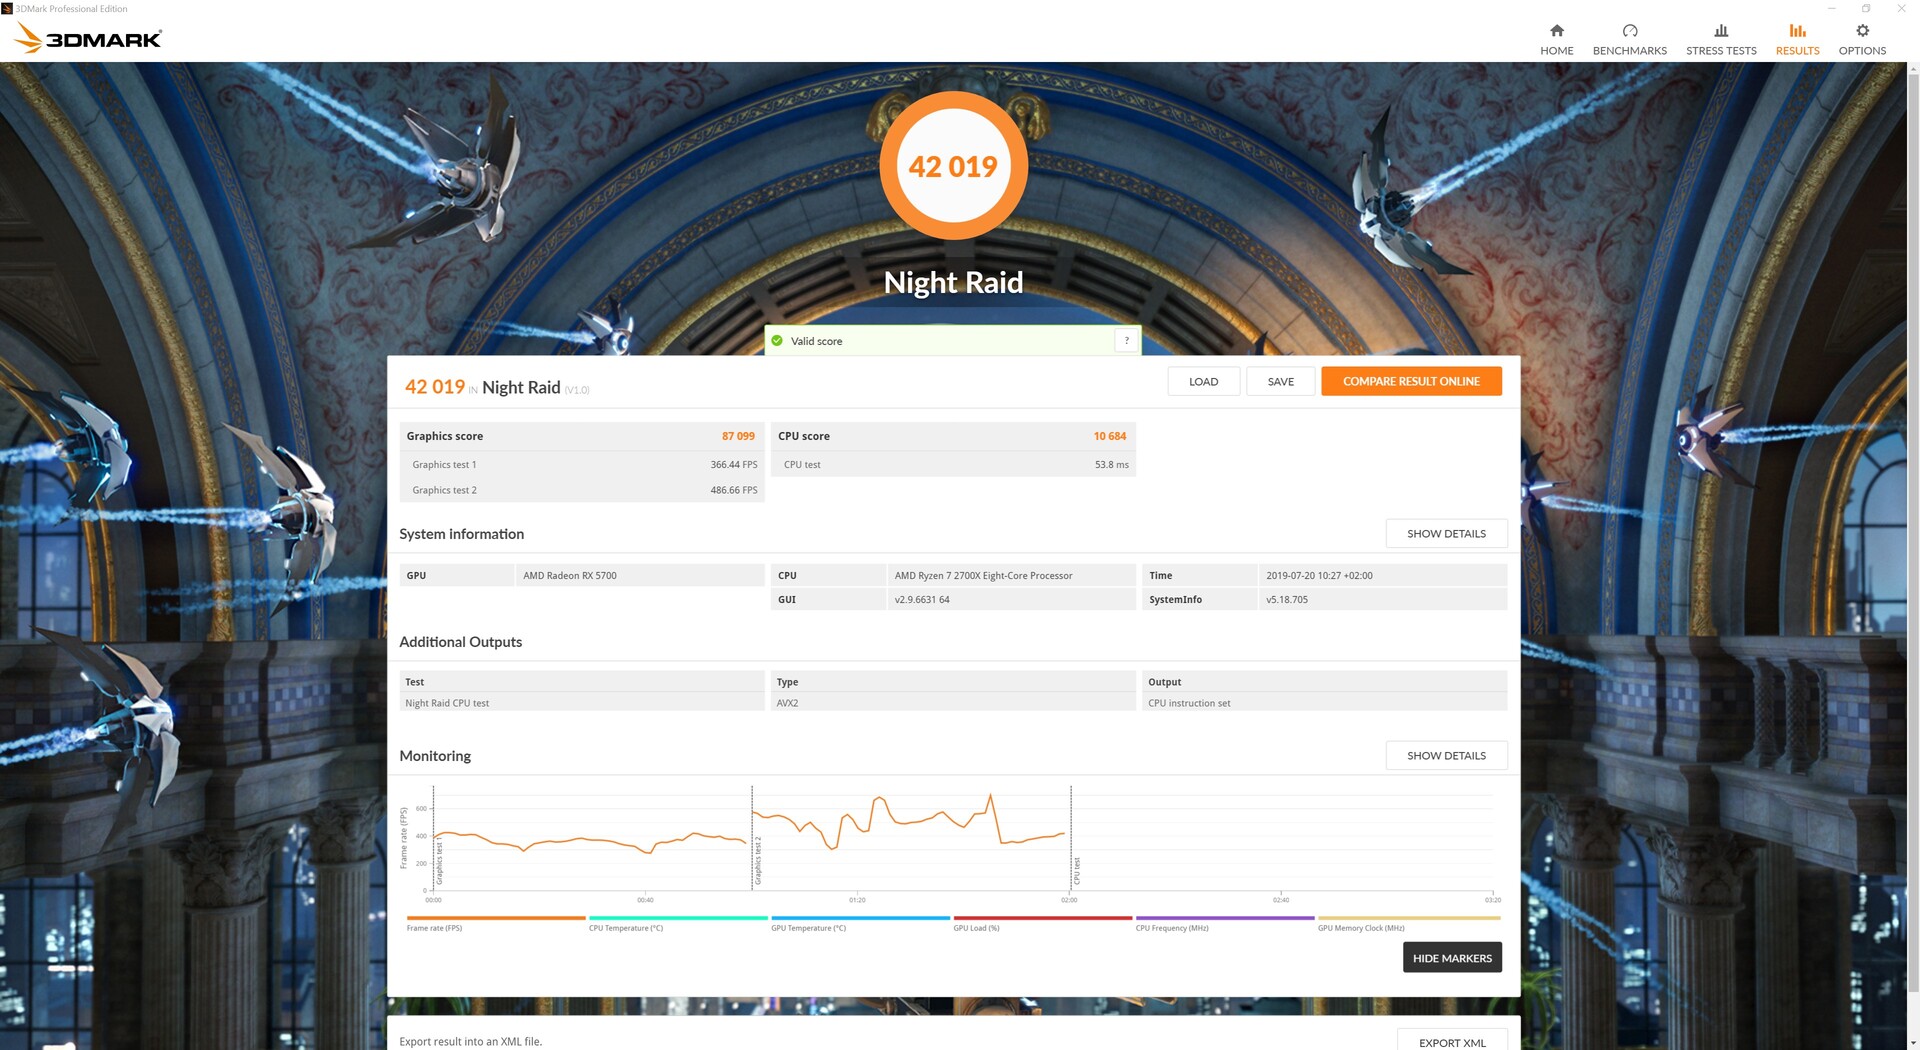
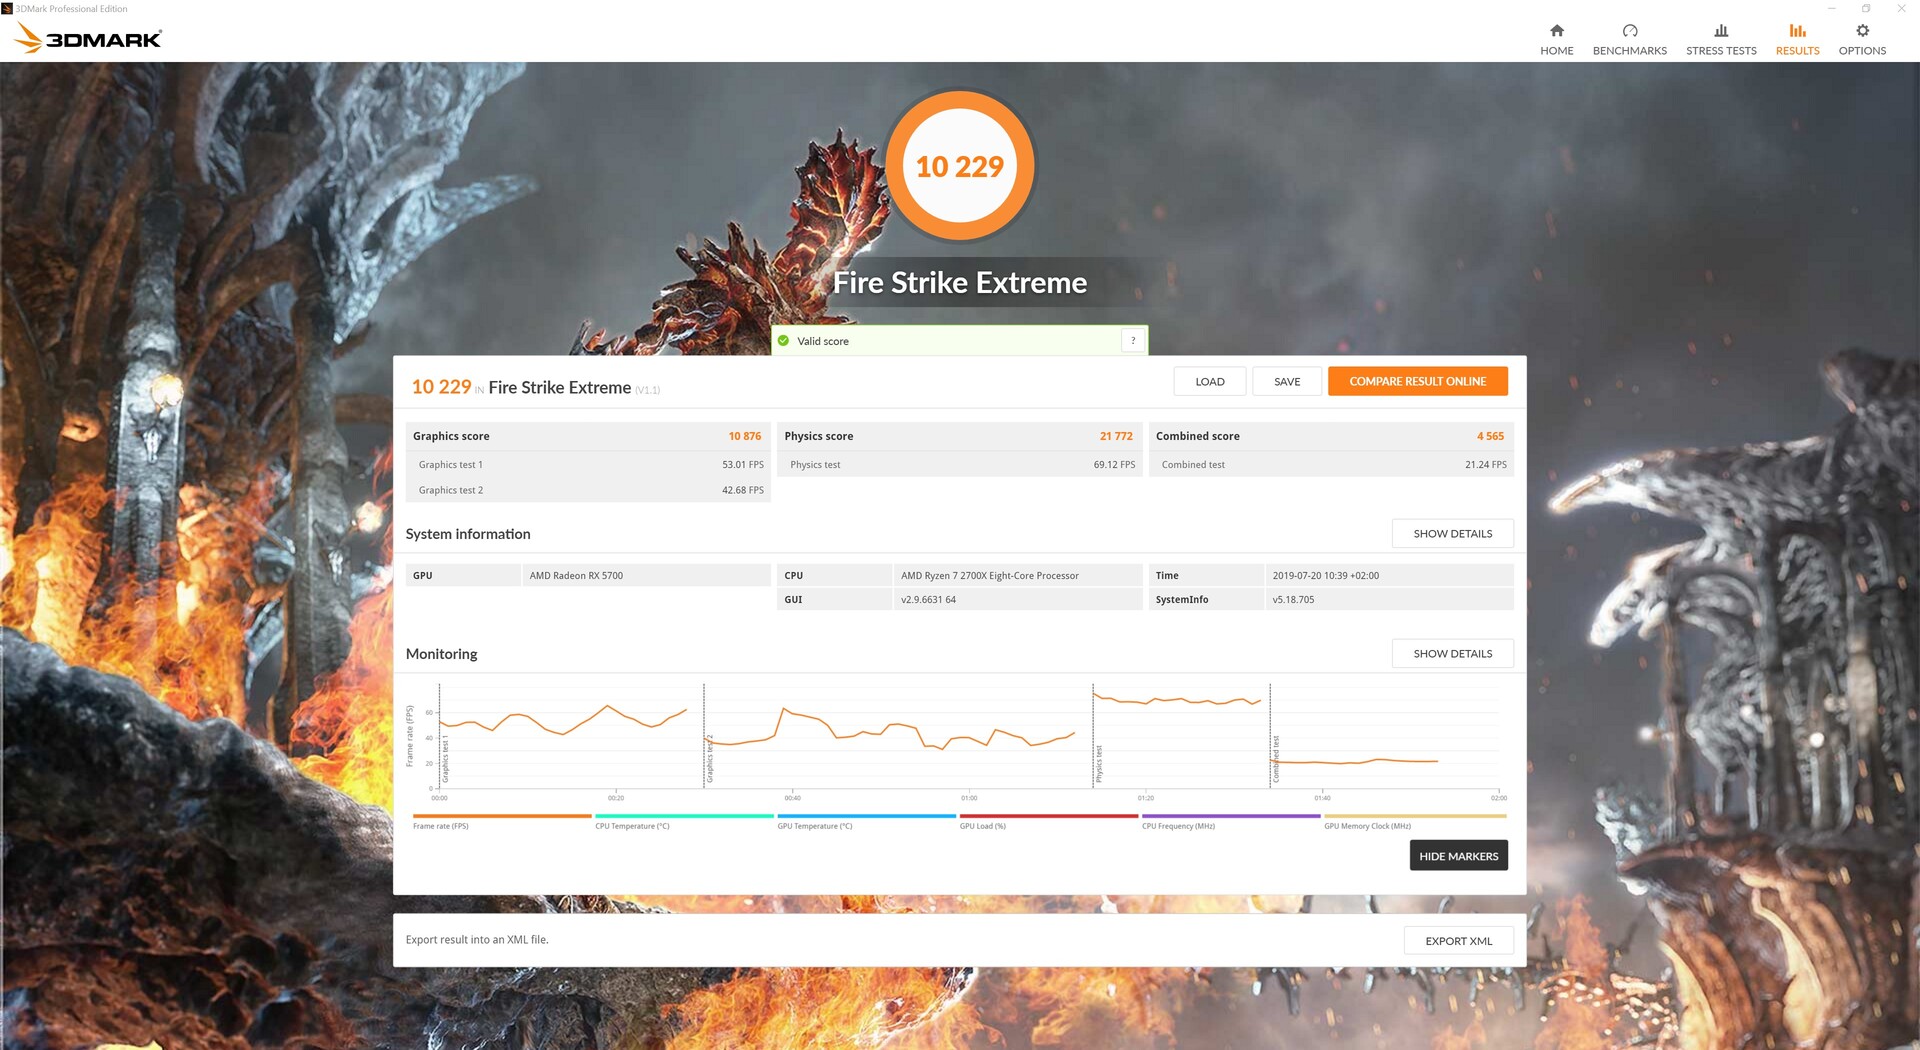
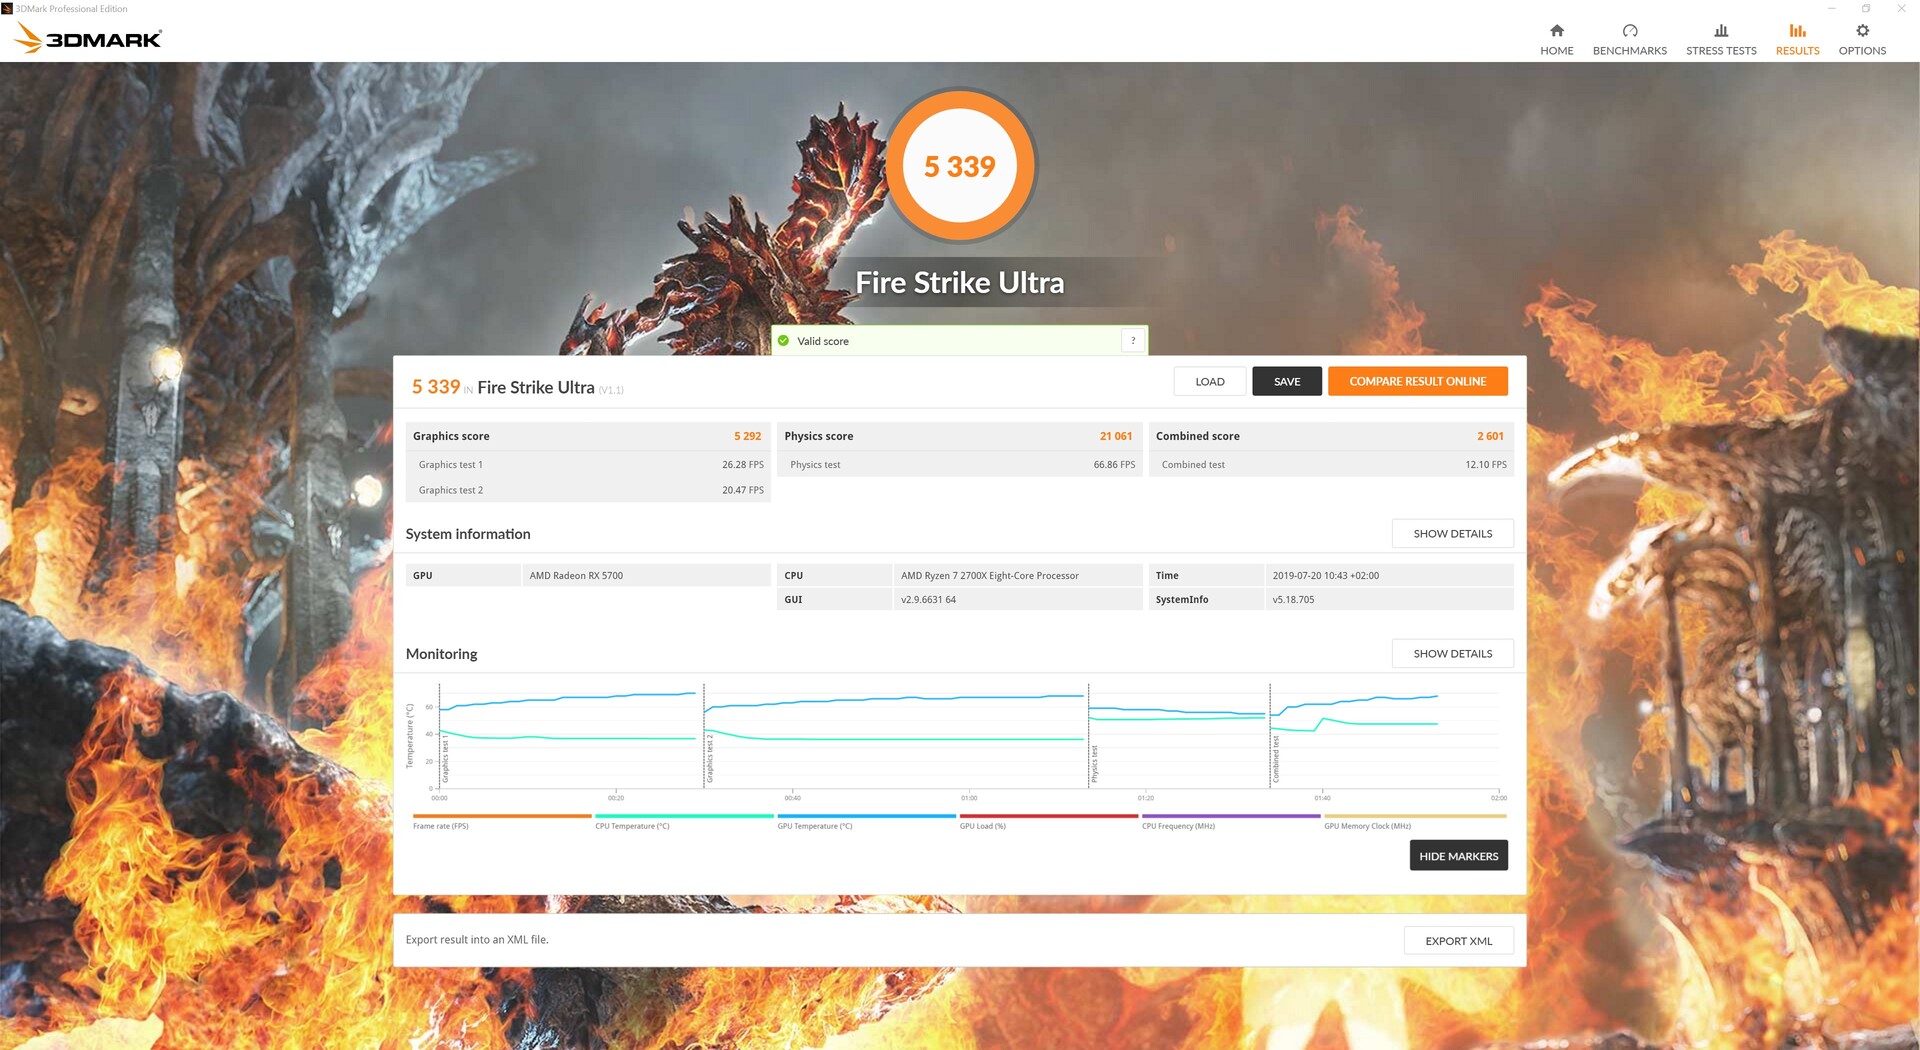
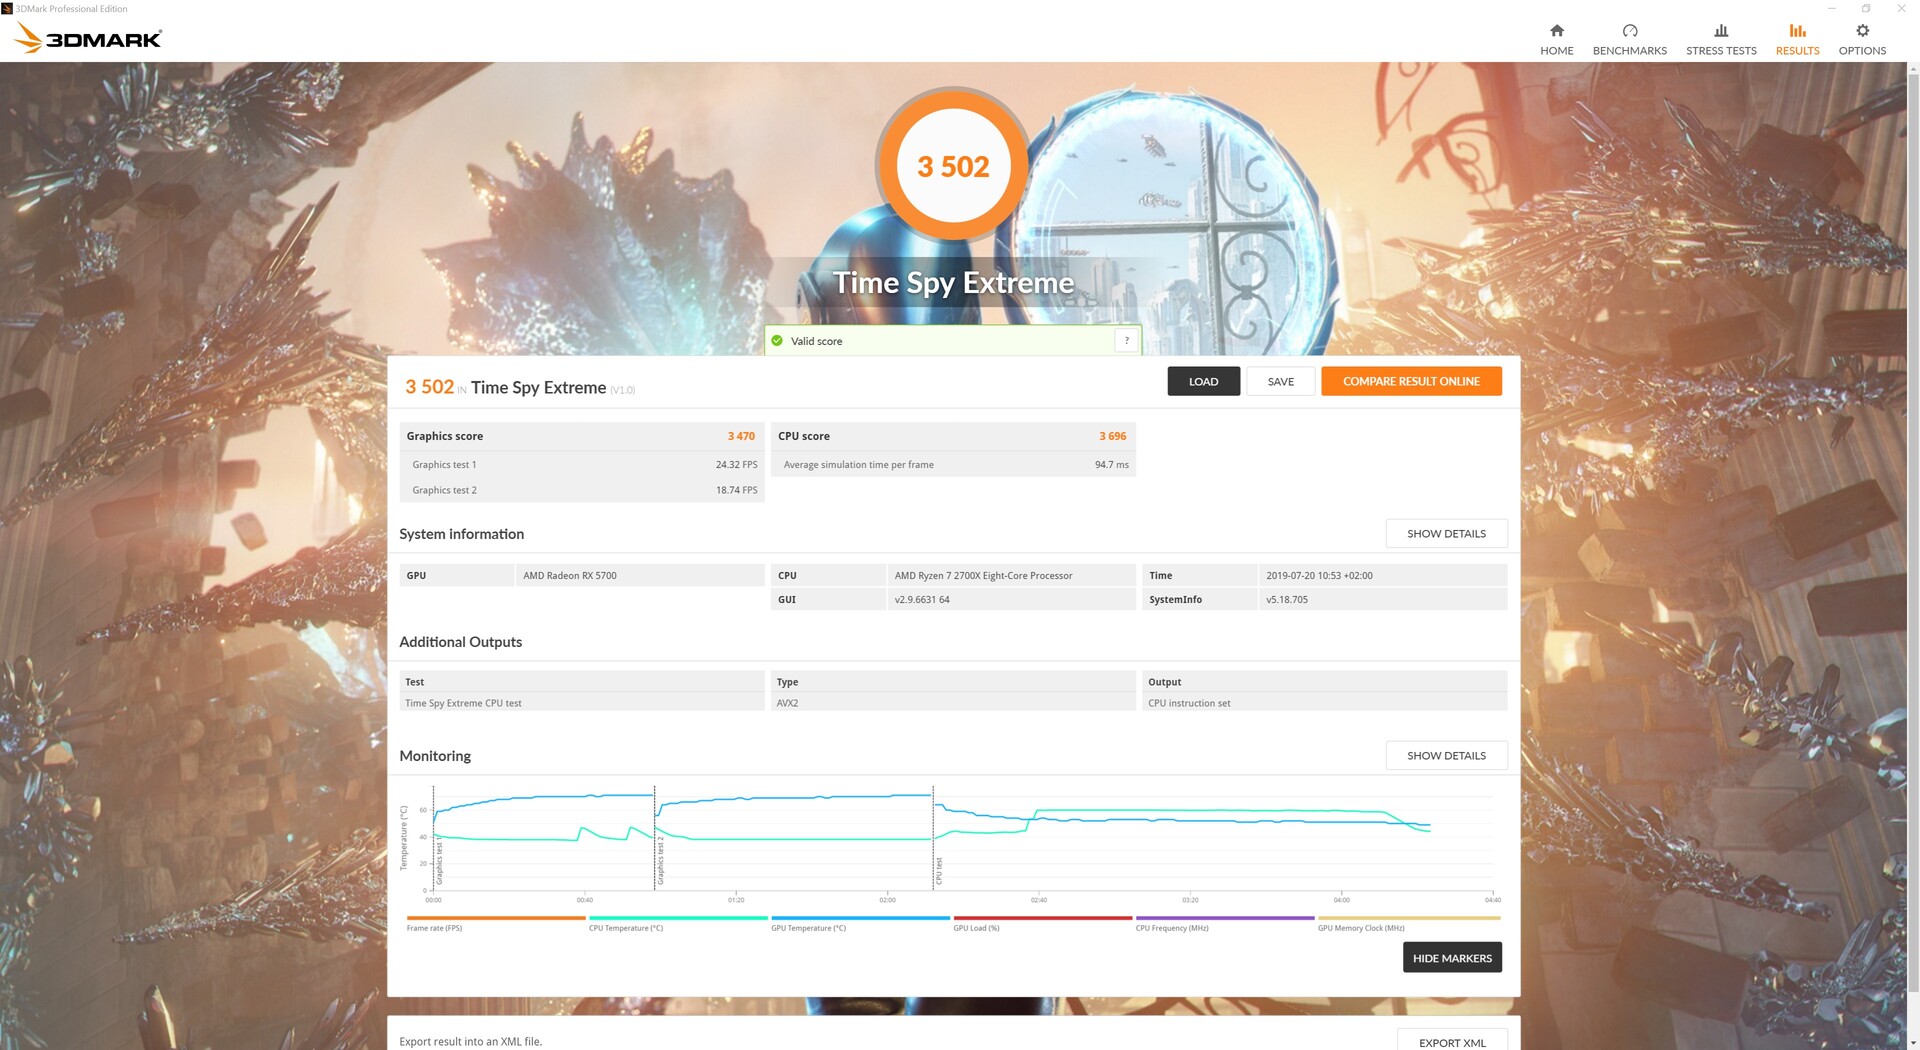
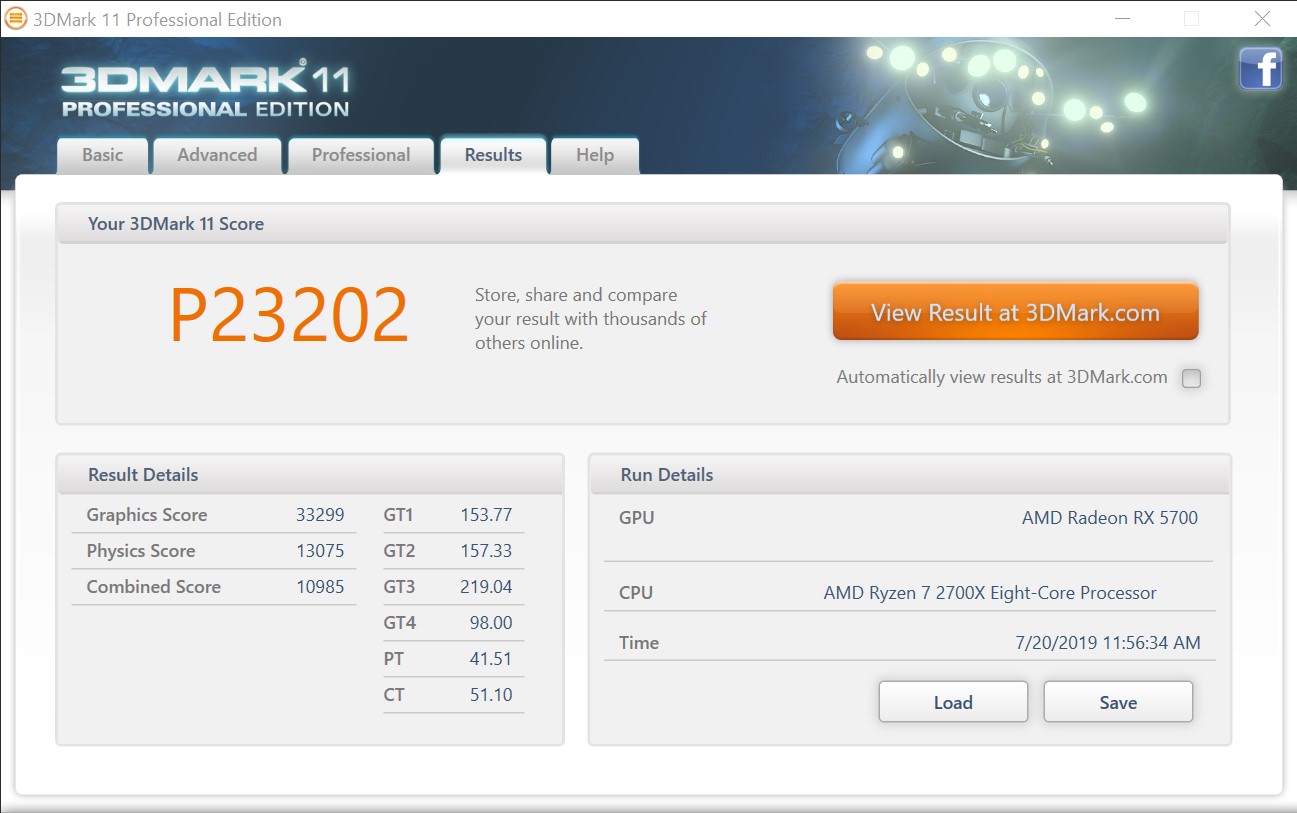
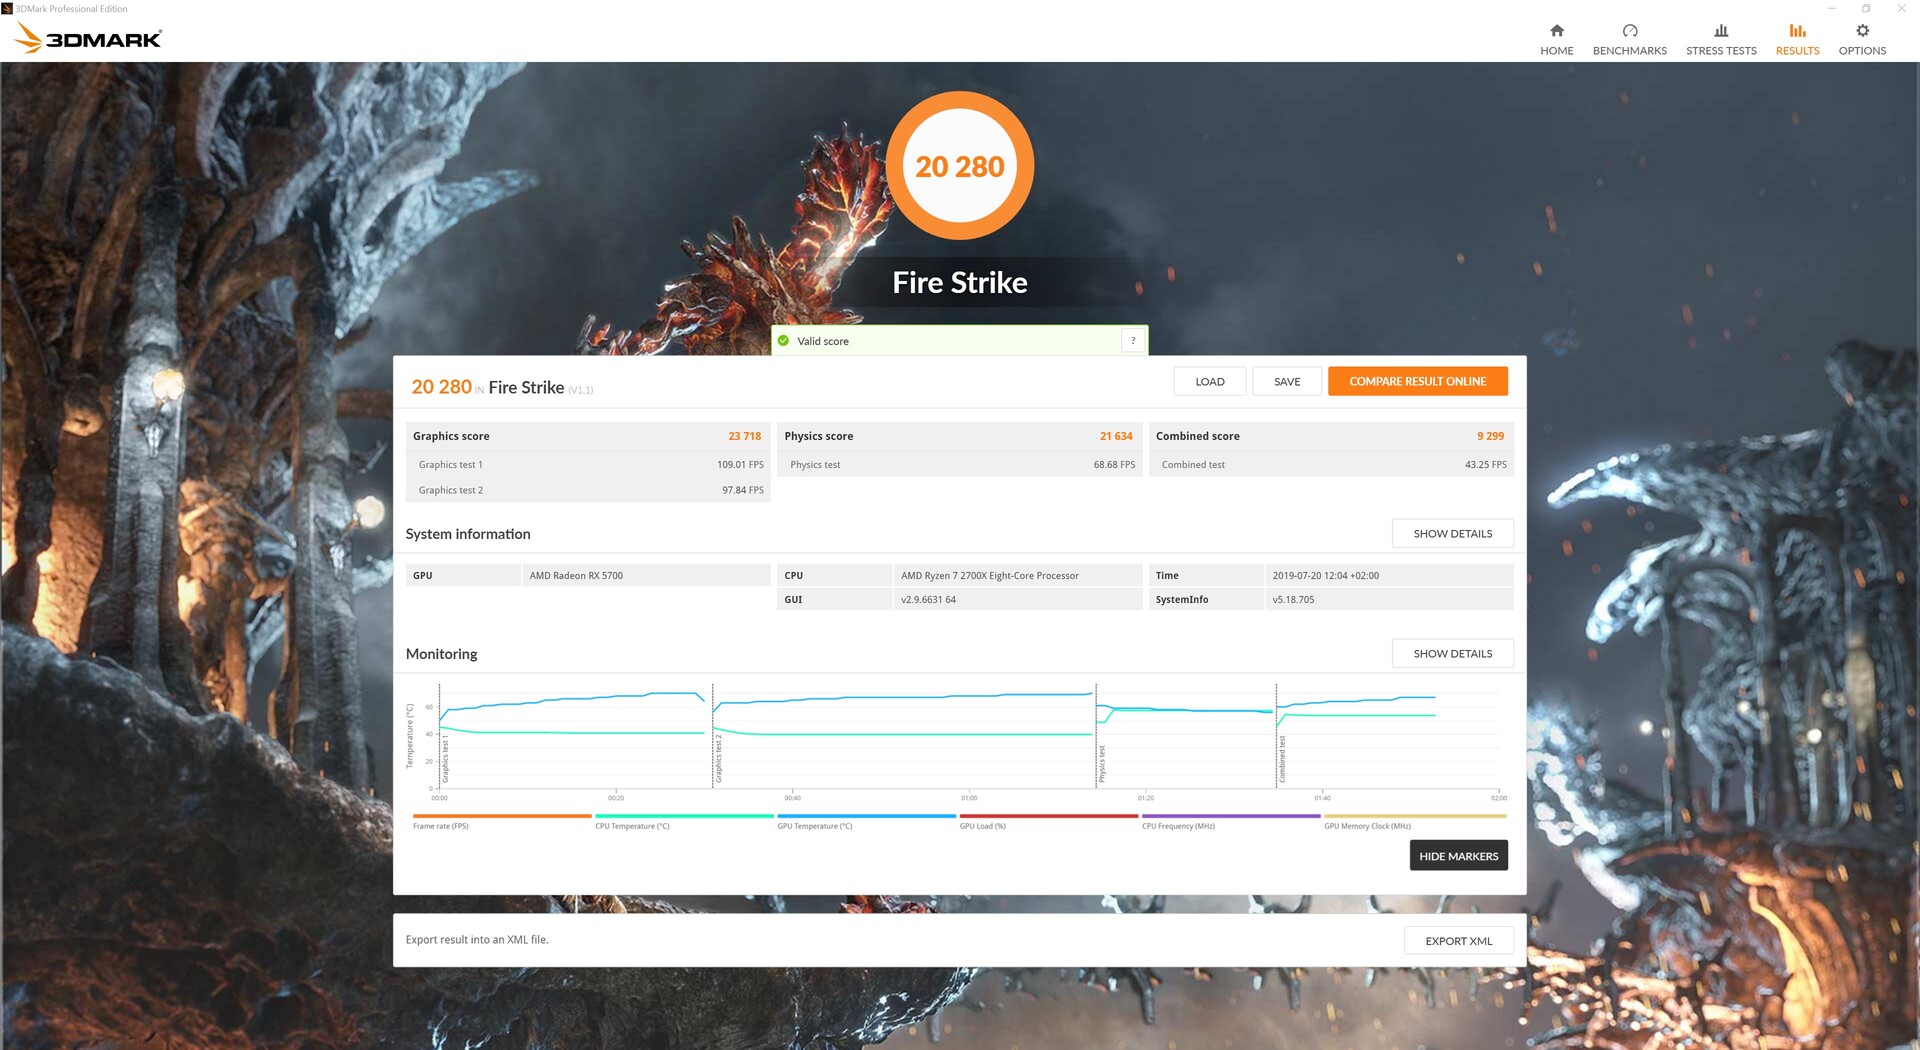
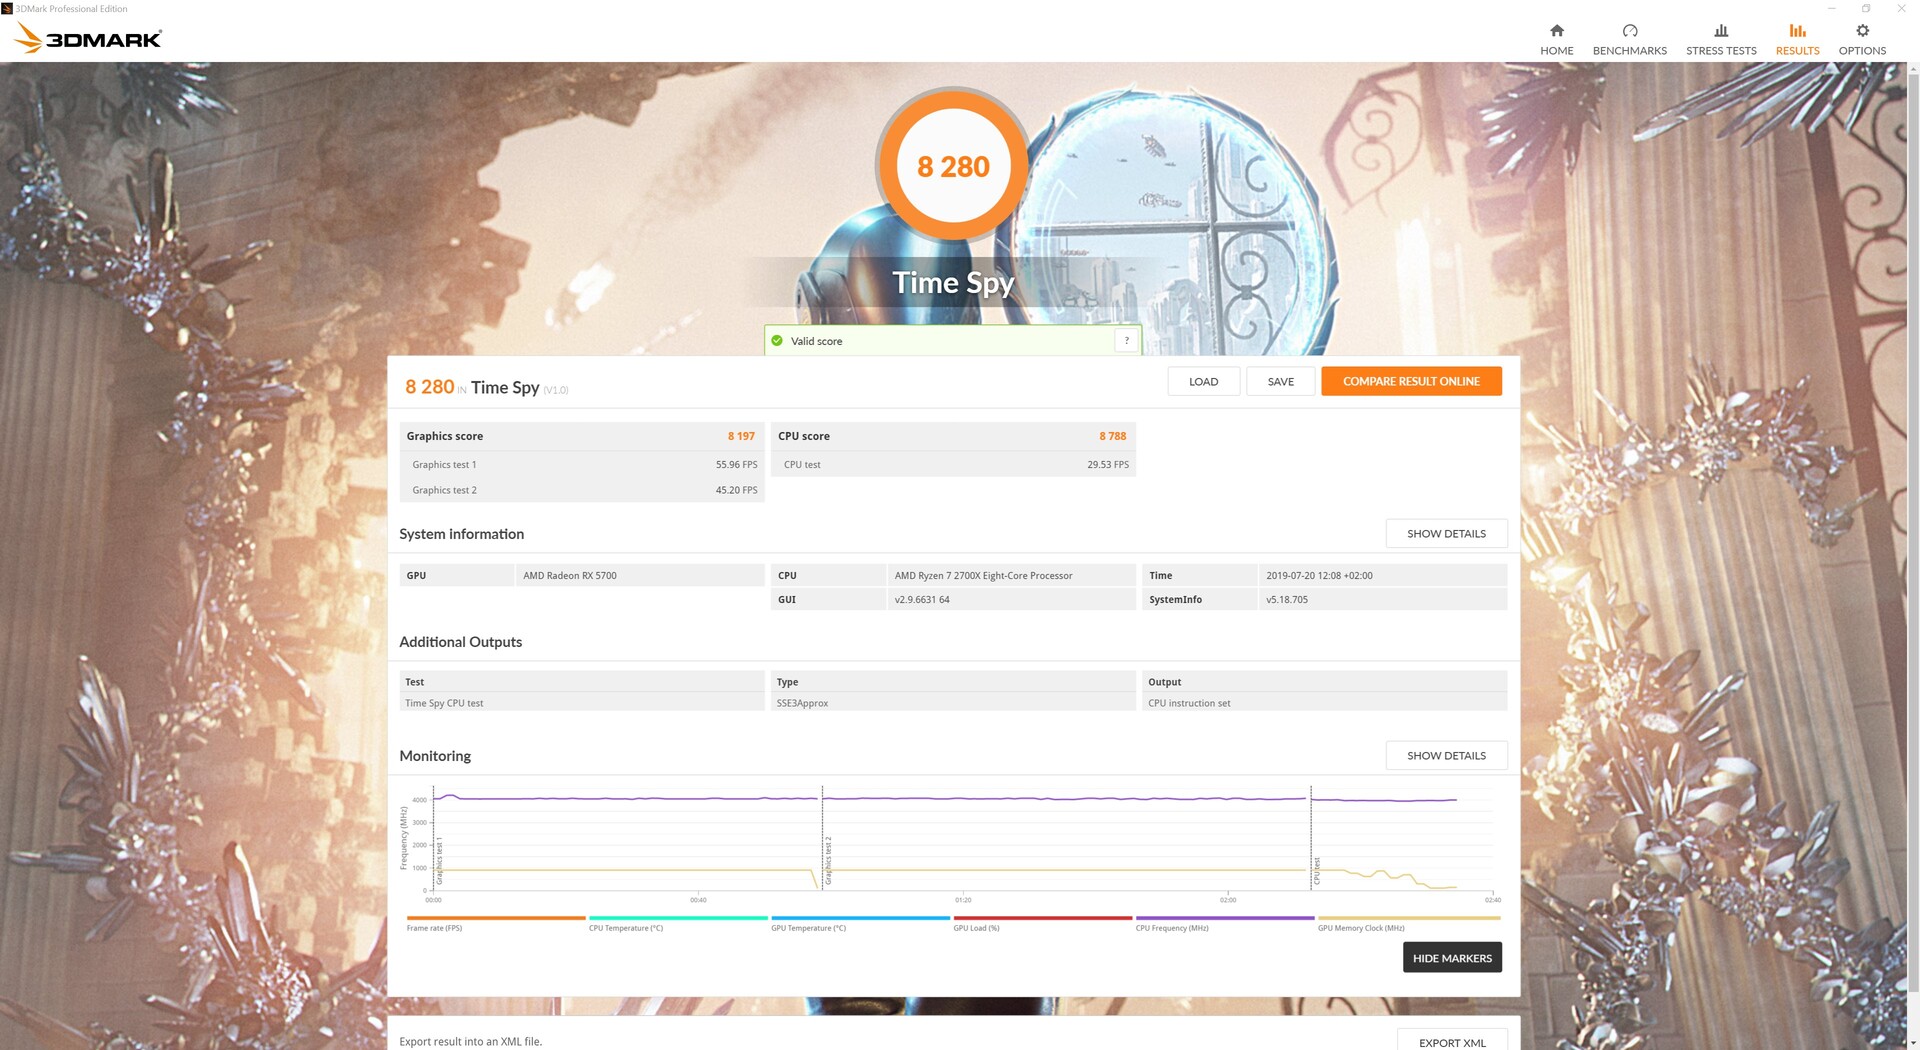
The AMD Radeon RX 5700 is able to attract attention with good results in the synthetic benchmarks à la 3DMark. Not only can the GeForce RTX 2060 from MSI be kept in check but the GeForce RTX 2060S FE can also even be beaten in the tests. Only in the Time Spy benchmark was the RX 5700 unable to achieve this. But things don't look so good with both Unigine benchmarks either. The Navi GPU lags considerably behind its direct contenders from Nvidia here.
3DMark 05 Standard
42479 points 3DMark 06 Standard Score
36361 points 3DMark 11 Performance
22544 points 3DMark Ice Storm Standard Score
190068 points 3DMark Cloud Gate Standard Score
47899 points 3DMark Fire Strike Score
19423 points 3DMark Fire Strike Extreme Score
10229 points 3DMark Time Spy Score
7821 points
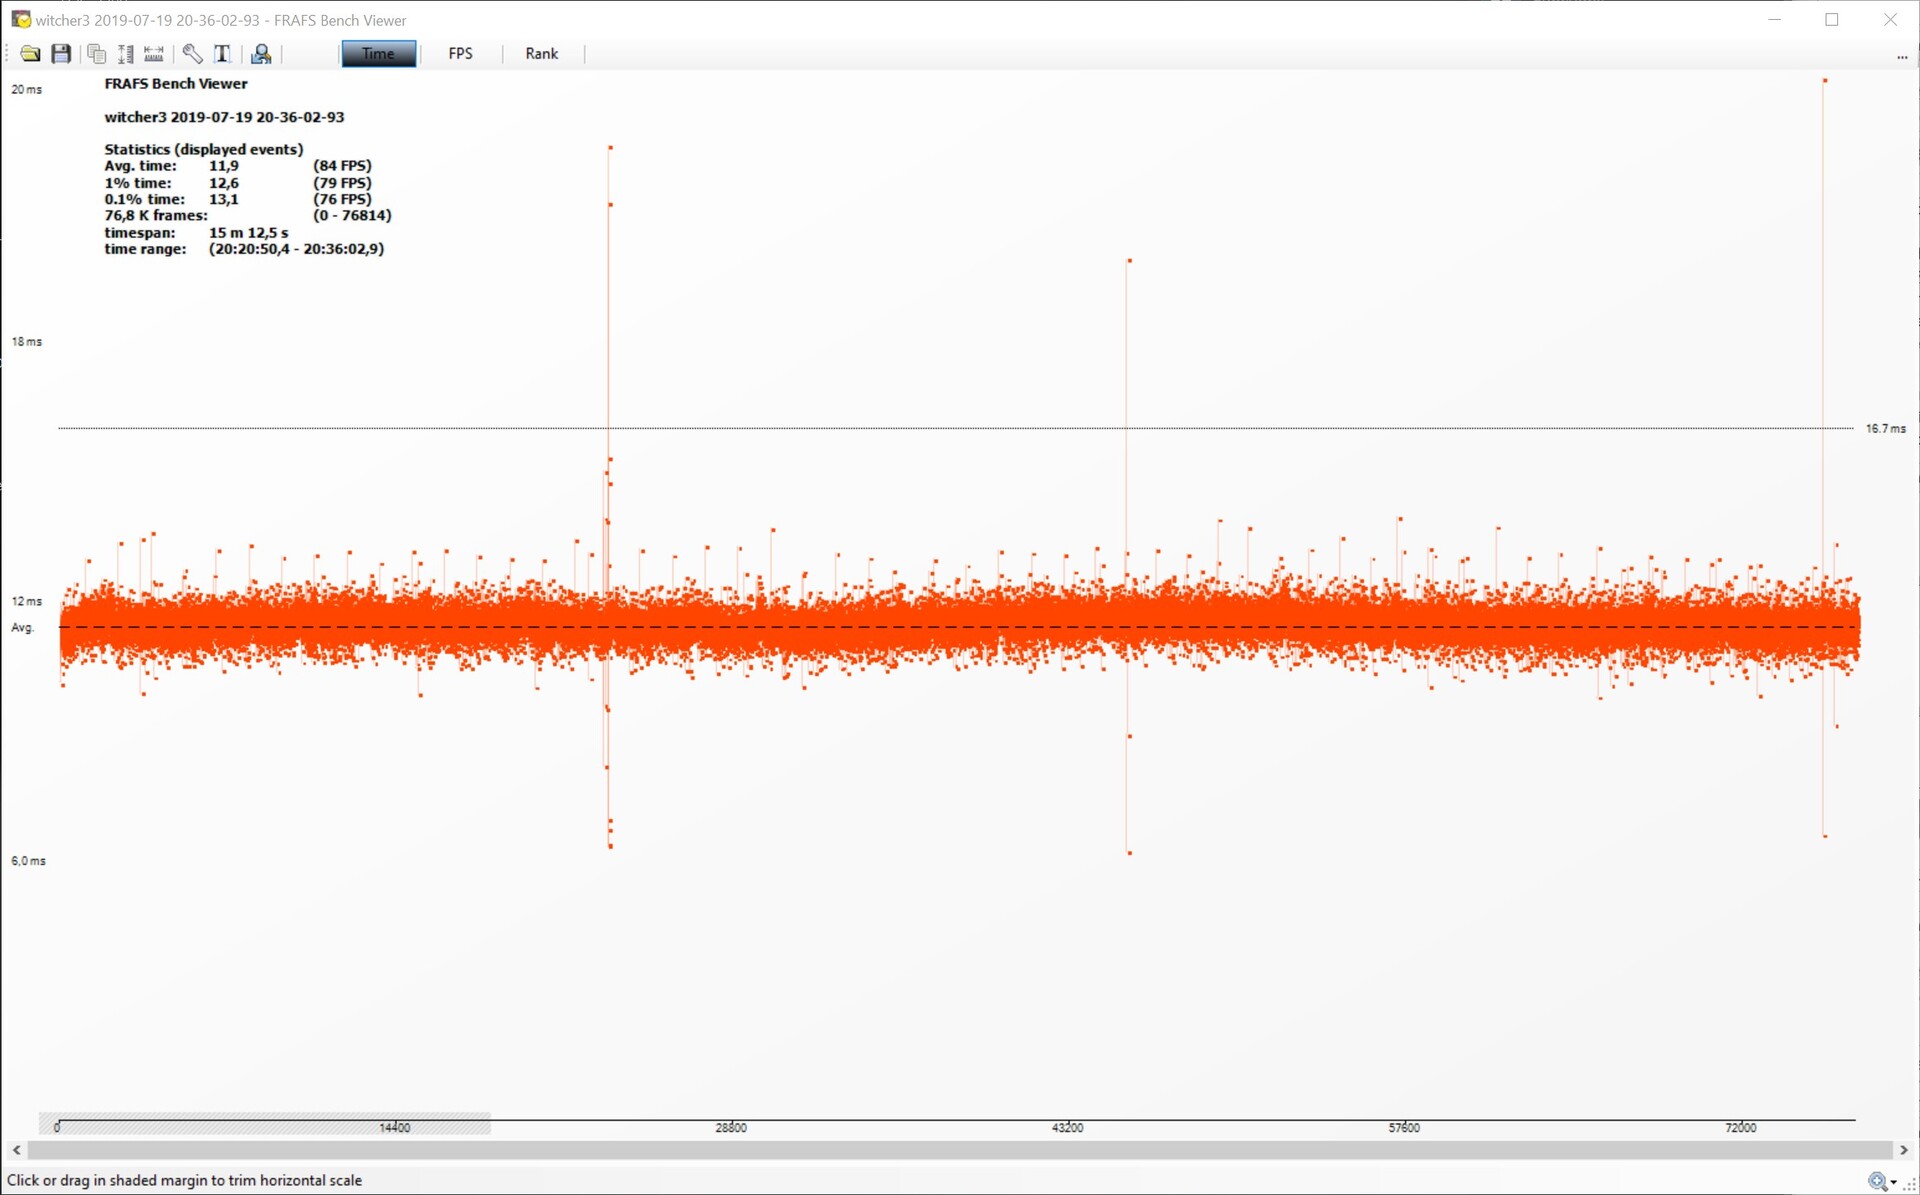
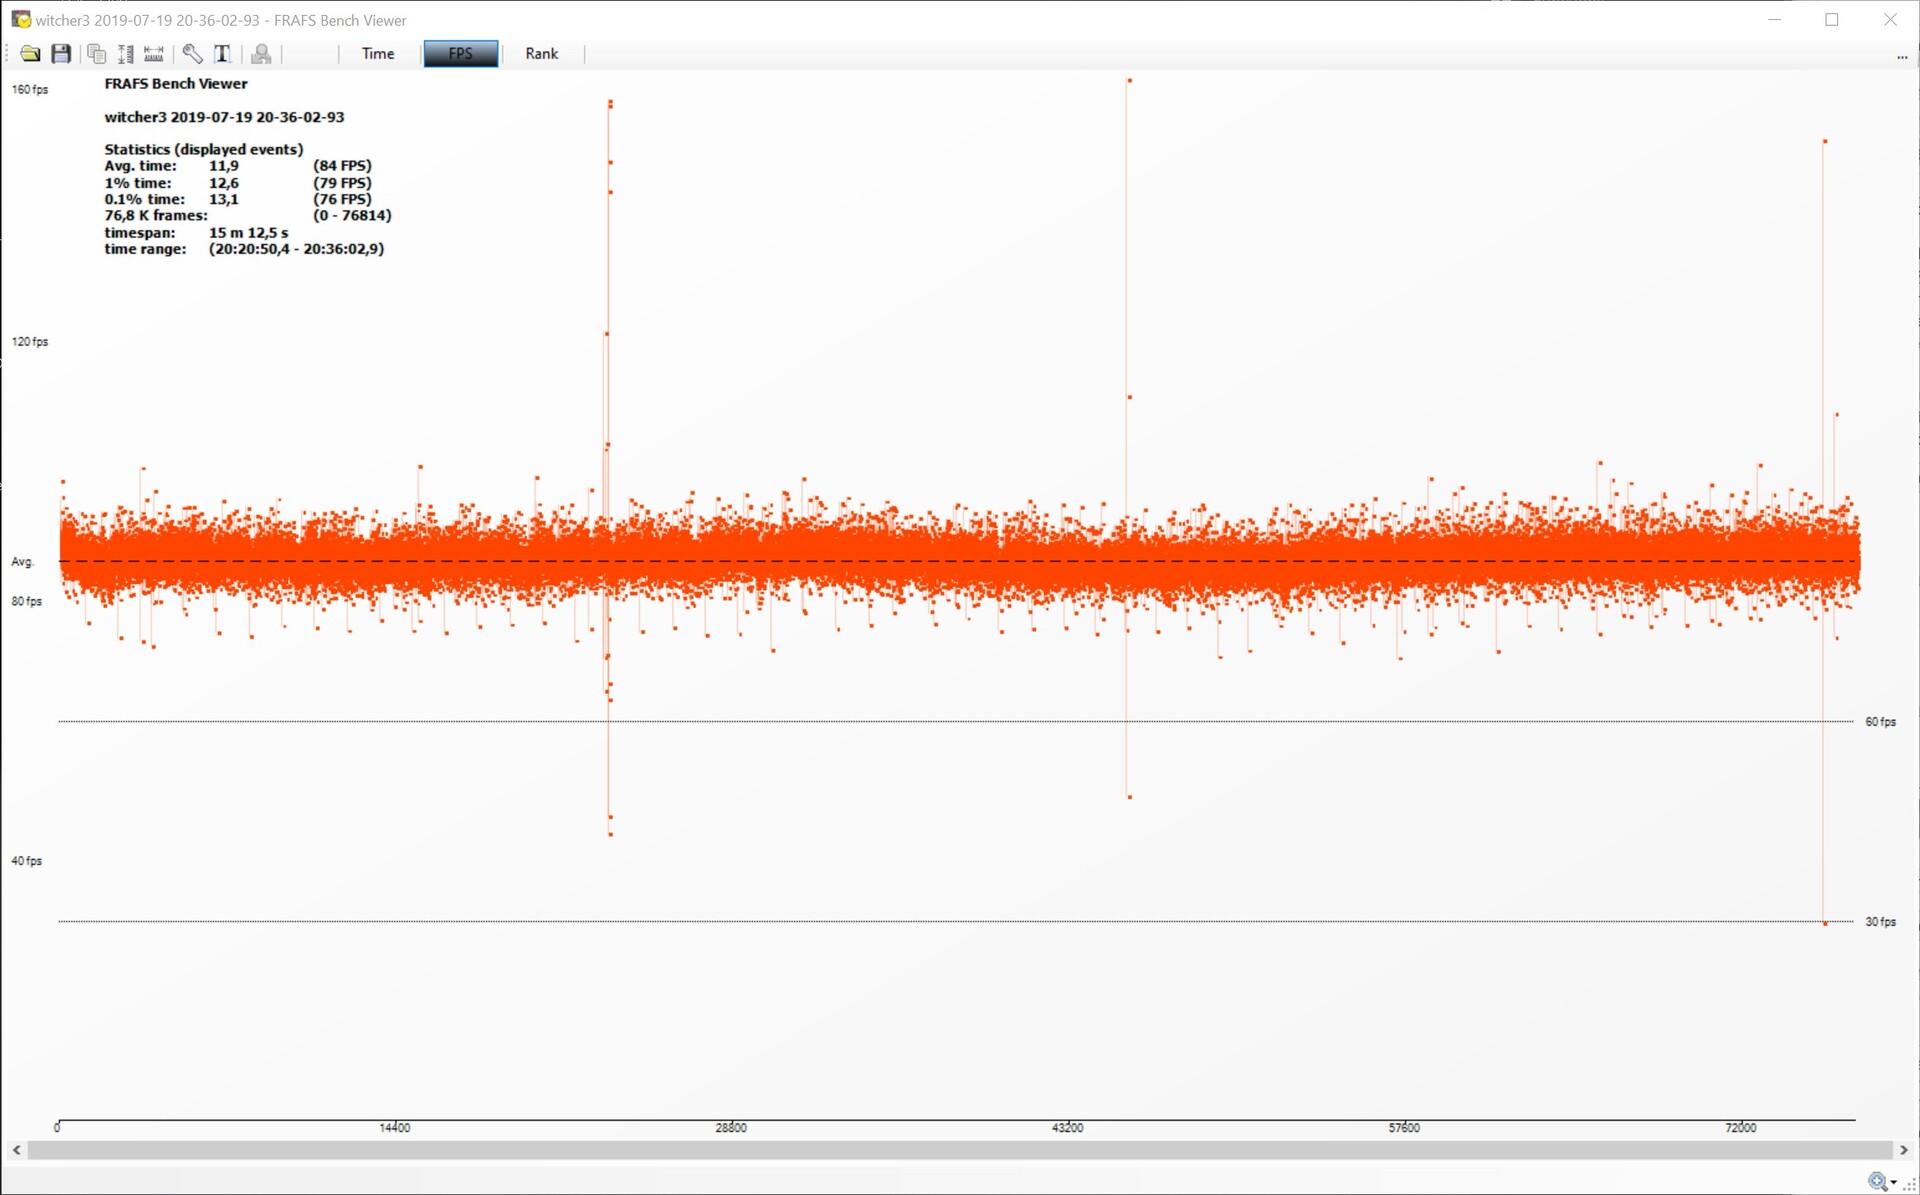
The Witcher 3 frame times (ultra preset) The Witcher 3 frame rates (ultra preset) Synthetic benchmarks don't reflect the real performance of a graphics card in modern games. The Radeon RX 5700 was almost always able to place itself ahead of the MSI RTX 2060 Gaming Z 6G GeForce RTX 2060S FE from Nvidia is a bit faster, although the RX 5700 is on par in certain games. In the modern title F1 2019 , the Navi GPU is slightly faster even. It only remains to be said that both pixel accelerators work almost equally fast. Depending on how games are optimized and how well the manufacturer tuned the drivers, there are slight differences in performance. There isn't a clear winner or loser. However, the support of ray tracing is a plus for Nvidia. At the moment, AMD still can't show anything in this regard.
The frame times for the Radeon RX 5700 are considerably better compared to the RTX 2060S. Although individual drops are documented and graphically visible, they don't have a negative impact on the gaming experience. The frame rates also show a much steadier progress in the test with The Witcher 3 (ultra preset) compared to the GeForce RTX 2060S FE. With an average of 84.2 fps, smooth gaming is guaranteed.
The AMD Radeon RX 5700 is suitable for games at a 1440p resolution. The graphics card's performance drops significantly more at higher resolutions, as was the case with the GeForce RTX 2060S. The GeForce card is not suitable for 4K gaming without compromises either. The advertised support for 1440p gaming with the Radeon RX 5700 is alright, even if the graphics card breaks a proper sweat with the modern Anno 1800 at QHD.
0 5 10 15 20 25 30 35 40 45 50 55 60 65 70 75 80 85 Tooltip
Nvidia Titan RTXNVIDIA Titan RTX, R7 2700X, ADATA Premier Pro SP900NS38 512 GB
200 (159min - 238max ) fps+75%
MSI RTX 2080 Gaming X Trio GeForce RTX 2080 (Desktop), R7 2700X
177 (140min - 204max ) fps+55%
AMD Radeon RX Vega 64 RX Vega 64, R7 2700X
166.2 (125min - 210max ) fps+46%
Nvidia GeForce RTX 2070 Super GeForce RTX 2070 Super (Desktop), R7 2700X
163 (102min - 201max ) fps+43%
MSI RTX 2070 Gaming Z 8G GeForce RTX 2070 (Desktop), R7 2700X
153 (116min - 189max ) fps+34%
AMD Radeon VIIRadeon VII, R7 2700X
146 (115min - 198max ) fps+28%
Nvidia GeForce RTX 2060 Super GeForce RTX 2060 Super (Desktop), R7 2700X
146 (111min - 180max ) fps+28%
AMD Radeon RX 5700 XT Radeon RX 5700 XT (Desktop), R7 2700X
135 (59min - 186max ) fps+18%
MSI RTX 2060 Gaming Z 6G GeForce RTX 2060 (Desktop), R7 2700X
133 (60min - 170max ) fps+17%
AMD Radeon RX 5700 Radeon RX 5700 (Desktop), R7 2700X Nvidia Titan RTXNVIDIA Titan RTX, R7 2700X, ADATA Premier Pro SP900NS38 512 GB
88 (66min - 109max ) fps+66%
MSI RTX 2080 Gaming X Trio GeForce RTX 2080 (Desktop), R7 2700X
64 (48min - 79max ) fps+21%
AMD Radeon RX Vega 64 RX Vega 64, R7 2700X
58.8 (43min - 78max ) fps+11%
AMD Radeon VIIRadeon VII, R7 2700X
58.1 (39min - 74max ) fps+10%
AMD Radeon RX 5700 XT Radeon RX 5700 XT (Desktop), R7 2700X
55.7 (23min - 73max ) fps+5%
Nvidia GeForce RTX 2070 Super GeForce RTX 2070 Super (Desktop), R7 2700X
54.5 (34min - 74max ) fps+3%
AMD Radeon RX 5700 Radeon RX 5700 (Desktop), R7 2700X Nvidia GeForce RTX 2060 Super GeForce RTX 2060 Super (Desktop), R7 2700X
48.6 (35min - 63max ) fps-8%
MSI RTX 2070 Gaming Z 8G GeForce RTX 2070 (Desktop), R7 2700X
47.4 (31min - 64max ) fps-11%
MSI RTX 2060 Gaming Z 6G GeForce RTX 2060 (Desktop), R7 2700X
39.7 (25min - 55max ) fps-25%
AMD Radeon RX 5700 XT Radeon RX 5700 XT (Desktop), R7 2700X
126 (92min - 157max ) fps+24%
MSI RTX 2080 Gaming X Trio GeForce RTX 2080 (Desktop), R7 2700X
123 (90min - 152max ) fps+21%
Nvidia GeForce RTX 2070 Super GeForce RTX 2070 Super (Desktop), R7 2700X
118 (88min - 149max ) fps+16%
MSI RTX 2070 Gaming Z 8G GeForce RTX 2070 (Desktop), R7 2700X
104.7 (74min - 128max ) fps+3%
AMD Radeon RX 5700 Radeon RX 5700 (Desktop), R7 2700X Nvidia GeForce RTX 2060 Super GeForce RTX 2060 Super (Desktop), R7 2700X
96 (61min - 120max ) fps-6%
Nvidia Titan RTXNVIDIA Titan RTX, R7 2700X, ADATA Premier Pro SP900NS38 512 GB MSI RTX 2080 Gaming X Trio GeForce RTX 2080 (Desktop), R7 2700X MSI RTX 2070 Gaming Z 8G GeForce RTX 2070 (Desktop), R7 2700X
64 (30min - 111max ) fps+7%
Nvidia GeForce RTX 2070 Super GeForce RTX 2070 Super (Desktop), R7 2700X AMD Radeon VIIRadeon VII, R7 2700X AMD Radeon RX 5700 XT Radeon RX 5700 XT (Desktop), R7 2700X Nvidia GeForce RTX 2060 Super GeForce RTX 2060 Super (Desktop), R7 2700X AMD Radeon RX 5700 Radeon RX 5700 (Desktop), R7 2700X MSI RTX 2060 Gaming Z 6G GeForce RTX 2060 (Desktop), R7 2700X AMD Radeon RX Vega 64 RX Vega 64, R7 2700X
50 (25min - 75max ) fps-17%
Nvidia Titan RTXNVIDIA Titan RTX, R7 2700X, ADATA Premier Pro SP900NS38 512 GB AMD Radeon VIIRadeon VII, R7 2700X MSI RTX 2080 Gaming X Trio GeForce RTX 2080 (Desktop), R7 2700X Nvidia GeForce RTX 2070 Super GeForce RTX 2070 Super (Desktop), R7 2700X MSI RTX 2070 Gaming Z 8G GeForce RTX 2070 (Desktop), R7 2700X
36 (25min - 63max ) fps+16%
AMD Radeon RX 5700 XT Radeon RX 5700 XT (Desktop), R7 2700X Nvidia GeForce RTX 2060 Super GeForce RTX 2060 Super (Desktop), R7 2700X AMD Radeon RX 5700 Radeon RX 5700 (Desktop), R7 2700X AMD Radeon RX Vega 64 RX Vega 64, R7 2700X
29 (5min - 64max ) fps-6%
MSI RTX 2060 Gaming Z 6G GeForce RTX 2060 (Desktop), R7 2700X MSI RTX 2080 Gaming X Trio GeForce RTX 2080 (Desktop), R7 2700X Nvidia GeForce RTX 2070 Super GeForce RTX 2070 Super (Desktop), R7 2700X MSI RTX 2070 Gaming Z 8G GeForce RTX 2070 (Desktop), R7 2700X
53 (33min - 95max ) fps+4%
AMD Radeon RX 5700 XT Radeon RX 5700 XT (Desktop), R7 2700X Nvidia GeForce RTX 2060 Super GeForce RTX 2060 Super (Desktop), R7 2700X AMD Radeon RX 5700 Radeon RX 5700 (Desktop), R7 2700X
AMD Radeon RX Vega 64 RX Vega 64, R7 2700X
287.8 (267min - 331max ) fps+7%
AMD Radeon RX 5700 XT Radeon RX 5700 XT (Desktop), R7 2700X
276 (236min - 297max ) fps+2%
AMD Radeon RX 5700 Radeon RX 5700 (Desktop), R7 2700X
270 (253min - 295max ) fps
Nvidia GeForce RTX 2070 Super GeForce RTX 2070 Super (Desktop), R7 2700X
255 (237min - 267max ) fps-6%
Nvidia Titan RTXNVIDIA Titan RTX, R7 2700X, ADATA Premier Pro SP900NS38 512 GB
251 (233min - 258max ) fps-7%
MSI RTX 2080 Gaming X Trio GeForce RTX 2080 (Desktop), R7 2700X
228 (218min - 235max ) fps-16%
AMD Radeon VIIRadeon VII, R7 2700X
227 (225min - 229max ) fps-16%
MSI RTX 2070 Gaming Z 8G GeForce RTX 2070 (Desktop), R7 2700X
218.4 (212min - 233max ) fps-19%
Nvidia GeForce RTX 2060 Super GeForce RTX 2060 Super (Desktop), R7 2700X
216 (206min - 230max ) fps-20%
MSI RTX 2060 Gaming Z 6G GeForce RTX 2060 (Desktop), R7 2700X
186.2 (176min - 203max ) fps-31%
Nvidia Titan RTXNVIDIA Titan RTX, R7 2700X, ADATA Premier Pro SP900NS38 512 GB
213 (203min - 231max ) fps+30%
AMD Radeon VIIRadeon VII, R7 2700X
208 (198min - 217max ) fps+27%
MSI RTX 2080 Gaming X Trio GeForce RTX 2080 (Desktop), R7 2700X
203 (196min - 219max ) fps+24%
AMD Radeon RX 5700 XT Radeon RX 5700 XT (Desktop), R7 2700X
186 (171min - 206max ) fps+13%
Nvidia GeForce RTX 2060 Super GeForce RTX 2060 Super (Desktop), R7 2700X
176 (170min - 187max ) fps+7%
MSI RTX 2070 Gaming Z 8G GeForce RTX 2070 (Desktop), R7 2700X
174 (171min - 178max ) fps+6%
Nvidia GeForce RTX 2070 Super GeForce RTX 2070 Super (Desktop), R7 2700X
172 (168min - 178max ) fps+5%
AMD Radeon RX 5700 Radeon RX 5700 (Desktop), R7 2700X
164 (149min - 180max ) fps
AMD Radeon RX Vega 64 RX Vega 64, R7 2700X
161.4 (148min - 181max ) fps-2%
MSI RTX 2060 Gaming Z 6G GeForce RTX 2060 (Desktop), R7 2700X
151.2 (146min - 155max ) fps-8%
AMD Radeon RX 5700 XT Radeon RX 5700 XT (Desktop), R7 2700X
273 (254min - 300max ) fps+2%
AMD Radeon RX 5700 Radeon RX 5700 (Desktop), R7 2700X
267 (252min - 294max ) fps
Nvidia GeForce RTX 2070 Super GeForce RTX 2070 Super (Desktop), R7 2700X
255 (242min - 268max ) fps-4%
MSI RTX 2080 Gaming X Trio GeForce RTX 2080 (Desktop), R7 2700X
212 (205min - 237max ) fps-21%
Nvidia GeForce RTX 2060 Super GeForce RTX 2060 Super (Desktop), R7 2700X
211 (206min - 228max ) fps-21%
MSI RTX 2070 Gaming Z 8G GeForce RTX 2070 (Desktop), R7 2700X
210.5 (190min - 234max ) fps-21%
MSI RTX 2080 Gaming X Trio GeForce RTX 2080 (Desktop), R7 2700X AMD Radeon RX 5700 XT Radeon RX 5700 XT (Desktop), R7 2700X Nvidia Titan RTXNVIDIA Titan RTX, R7 2700X, ADATA Premier Pro SP900NS38 512 GB AMD Radeon VIIRadeon VII, R7 2700X Nvidia GeForce RTX 2070 Super GeForce RTX 2070 Super (Desktop), R7 2700X AMD Radeon RX Vega 64 RX Vega 64, R7 2700X AMD Radeon RX 5700 Radeon RX 5700 (Desktop), R7 2700X MSI RTX 2070 Gaming Z 8G GeForce RTX 2070 (Desktop), R7 2700X Nvidia GeForce RTX 2060 Super GeForce RTX 2060 Super (Desktop), R7 2700X MSI RTX 2060 Gaming Z 6G GeForce RTX 2060 (Desktop), R7 2700X Nvidia Titan RTXNVIDIA Titan RTX, R7 2700X, ADATA Premier Pro SP900NS38 512 GB MSI RTX 2080 Gaming X Trio GeForce RTX 2080 (Desktop), R7 2700X AMD Radeon RX 5700 XT Radeon RX 5700 XT (Desktop), R7 2700X AMD Radeon VIIRadeon VII, R7 2700X Nvidia GeForce RTX 2070 Super GeForce RTX 2070 Super (Desktop), R7 2700X AMD Radeon RX 5700 Radeon RX 5700 (Desktop), R7 2700X MSI RTX 2070 Gaming Z 8G GeForce RTX 2070 (Desktop), R7 2700X AMD Radeon RX Vega 64 RX Vega 64, R7 2700X Nvidia GeForce RTX 2060 Super GeForce RTX 2060 Super (Desktop), R7 2700X MSI RTX 2060 Gaming Z 6G GeForce RTX 2060 (Desktop), R7 2700X AMD Radeon RX 5700 XT Radeon RX 5700 XT (Desktop), R7 2700X MSI RTX 2080 Gaming X Trio GeForce RTX 2080 (Desktop), R7 2700X Nvidia GeForce RTX 2070 Super GeForce RTX 2070 Super (Desktop), R7 2700X AMD Radeon RX 5700 Radeon RX 5700 (Desktop), R7 2700X MSI RTX 2070 Gaming Z 8G GeForce RTX 2070 (Desktop), R7 2700X Nvidia GeForce RTX 2060 Super GeForce RTX 2060 Super (Desktop), R7 2700X
Nvidia Titan RTXNVIDIA Titan RTX, R7 2700X, ADATA Premier Pro SP900NS38 512 GB
136 (95min - 157max ) fps+68%
MSI RTX 2080 Gaming X Trio GeForce RTX 2080 (Desktop), R7 2700X
115 (90min - 146max ) fps+42%
Nvidia GeForce RTX 2070 Super GeForce RTX 2070 Super (Desktop), R7 2700X
108 (82min - 137max ) fps+33%
MSI RTX 2070 Gaming Z 8G GeForce RTX 2070 (Desktop), R7 2700X
97.7 (75min - 117max ) fps+21%
AMD Radeon VIIRadeon VII, R7 2700X
94 (75min - 119max ) fps+16%
Nvidia GeForce RTX 2060 Super GeForce RTX 2060 Super (Desktop), R7 2700X
93 (75min - 110max ) fps+15%
AMD Radeon RX 5700 XT Radeon RX 5700 XT (Desktop), R7 2700X
91 (76min - 109max ) fps+12%
MSI RTX 2060 Gaming Z 6G GeForce RTX 2060 (Desktop), R7 2700X
86 (67min - 105max ) fps+6%
AMD Radeon RX Vega 64 RX Vega 64, R7 2700X
85.2 (61min - 109max ) fps+5%
AMD Radeon RX 5700 Radeon RX 5700 (Desktop), R7 2700X Nvidia Titan RTXNVIDIA Titan RTX, R7 2700X, ADATA Premier Pro SP900NS38 512 GB
54 (46min - 64max ) fps+94%
MSI RTX 2080 Gaming X Trio GeForce RTX 2080 (Desktop), R7 2700X
38.6 (33min - 46max ) fps+39%
Nvidia GeForce RTX 2070 Super GeForce RTX 2070 Super (Desktop), R7 2700X
35 (30min - 40max ) fps+26%
AMD Radeon VIIRadeon VII, R7 2700X
33.5 (29min - 41max ) fps+21%
MSI RTX 2070 Gaming Z 8G GeForce RTX 2070 (Desktop), R7 2700X
32.3 (28min - 38max ) fps+16%
AMD Radeon RX 5700 XT Radeon RX 5700 XT (Desktop), R7 2700X
29.6 (27min - 34max ) fps+6%
AMD Radeon RX Vega 64 RX Vega 64, R7 2700X
28.9 (26min - 34max ) fps+4%
Nvidia GeForce RTX 2060 Super GeForce RTX 2060 Super (Desktop), R7 2700X
28.4 (24min - 33max ) fps+2%
AMD Radeon RX 5700 Radeon RX 5700 (Desktop), R7 2700X MSI RTX 2060 Gaming Z 6G GeForce RTX 2060 (Desktop), R7 2700X
27.5 (24min - 32max ) fps-1%
MSI RTX 2080 Gaming X Trio GeForce RTX 2080 (Desktop), R7 2700X
78 (62min - 97max ) fps+44%
Nvidia GeForce RTX 2070 Super GeForce RTX 2070 Super (Desktop), R7 2700X
71 (56min - 81max ) fps+31%
MSI RTX 2070 Gaming Z 8G GeForce RTX 2070 (Desktop), R7 2700X
65.5 (55min - 78max ) fps+21%
AMD Radeon RX 5700 XT Radeon RX 5700 XT (Desktop), R7 2700X
58.7 (51min - 68max ) fps+8%
Nvidia GeForce RTX 2060 Super GeForce RTX 2060 Super (Desktop), R7 2700X
56.2 (47min - 66max ) fps+4%
AMD Radeon RX 5700 Radeon RX 5700 (Desktop), R7 2700X
MSI RTX 2080 Gaming X Trio GeForce RTX 2080 (Desktop), R7 2700X
107 (82min - 145max ) fps+27%
Nvidia Titan RTXNVIDIA Titan RTX, R7 2700X, ADATA Premier Pro SP900NS38 512 GB
103 (77min - 137max ) fps+23%
MSI RTX 2070 Gaming Z 8G GeForce RTX 2070 (Desktop), R7 2700X
103 (78min - 136max ) fps+23%
AMD Radeon RX Vega 64 RX Vega 64, R7 2700X
99 (78min - 124max ) fps+18%
Nvidia GeForce RTX 2060 Super GeForce RTX 2060 Super (Desktop), R7 2700X
99 (75min - 131max ) fps+18%
Nvidia GeForce RTX 2070 Super GeForce RTX 2070 Super (Desktop), R7 2700X
99 (76min - 132max ) fps+18%
AMD Radeon RX 5700 XT Radeon RX 5700 XT (Desktop), R7 2700X
96 (75min - 127max ) fps+14%
MSI RTX 2060 Gaming Z 6G GeForce RTX 2060 (Desktop), R7 2700X
94 (72min - 124max ) fps+12%
AMD Radeon VIIRadeon VII, R7 2700X
91 (70min - 120max ) fps+8%
AMD Radeon RX 5700 Radeon RX 5700 (Desktop), R7 2700X Nvidia Titan RTXNVIDIA Titan RTX, R7 2700X, ADATA Premier Pro SP900NS38 512 GB
75 (61min - 89max ) fps+67%
MSI RTX 2080 Gaming X Trio GeForce RTX 2080 (Desktop), R7 2700X
59 (53min - 71max ) fps+31%
AMD Radeon VIIRadeon VII, R7 2700X
59 (50min - 75max ) fps+31%
Nvidia GeForce RTX 2070 Super GeForce RTX 2070 Super (Desktop), R7 2700X
54 (48min - 65max ) fps+20%
AMD Radeon RX 5700 XT Radeon RX 5700 XT (Desktop), R7 2700X
51 (44min - 66max ) fps+13%
MSI RTX 2070 Gaming Z 8G GeForce RTX 2070 (Desktop), R7 2700X
48 (41min - 57max ) fps+7%
Nvidia GeForce RTX 2060 Super GeForce RTX 2060 Super (Desktop), R7 2700X
45 (40min - 55max ) fps0%
AMD Radeon RX 5700 Radeon RX 5700 (Desktop), R7 2700X AMD Radeon RX Vega 64 RX Vega 64, R7 2700X
44 (37min - 56max ) fps-2%
MSI RTX 2060 Gaming Z 6G GeForce RTX 2060 (Desktop), R7 2700X
41 (37min - 49max ) fps-9%
MSI RTX 2080 Gaming X Trio GeForce RTX 2080 (Desktop), R7 2700X
99 (80min - 122max ) fps+24%
Nvidia GeForce RTX 2070 Super GeForce RTX 2070 Super (Desktop), R7 2700X
91 (75min - 111max ) fps+14%
AMD Radeon RX 5700 XT Radeon RX 5700 XT (Desktop), R7 2700X
89 (75min - 104max ) fps+11%
MSI RTX 2070 Gaming Z 8G GeForce RTX 2070 (Desktop), R7 2700X
88 (77min - 102max ) fps+10%
Nvidia GeForce RTX 2060 Super GeForce RTX 2060 Super (Desktop), R7 2700X
83 (70min - 98max ) fps+4%
AMD Radeon RX 5700 Radeon RX 5700 (Desktop), R7 2700X
Nvidia Titan RTXNVIDIA Titan RTX, R7 2700X, ADATA Premier Pro SP900NS38 512 GB MSI RTX 2060 Gaming Z 6G GeForce RTX 2060 (Desktop), R7 2700X MSI RTX 2070 Gaming Z 8G GeForce RTX 2070 (Desktop), R7 2700X MSI RTX 2080 Gaming X Trio GeForce RTX 2080 (Desktop), R7 2700X AMD Radeon VIIRadeon VII, R7 2700X Nvidia GeForce RTX 2060 Super GeForce RTX 2060 Super (Desktop), R7 2700X Nvidia GeForce RTX 2070 Super GeForce RTX 2070 Super (Desktop), R7 2700X AMD Radeon RX 5700 Radeon RX 5700 (Desktop), R7 2700X AMD Radeon RX 5700 XT Radeon RX 5700 XT (Desktop), R7 2700X Nvidia Titan RTXNVIDIA Titan RTX, R7 2700X, ADATA Premier Pro SP900NS38 512 GB MSI RTX 2080 Gaming X Trio GeForce RTX 2080 (Desktop), R7 2700X Nvidia GeForce RTX 2070 Super GeForce RTX 2070 Super (Desktop), R7 2700X AMD Radeon RX 5700 XT Radeon RX 5700 XT (Desktop), R7 2700X MSI RTX 2070 Gaming Z 8G GeForce RTX 2070 (Desktop), R7 2700X AMD Radeon VIIRadeon VII, R7 2700X AMD Radeon RX 5700 Radeon RX 5700 (Desktop), R7 2700X Nvidia GeForce RTX 2060 Super GeForce RTX 2060 Super (Desktop), R7 2700X MSI RTX 2060 Gaming Z 6G GeForce RTX 2060 (Desktop), R7 2700X MSI RTX 2070 Gaming Z 8G GeForce RTX 2070 (Desktop), R7 2700X MSI RTX 2080 Gaming X Trio GeForce RTX 2080 (Desktop), R7 2700X Nvidia GeForce RTX 2070 Super GeForce RTX 2070 Super (Desktop), R7 2700X AMD Radeon RX 5700 Radeon RX 5700 (Desktop), R7 2700X AMD Radeon RX 5700 XT Radeon RX 5700 XT (Desktop), R7 2700X Nvidia GeForce RTX 2060 Super GeForce RTX 2060 Super (Desktop), R7 2700X
Nvidia Titan RTXNVIDIA Titan RTX, R7 2700X, ADATA Premier Pro SP900NS38 512 GB MSI RTX 2080 Gaming X Trio GeForce RTX 2080 (Desktop), R7 2700X MSI RTX 2070 Gaming Z 8G GeForce RTX 2070 (Desktop), R7 2700X Nvidia GeForce RTX 2070 Super GeForce RTX 2070 Super (Desktop), R7 2700X Nvidia GeForce RTX 2060 Super GeForce RTX 2060 Super (Desktop), R7 2700X MSI RTX 2060 Gaming Z 6G GeForce RTX 2060 (Desktop), R7 2700X AMD Radeon RX Vega 64 RX Vega 64, R7 2700X AMD Radeon VIIRadeon VII, R7 2700X AMD Radeon RX 5700 Radeon RX 5700 (Desktop), R7 2700X AMD Radeon RX 5700 XT Radeon RX 5700 XT (Desktop), R7 2700X Nvidia Titan RTXNVIDIA Titan RTX, R7 2700X, ADATA Premier Pro SP900NS38 512 GB MSI RTX 2080 Gaming X Trio GeForce RTX 2080 (Desktop), R7 2700X AMD Radeon VIIRadeon VII, R7 2700X Nvidia GeForce RTX 2070 Super GeForce RTX 2070 Super (Desktop), R7 2700X MSI RTX 2070 Gaming Z 8G GeForce RTX 2070 (Desktop), R7 2700X Nvidia GeForce RTX 2060 Super GeForce RTX 2060 Super (Desktop), R7 2700X MSI RTX 2060 Gaming Z 6G GeForce RTX 2060 (Desktop), R7 2700X AMD Radeon RX 5700 XT Radeon RX 5700 XT (Desktop), R7 2700X AMD Radeon RX 5700 Radeon RX 5700 (Desktop), R7 2700X AMD Radeon RX Vega 64 RX Vega 64, R7 2700X MSI RTX 2080 Gaming X Trio GeForce RTX 2080 (Desktop), R7 2700X Nvidia GeForce RTX 2070 Super GeForce RTX 2070 Super (Desktop), R7 2700X MSI RTX 2070 Gaming Z 8G GeForce RTX 2070 (Desktop), R7 2700X Nvidia GeForce RTX 2060 Super GeForce RTX 2060 Super (Desktop), R7 2700X AMD Radeon RX 5700 XT Radeon RX 5700 XT (Desktop), R7 2700X AMD Radeon RX 5700 Radeon RX 5700 (Desktop), R7 2700X
Nvidia Titan RTXNVIDIA Titan RTX, R7 2700X, ADATA Premier Pro SP900NS38 512 GB
79 (61min - 108max ) fps+23%
MSI RTX 2080 Gaming X Trio GeForce RTX 2080 (Desktop), R7 2700X
78 (53min - 100max ) fps+22%
Nvidia GeForce RTX 2070 Super GeForce RTX 2070 Super (Desktop), R7 2700X
78 (55min - 106max ) fps+22%
MSI RTX 2070 Gaming Z 8G GeForce RTX 2070 (Desktop), R7 2700X
77.9 (58min - 99max ) fps+22%
Nvidia GeForce RTX 2060 Super GeForce RTX 2060 Super (Desktop), R7 2700X
77 (50min - 100max ) fps+20%
AMD Radeon RX 5700 XT Radeon RX 5700 XT (Desktop), R7 2700X
73 (56min - 102max ) fps+14%
AMD Radeon RX Vega 64 RX Vega 64, R7 2700X
72.9 (55min - 90max ) fps+14%
AMD Radeon VIIRadeon VII, R7 2700X
71 (51min - 95max ) fps+11%
MSI RTX 2060 Gaming Z 6G GeForce RTX 2060 (Desktop), R7 2700X
70 (50min - 83max ) fps+9%
AMD Radeon RX 5700 Radeon RX 5700 (Desktop), R7 2700X Nvidia Titan RTXNVIDIA Titan RTX, R7 2700X, ADATA Premier Pro SP900NS38 512 GB
49 (41min - 56max ) fps+87%
MSI RTX 2080 Gaming X Trio GeForce RTX 2080 (Desktop), R7 2700X
39.1 (32min - 44max ) fps+49%
AMD Radeon RX Vega 64 RX Vega 64, R7 2700X
36.5 (31min - 40max ) fps+39%
Nvidia GeForce RTX 2070 Super GeForce RTX 2070 Super (Desktop), R7 2700X
35.4 (30min - 40max ) fps+35%
AMD Radeon VIIRadeon VII, R7 2700X
30.8 (25min - 35max ) fps+18%
MSI RTX 2070 Gaming Z 8G GeForce RTX 2070 (Desktop), R7 2700X
30.7 (26min - 34max ) fps+17%
Nvidia GeForce RTX 2060 Super GeForce RTX 2060 Super (Desktop), R7 2700X
30 (24min - 34max ) fps+15%
AMD Radeon RX 5700 XT Radeon RX 5700 XT (Desktop), R7 2700X
29.6 (24min - 34max ) fps+13%
AMD Radeon RX 5700 Radeon RX 5700 (Desktop), R7 2700X MSI RTX 2060 Gaming Z 6G GeForce RTX 2060 (Desktop), R7 2700X
25 (21min - 29max ) fps-5%
MSI RTX 2080 Gaming X Trio GeForce RTX 2080 (Desktop), R7 2700X
70 (55min - 83max ) fps+34%
Nvidia GeForce RTX 2070 Super GeForce RTX 2070 Super (Desktop), R7 2700X
65 (52min - 80max ) fps+25%
AMD Radeon RX 5700 XT Radeon RX 5700 XT (Desktop), R7 2700X
59 (49min - 68max ) fps+13%
Nvidia GeForce RTX 2060 Super GeForce RTX 2060 Super (Desktop), R7 2700X
58.1 (47min - 69max ) fps+11%
MSI RTX 2070 Gaming Z 8G GeForce RTX 2070 (Desktop), R7 2700X
58 (44min - 68max ) fps+11%
AMD Radeon RX 5700 Radeon RX 5700 (Desktop), R7 2700X
Nvidia GeForce RTX 2070 Super GeForce RTX 2070 Super (Desktop), R7 2700X
168 (148min - 200max ) fps+42%
Nvidia GeForce RTX 2060 Super GeForce RTX 2060 Super (Desktop), R7 2700X
159 (133min - 195max ) fps+35%
MSI RTX 2080 Gaming X Trio GeForce RTX 2080 (Desktop), R7 2700X
147 (115min - 180max ) fps+25%
AMD Radeon RX 5700 XT Radeon RX 5700 XT (Desktop), R7 2700X
143 (123min - 167max ) fps+21%
MSI RTX 2060 Gaming Z 6G GeForce RTX 2060 (Desktop), R7 2700X
141 (118min - 156max ) fps+19%
MSI RTX 2070 Gaming Z 8G GeForce RTX 2070 (Desktop), R7 2700X
135.6 (111min - 161max ) fps+15%
Nvidia Titan RTXNVIDIA Titan RTX, R7 2700X, ADATA Premier Pro SP900NS38 512 GB
134 (100min - 197max ) fps+14%
AMD Radeon RX 5700 Radeon RX 5700 (Desktop), R7 2700X AMD Radeon VIIRadeon VII, R7 2700X
114 (97min - 125max ) fps-3%
Nvidia Titan RTXNVIDIA Titan RTX, R7 2700X, ADATA Premier Pro SP900NS38 512 GB
74 (59min - 87max ) fps+89%
MSI RTX 2080 Gaming X Trio GeForce RTX 2080 (Desktop), R7 2700X
66 (58min - 71max ) fps+69%
Nvidia GeForce RTX 2070 Super GeForce RTX 2070 Super (Desktop), R7 2700X
58.1 (56min - 60max ) fps+49%
MSI RTX 2070 Gaming Z 8G GeForce RTX 2070 (Desktop), R7 2700X
53.2 (46min - 60max ) fps+36%
Nvidia GeForce RTX 2060 Super GeForce RTX 2060 Super (Desktop), R7 2700X
49.5 (46min - 55max ) fps+27%
AMD Radeon RX 5700 XT Radeon RX 5700 XT (Desktop), R7 2700X
45.4 (39min - 49max ) fps+16%
AMD Radeon VIIRadeon VII, R7 2700X
44.4 (40min - 50max ) fps+14%
AMD Radeon RX 5700 Radeon RX 5700 (Desktop), R7 2700X MSI RTX 2060 Gaming Z 6G GeForce RTX 2060 (Desktop), R7 2700X
38 (32min - 42max ) fps-3%
MSI RTX 2080 Gaming X Trio GeForce RTX 2080 (Desktop), R7 2700X
128 (113min - 139max ) fps+66%
Nvidia GeForce RTX 2070 Super GeForce RTX 2070 Super (Desktop), R7 2700X
117 (105min - 137max ) fps+52%
MSI RTX 2070 Gaming Z 8G GeForce RTX 2070 (Desktop), R7 2700X
100.2 (88min - 118max ) fps+30%
Nvidia GeForce RTX 2060 Super GeForce RTX 2060 Super (Desktop), R7 2700X
100 (92min - 115max ) fps+30%
AMD Radeon RX 5700 XT Radeon RX 5700 XT (Desktop), R7 2700X
93 (83min - 103max ) fps+21%
AMD Radeon RX 5700 Radeon RX 5700 (Desktop), R7 2700X
Nvidia Titan RTXNVIDIA Titan RTX, R7 2700X, ADATA Premier Pro SP900NS38 512 GB
112 (65min - 172max ) fps+88%
MSI RTX 2080 Gaming X Trio GeForce RTX 2080 (Desktop), R7 2700X Nvidia GeForce RTX 2070 Super GeForce RTX 2070 Super (Desktop), R7 2700X
89 (45min - 141max ) fps+49%
MSI RTX 2070 Gaming Z 8G GeForce RTX 2070 (Desktop), R7 2700X
83.5 (36min - 125max ) fps+40%
Nvidia GeForce RTX 2060 Super GeForce RTX 2060 Super (Desktop), R7 2700X
79 (36min - 121max ) fps+33%
MSI RTX 2060 Gaming Z 6G GeForce RTX 2060 (Desktop), R7 2700X
72.6 (31min - 114max ) fps+22%
AMD Radeon RX 5700 XT Radeon RX 5700 XT (Desktop), R7 2700X
69 (34min - 112max ) fps+16%
AMD Radeon RX 5700 Radeon RX 5700 (Desktop), R7 2700X
59.6 (18min - 102max ) fps
AMD Radeon RX Vega 64 RX Vega 64, R7 2700X
58.5 (23min - 92max ) fps-2%
AMD Radeon RX Vega 64 RX Vega 64, R7 2700X
58.5 (23min - 92max ) fps-2%
Nvidia Titan RTXNVIDIA Titan RTX, R7 2700X, ADATA Premier Pro SP900NS38 512 GB
58 (39min - 87max ) fps+101%
MSI RTX 2080 Gaming X Trio GeForce RTX 2080 (Desktop), R7 2700X Nvidia GeForce RTX 2070 Super GeForce RTX 2070 Super (Desktop), R7 2700X
40.6 (17min - 58max ) fps+40%
MSI RTX 2070 Gaming Z 8G GeForce RTX 2070 (Desktop), R7 2700X
38.2 (21min - 56max ) fps+32%
Nvidia GeForce RTX 2060 Super GeForce RTX 2060 Super (Desktop), R7 2700X
35 (19min - 53max ) fps+21%
AMD Radeon RX 5700 XT Radeon RX 5700 XT (Desktop), R7 2700X
32.8 (6min - 51max ) fps+13%
MSI RTX 2060 Gaming Z 6G GeForce RTX 2060 (Desktop), R7 2700X
30.8 (13min - 45max ) fps+7%
AMD Radeon RX 5700 Radeon RX 5700 (Desktop), R7 2700X AMD Radeon RX Vega 64 RX Vega 64, R7 2700X
27.9 (20min - 42max ) fps-3%
AMD Radeon RX Vega 64 RX Vega 64, R7 2700X
27.9 (20min - 42max ) fps-3%
AMD Radeon RX Vega 64 RX Vega 64, R7 2700X
96 (67min - 113max ) fps+5%
MSI RTX 2070 Gaming Z 8G GeForce RTX 2070 (Desktop), R7 2700X
94 (64min - 110max ) fps+3%
AMD Radeon VIIRadeon VII, R7 2700X
94 (67min - 112max ) fps+3%
MSI RTX 2060 Gaming Z 6G GeForce RTX 2060 (Desktop), R7 2700X
91 (66min - 109max ) fps0%
AMD Radeon RX 5700 Radeon RX 5700 (Desktop), R7 2700X MSI RTX 2080 Gaming X Trio GeForce RTX 2080 (Desktop), R7 2700X
90 (65min - 107max ) fps-1%
Nvidia GeForce RTX 2060 Super GeForce RTX 2060 Super (Desktop), R7 2700X
90 (65min - 106max ) fps-1%
Nvidia GeForce RTX 2070 Super GeForce RTX 2070 Super (Desktop), R7 2700X
90 (64min - 106max ) fps-1%
AMD Radeon RX 5700 XT Radeon RX 5700 XT (Desktop), R7 2700X
89 (60min - 106max ) fps-2%
Nvidia Titan RTXNVIDIA Titan RTX, R7 2700X, ADATA Premier Pro SP900NS38 512 GB
88 (63min - 105max ) fps-3%
Nvidia Titan RTXNVIDIA Titan RTX, R7 2700X, ADATA Premier Pro SP900NS38 512 GB
88 (72min - 99max ) fps+69%
MSI RTX 2080 Gaming X Trio GeForce RTX 2080 (Desktop), R7 2700X
71 (65min - 78max ) fps+37%
AMD Radeon VIIRadeon VII, R7 2700X
69 (61min - 76max ) fps+33%
Nvidia GeForce RTX 2070 Super GeForce RTX 2070 Super (Desktop), R7 2700X
64 (59min - 71max ) fps+23%
MSI RTX 2070 Gaming Z 8G GeForce RTX 2070 (Desktop), R7 2700X
59 (54min - 64max ) fps+13%
AMD Radeon RX 5700 XT Radeon RX 5700 XT (Desktop), R7 2700X
59 (53min - 63max ) fps+13%
Nvidia GeForce RTX 2060 Super GeForce RTX 2060 Super (Desktop), R7 2700X
55 (50min - 61max ) fps+6%
AMD Radeon RX 5700 Radeon RX 5700 (Desktop), R7 2700X MSI RTX 2060 Gaming Z 6G GeForce RTX 2060 (Desktop), R7 2700X
50 (46min - 55max ) fps-4%
AMD Radeon RX Vega 64 RX Vega 64, R7 2700X
49 (45min - 54max ) fps-6%
Nvidia Titan RTXNVIDIA Titan RTX, R7 2700X, ADATA Premier Pro SP900NS38 512 GB
128 (111min - 142max ) fps+60%
MSI RTX 2080 Gaming X Trio GeForce RTX 2080 (Desktop), R7 2700X
109 (94min - 120max ) fps+36%
Nvidia GeForce RTX 2070 Super GeForce RTX 2070 Super (Desktop), R7 2700X
97 (83min - 109max ) fps+21%
AMD Radeon RX 5700 XT Radeon RX 5700 XT (Desktop), R7 2700X
92 (79min - 99max ) fps+15%
MSI RTX 2070 Gaming Z 8G GeForce RTX 2070 (Desktop), R7 2700X
89.9 (81min - 101max ) fps+12%
AMD Radeon RX 5700 Radeon RX 5700 (Desktop), R7 2700X Nvidia GeForce RTX 2060 Super GeForce RTX 2060 Super (Desktop), R7 2700X
79 (67min - 89max ) fps-1%
AMD Radeon RX Vega 64 RX Vega 64, R7 2700X
77 (67min - 84max ) fps-4%
AMD Radeon VIIRadeon VII, R7 2700X
75 (65min - 83max ) fps-6%
MSI RTX 2060 Gaming Z 6G GeForce RTX 2060 (Desktop), R7 2700X
72.7 (61min - 82max ) fps-9%
Nvidia Titan RTXNVIDIA Titan RTX, R7 2700X, ADATA Premier Pro SP900NS38 512 GB
102 (90min - 110max ) fps+118%
MSI RTX 2080 Gaming X Trio GeForce RTX 2080 (Desktop), R7 2700X
78 (69min - 87max ) fps+67%
Nvidia GeForce RTX 2070 Super GeForce RTX 2070 Super (Desktop), R7 2700X
68 (61min - 74max ) fps+45%
MSI RTX 2070 Gaming Z 8G GeForce RTX 2070 (Desktop), R7 2700X
64.3 (59min - 70max ) fps+37%
Nvidia GeForce RTX 2060 Super GeForce RTX 2060 Super (Desktop), R7 2700X
57 (51min - 62max ) fps+22%
AMD Radeon VIIRadeon VII, R7 2700X
54.3 (50min - 59max ) fps+16%
AMD Radeon RX 5700 XT Radeon RX 5700 XT (Desktop), R7 2700X
52.1 (47min - 57max ) fps+11%
MSI RTX 2060 Gaming Z 6G GeForce RTX 2060 (Desktop), R7 2700X
51.3 (44min - 58max ) fps+10%
AMD Radeon RX Vega 64 RX Vega 64, R7 2700X
49.1 (44min - 54max ) fps+5%
AMD Radeon RX 5700 Radeon RX 5700 (Desktop), R7 2700X
Nvidia Titan RTXNVIDIA Titan RTX, R7 2700X, ADATA Premier Pro SP900NS38 512 GB MSI RTX 2080 Gaming X Trio GeForce RTX 2080 (Desktop), R7 2700X AMD Radeon RX 5700 XT Radeon RX 5700 XT (Desktop), R7 2700X AMD Radeon RX 5700 Radeon RX 5700 (Desktop), R7 2700X Nvidia GeForce RTX 2070 Super GeForce RTX 2070 Super (Desktop), R7 2700X MSI RTX 2070 Gaming Z 8G GeForce RTX 2070 (Desktop), R7 2700X Nvidia GeForce RTX 2060 Super GeForce RTX 2060 Super (Desktop), R7 2700X AMD Radeon RX Vega 64 RX Vega 64, R7 2700X MSI RTX 2060 Gaming Z 6G GeForce RTX 2060 (Desktop), R7 2700X AMD Radeon VIIRadeon VII, R7 2700X Nvidia Titan RTXNVIDIA Titan RTX, R7 2700X, ADATA Premier Pro SP900NS38 512 GB MSI RTX 2080 Gaming X Trio GeForce RTX 2080 (Desktop), R7 2700X AMD Radeon RX 5700 XT Radeon RX 5700 XT (Desktop), R7 2700X Nvidia GeForce RTX 2070 Super GeForce RTX 2070 Super (Desktop), R7 2700X AMD Radeon VIIRadeon VII, R7 2700X MSI RTX 2070 Gaming Z 8G GeForce RTX 2070 (Desktop), R7 2700X AMD Radeon RX 5700 Radeon RX 5700 (Desktop), R7 2700X Nvidia GeForce RTX 2060 Super GeForce RTX 2060 Super (Desktop), R7 2700X AMD Radeon RX Vega 64 RX Vega 64, R7 2700X MSI RTX 2060 Gaming Z 6G GeForce RTX 2060 (Desktop), R7 2700X
Nvidia Titan RTXNVIDIA Titan RTX, R7 2700X, ADATA Premier Pro SP900NS38 512 GB
213 (107min - 286max ) fps+48%
MSI RTX 2080 Gaming X Trio GeForce RTX 2080 (Desktop), R7 2700X
169.7 (120min - 227max ) fps+18%
AMD Radeon RX 5700 XT Radeon RX 5700 XT (Desktop), R7 2700X
156.4 (113min - 227max ) fps+9%
Nvidia GeForce RTX 2070 Super GeForce RTX 2070 Super (Desktop), R7 2700X
152.5 (84min - 204max ) fps+6%
AMD Radeon RX 5700 Radeon RX 5700 (Desktop), R7 2700X
143.5 (103min - 201max ) fps
MSI RTX 2070 Gaming Z 8G GeForce RTX 2070 (Desktop), R7 2700X
141.6 (95min - 199max ) fps-1%
Nvidia GeForce RTX 2060 Super GeForce RTX 2060 Super (Desktop), R7 2700X
133.9 (88min - 191max ) fps-7%
AMD Radeon RX Vega 64 RX Vega 64, R7 2700X
127.7 (106min - 167max ) fps-11%
MSI RTX 2060 Gaming Z 6G GeForce RTX 2060 (Desktop), R7 2700X
122 (72min - 171max ) fps-15%
AMD Radeon VIIRadeon VII, R7 2700X Nvidia Titan RTXNVIDIA Titan RTX, R7 2700X, ADATA Premier Pro SP900NS38 512 GB
101 (68min - 127max ) fps+78%
MSI RTX 2080 Gaming X Trio GeForce RTX 2080 (Desktop), R7 2700X
76.8 (56min - 96max ) fps+35%
Nvidia GeForce RTX 2070 Super GeForce RTX 2070 Super (Desktop), R7 2700X
69 (43min - 83max ) fps+22%
AMD Radeon VIIRadeon VII, R7 2700X AMD Radeon RX 5700 XT Radeon RX 5700 XT (Desktop), R7 2700X
63.5 (94min - 75max ) fps+12%
MSI RTX 2070 Gaming Z 8G GeForce RTX 2070 (Desktop), R7 2700X
63.2 (46min - 76max ) fps+11%
Nvidia GeForce RTX 2060 Super GeForce RTX 2060 Super (Desktop), R7 2700X
58.3 (43min - 71max ) fps+3%
AMD Radeon RX 5700 Radeon RX 5700 (Desktop), R7 2700X MSI RTX 2060 Gaming Z 6G GeForce RTX 2060 (Desktop), R7 2700X
53 (39min - 63max ) fps-7%
AMD Radeon RX Vega 64 RX Vega 64, R7 2700X
49 (40min - 58max ) fps-14%
Nvidia Titan RTXNVIDIA Titan RTX, R7 2700X, ADATA Premier Pro SP900NS38 512 GB
86 (70min - 96max ) fps+42%
MSI RTX 2080 Gaming X Trio GeForce RTX 2080 (Desktop), R7 2700X
73.9 (44min - 83max ) fps+22%
Nvidia GeForce RTX 2070 Super GeForce RTX 2070 Super (Desktop), R7 2700X
67.8 (53min - 76max ) fps+12%
AMD Radeon RX 5700 XT Radeon RX 5700 XT (Desktop), R7 2700X
64.8 (50min - 76max ) fps+7%
MSI RTX 2070 Gaming Z 8G GeForce RTX 2070 (Desktop), R7 2700X
64.1 (55min - 73max ) fps+6%
Nvidia GeForce RTX 2060 Super GeForce RTX 2060 Super (Desktop), R7 2700X
62.4 (40min - 72max ) fps+3%
AMD Radeon RX 5700 Radeon RX 5700 (Desktop), R7 2700X MSI RTX 2060 Gaming Z 6G GeForce RTX 2060 (Desktop), R7 2700X
56 (49min - 63max ) fps-7%
AMD Radeon RX Vega 64 RX Vega 64, R7 2700X
53 (43min - 60max ) fps-12%
AMD Radeon VIIRadeon VII, R7 2700X Nvidia Titan RTXNVIDIA Titan RTX, R7 2700X, ADATA Premier Pro SP900NS38 512 GB
49 (42min - 55max ) fps+56%
MSI RTX 2080 Gaming X Trio GeForce RTX 2080 (Desktop), R7 2700X
38.9 (34min - 44max ) fps+24%
Nvidia GeForce RTX 2070 Super GeForce RTX 2070 Super (Desktop), R7 2700X
35.3 (30min - 40max ) fps+12%
AMD Radeon RX 5700 XT Radeon RX 5700 XT (Desktop), R7 2700X
34.7 (28min - 40max ) fps+11%
MSI RTX 2070 Gaming Z 8G GeForce RTX 2070 (Desktop), R7 2700X
32.6 (28min - 37max ) fps+4%
AMD Radeon RX 5700 Radeon RX 5700 (Desktop), R7 2700X Nvidia GeForce RTX 2060 Super GeForce RTX 2060 Super (Desktop), R7 2700X
31 (27min - 35max ) fps-1%
Nvidia Titan RTXNVIDIA Titan RTX, R7 2700X, ADATA Premier Pro SP900NS38 512 GB MSI RTX 2080 Gaming X Trio GeForce RTX 2080 (Desktop), R7 2700X
116 (6.8min , 83.3P1 - 147max ) fps+40%
AMD Radeon VIIRadeon VII, R7 2700X MSI RTX 2070 Gaming Z 8G GeForce RTX 2070 (Desktop), R7 2700X MSI RTX 2060 Gaming Z 6G GeForce RTX 2060 (Desktop), R7 2700X Nvidia GeForce RTX 2060 Super GeForce RTX 2060 Super (Desktop), R7 2700X
85 (6.02min , 58.8P1 - 158max ) fps+2%
Nvidia GeForce RTX 2070 Super GeForce RTX 2070 Super (Desktop), R7 2700X
84 (6.27min , 55.6P1 - 167max ) fps+1%
AMD Radeon RX 5700 Radeon RX 5700 (Desktop), R7 2700X
83 (6.93min , 52.6P1 - 165max ) fps
AMD Radeon RX 5700 XT Radeon RX 5700 XT (Desktop), R7 2700X
81 (22min , 52.6P1 - 163max ) fps-2%
Nvidia Titan RTXNVIDIA Titan RTX, R7 2700X, ADATA Premier Pro SP900NS38 512 GB Nvidia GeForce RTX 2070 Super GeForce RTX 2070 Super (Desktop), R7 2700X
102 (2.69min , 76.9P1 - 255max ) fps+24%
AMD Radeon RX 5700 XT Radeon RX 5700 XT (Desktop), R7 2700X
90 (14.2min , 71.4P1 - 270max ) fps+10%
MSI RTX 2080 Gaming X Trio GeForce RTX 2080 (Desktop), R7 2700X
89 (9.54min , 62.5P1 - 139max ) fps+9%
Nvidia GeForce RTX 2060 Super GeForce RTX 2060 Super (Desktop), R7 2700X AMD Radeon RX 5700 Radeon RX 5700 (Desktop), R7 2700X
82 (13.1min , 66.7P1 - 128max ) fps
AMD Radeon VIIRadeon VII, R7 2700X MSI RTX 2070 Gaming Z 8G GeForce RTX 2070 (Desktop), R7 2700X MSI RTX 2060 Gaming Z 6G GeForce RTX 2060 (Desktop), R7 2700X
AMD Radeon VIIRadeon VII, R7 2700X
82 (60min - 116max ) fps+3%
AMD Radeon RX 5700 XT Radeon RX 5700 XT (Desktop), R7 2700X
81 (61min - 121max ) fps+1%
AMD Radeon RX 5700 Radeon RX 5700 (Desktop), R7 2700X MSI RTX 2060 Gaming Z 6G GeForce RTX 2060 (Desktop), R7 2700X
79.9 (61min - 117max ) fps0%
MSI RTX 2080 Gaming X Trio GeForce RTX 2080 (Desktop), R7 2700X
79 (60min - 114max ) fps-1%
Nvidia GeForce RTX 2060 Super GeForce RTX 2060 Super (Desktop), R7 2700X
79 (56min - 111max ) fps-1%
AMD Radeon RX Vega 64 RX Vega 64, R7 2700X
78.2 (58min - 110max ) fps-2%
MSI RTX 2070 Gaming Z 8G GeForce RTX 2070 (Desktop), R7 2700X
77.9 (60min - 112max ) fps-3%
Nvidia GeForce RTX 2070 Super GeForce RTX 2070 Super (Desktop), R7 2700X
77 (58min - 110max ) fps-4%
Nvidia Titan RTXNVIDIA Titan RTX, R7 2700X, ADATA Premier Pro SP900NS38 512 GB
75 (55min - 107max ) fps-6%
Nvidia Titan RTXNVIDIA Titan RTX, R7 2700X, ADATA Premier Pro SP900NS38 512 GB
75 (54min - 106max ) fps+61%
MSI RTX 2080 Gaming X Trio GeForce RTX 2080 (Desktop), R7 2700X
60 (46min - 71max ) fps+29%
Nvidia GeForce RTX 2070 Super GeForce RTX 2070 Super (Desktop), R7 2700X
60 (43min - 76max ) fps+29%
AMD Radeon VIIRadeon VII, R7 2700X
52.9 (45min - 61max ) fps+14%
AMD Radeon RX 5700 XT Radeon RX 5700 XT (Desktop), R7 2700X
52.3 (43min - 66max ) fps+12%
AMD Radeon RX Vega 64 RX Vega 64, R7 2700X
47.4 (41min - 55max ) fps+2%
MSI RTX 2070 Gaming Z 8G GeForce RTX 2070 (Desktop), R7 2700X
47.3 (38min - 57max ) fps+2%
AMD Radeon RX 5700 Radeon RX 5700 (Desktop), R7 2700X Nvidia GeForce RTX 2060 Super GeForce RTX 2060 Super (Desktop), R7 2700X
45 (36min - 54max ) fps-3%
MSI RTX 2060 Gaming Z 6G GeForce RTX 2060 (Desktop), R7 2700X
40.7 (35min - 50max ) fps-13%
MSI RTX 2080 Gaming X Trio GeForce RTX 2080 (Desktop), R7 2700X
80 (60min - 111max ) fps+3%
AMD Radeon RX 5700 XT Radeon RX 5700 XT (Desktop), R7 2700X
80 (59min - 111max ) fps+3%
AMD Radeon RX 5700 Radeon RX 5700 (Desktop), R7 2700X Nvidia GeForce RTX 2070 Super GeForce RTX 2070 Super (Desktop), R7 2700X
77 (60min - 109max ) fps-1%
MSI RTX 2070 Gaming Z 8G GeForce RTX 2070 (Desktop), R7 2700X
75.8 (59min - 104max ) fps-3%
Nvidia GeForce RTX 2060 Super GeForce RTX 2060 Super (Desktop), R7 2700X
75 (57min - 105max ) fps-4%
Nvidia Titan RTXNVIDIA Titan RTX, R7 2700X, ADATA Premier Pro SP900NS38 512 GB
160.4 (129min - 168max ) fps+65%
MSI RTX 2080 Gaming X Trio GeForce RTX 2080 (Desktop), R7 2700X
145 (79min - 185max ) fps+49%
AMD Radeon RX Vega 64 RX Vega 64, R7 2700X
138.7 (112min - 194max ) fps+43%
AMD Radeon VIIRadeon VII, R7 2700X
127 (94min - 187max ) fps+31%
MSI RTX 2070 Gaming Z 8G GeForce RTX 2070 (Desktop), R7 2700X
126.8 (69min - 171max ) fps+31%
MSI RTX 2060 Gaming Z 6G GeForce RTX 2060 (Desktop), R7 2700X
119.1 (94min - 167max ) fps+23%
AMD Radeon RX 5700 XT Radeon RX 5700 XT (Desktop), R7 2700X
105 (81min - 150max ) fps+8%
AMD Radeon RX 5700 Radeon RX 5700 (Desktop), R7 2700X Nvidia GeForce RTX 2070 Super GeForce RTX 2070 Super (Desktop), R7 2700X
95 (77min - 133max ) fps-2%
Nvidia GeForce RTX 2060 Super GeForce RTX 2060 Super (Desktop), R7 2700X
87 (56min - 121max ) fps-10%
Nvidia Titan RTXNVIDIA Titan RTX, R7 2700X, ADATA Premier Pro SP900NS38 512 GB
97.3 (62min - 147max ) fps+82%
MSI RTX 2080 Gaming X Trio GeForce RTX 2080 (Desktop), R7 2700X
76 (54min - 115max ) fps+42%
AMD Radeon VIIRadeon VII, R7 2700X
73 (59min - 115max ) fps+36%
MSI RTX 2070 Gaming Z 8G GeForce RTX 2070 (Desktop), R7 2700X
62.6 (46min - 93max ) fps+17%
AMD Radeon RX Vega 64 RX Vega 64, R7 2700X
60.3 (49min - 98max ) fps+13%
AMD Radeon RX 5700 XT Radeon RX 5700 XT (Desktop), R7 2700X
59.5 (49min - 92max ) fps+11%
AMD Radeon RX 5700 Radeon RX 5700 (Desktop), R7 2700X MSI RTX 2060 Gaming Z 6G GeForce RTX 2060 (Desktop), R7 2700X
53.1 (43min - 80max ) fps-1%
Nvidia GeForce RTX 2070 Super GeForce RTX 2070 Super (Desktop), R7 2700X
50.9 (41min - 73max ) fps-5%
Nvidia GeForce RTX 2060 Super GeForce RTX 2060 Super (Desktop), R7 2700X
46.5 (30min - 67max ) fps-13%
MSI RTX 2080 Gaming X Trio GeForce RTX 2080 (Desktop), R7 2700X
125 (98min - 175max ) fps+54%
MSI RTX 2070 Gaming Z 8G GeForce RTX 2070 (Desktop), R7 2700X
103.1 (62min - 149max ) fps+27%
AMD Radeon RX 5700 XT Radeon RX 5700 XT (Desktop), R7 2700X
89 (70min - 130max ) fps+10%
AMD Radeon RX 5700 Radeon RX 5700 (Desktop), R7 2700X Nvidia GeForce RTX 2070 Super GeForce RTX 2070 Super (Desktop), R7 2700X
78 (65min - 110max ) fps-4%
Nvidia GeForce RTX 2060 Super GeForce RTX 2060 Super (Desktop), R7 2700X
71 (45min - 101max ) fps-12%
Nvidia Titan RTXNVIDIA Titan RTX, R7 2700X, ADATA Premier Pro SP900NS38 512 GB
125 (106min - 167max ) fps+33%
MSI RTX 2080 Gaming X Trio GeForce RTX 2080 (Desktop), R7 2700X
124 (109min - 167max ) fps+32%
MSI RTX 2060 Gaming Z 6G GeForce RTX 2060 (Desktop), R7 2700X
122.4 (108min - 163max ) fps+30%
Nvidia GeForce RTX 2070 Super GeForce RTX 2070 Super (Desktop), R7 2700X
121 (107min - 161max ) fps+29%
MSI RTX 2070 Gaming Z 8G GeForce RTX 2070 (Desktop), R7 2700X
120.7 (108min - 159max ) fps+28%
Nvidia GeForce RTX 2060 Super GeForce RTX 2060 Super (Desktop), R7 2700X
118 (106min - 156max ) fps+26%
AMD Radeon RX 5700 XT Radeon RX 5700 XT (Desktop), R7 2700X
116 (101min - 151max ) fps+23%
AMD Radeon VIIRadeon VII, R7 2700X
111 (99min - 144max ) fps+18%
AMD Radeon RX Vega 64 RX Vega 64, R7 2700X
100 (72min - 144max ) fps+6%
AMD Radeon RX 5700 Radeon RX 5700 (Desktop), R7 2700X Nvidia Titan RTXNVIDIA Titan RTX, R7 2700X, ADATA Premier Pro SP900NS38 512 GB
112 (89min - 160max ) fps+142%
MSI RTX 2080 Gaming X Trio GeForce RTX 2080 (Desktop), R7 2700X
83 (63min - 149max ) fps+80%
Nvidia GeForce RTX 2070 Super GeForce RTX 2070 Super (Desktop), R7 2700X
76 (56min - 135max ) fps+65%
MSI RTX 2070 Gaming Z 8G GeForce RTX 2070 (Desktop), R7 2700X
72 (55min - 125max ) fps+56%
Nvidia GeForce RTX 2060 Super GeForce RTX 2060 Super (Desktop), R7 2700X
65 (48min - 114max ) fps+41%
MSI RTX 2060 Gaming Z 6G GeForce RTX 2060 (Desktop), R7 2700X
54.9 (42min - 98max ) fps+19%
AMD Radeon RX 5700 XT Radeon RX 5700 XT (Desktop), R7 2700X
53.2 (39min - 102max ) fps+15%
AMD Radeon VIIRadeon VII, R7 2700X
51.1 (38min - 94max ) fps+11%
AMD Radeon RX 5700 Radeon RX 5700 (Desktop), R7 2700X AMD Radeon RX Vega 64 RX Vega 64, R7 2700X
41.5 (33min - 69max ) fps-10%
MSI RTX 2080 Gaming X Trio GeForce RTX 2080 (Desktop), R7 2700X
123 (109min - 166max ) fps+41%
MSI RTX 2070 Gaming Z 8G GeForce RTX 2070 (Desktop), R7 2700X
118.4 (101min - 160max ) fps+36%
Nvidia GeForce RTX 2070 Super GeForce RTX 2070 Super (Desktop), R7 2700X
118 (95min - 158max ) fps+36%
Nvidia GeForce RTX 2060 Super GeForce RTX 2060 Super (Desktop), R7 2700X
111 (91min - 154max ) fps+28%
AMD Radeon RX 5700 XT Radeon RX 5700 XT (Desktop), R7 2700X
93 (73min - 145max ) fps+7%
AMD Radeon RX 5700 Radeon RX 5700 (Desktop), R7 2700X
Nvidia Titan RTXNVIDIA Titan RTX, R7 2700X, ADATA Premier Pro SP900NS38 512 GB
131 (69min - 164max ) fps+27%
MSI RTX 2080 Gaming X Trio GeForce RTX 2080 (Desktop), R7 2700X
129 (66min - 164max ) fps+25%
Nvidia GeForce RTX 2070 Super GeForce RTX 2070 Super (Desktop), R7 2700X
127 (67min - 150max ) fps+23%
MSI RTX 2070 Gaming Z 8G GeForce RTX 2070 (Desktop), R7 2700X
121.1 (67min - 144max ) fps+18%
AMD Radeon RX 5700 XT Radeon RX 5700 XT (Desktop), R7 2700X
121 (52min - 160max ) fps+17%
AMD Radeon VIIRadeon VII, R7 2700X
119 (58min - 142max ) fps+16%
MSI RTX 2060 Gaming Z 6G GeForce RTX 2060 (Desktop), R7 2700X
110 (71min - 125max ) fps+7%
Nvidia GeForce RTX 2060 Super GeForce RTX 2060 Super (Desktop), R7 2700X
108 (63min - 126max ) fps+5%
AMD Radeon RX 5700 Radeon RX 5700 (Desktop), R7 2700X AMD Radeon RX Vega 64 RX Vega 64, R7 2700X
99.4 (48min - 116max ) fps-3%
Nvidia Titan RTXNVIDIA Titan RTX, R7 2700X, ADATA Premier Pro SP900NS38 512 GB
74 (57min - 84max ) fps+99%
MSI RTX 2080 Gaming X Trio GeForce RTX 2080 (Desktop), R7 2700X
57.6 (47min - 65max ) fps+55%
Nvidia GeForce RTX 2070 Super GeForce RTX 2070 Super (Desktop), R7 2700X
51.3 (42min - 58max ) fps+38%
MSI RTX 2070 Gaming Z 8G GeForce RTX 2070 (Desktop), R7 2700X
45.9 (40min - 52max ) fps+24%
AMD Radeon VIIRadeon VII, R7 2700X
44.2 (35min - 50max ) fps+19%
AMD Radeon RX 5700 XT Radeon RX 5700 XT (Desktop), R7 2700X
41.7 (34min - 47max ) fps+12%
Nvidia GeForce RTX 2060 Super GeForce RTX 2060 Super (Desktop), R7 2700X
41.6 (33min - 47max ) fps+12%
AMD Radeon RX 5700 Radeon RX 5700 (Desktop), R7 2700X AMD Radeon RX Vega 64 RX Vega 64, R7 2700X
35.8 (31min - 40max ) fps-4%
MSI RTX 2060 Gaming Z 6G GeForce RTX 2060 (Desktop), R7 2700X
34.9 (31min - 40max ) fps-6%
Nvidia Titan RTXNVIDIA Titan RTX, R7 2700X, ADATA Premier Pro SP900NS38 512 GB
151 (144min - 159max ) fps+72%
MSI RTX 2080 Gaming X Trio GeForce RTX 2080 (Desktop), R7 2700X
123 (115min - 131max ) fps+40%
Nvidia GeForce RTX 2070 Super GeForce RTX 2070 Super (Desktop), R7 2700X
114 (106min - 121max ) fps+30%
AMD Radeon RX 5700 XT Radeon RX 5700 XT (Desktop), R7 2700X
106 (99min - 120max ) fps+20%
MSI RTX 2070 Gaming Z 8G GeForce RTX 2070 (Desktop), R7 2700X
105.5 (97min - 112max ) fps+20%
Nvidia GeForce RTX 2060 Super GeForce RTX 2060 Super (Desktop), R7 2700X
102 (94min - 109max ) fps+16%
AMD Radeon VIIRadeon VII, R7 2700X
101 (93min - 113max ) fps+15%
MSI RTX 2060 Gaming Z 6G GeForce RTX 2060 (Desktop), R7 2700X
93 (86min - 103max ) fps+6%
AMD Radeon RX Vega 64 RX Vega 64, R7 2700X
92.3 (85min - 101max ) fps+5%
AMD Radeon RX 5700 Radeon RX 5700 (Desktop), R7 2700X Nvidia Titan RTXNVIDIA Titan RTX, R7 2700X, ADATA Premier Pro SP900NS38 512 GB
67 (63min - 72max ) fps+71%
MSI RTX 2080 Gaming X Trio GeForce RTX 2080 (Desktop), R7 2700X
50 (47min - 53max ) fps+28%
Nvidia GeForce RTX 2070 Super GeForce RTX 2070 Super (Desktop), R7 2700X
48.6 (45min - 51max ) fps+24%
AMD Radeon VIIRadeon VII, R7 2700X
45.7 (42min - 49max ) fps+17%
AMD Radeon RX 5700 XT Radeon RX 5700 XT (Desktop), R7 2700X
44.1 (40min - 47max ) fps+13%
MSI RTX 2070 Gaming Z 8G GeForce RTX 2070 (Desktop), R7 2700X
43.2 (36min - 47max ) fps+10%
Nvidia GeForce RTX 2060 Super GeForce RTX 2060 Super (Desktop), R7 2700X
41 (38min - 44max ) fps+5%
AMD Radeon RX 5700 Radeon RX 5700 (Desktop), R7 2700X MSI RTX 2060 Gaming Z 6G GeForce RTX 2060 (Desktop), R7 2700X
37.4 (30min - 41max ) fps-5%
AMD Radeon RX Vega 64 RX Vega 64, R7 2700X
36.4 (33min - 41max ) fps-7%
MSI RTX 2080 Gaming X Trio GeForce RTX 2080 (Desktop), R7 2700X
88 (81min - 92max ) fps+21%
Nvidia GeForce RTX 2070 Super GeForce RTX 2070 Super (Desktop), R7 2700X
86 (79min - 90max ) fps+18%
AMD Radeon RX 5700 XT Radeon RX 5700 XT (Desktop), R7 2700X
84 (77min - 89max ) fps+15%
MSI RTX 2070 Gaming Z 8G GeForce RTX 2070 (Desktop), R7 2700X
75.4 (70min - 81max ) fps+3%
Nvidia GeForce RTX 2060 Super GeForce RTX 2060 Super (Desktop), R7 2700X
75 (70min - 80max ) fps+3%
AMD Radeon RX 5700 Radeon RX 5700 (Desktop), R7 2700X
MSI RTX 2070 Gaming Z 8G GeForce RTX 2070 (Desktop), R7 2700X
144 (143min - 145max ) fps+1%
MSI RTX 2080 Gaming X Trio GeForce RTX 2080 (Desktop), R7 2700X
144 (142min - 145max ) fps+1%
Nvidia Titan RTX 24 GBNVIDIA Titan RTX, TR 2920X Nvidia GeForce RTX 2060 Super GeForce RTX 2060 Super (Desktop), R7 2700X
144 (143min - 145max ) fps+1%
Nvidia GeForce RTX 2070 Super GeForce RTX 2070 Super (Desktop), R7 2700X
144 (143min - 145max ) fps+1%
AMD Radeon RX 5700 XT Radeon RX 5700 XT (Desktop), R7 2700X
144 (143min - 145max ) fps+1%
AMD Radeon RX 5700 Radeon RX 5700 (Desktop), R7 2700X
142 (136min - 145max ) fps
MSI RTX 2060 Gaming Z 6G GeForce RTX 2060 (Desktop), R7 2700X
139 (126min - 145max ) fps-2%
AMD Radeon RX Vega 64 RX Vega 64, R7 2700X
131 (122min - 144max ) fps-8%
Nvidia Titan RTX 24 GBNVIDIA Titan RTX, TR 2920X MSI RTX 2080 Gaming X Trio GeForce RTX 2080 (Desktop), R7 2700X
82 (60min - 87max ) fps+43%
MSI RTX 2070 Gaming Z 8G GeForce RTX 2070 (Desktop), R7 2700X
80 (73min - 93max ) fps+40%
Nvidia GeForce RTX 2070 Super GeForce RTX 2070 Super (Desktop), R7 2700X
78 (67min - 94max ) fps+36%
AMD Radeon RX 5700 XT Radeon RX 5700 XT (Desktop), R7 2700X
65 (56min - 85max ) fps+14%
Nvidia GeForce RTX 2060 Super GeForce RTX 2060 Super (Desktop), R7 2700X
63 (57min - 77max ) fps+10%
AMD Radeon RX 5700 Radeon RX 5700 (Desktop), R7 2700X AMD Radeon RX Vega 64 RX Vega 64, R7 2700X
52.1 (46min - 65max ) fps-9%
MSI RTX 2060 Gaming Z 6G GeForce RTX 2060 (Desktop), R7 2700X
52 (48min - 60max ) fps-9%
Nvidia Titan RTX 24 GBNVIDIA Titan RTX, TR 2920X MSI RTX 2070 Gaming Z 8G GeForce RTX 2070 (Desktop), R7 2700X
138 (129min - 145max ) fps+33%
MSI RTX 2080 Gaming X Trio GeForce RTX 2080 (Desktop), R7 2700X
138 (109min - 145max ) fps+33%
Nvidia GeForce RTX 2070 Super GeForce RTX 2070 Super (Desktop), R7 2700X
132 (122min - 145max ) fps+27%
AMD Radeon RX 5700 XT Radeon RX 5700 XT (Desktop), R7 2700X
117 (104min - 143max ) fps+13%
Nvidia GeForce RTX 2060 Super GeForce RTX 2060 Super (Desktop), R7 2700X
112 (103min - 132max ) fps+8%
AMD Radeon RX 5700 Radeon RX 5700 (Desktop), R7 2700X MSI RTX 2060 Gaming Z 6G GeForce RTX 2060 (Desktop), R7 2700X
98 (91min - 110max ) fps-6%
AMD Radeon RX Vega 64 RX Vega 64, R7 2700X
93 (86min - 111max ) fps-11%
MSI RTX 2080 Gaming X Trio GeForce RTX 2080 (Desktop), R7 2700X
92 (65min - 147max ) fps+11%
MSI RTX 2070 Gaming Z 8G GeForce RTX 2070 (Desktop), R7 2700X
90 (65min - 138max ) fps+8%
MSI RTX 2060 Gaming Z 6G GeForce RTX 2060 (Desktop), R7 2700X
88 (66min - 125max ) fps+6%
Nvidia GeForce RTX 2070 Super GeForce RTX 2070 Super (Desktop), R7 2700X
87 (63min - 135max ) fps+5%
AMD Radeon RX Vega 64 RX Vega 64, R7 2700X
85 (62min - 130max ) fps+2%
Nvidia GeForce RTX 2060 Super GeForce RTX 2060 Super (Desktop), R7 2700X
85 (63min - 134max ) fps+2%
AMD Radeon VIIRadeon VII, R7 2700X
83 (59min - 128max ) fps0%
AMD Radeon RX 5700 Radeon RX 5700 (Desktop), R7 2700X AMD Radeon RX 5700 XT Radeon RX 5700 XT (Desktop), R7 2700X
79 (58min - 120max ) fps-5%
Nvidia Titan RTX 24 GBNVIDIA Titan RTX, TR 2920X
72 (51min - 112max ) fps-13%
Nvidia Titan RTX 24 GBNVIDIA Titan RTX, TR 2920X
68 (52min - 98max ) fps+33%
MSI RTX 2080 Gaming X Trio GeForce RTX 2080 (Desktop), R7 2700X
62 (52min - 76max ) fps+22%
AMD Radeon VIIRadeon VII, R7 2700X
61 (50min - 80max ) fps+20%
Nvidia GeForce RTX 2070 Super GeForce RTX 2070 Super (Desktop), R7 2700X
58 (48min - 72max ) fps+14%
AMD Radeon RX 5700 XT Radeon RX 5700 XT (Desktop), R7 2700X
56 (47min - 73max ) fps+10%
MSI RTX 2070 Gaming Z 8G GeForce RTX 2070 (Desktop), R7 2700X
51 (43min - 61max ) fps0%
AMD Radeon RX 5700 Radeon RX 5700 (Desktop), R7 2700X Nvidia GeForce RTX 2060 Super GeForce RTX 2060 Super (Desktop), R7 2700X
50 (41min - 62max ) fps-2%
AMD Radeon RX Vega 64 RX Vega 64, R7 2700X
47 (38min - 60max ) fps-8%
MSI RTX 2060 Gaming Z 6G GeForce RTX 2060 (Desktop), R7 2700X
42 (35min - 52max ) fps-18%
MSI RTX 2080 Gaming X Trio GeForce RTX 2080 (Desktop), R7 2700X
89 (65min - 129max ) fps+13%
Nvidia GeForce RTX 2070 Super GeForce RTX 2070 Super (Desktop), R7 2700X
86 (61min - 125max ) fps+9%
AMD Radeon VIIRadeon VII, R7 2700X
83 (59min - 127max ) fps+5%
MSI RTX 2070 Gaming Z 8G GeForce RTX 2070 (Desktop), R7 2700X
82 (64min - 110max ) fps+4%
AMD Radeon RX 5700 XT Radeon RX 5700 XT (Desktop), R7 2700X
80 (58min - 122max ) fps+1%
AMD Radeon RX Vega 64 RX Vega 64, R7 2700X
79 (61min - 110max ) fps0%
Nvidia GeForce RTX 2060 Super GeForce RTX 2060 Super (Desktop), R7 2700X
79 (60min - 111max ) fps0%
AMD Radeon RX 5700 Radeon RX 5700 (Desktop), R7 2700X MSI RTX 2060 Gaming Z 6G GeForce RTX 2060 (Desktop), R7 2700X
76 (61min - 95max ) fps-4%
Nvidia Titan RTX 24 GBNVIDIA Titan RTX, TR 2920X
71 (51min - 112max ) fps-10%
MSI RTX 2080 Gaming X Trio GeForce RTX 2080 (Desktop), R7 2700X
74.2 (38min - 122max ) fps+27%
Nvidia Titan RTX 24 GBNVIDIA Titan RTX, TR 2920X
73 (40min - 107max ) fps+25%
Nvidia GeForce RTX 2070 Super GeForce RTX 2070 Super (Desktop), R7 2700X
67.8 (36min - 110max ) fps+16%
AMD Radeon VIIRadeon VII, R7 2700X
67.2 (36min - 104max ) fps+15%
AMD Radeon RX 5700 XT Radeon RX 5700 XT (Desktop), R7 2700X
61 (36.09min - 86.1max ) fps+4%
MSI RTX 2070 Gaming Z 8G GeForce RTX 2070 (Desktop), R7 2700X
60.4 (32min - 94max ) fps+3%
Nvidia GeForce RTX 2060 Super GeForce RTX 2060 Super (Desktop), R7 2700X
58.9 (32min - 92max ) fps+1%
AMD Radeon RX 5700 Radeon RX 5700 (Desktop), R7 2700X
58.6 (32.67min - 85.8max ) fps
AMD Radeon RX Vega 64 RX Vega 64, R7 2700X
56.4 (30min - 87max ) fps-4%
MSI RTX 2060 Gaming Z 6G GeForce RTX 2060 (Desktop), R7 2700X
52.7 (29min - 82max ) fps-10%
Nvidia Titan RTX 24 GBNVIDIA Titan RTX, TR 2920X
51.3 (33min - 76max ) fps+79%
AMD Radeon RX Vega 64 RX Vega 64, R7 2700X
45.7 (26min - 67max ) fps+60%
MSI RTX 2080 Gaming X Trio GeForce RTX 2080 (Desktop), R7 2700X
38.6 (25min - 58max ) fps+35%
AMD Radeon VIIRadeon VII, R7 2700X
37.4 (25min - 50max ) fps+31%
Nvidia GeForce RTX 2070 Super GeForce RTX 2070 Super (Desktop), R7 2700X
35 (23min - 51max ) fps+22%
MSI RTX 2070 Gaming Z 8G GeForce RTX 2070 (Desktop), R7 2700X
31.9 (21min - 45max ) fps+12%
Nvidia GeForce RTX 2060 Super GeForce RTX 2060 Super (Desktop), R7 2700X
29.7 (20min - 42max ) fps+4%
AMD Radeon RX 5700 XT Radeon RX 5700 XT (Desktop), R7 2700X
29.6 (20.7min - 36.64max ) fps+3%
AMD Radeon RX 5700 Radeon RX 5700 (Desktop), R7 2700X
28.6 (19.67min - 36.24max ) fps
MSI RTX 2060 Gaming Z 6G GeForce RTX 2060 (Desktop), R7 2700X
26.3 (17min - 38max ) fps-8%
Nvidia Titan RTX 24 GBNVIDIA Titan RTX, TR 2920X
69 (39min - 102max ) fps+43%
MSI RTX 2080 Gaming X Trio GeForce RTX 2080 (Desktop), R7 2700X
59.6 (34min - 93max ) fps+23%
AMD Radeon VIIRadeon VII, R7 2700X
55.8 (33min - 81max ) fps+15%
AMD Radeon RX 5700 XT Radeon RX 5700 XT (Desktop), R7 2700X
54.5 (31.85min - 78.06max ) fps+13%
Nvidia GeForce RTX 2070 Super GeForce RTX 2070 Super (Desktop), R7 2700X
54.3 (32min - 83max ) fps+12%
MSI RTX 2070 Gaming Z 8G GeForce RTX 2070 (Desktop), R7 2700X
50.3 (30min - 76max ) fps+4%
AMD Radeon RX 5700 Radeon RX 5700 (Desktop), R7 2700X
48.4 (28.7min - 68.51max ) fps
Nvidia GeForce RTX 2060 Super GeForce RTX 2060 Super (Desktop), R7 2700X
46.5 (28min - 69max ) fps-4%
AMD Radeon RX Vega 64 RX Vega 64, R7 2700X
45.7 (26min - 46max ) fps-6%
MSI RTX 2060 Gaming Z 6G GeForce RTX 2060 (Desktop), R7 2700X
41.5 (25min - 61max ) fps-14%
MSI RTX 2080 Gaming X Trio GeForce RTX 2080 (Desktop), R7 2700X
97 (77min - 137max ) fps+13%
AMD Radeon RX Vega 64 RX Vega 64, R7 2700X
93 (76min - 118max ) fps+8%
Nvidia GeForce RTX 2070 Super GeForce RTX 2070 Super (Desktop), R7 2700X
93 (76min - 135max ) fps+8%
Nvidia Titan RTX 24 GBNVIDIA Titan RTX, TR 2920X
92 (76min - 124max ) fps+7%
MSI RTX 2070 Gaming Z 8G GeForce RTX 2070 (Desktop), R7 2700X
91 (75min - 115max ) fps+6%
AMD Radeon VIIRadeon VII, R7 2700X
90.5 (70min - 125max ) fps+5%
Nvidia GeForce RTX 2060 Super GeForce RTX 2060 Super (Desktop), R7 2700X
89 (68min - 126max ) fps+3%
MSI RTX 2060 Gaming Z 6G GeForce RTX 2060 (Desktop), R7 2700X
88 (56min - 109max ) fps+2%
AMD Radeon RX 5700 XT Radeon RX 5700 XT (Desktop), R7 2700X
88 (69min - 121max ) fps+2%
AMD Radeon RX 5700 Radeon RX 5700 (Desktop), R7 2700X Nvidia Titan RTX 24 GBNVIDIA Titan RTX, TR 2920X
90 (74min - 121max ) fps+18%
MSI RTX 2080 Gaming X Trio GeForce RTX 2080 (Desktop), R7 2700X
89 (49min - 116max ) fps+17%
AMD Radeon RX 5700 XT Radeon RX 5700 XT (Desktop), R7 2700X
84 (69min - 100max ) fps+11%
AMD Radeon VIIRadeon VII, R7 2700X
82.8 (69min - 98max ) fps+9%
Nvidia GeForce RTX 2070 Super GeForce RTX 2070 Super (Desktop), R7 2700X
81 (60min - 107max ) fps+7%
MSI RTX 2070 Gaming Z 8G GeForce RTX 2070 (Desktop), R7 2700X
77.1 (64min - 95max ) fps+1%
AMD Radeon RX 5700 Radeon RX 5700 (Desktop), R7 2700X AMD Radeon RX Vega 64 RX Vega 64, R7 2700X
73 (62min - 85max ) fps-4%
Nvidia GeForce RTX 2060 Super GeForce RTX 2060 Super (Desktop), R7 2700X
72 (36min - 91max ) fps-5%
MSI RTX 2060 Gaming Z 6G GeForce RTX 2060 (Desktop), R7 2700X
66 (57min - 79max ) fps-13%
Nvidia Titan RTX 24 GBNVIDIA Titan RTX, TR 2920X
148 (132min - 164max ) fps+44%
AMD Radeon RX 5700 XT Radeon RX 5700 XT (Desktop), R7 2700X
120 (109min - 136max ) fps+17%
Nvidia GeForce RTX 2070 Super GeForce RTX 2070 Super (Desktop), R7 2700X
115 (107min - 127max ) fps+12%
MSI RTX 2080 Gaming X Trio GeForce RTX 2080 (Desktop), R7 2700X
109 (101min - 120max ) fps+6%
AMD Radeon VIIRadeon VII, R7 2700X
106.5 (99min - 121max ) fps+3%
AMD Radeon RX 5700 Radeon RX 5700 (Desktop), R7 2700X MSI RTX 2070 Gaming Z 8G GeForce RTX 2070 (Desktop), R7 2700X
93.2 (86min - 104max ) fps-10%
Nvidia GeForce RTX 2060 Super GeForce RTX 2060 Super (Desktop), R7 2700X
93 (77min - 111max ) fps-10%
AMD Radeon RX Vega 64 RX Vega 64, R7 2700X
89.7 (82min - 100max ) fps-13%
MSI RTX 2060 Gaming Z 6G GeForce RTX 2060 (Desktop), R7 2700X
84.4 (77min - 93max ) fps-18%
Nvidia Titan RTX 24 GBNVIDIA Titan RTX, TR 2920X
83 (77min - 92max ) fps+91%
MSI RTX 2080 Gaming X Trio GeForce RTX 2080 (Desktop), R7 2700X
56.7 (53min - 63max ) fps+31%
Nvidia GeForce RTX 2070 Super GeForce RTX 2070 Super (Desktop), R7 2700X
53.8 (50min - 59max ) fps+24%
AMD Radeon VIIRadeon VII, R7 2700X
52.5 (48min - 57max ) fps+21%
AMD Radeon RX 5700 XT Radeon RX 5700 XT (Desktop), R7 2700X
49.9 (46min - 55max ) fps+15%
MSI RTX 2070 Gaming Z 8G GeForce RTX 2070 (Desktop), R7 2700X
45.9 (43min - 50max ) fps+6%
AMD Radeon RX 5700 Radeon RX 5700 (Desktop), R7 2700X Nvidia GeForce RTX 2060 Super GeForce RTX 2060 Super (Desktop), R7 2700X
42.8 (39min - 51max ) fps-1%
AMD Radeon RX Vega 64 RX Vega 64, R7 2700X
41.5 (38min - 46max ) fps-4%
MSI RTX 2060 Gaming Z 6G GeForce RTX 2060 (Desktop), R7 2700X
39.9 (37min - 44max ) fps-8%
Nvidia Titan RTX 24 GBNVIDIA Titan RTX, TR 2920X
132 (123min - 146max ) fps+71%
Nvidia GeForce RTX 2070 Super GeForce RTX 2070 Super (Desktop), R7 2700X
88 (83min - 97max ) fps+14%
AMD Radeon RX 5700 XT Radeon RX 5700 XT (Desktop), R7 2700X
88 (82min - 98max ) fps+14%
MSI RTX 2080 Gaming X Trio GeForce RTX 2080 (Desktop), R7 2700X
87 (82min - 95max ) fps+13%
AMD Radeon VIIRadeon VII, R7 2700X
83.3 (78min - 91max ) fps+8%
AMD Radeon RX 5700 Radeon RX 5700 (Desktop), R7 2700X MSI RTX 2070 Gaming Z 8G GeForce RTX 2070 (Desktop), R7 2700X
73.8 (70min - 81max ) fps-4%
Nvidia GeForce RTX 2060 Super GeForce RTX 2060 Super (Desktop), R7 2700X
71 (62min - 83max ) fps-8%
AMD Radeon RX Vega 64 RX Vega 64, R7 2700X
69.3 (65min - 76max ) fps-10%
MSI RTX 2060 Gaming Z 6G GeForce RTX 2060 (Desktop), R7 2700X
64.9 (60min - 72max ) fps-16%
Nvidia Titan RTX 24 GBNVIDIA Titan RTX, TR 2920X MSI RTX 2080 Gaming X Trio GeForce RTX 2080 (Desktop), R7 2700X MSI RTX 2070 Gaming Z 8G GeForce RTX 2070 (Desktop), R7 2700X Nvidia GeForce RTX 2070 Super GeForce RTX 2070 Super (Desktop), R7 2700X AMD Radeon RX 5700 XT Radeon RX 5700 XT (Desktop), R7 2700X
88 (30.2min , 50P1 ) fps+13%
MSI RTX 2060 Gaming Z 6G GeForce RTX 2060 (Desktop), R7 2700X Nvidia GeForce RTX 2060 Super GeForce RTX 2060 Super (Desktop), R7 2700X AMD Radeon RX Vega 64 RX Vega 64, R7 2700X AMD Radeon RX 5700 Radeon RX 5700 (Desktop), R7 2700X Nvidia Titan RTX 24 GBNVIDIA Titan RTX, TR 2920X MSI RTX 2080 Gaming X Trio GeForce RTX 2080 (Desktop), R7 2700X MSI RTX 2070 Gaming Z 8G GeForce RTX 2070 (Desktop), R7 2700X Nvidia GeForce RTX 2070 Super GeForce RTX 2070 Super (Desktop), R7 2700X AMD Radeon RX 5700 XT Radeon RX 5700 XT (Desktop), R7 2700X
34.1 (16.9min , 21.4P1 ) fps+14%
MSI RTX 2060 Gaming Z 6G GeForce RTX 2060 (Desktop), R7 2700X AMD Radeon RX Vega 64 RX Vega 64, R7 2700X Nvidia GeForce RTX 2060 Super GeForce RTX 2060 Super (Desktop), R7 2700X AMD Radeon RX 5700 Radeon RX 5700 (Desktop), R7 2700X Nvidia Titan RTX 24 GBNVIDIA Titan RTX, TR 2920X MSI RTX 2080 Gaming X Trio GeForce RTX 2080 (Desktop), R7 2700X MSI RTX 2070 Gaming Z 8G GeForce RTX 2070 (Desktop), R7 2700X Nvidia GeForce RTX 2070 Super GeForce RTX 2070 Super (Desktop), R7 2700X AMD Radeon RX 5700 XT Radeon RX 5700 XT (Desktop), R7 2700X
64 (33.2min , 45.2P1 ) fps+12%
MSI RTX 2060 Gaming Z 6G GeForce RTX 2060 (Desktop), R7 2700X Nvidia GeForce RTX 2060 Super GeForce RTX 2060 Super (Desktop), R7 2700X AMD Radeon RX Vega 64 RX Vega 64, R7 2700X AMD Radeon RX 5700 Radeon RX 5700 (Desktop), R7 2700X
56.9 (22.8min , 39.8P1 ) fps
Nvidia Titan RTX 24 GBNVIDIA Titan RTX, TR 2920X
33 (27min - 40max ) fps+62%
MSI RTX 2080 Gaming X Trio GeForce RTX 2080 (Desktop), R7 2700X
32.3 (30min - 35max ) fps+58%
Nvidia GeForce RTX 2070 Super GeForce RTX 2070 Super (Desktop), R7 2700X
30.4 (24min - 34max ) fps+49%
MSI RTX 2070 Gaming Z 8G GeForce RTX 2070 (Desktop), R7 2700X
25.5 (24min - 29max ) fps+25%
AMD Radeon RX 5700 XT Radeon RX 5700 XT (Desktop), R7 2700X
25.5 (24min - 28max ) fps+25%
Nvidia GeForce RTX 2060 Super GeForce RTX 2060 Super (Desktop), R7 2700X
25 (24min - 27max ) fps+23%
AMD Radeon RX 5700 Radeon RX 5700 (Desktop), R7 2700X MSI RTX 2060 Gaming Z 6G GeForce RTX 2060 (Desktop), R7 2700X
19.8 (16min - 23max ) fps-3%
AMD Radeon RX Vega 64 RX Vega 64, R7 2700X
14.8 (14min - 16max ) fps-27%
MSI RTX 2080 Gaming X Trio GeForce RTX 2080 (Desktop), R7 2700X
43.3 (38min - 59max ) fps+11%
Nvidia GeForce RTX 2070 Super GeForce RTX 2070 Super (Desktop), R7 2700X
42.1 (36min - 45max ) fps+8%
AMD Radeon RX 5700 XT Radeon RX 5700 XT (Desktop), R7 2700X
40.9 (35min - 53max ) fps+5%
MSI RTX 2070 Gaming Z 8G GeForce RTX 2070 (Desktop), R7 2700X
40.6 (35min - 49max ) fps+4%
MSI RTX 2060 Gaming Z 6G GeForce RTX 2060 (Desktop), R7 2700X
40.3 (36min - 46max ) fps+4%
Nvidia GeForce RTX 2060 Super GeForce RTX 2060 Super (Desktop), R7 2700X
40.3 (30min - 55max ) fps+4%
AMD Radeon RX 5700 Radeon RX 5700 (Desktop), R7 2700X Nvidia Titan RTX 24 GBNVIDIA Titan RTX, TR 2920X
33.9 (29min - 43max ) fps-13%
AMD Radeon RX Vega 64 RX Vega 64, R7 2700X
33.1 (31min - 35max ) fps-15%
MSI RTX 2080 Gaming X Trio GeForce RTX 2080 (Desktop), R7 2700X
42.8 (37min - 53max ) fps+16%
Nvidia GeForce RTX 2070 Super GeForce RTX 2070 Super (Desktop), R7 2700X
39.3 (30min - 39max ) fps+6%
AMD Radeon RX 5700 XT Radeon RX 5700 XT (Desktop), R7 2700X
38.6 (34min - 45max ) fps+4%
MSI RTX 2070 Gaming Z 8G GeForce RTX 2070 (Desktop), R7 2700X
37.8 (31min - 45max ) fps+2%
Nvidia GeForce RTX 2060 Super GeForce RTX 2060 Super (Desktop), R7 2700X
37.5 (31min - 47max ) fps+1%
AMD Radeon RX 5700 Radeon RX 5700 (Desktop), R7 2700X MSI RTX 2060 Gaming Z 6G GeForce RTX 2060 (Desktop), R7 2700X
34 (27min - 38max ) fps-8%
Nvidia Titan RTX 24 GBNVIDIA Titan RTX, TR 2920X
33.4 (28min - 43max ) fps-10%
AMD Radeon RX Vega 64 RX Vega 64, R7 2700X
24.1 (22min - 26max ) fps-35%
Nvidia Titan RTX 24 GBNVIDIA Titan RTX, TR 2920X MSI RTX 2080 Gaming X Trio GeForce RTX 2080 (Desktop), R7 2700X Nvidia GeForce RTX 2070 Super GeForce RTX 2070 Super (Desktop), R7 2700X MSI RTX 2070 Gaming Z 8G GeForce RTX 2070 (Desktop), R7 2700X AMD Radeon RX 5700 XT Radeon RX 5700 XT (Desktop), R7 2700X Nvidia GeForce RTX 2060 Super GeForce RTX 2060 Super (Desktop), R7 2700X AMD Radeon RX Vega 64 RX Vega 64, R7 2700X AMD Radeon RX 5700 Radeon RX 5700 (Desktop), R7 2700X MSI RTX 2060 Gaming Z 6G GeForce RTX 2060 (Desktop), R7 2700X Nvidia Titan RTX 24 GBNVIDIA Titan RTX, TR 2920X MSI RTX 2080 Gaming X Trio GeForce RTX 2080 (Desktop), R7 2700X Nvidia GeForce RTX 2070 Super GeForce RTX 2070 Super (Desktop), R7 2700X MSI RTX 2070 Gaming Z 8G GeForce RTX 2070 (Desktop), R7 2700X AMD Radeon RX Vega 64 RX Vega 64, R7 2700X Nvidia GeForce RTX 2060 Super GeForce RTX 2060 Super (Desktop), R7 2700X AMD Radeon RX 5700 XT Radeon RX 5700 XT (Desktop), R7 2700X MSI RTX 2060 Gaming Z 6G GeForce RTX 2060 (Desktop), R7 2700X Nvidia Titan RTX 24 GBNVIDIA Titan RTX, TR 2920X MSI RTX 2080 Gaming X Trio GeForce RTX 2080 (Desktop), R7 2700X Nvidia GeForce RTX 2070 Super GeForce RTX 2070 Super (Desktop), R7 2700X MSI RTX 2070 Gaming Z 8G GeForce RTX 2070 (Desktop), R7 2700X AMD Radeon RX Vega 64 RX Vega 64, R7 2700X Nvidia GeForce RTX 2060 Super GeForce RTX 2060 Super (Desktop), R7 2700X AMD Radeon RX 5700 XT Radeon RX 5700 XT (Desktop), R7 2700X AMD Radeon RX 5700 Radeon RX 5700 (Desktop), R7 2700X MSI RTX 2060 Gaming Z 6G GeForce RTX 2060 (Desktop), R7 2700X
Nvidia Titan RTX 24 GBNVIDIA Titan RTX, TR 2920X
98 (87min - 111max ) fps+66%
Nvidia GeForce RTX 2070 Super GeForce RTX 2070 Super (Desktop), R7 2700X
69 (61min - 77max ) fps+17%
AMD Radeon RX 5700 XT Radeon RX 5700 XT (Desktop), R7 2700X
67 (60min - 74max ) fps+14%
AMD Radeon RX 5700 Radeon RX 5700 (Desktop), R7 2700X Nvidia GeForce RTX 2060 Super GeForce RTX 2060 Super (Desktop), R7 2700X
58 (51min - 66max ) fps-2%
AMD Radeon RX Vega 64 RX Vega 64, R7 2700X
54 (49min - 59max ) fps-8%
AMD Radeon RX 5700 XT Radeon RX 5700 XT (Desktop), R7 2700X
140 (120min - 156max ) fps+13%
Nvidia GeForce RTX 2070 Super GeForce RTX 2070 Super (Desktop), R7 2700X
137 (120min - 153max ) fps+10%
Nvidia Titan RTX 24 GBNVIDIA Titan RTX, TR 2920X
134 (112min - 152max ) fps+8%
AMD Radeon RX Vega 64 RX Vega 64, R7 2700X
124 (113min - 135max ) fps0%
AMD Radeon RX 5700 Radeon RX 5700 (Desktop), R7 2700X
124 (107min - 140max ) fps
Nvidia GeForce RTX 2060 Super GeForce RTX 2060 Super (Desktop), R7 2700X
121 (108min - 136max ) fps-2%
Nvidia Titan RTX 24 GBNVIDIA Titan RTX, TR 2920X
134 (111min - 152max ) fps+35%
Nvidia GeForce RTX 2070 Super GeForce RTX 2070 Super (Desktop), R7 2700X
111 (100min - 125max ) fps+12%
AMD Radeon RX 5700 XT Radeon RX 5700 XT (Desktop), R7 2700X
109 (95min - 120max ) fps+10%
AMD Radeon RX 5700 Radeon RX 5700 (Desktop), R7 2700X Nvidia GeForce RTX 2060 Super GeForce RTX 2060 Super (Desktop), R7 2700X
95 (86min - 107max ) fps-4%
AMD Radeon RX Vega 64 RX Vega 64, R7 2700X
93 (85min - 102max ) fps-6%
MSI RTX 2080 Gaming X Trio GeForce RTX 2080 (Desktop), R7 2700X Nvidia GeForce RTX 2070 Super GeForce RTX 2070 Super (Desktop), R7 2700X MSI RTX 2070 Gaming Z 8G GeForce RTX 2070 (Desktop), R7 2700X AMD Radeon RX 5700 XT Radeon RX 5700 XT (Desktop), R7 2700X Nvidia GeForce RTX 2060 Super GeForce RTX 2060 Super (Desktop), R7 2700X AMD Radeon RX 5700 Radeon RX 5700 (Desktop), R7 2700X Nvidia Titan RTXNVIDIA Titan RTX, R7 2700X, ADATA Premier Pro SP900NS38 512 GB MSI RTX 2070 Gaming Z 8G GeForce RTX 2070 (Desktop), R7 2700X MSI RTX 2080 Gaming X Trio GeForce RTX 2080 (Desktop), R7 2700X Nvidia GeForce RTX 2060 Super GeForce RTX 2060 Super (Desktop), R7 2700X Nvidia GeForce RTX 2070 Super GeForce RTX 2070 Super (Desktop), R7 2700X AMD Radeon RX 5700 XT Radeon RX 5700 XT (Desktop), R7 2700X AMD Radeon RX 5700 Radeon RX 5700 (Desktop), R7 2700X AMD Radeon VIIRadeon VII, R7 2700X MSI RTX 2060 Gaming Z 6G GeForce RTX 2060 (Desktop), R7 2700X Nvidia Titan RTXNVIDIA Titan RTX, R7 2700X, ADATA Premier Pro SP900NS38 512 GB MSI RTX 2080 Gaming X Trio GeForce RTX 2080 (Desktop), R7 2700X Nvidia GeForce RTX 2070 Super GeForce RTX 2070 Super (Desktop), R7 2700X MSI RTX 2070 Gaming Z 8G GeForce RTX 2070 (Desktop), R7 2700X AMD Radeon RX 5700 XT Radeon RX 5700 XT (Desktop), R7 2700X Nvidia GeForce RTX 2060 Super GeForce RTX 2060 Super (Desktop), R7 2700X AMD Radeon VIIRadeon VII, R7 2700X MSI RTX 2060 Gaming Z 6G GeForce RTX 2060 (Desktop), R7 2700X AMD Radeon RX 5700 Radeon RX 5700 (Desktop), R7 2700X
Due to the lack of driver optimizations, consumer graphics cards are only partially suitable for use in workstations. But the compute performance should not remain unexplained, and the less expensive gaming graphics cards have to prove themselves in the tests. In the LuxMark render test, the RX 5700 falls back to the last place. The slightly faster RX 5700 XT MSI RTX 2060 Gaming Z 6G AMD Radeon VII . Overall, the compute performance of the Radeon RX 5700 is mixed.
Nvidia Titan RTXNVIDIA Titan RTX, R7 2700X, ADATA Premier Pro SP900NS38 512 GB AMD Radeon VIIRadeon VII, R7 2700X MSI RTX 2080 Gaming X Trio GeForce RTX 2080 (Desktop), R7 2700X Nvidia GeForce RTX 2070 Super GeForce RTX 2070 Super (Desktop), R7 2700X MSI RTX 2070 Gaming Z 8G GeForce RTX 2070 (Desktop), R7 2700X Nvidia GeForce RTX 2060 Super GeForce RTX 2060 Super (Desktop), R7 2700X MSI RTX 2060 Gaming Z 6G GeForce RTX 2060 (Desktop), R7 2700X AMD Radeon RX 5700 XT Radeon RX 5700 XT (Desktop), R7 2700X AMD Radeon RX 5700 Radeon RX 5700 (Desktop), R7 2700X Nvidia Titan RTXNVIDIA Titan RTX, R7 2700X, ADATA Premier Pro SP900NS38 512 GB MSI RTX 2080 Gaming X Trio GeForce RTX 2080 (Desktop), R7 2700X Nvidia GeForce RTX 2070 Super GeForce RTX 2070 Super (Desktop), R7 2700X MSI RTX 2070 Gaming Z 8G GeForce RTX 2070 (Desktop), R7 2700X Nvidia GeForce RTX 2060 Super GeForce RTX 2060 Super (Desktop), R7 2700X AMD Radeon VIIRadeon VII, R7 2700X AMD Radeon RX 5700 XT Radeon RX 5700 XT (Desktop), R7 2700X MSI RTX 2060 Gaming Z 6G GeForce RTX 2060 (Desktop), R7 2700X AMD Radeon RX 5700 Radeon RX 5700 (Desktop), R7 2700X
Nvidia Titan RTXNVIDIA Titan RTX, R7 2700X, ADATA Premier Pro SP900NS38 512 GB AMD Radeon VIIRadeon VII, R7 2700X MSI RTX 2080 Gaming X Trio GeForce RTX 2080 (Desktop), R7 2700X AMD Radeon RX 5700 XT Radeon RX 5700 XT (Desktop), R7 2700X Nvidia GeForce RTX 2070 Super GeForce RTX 2070 Super (Desktop), R7 2700X MSI RTX 2070 Gaming Z 8G GeForce RTX 2070 (Desktop), R7 2700X AMD Radeon RX 5700 Radeon RX 5700 (Desktop), R7 2700X Nvidia GeForce RTX 2060 Super GeForce RTX 2060 Super (Desktop), R7 2700X MSI RTX 2060 Gaming Z 6G GeForce RTX 2060 (Desktop), R7 2700X Nvidia Titan RTXNVIDIA Titan RTX, R7 2700X, ADATA Premier Pro SP900NS38 512 GB AMD Radeon VIIRadeon VII, R7 2700X MSI RTX 2080 Gaming X Trio GeForce RTX 2080 (Desktop), R7 2700X Nvidia GeForce RTX 2070 Super GeForce RTX 2070 Super (Desktop), R7 2700X MSI RTX 2070 Gaming Z 8G GeForce RTX 2070 (Desktop), R7 2700X AMD Radeon RX 5700 XT Radeon RX 5700 XT (Desktop), R7 2700X AMD Radeon RX 5700 Radeon RX 5700 (Desktop), R7 2700X Nvidia GeForce RTX 2060 Super GeForce RTX 2060 Super (Desktop), R7 2700X MSI RTX 2060 Gaming Z 6G GeForce RTX 2060 (Desktop), R7 2700X Nvidia Titan RTXNVIDIA Titan RTX, R7 2700X, ADATA Premier Pro SP900NS38 512 GB MSI RTX 2080 Gaming X Trio GeForce RTX 2080 (Desktop), R7 2700X Nvidia GeForce RTX 2070 Super GeForce RTX 2070 Super (Desktop), R7 2700X AMD Radeon VIIRadeon VII, R7 2700X MSI RTX 2070 Gaming Z 8G GeForce RTX 2070 (Desktop), R7 2700X Nvidia GeForce RTX 2060 Super GeForce RTX 2060 Super (Desktop), R7 2700X AMD Radeon RX 5700 XT Radeon RX 5700 XT (Desktop), R7 2700X AMD Radeon RX 5700 Radeon RX 5700 (Desktop), R7 2700X MSI RTX 2060 Gaming Z 6G GeForce RTX 2060 (Desktop), R7 2700X Nvidia Titan RTXNVIDIA Titan RTX, R7 2700X, ADATA Premier Pro SP900NS38 512 GB AMD Radeon VIIRadeon VII, R7 2700X AMD Radeon RX 5700 XT Radeon RX 5700 XT (Desktop), R7 2700X MSI RTX 2080 Gaming X Trio GeForce RTX 2080 (Desktop), R7 2700X AMD Radeon RX 5700 Radeon RX 5700 (Desktop), R7 2700X Nvidia GeForce RTX 2070 Super GeForce RTX 2070 Super (Desktop), R7 2700X MSI RTX 2070 Gaming Z 8G GeForce RTX 2070 (Desktop), R7 2700X Nvidia GeForce RTX 2060 Super GeForce RTX 2060 Super (Desktop), R7 2700X MSI RTX 2060 Gaming Z 6G GeForce RTX 2060 (Desktop), R7 2700X AMD Radeon VIIRadeon VII, R7 2700X Nvidia Titan RTXNVIDIA Titan RTX, R7 2700X, ADATA Premier Pro SP900NS38 512 GB AMD Radeon RX 5700 XT Radeon RX 5700 XT (Desktop), R7 2700X MSI RTX 2080 Gaming X Trio GeForce RTX 2080 (Desktop), R7 2700X AMD Radeon RX 5700 Radeon RX 5700 (Desktop), R7 2700X Nvidia GeForce RTX 2070 Super GeForce RTX 2070 Super (Desktop), R7 2700X MSI RTX 2070 Gaming Z 8G GeForce RTX 2070 (Desktop), R7 2700X Nvidia GeForce RTX 2060 Super GeForce RTX 2060 Super (Desktop), R7 2700X MSI RTX 2060 Gaming Z 6G GeForce RTX 2060 (Desktop), R7 2700X Nvidia Titan RTXNVIDIA Titan RTX, R7 2700X, ADATA Premier Pro SP900NS38 512 GB MSI RTX 2080 Gaming X Trio GeForce RTX 2080 (Desktop), R7 2700X Nvidia GeForce RTX 2070 Super GeForce RTX 2070 Super (Desktop), R7 2700X AMD Radeon VIIRadeon VII, R7 2700X AMD Radeon RX 5700 XT Radeon RX 5700 XT (Desktop), R7 2700X MSI RTX 2070 Gaming Z 8G GeForce RTX 2070 (Desktop), R7 2700X Nvidia GeForce RTX 2060 Super GeForce RTX 2060 Super (Desktop), R7 2700X MSI RTX 2060 Gaming Z 6G GeForce RTX 2060 (Desktop), R7 2700X AMD Radeon RX 5700 Radeon RX 5700 (Desktop), R7 2700X
Nvidia Titan RTXNVIDIA Titan RTX, R7 2700X, ADATA Premier Pro SP900NS38 512 GB AMD Radeon RX 5700 XT Radeon RX 5700 XT (Desktop), R7 2700X AMD Radeon RX 5700 Radeon RX 5700 (Desktop), R7 2700X MSI RTX 2080 Gaming X Trio GeForce RTX 2080 (Desktop), R7 2700X AMD Radeon VIIRadeon VII, R7 2700X Nvidia GeForce RTX 2070 Super GeForce RTX 2070 Super (Desktop), R7 2700X MSI RTX 2070 Gaming Z 8G GeForce RTX 2070 (Desktop), R7 2700X MSI RTX 2060 Gaming Z 6G GeForce RTX 2060 (Desktop), R7 2700X Nvidia GeForce RTX 2060 Super GeForce RTX 2060 Super (Desktop), R7 2700X Nvidia Titan RTXNVIDIA Titan RTX, R7 2700X, ADATA Premier Pro SP900NS38 512 GB AMD Radeon RX 5700 XT Radeon RX 5700 XT (Desktop), R7 2700X AMD Radeon RX 5700 Radeon RX 5700 (Desktop), R7 2700X AMD Radeon VIIRadeon VII, R7 2700X MSI RTX 2080 Gaming X Trio GeForce RTX 2080 (Desktop), R7 2700X Nvidia GeForce RTX 2070 Super GeForce RTX 2070 Super (Desktop), R7 2700X MSI RTX 2070 Gaming Z 8G GeForce RTX 2070 (Desktop), R7 2700X Nvidia GeForce RTX 2060 Super GeForce RTX 2060 Super (Desktop), R7 2700X MSI RTX 2060 Gaming Z 6G GeForce RTX 2060 (Desktop), R7 2700X Nvidia Titan RTXNVIDIA Titan RTX, R7 2700X, ADATA Premier Pro SP900NS38 512 GB AMD Radeon RX 5700 XT Radeon RX 5700 XT (Desktop), R7 2700X Nvidia GeForce RTX 2070 Super GeForce RTX 2070 Super (Desktop), R7 2700X AMD Radeon RX 5700 Radeon RX 5700 (Desktop), R7 2700X Nvidia GeForce RTX 2060 Super GeForce RTX 2060 Super (Desktop), R7 2700X MSI RTX 2060 Gaming Z 6G GeForce RTX 2060 (Desktop), R7 2700X Nvidia Titan RTXNVIDIA Titan RTX, R7 2700X, ADATA Premier Pro SP900NS38 512 GB AMD Radeon RX 5700 XT Radeon RX 5700 XT (Desktop), R7 2700X AMD Radeon VIIRadeon VII, R7 2700X MSI RTX 2080 Gaming X Trio GeForce RTX 2080 (Desktop), R7 2700X AMD Radeon RX 5700 Radeon RX 5700 (Desktop), R7 2700X Nvidia GeForce RTX 2070 Super GeForce RTX 2070 Super (Desktop), R7 2700X MSI RTX 2070 Gaming Z 8G GeForce RTX 2070 (Desktop), R7 2700X Nvidia GeForce RTX 2060 Super GeForce RTX 2060 Super (Desktop), R7 2700X MSI RTX 2060 Gaming Z 6G GeForce RTX 2060 (Desktop), R7 2700X Nvidia Titan RTXNVIDIA Titan RTX, R7 2700X, ADATA Premier Pro SP900NS38 512 GB Nvidia GeForce RTX 2070 Super GeForce RTX 2070 Super (Desktop), R7 2700X MSI RTX 2070 Gaming Z 8G GeForce RTX 2070 (Desktop), R7 2700X Nvidia GeForce RTX 2060 Super GeForce RTX 2060 Super (Desktop), R7 2700X MSI RTX 2060 Gaming Z 6G GeForce RTX 2060 (Desktop), R7 2700X AMD Radeon RX 5700 XT Radeon RX 5700 XT (Desktop), R7 2700X AMD Radeon VIIRadeon VII, R7 2700X AMD Radeon RX 5700 Radeon RX 5700 (Desktop), R7 2700X Nvidia Titan RTXNVIDIA Titan RTX, R7 2700X, ADATA Premier Pro SP900NS38 512 GB AMD Radeon VIIRadeon VII, R7 2700X AMD Radeon RX 5700 XT Radeon RX 5700 XT (Desktop), R7 2700X AMD Radeon RX 5700 Radeon RX 5700 (Desktop), R7 2700X Nvidia GeForce RTX 2070 Super GeForce RTX 2070 Super (Desktop), R7 2700X MSI RTX 2070 Gaming Z 8G GeForce RTX 2070 (Desktop), R7 2700X Nvidia GeForce RTX 2060 Super GeForce RTX 2060 Super (Desktop), R7 2700X MSI RTX 2060 Gaming Z 6G GeForce RTX 2060 (Desktop), R7 2700X Nvidia Titan RTXNVIDIA Titan RTX, R7 2700X, ADATA Premier Pro SP900NS38 512 GB MSI RTX 2080 Gaming X Trio GeForce RTX 2080 (Desktop), R7 2700X MSI RTX 2070 Gaming Z 8G GeForce RTX 2070 (Desktop), R7 2700X Nvidia GeForce RTX 2060 Super GeForce RTX 2060 Super (Desktop), R7 2700X Nvidia GeForce RTX 2070 Super GeForce RTX 2070 Super (Desktop), R7 2700X MSI RTX 2060 Gaming Z 6G GeForce RTX 2060 (Desktop), R7 2700X AMD Radeon RX 5700 XT Radeon RX 5700 XT (Desktop), R7 2700X AMD Radeon RX 5700 Radeon RX 5700 (Desktop), R7 2700X AMD Radeon VIIRadeon VII, R7 2700X Nvidia Titan RTXNVIDIA Titan RTX, R7 2700X, ADATA Premier Pro SP900NS38 512 GB AMD Radeon RX 5700 XT Radeon RX 5700 XT (Desktop), R7 2700X AMD Radeon VIIRadeon VII, R7 2700X AMD Radeon RX 5700 Radeon RX 5700 (Desktop), R7 2700X Nvidia GeForce RTX 2070 Super GeForce RTX 2070 Super (Desktop), R7 2700X MSI RTX 2070 Gaming Z 8G GeForce RTX 2070 (Desktop), R7 2700X Nvidia GeForce RTX 2060 Super GeForce RTX 2060 Super (Desktop), R7 2700X MSI RTX 2060 Gaming Z 6G GeForce RTX 2060 (Desktop), R7 2700X Nvidia Titan RTXNVIDIA Titan RTX, R7 2700X, ADATA Premier Pro SP900NS38 512 GB Nvidia GeForce RTX 2070 Super GeForce RTX 2070 Super (Desktop), R7 2700X MSI RTX 2070 Gaming Z 8G GeForce RTX 2070 (Desktop), R7 2700X Nvidia GeForce RTX 2060 Super GeForce RTX 2060 Super (Desktop), R7 2700X MSI RTX 2060 Gaming Z 6G GeForce RTX 2060 (Desktop), R7 2700X AMD Radeon RX 5700 XT Radeon RX 5700 XT (Desktop), R7 2700X AMD Radeon VIIRadeon VII, R7 2700X AMD Radeon RX 5700 Radeon RX 5700 (Desktop), R7 2700X
Nvidia Titan RTXNVIDIA Titan RTX, R7 2700X, ADATA Premier Pro SP900NS38 512 GB AMD Radeon RX 5700 XT Radeon RX 5700 XT (Desktop), R7 2700X AMD Radeon RX 5700 Radeon RX 5700 (Desktop), R7 2700X AMD Radeon VIIRadeon VII, R7 2700X MSI RTX 2080 Gaming X Trio GeForce RTX 2080 (Desktop), R7 2700X Nvidia GeForce RTX 2070 Super GeForce RTX 2070 Super (Desktop), R7 2700X MSI RTX 2070 Gaming Z 8G GeForce RTX 2070 (Desktop), R7 2700X Nvidia GeForce RTX 2060 Super GeForce RTX 2060 Super (Desktop), R7 2700X MSI RTX 2060 Gaming Z 6G GeForce RTX 2060 (Desktop), R7 2700X Nvidia Titan RTXNVIDIA Titan RTX, R7 2700X, ADATA Premier Pro SP900NS38 512 GB AMD Radeon RX 5700 XT Radeon RX 5700 XT (Desktop), R7 2700X AMD Radeon RX 5700 Radeon RX 5700 (Desktop), R7 2700X AMD Radeon VIIRadeon VII, R7 2700X MSI RTX 2080 Gaming X Trio GeForce RTX 2080 (Desktop), R7 2700X Nvidia GeForce RTX 2070 Super GeForce RTX 2070 Super (Desktop), R7 2700X MSI RTX 2070 Gaming Z 8G GeForce RTX 2070 (Desktop), R7 2700X Nvidia GeForce RTX 2060 Super GeForce RTX 2060 Super (Desktop), R7 2700X MSI RTX 2060 Gaming Z 6G GeForce RTX 2060 (Desktop), R7 2700X Nvidia Titan RTXNVIDIA Titan RTX, R7 2700X, ADATA Premier Pro SP900NS38 512 GB AMD Radeon RX 5700 XT Radeon RX 5700 XT (Desktop), R7 2700X Nvidia GeForce RTX 2070 Super GeForce RTX 2070 Super (Desktop), R7 2700X AMD Radeon RX 5700 Radeon RX 5700 (Desktop), R7 2700X Nvidia GeForce RTX 2060 Super GeForce RTX 2060 Super (Desktop), R7 2700X MSI RTX 2060 Gaming Z 6G GeForce RTX 2060 (Desktop), R7 2700X Nvidia Titan RTXNVIDIA Titan RTX, R7 2700X, ADATA Premier Pro SP900NS38 512 GB AMD Radeon VIIRadeon VII, R7 2700X AMD Radeon RX 5700 XT Radeon RX 5700 XT (Desktop), R7 2700X MSI RTX 2080 Gaming X Trio GeForce RTX 2080 (Desktop), R7 2700X Nvidia GeForce RTX 2070 Super GeForce RTX 2070 Super (Desktop), R7 2700X AMD Radeon RX 5700 Radeon RX 5700 (Desktop), R7 2700X MSI RTX 2070 Gaming Z 8G GeForce RTX 2070 (Desktop), R7 2700X Nvidia GeForce RTX 2060 Super GeForce RTX 2060 Super (Desktop), R7 2700X MSI RTX 2060 Gaming Z 6G GeForce RTX 2060 (Desktop), R7 2700X MSI RTX 2080 Gaming X Trio GeForce RTX 2080 (Desktop), R7 2700X Nvidia GeForce RTX 2060 Super GeForce RTX 2060 Super (Desktop), R7 2700X MSI RTX 2070 Gaming Z 8G GeForce RTX 2070 (Desktop), R7 2700X Nvidia Titan RTXNVIDIA Titan RTX, R7 2700X, ADATA Premier Pro SP900NS38 512 GB MSI RTX 2060 Gaming Z 6G GeForce RTX 2060 (Desktop), R7 2700X Nvidia GeForce RTX 2070 Super GeForce RTX 2070 Super (Desktop), R7 2700X AMD Radeon VIIRadeon VII, R7 2700X AMD Radeon RX 5700 XT Radeon RX 5700 XT (Desktop), R7 2700X AMD Radeon RX 5700 Radeon RX 5700 (Desktop), R7 2700X Nvidia Titan RTXNVIDIA Titan RTX, R7 2700X, ADATA Premier Pro SP900NS38 512 GB AMD Radeon VIIRadeon VII, R7 2700X AMD Radeon RX 5700 XT Radeon RX 5700 XT (Desktop), R7 2700X MSI RTX 2080 Gaming X Trio GeForce RTX 2080 (Desktop), R7 2700X Nvidia GeForce RTX 2070 Super GeForce RTX 2070 Super (Desktop), R7 2700X AMD Radeon RX 5700 Radeon RX 5700 (Desktop), R7 2700X MSI RTX 2070 Gaming Z 8G GeForce RTX 2070 (Desktop), R7 2700X Nvidia GeForce RTX 2060 Super GeForce RTX 2060 Super (Desktop), R7 2700X MSI RTX 2060 Gaming Z 6G GeForce RTX 2060 (Desktop), R7 2700X Nvidia Titan RTXNVIDIA Titan RTX, R7 2700X, ADATA Premier Pro SP900NS38 512 GB AMD Radeon RX 5700 XT Radeon RX 5700 XT (Desktop), R7 2700X AMD Radeon RX 5700 Radeon RX 5700 (Desktop), R7 2700X AMD Radeon VIIRadeon VII, R7 2700X MSI RTX 2080 Gaming X Trio GeForce RTX 2080 (Desktop), R7 2700X Nvidia GeForce RTX 2070 Super GeForce RTX 2070 Super (Desktop), R7 2700X MSI RTX 2070 Gaming Z 8G GeForce RTX 2070 (Desktop), R7 2700X MSI RTX 2060 Gaming Z 6G GeForce RTX 2060 (Desktop), R7 2700X Nvidia GeForce RTX 2060 Super GeForce RTX 2060 Super (Desktop), R7 2700X Nvidia Titan RTXNVIDIA Titan RTX, R7 2700X, ADATA Premier Pro SP900NS38 512 GB AMD Radeon VIIRadeon VII, R7 2700X AMD Radeon RX 5700 XT Radeon RX 5700 XT (Desktop), R7 2700X AMD Radeon RX 5700 Radeon RX 5700 (Desktop), R7 2700X MSI RTX 2080 Gaming X Trio GeForce RTX 2080 (Desktop), R7 2700X Nvidia GeForce RTX 2070 Super GeForce RTX 2070 Super (Desktop), R7 2700X MSI RTX 2070 Gaming Z 8G GeForce RTX 2070 (Desktop), R7 2700X Nvidia GeForce RTX 2060 Super GeForce RTX 2060 Super (Desktop), R7 2700X MSI RTX 2060 Gaming Z 6G GeForce RTX 2060 (Desktop), R7 2700X Nvidia Titan RTXNVIDIA Titan RTX, R7 2700X, ADATA Premier Pro SP900NS38 512 GB MSI RTX 2080 Gaming X Trio GeForce RTX 2080 (Desktop), R7 2700X Nvidia GeForce RTX 2070 Super GeForce RTX 2070 Super (Desktop), R7 2700X MSI RTX 2070 Gaming Z 8G GeForce RTX 2070 (Desktop), R7 2700X Nvidia GeForce RTX 2060 Super GeForce RTX 2060 Super (Desktop), R7 2700X MSI RTX 2060 Gaming Z 6G GeForce RTX 2060 (Desktop), R7 2700X AMD Radeon RX 5700 XT Radeon RX 5700 XT (Desktop), R7 2700X AMD Radeon VIIRadeon VII, R7 2700X AMD Radeon RX 5700 Radeon RX 5700 (Desktop), R7 2700X
AMD Radeon VIIRadeon VII, R7 2700X MSI RTX 2080 Gaming X Trio GeForce RTX 2080 (Desktop), R7 2700X Nvidia GeForce RTX 2070 Super GeForce RTX 2070 Super (Desktop), R7 2700X MSI RTX 2070 Gaming Z 8G GeForce RTX 2070 (Desktop), R7 2700X Nvidia GeForce RTX 2060 Super GeForce RTX 2060 Super (Desktop), R7 2700X MSI RTX 2060 Gaming Z 6G GeForce RTX 2060 (Desktop), R7 2700X AMD Radeon RX 5700 XT Radeon RX 5700 XT (Desktop), R7 2700X AMD Radeon RX 5700 Radeon RX 5700 (Desktop), R7 2700X AMD Radeon VIIRadeon VII, R7 2700X MSI RTX 2080 Gaming X Trio GeForce RTX 2080 (Desktop), R7 2700X Nvidia GeForce RTX 2070 Super GeForce RTX 2070 Super (Desktop), R7 2700X MSI RTX 2070 Gaming Z 8G GeForce RTX 2070 (Desktop), R7 2700X Nvidia GeForce RTX 2060 Super GeForce RTX 2060 Super (Desktop), R7 2700X AMD Radeon RX 5700 XT Radeon RX 5700 XT (Desktop), R7 2700X MSI RTX 2060 Gaming Z 6G GeForce RTX 2060 (Desktop), R7 2700X AMD Radeon RX 5700 Radeon RX 5700 (Desktop), R7 2700X
AMD Radeon RX 5700 @ FurMark PT 100% AMD Radeon RX 5700 @ FurMark PT 120% In terms of emissions, we'll start with the loudness of the graphics card. Although AMD also gives the smaller Navi variant a cooling unit including a vapor chamber, as is so often the case, AMD gives its graphics cards a radial fan in the reference design. This has a diameter of 75 mm and also spins happily in 2D scenarios. In this way, the graphics card is always audible if you have sensitive hearing. In principle, this form of cooling isn't a bad approach since it causes the resulting heat to be directly conducted towards the outside of the case under load. That Nvidia abstained from using this type of cooling solution since the introduction of the RTX graphics cards is a known thing, and the GPU still manages to cool itself in a reliable and comparatively quite way. However, a good air flow should be available with both forms of cooling so that no heat accumulation is produced.
But now back to the AMD Radeon RX 5700. It is barely audible in 2D usage despite the radial fan. Case fans or hard drives are almost louder here. Only under load does the fan become a bit louder, but it's still acceptable. We also need to consider that the RX 5700 only has a power consumption of 180 watts. When more power is introduced, as is the case with the RX 5700 XT Radeon RX 5700 is indeed significantly louder under load compared to Nvidia's RTX 2060S FE. That's a fact, and it can't be sugar coated.
The temperatures measured in the stress test show that the cooling unit gets along well with the heat produced by the graphics card. The graphics chip is not too hot at 75 °C (~167 °F). However, there are further temperature sensors in the RX 5700. An example is the GPU hot spot temperature, which was measured at 87 °C under load in our review model. All this is still harmless and not a cause for concern. The lack of a backplate on the RX 5700 model is also forgivable. However, if we increase the PT (power target) to 120%, the power consumption increases by about 30 watts. The GPU chip alone now has 180 watts at its disposal. The cooling unit already has its hands full in keeping the temperatures in check here. The GPU hot spot temperature climbs to 100 °C (~212 °F).
The energy requirement of the test system in idle usage is pleasing. With 64.5 watts, the system with the RX 5700 on board is the most economical in our comparison. The energy requirement climbs to an average of 296 watts when gaming. The same test system configured with the RTX 2060S FE consumed a bit more at 298 watts.
All gaming benchmarks and load tests were conducted with a closed case so as to represent the best possible use to consumers.
Nvidia Titan RTXNVIDIA Titan RTX, R7 2700X, ADATA Premier Pro SP900NS38 512 GB
437.4 (432min - 452max ) Watt * -48%
AMD Radeon RX Vega 64 RX Vega 64, R7 2700X (Idle: 74.3 W) MSI RTX 2080 Gaming X Trio GeForce RTX 2080 (Desktop), R7 2700X (Idle: 87.78 W)
404.7 (389min - 421max ) Watt * -37%
AMD Radeon RX 5700 XT Radeon RX 5700 XT (Desktop), R7 2700X (Idle: 69.8 W)
348.7 (341min - 359max ) Watt * -18%
Nvidia GeForce RTX 2070 Super GeForce RTX 2070 Super (Desktop), R7 2700X (96.8 fps, Idle: 80.5 W)
344.7 (335min - 370max ) Watt * -16%
MSI RTX 2070 Gaming Z 8G GeForce RTX 2070 (Desktop), R7 2700X (Idle: 73.3 W)
342.9 (329min - 355max ) Watt * -16%
AMD Radeon VIIRadeon VII, R7 2700X (Idle: 81.39 W)
339 (306min - 359max ) Watt * -15%
Nvidia GeForce RTX 2060 Super GeForce RTX 2060 Super (Desktop), R7 2700X (82.7 fps, Idle: 77.12 W)
298.2 (293min - 322max ) Watt * -1%
AMD Radeon RX 5700 Radeon RX 5700 (Desktop), R7 2700X (84.2 fps, Idle: 64.5 W)
295.9 (284min - 304max ) Watt *
MSI RTX 2060 Gaming Z 6G GeForce RTX 2060 (Desktop), R7 2700X (Idle: 74.66 W)
288.8 (284min - 299max ) Watt * +2%
AMD Radeon VIIRadeon VII, R7 2700X (Idle: 81.39 W)
417.8 (399min - 446max ) Watt * -49%
MSI RTX 2080 Gaming X Trio GeForce RTX 2080 (Desktop), R7 2700X
402.2 (320min - 423max ) Watt * -43%
MSI RTX 2070 Gaming Z 8G GeForce RTX 2070 (Desktop), R7 2700X (Idle: 73.3 W)
343 (336min - 382max ) Watt * -22%
AMD Radeon RX 5700 XT Radeon RX 5700 XT (Desktop), R7 2700X (239 fps, Idle: 69.8 W)
326.6 (313min - 351max ) Watt * -16%
Nvidia GeForce RTX 2070 Super GeForce RTX 2070 Super (Desktop), R7 2700X (283 fps, Idle: 80.5 W)
326 (315min - 348max ) Watt * -16%
MSI RTX 2060 Gaming Z 6G GeForce RTX 2060 (Desktop), R7 2700X (Idle: 74.66 W)
295.2 (148min - 331max ) Watt * -5%
Nvidia GeForce RTX 2060 Super GeForce RTX 2060 Super (Desktop), R7 2700X (237 fps, Idle: 77.12 W)
281.4 (275min - 321max ) Watt * -0%
AMD Radeon RX 5700 Radeon RX 5700 (Desktop), R7 2700X (207 fps, Idle: 64.5 W)
280.5 (271min - 312max ) Watt *
* ... smaller is better
Despite the high temperatures, we made an attempt at overclocking the AMD RX 5700. Disappointment followed quickly since there was virtually no room for modifications with the RAM. The RTX graphics card from Nvidia behaved a lot more friendly here, which concerns the VRAM. The GPU allowed an increase of 100 MHz. We were able to achieve slightly better results in the synthetic benchmarks when testing it. However, the performance increase is within the single-digit range so that it's not worth overclocking the graphics card in the reference design. The significantly higher energy consumption, which destroys the good energy balance that's found out of the box, is not something to sneer at either.
Due to the high temperatures under load with the increased PT, we don't recommend overclocking the graphics card with the standard cooler. Anyone who intends to operate their AMD Radeon RX 5700 permanently outside the specifications should consider alternative cooling solutions. Custom water cooling would be the first choice. In addition, the AMD Community offers tips and tricks to squeeze out even more performance from the graphics card. Soft power play tables are the keywords when it comes to overclocking Radeon graphics cards. However, if these mods are used any warranty claim against the manufacturer expires. Since we only have a loan of the RX 5700, we have not made any changes. Without an alternative cooling solution, the use of soft power play tables makes no sense anyway.
3DMark 11 (GPU + 100 MHz, VRAM + 35 MHz) 3DMark Fire Strike (GPU + 100 MHz, VRAM + 35 MHz) 3DMark Time Spy (GPU + 100 MHz, VRAM + 35 MHz)
Pros + fast enough for FHD, QHD and WQHD
+ 8 GB GDDR6
+ PCI Express 4.0
+ top modern 7-nm architecture
+ good energy balance
+ 8K 60 Hz HDR support
+ price
Cons - there's barely any room for overclocking in the reference design
- no Fan Stop
- louder than an RTX 2060S FE under load
In review - the AMD Radeon RX 5700, provided by AMD Germany With the Radeon RX 5700, AMD not only presented a refresh but also introduced a completely new GPU architecture called RDNA. The changes in the chip's design and the smaller structural width of 7 nm bear fruit, and the AMD Radeon RX 5700 is in this way definitely able to keep up with an RTX 2060S FE . The distance to the competition is manageable and quite acceptable, because the Navi graphics card is at the front in the price comparison. The GPU in the reference design from AMD that we tested costs 369 Euros (~$411) .
In exchange, buyers will receive a top modern graphics card with future-proof 8 GB GDDR6 VRAM and a GPU that has so far been able to run all tested games smoothly at 1440p .
Opinions differ when it comes to the cooling design. On one hand, it makes sense to quickly remove the heat from the case; on the other, the background noise is not something to sneeze at. Even if the graphics card is, with its 180 watts (TGP), significantly more economical than a Vega 64, its cooling unit is much louder under load than the competition in the green area. However, the cooling isn't a total fail with the RX 5700. The loudness doesn't get extremely bothersome, and if you play mostly with a headset you shouldn't notice much of the background noise under load. Overall, AMD shows with the Radeon RX 5700 that it doesn't want to completely yield the graphics card market to the competition.
However, we recommend buyers to wait a bit longer until board partners bring their models with better cooling solutions to market. Anyone not wanting to wait won't be doing much wrong by buying an AMD RX 5700. In the price range up to 400 Euros (~$445) the graphics card is probably the best choice in terms of price-performance ratio at the moment.
With RDNA and the 7-nm manufacturing process, AMD managed to bring a graphics card to market that not only can defy Nvidia in the midfield in terms of performance but can also make a decent impact in terms of energy balance.
Benchmarks Performance Rating - 3DMark 11 + Fire Strike + Time Spy
10.8 pt (32%)
...
AMD Radeon RX 5700 (Desktop)
...
3DMark - 3DMark Time Spy Score
min: 7821 avg: 8480 median: 8478 (24%) max: 8952 Points
...
AMD Radeon RX 5700 (Desktop)
...
3DMark - 3DMark Time Spy Graphics
min: 7675 avg: 8045 median: 8051 (21%) max: 8295 Points
...
AMD Radeon RX 5700 (Desktop)
...
3DMark - 3DMark Ice Storm Unlimited Graphics
min: 417278 avg: 527700 median: 489113 (55%) max: 676707 Points
...
AMD Radeon RX 5700 (Desktop)
...
3DMark - 3DMark Ice Storm Extreme Graphics
min: 303955 avg: 368399 median: 380087 (49%) max: 455663 Points
...
AMD Radeon RX 5700 (Desktop)
...
3DMark - 3DMark Cloud Gate Score
min: 47899 avg: 60869 median: 60179 (64%) max: 70472 Points
...
AMD Radeon RX 5700 (Desktop)
...
3DMark - 3DMark Cloud Gate Graphics
min: 123526 avg: 131908 median: 132911 (35%) max: 138300 Points
...
AMD Radeon RX 5700 (Desktop)
...
3DMark - 3DMark Fire Strike Standard Score
min: 19423 avg: 21501 median: 21701 (38%) max: 22697 Points
...
AMD Radeon RX 5700 (Desktop)
...
3DMark - 3DMark Fire Strike Standard Graphics
min: 22457 avg: 23548 median: 23746 (27%) max: 24116 Points
...
AMD Radeon RX 5700 (Desktop)
...
3DMark - 3DMark Ice Storm Graphics
min: 334741 avg: 425100 median: 424643 (51%) max: 544202 Points
...
AMD Radeon RX 5700 (Desktop)
Intel Arc A580
...
3DMark - 3DMark Wild Life Unlimited
53911 Points (27%)
...
AMD Radeon RX 5700 (Desktop)
...
3DMark - 3DMark Night Raid
min: 42019 avg: 45415 median: 45415 (43%) max: 48811 Points
...
Intel Arc A380
AMD Radeon RX 5700 (Desktop)
...
3DMark - 3DMark Night Raid Graphics Score
min: 87099 avg: 88119 median: 88119 (34%) max: 89139 Points
...
AMD Radeon RX 5700 (Desktop)
...
3DMark 11 - 3DM11 Performance Score
min: 22544 avg: 27071 median: 27649.5 (38%) max: 30440 Points
...
AMD Radeon RX 5700 (Desktop)
...
3DMark 11 - 3DM11 Performance GPU
min: 29092 avg: 31059 median: 31470 (27%) max: 32204 Points
...
AMD Radeon RX 5700 (Desktop)
...
3DMark Vantage + 3DMark Vantage - 3DM Vant. Perf. total
min: 91485 avg: 91993 median: 91992.5 (27%) max: 92500 Points
...
AMD Radeon RX 5700 (Desktop)
Intel Arc A580
...
3DM Vant. Perf. GPU no PhysX + 3DMark Vantage - 3DM Vant. Perf. GPU no PhysX
min: 87453 avg: 88563 median: 88562.5 (50%) max: 89672 Points
...
AMD Radeon RX 5700 (Desktop)
Intel Arc A580
...
3DMark 05 - 3DMark 05 - Standard
min: 42479 avg: 68621 median: 81480 (89%) max: 81903 Points
...
AMD Radeon RX 5700 (Desktop)
Intel Arc A380
...
3DMark 06 3DMark 06 - Standard 1280x1024 +
min: 36361 avg: 56223 median: 65695 (86%) max: 66614 Points
...
AMD Radeon RX 5700 (Desktop)
...
Unigine Valley 1.0 - Unigine Valley 1.0 DX
min: 99.3 avg: 101.9 median: 102.2 (33%) max: 104.2 fps
...
AMD Radeon RX 5700 (Desktop)
...
SPECviewperf 12 + SPECviewperf 12 - specvp12 sw-03
min: 79.2 avg: 126.1 median: 106 (26%) max: 193 fps
...
AMD Radeon RX 5700 (Desktop)
...
specvp12 snx-02 + SPECviewperf 12 - specvp12 snx-02
min: 33.5 avg: 91.5 median: 42.1 (6%) max: 199 fps
...
AMD Radeon RX 5700 (Desktop)
...
specvp12 showcase-01 + SPECviewperf 12 - specvp12 showcase-01
min: 126.9 avg: 135.3 median: 131 (29%) max: 148 fps
...
AMD Radeon RX 5700 (Desktop)
...
specvp12 mediacal-01 + SPECviewperf 12 - specvp12 mediacal-01
min: 40.97 avg: 63.2 median: 42.6 (11%) max: 106 fps
...
AMD Radeon RX 5700 (Desktop)
...
specvp12 maya-04 + SPECviewperf 12 - specvp12 maya-04
min: 73.3 avg: 133.4 median: 116 (32%) max: 211 fps
...
AMD Radeon RX 5700 (Desktop)
...
specvp12 energy-01 + SPECviewperf 12 - specvp12 energy-01
min: 11.53 avg: 18.6 median: 12 (11%) max: 32.4 fps
...
AMD Radeon RX 5700 (Desktop)
...
specvp12 creo-01 + SPECviewperf 12 - specvp12 creo-01
min: 60.2 avg: 77.9 median: 78.3 (31%) max: 95.3 fps
...
AMD Radeon RX 5700 (Desktop)
...
specvp12 catia-04 + SPECviewperf 12 - specvp12 catia-04
min: 135.7 avg: 163.2 median: 162 (27%) max: 192 fps
...
Intel Arc A580
AMD Radeon RX 5700 (Desktop)
...
specvp12 3dsmax-05 + SPECviewperf 12 - specvp12 3dsmax-05
min: 155.7 avg: 186.9 median: 175 (31%) max: 230 fps
...
AMD Radeon RX 5700 (Desktop)
...
SPECviewperf 13 specvp13 sw-04 + SPECviewperf 13 - specvp13 sw-04
min: 101.8 avg: 153.6 median: 138 (37%) max: 221 fps
...
AMD Radeon RX 5700 (Desktop)
...
specvp13 snx-03 + SPECviewperf 13 - specvp13 snx-03
min: 60.5 avg: 165.7 median: 76.5 (8%) max: 360 fps
...
AMD Radeon RX 5700 (Desktop)
...
specvp13 showcase-02 + SPECviewperf 13 - specvp13 showcase-02
min: 127 avg: 135.3 median: 131 (29%) max: 148 fps
...
AMD Radeon RX 5700 (Desktop)
...
specvp13 medical-02 + SPECviewperf 13 - specvp13 medical-02
min: 67.5 avg: 76.1 median: 71 (15%) max: 89.8 fps
...
Intel Arc A580
AMD Radeon RX 5700 (Desktop)
...
specvp13 maya-05 + SPECviewperf 13 - specvp13 maya-05
min: 185.2 avg: 247.1 median: 245 (28%) max: 311 fps
...
AMD Radeon RX 5700 (Desktop)
...
specvp13 energy-02 + SPECviewperf 13 - specvp13 energy-02
min: 24.55 avg: 32.6 median: 25.8 (8%) max: 47.5 fps
...
AMD Radeon RX 5700 (Desktop)
...
specvp13 creo-02 + SPECviewperf 13 - specvp13 creo-02
min: 116.7 avg: 171.2 median: 150 (22%) max: 247 fps
...
AMD Radeon RX 5700 (Desktop)
...
specvp13 catia-05 + SPECviewperf 13 - specvp13 catia-05
min: 209.2 avg: 249.4 median: 260 (29%) max: 279 fps
...
Intel Arc A580
AMD Radeon RX 5700 (Desktop)
...
specvp13 3dsmax-06 + SPECviewperf 13 - specvp13 3dsmax-06
min: 157 avg: 189 median: 180 (31%) max: 230 fps
...
AMD Radeon RX 5700 (Desktop)
...
SPECviewperf 2020 specvp2020 solidworks-05 4k + SPECviewperf 2020 - specvp2020 solidworks-05 4k
58.7 fps (17%)
...
Intel Arc A580
AMD Radeon RX 5700 (Desktop)
...
specvp2020 snx-04 4k + SPECviewperf 2020 - specvp2020 snx-04 4k
min: 72.2 avg: 155.6 median: 155.6 (16%) max: 239 fps
...
AMD Radeon RX 5700 (Desktop)
...
specvp2020 medical-03 4k + SPECviewperf 2020 - specvp2020 medical-03 4k
min: 12.89 avg: 16.6 median: 16.6 (16%) max: 20.3 fps
...
Intel Arc A580
AMD Radeon RX 5700 (Desktop)
...
specvp2020 maya-06 4k + SPECviewperf 2020 - specvp2020 maya-06 4k
min: 137 avg: 158 median: 158 (26%) max: 179 fps
...
AMD Radeon RX 5700 (Desktop)
Intel Arc A580
...
specvp2020 energy-03 4k + SPECviewperf 2020 - specvp2020 energy-03 4k
min: 26.38 avg: 29.1 median: 29.1 (6%) max: 31.8 fps
...
AMD Radeon RX 5700 (Desktop)
...
specvp2020 creo-03 4k + SPECviewperf 2020 - specvp2020 creo-03 4k
min: 46.25 avg: 69.4 median: 69.4 (33%) max: 92.6 fps
...
AMD Radeon RX 5700 (Desktop)
...
specvp2020 catia-06 4k + SPECviewperf 2020 - specvp2020 catia-06 4k
min: 29.19 avg: 39.6 median: 39.6 (26%) max: 50 fps
...
Intel Arc A580
AMD Radeon RX 5700 (Desktop)
...
specvp2020 3dsmax-07 4k + SPECviewperf 2020 - specvp2020 3dsmax-07 4k
min: 41.1 avg: 42 median: 42 (18%) max: 42.97 fps
...
AMD Radeon RX 5700 (Desktop)
Intel Arc A580
...
Geekbench 6.2 - Geekbench 6.2 GPU OpenCL
67992 points (20%)
...
AMD Radeon RX 5700 (Desktop)
...
Geekbench 6.2 - Geekbench 6.2 GPU Vulkan
66499 points (22%)
...
AMD Radeon RX 5700 (Desktop)
Intel Arc A580
...
LuxMark v2.0 64Bit - LuxMark v2.0 Room GPU
min: 1650 avg: 1753 median: 1753 (8%) max: 1856 Samples/s
...
AMD Radeon RX 5700 (Desktop)
...
LuxMark v2.0 64Bit - LuxMark v2.0 Sala GPU
min: 3988 avg: 4650 median: 4650 (8%) max: 5312 Samples/s
...
AMD Radeon RX 5700 (Desktop)
...
ComputeMark v2.1 - ComputeMark v2.1 Result
min: 16383 avg: 16453 median: 16453 (18%) max: 16523 points
...
AMD Radeon RX 5700 (Desktop)
...
Power Consumption - Furmark Stress Test Power Consumption - external Monitor *
min: 280.5 avg: 293.3 median: 297.3 (42%) max: 302 Watt
GPU TDP ? TDP 180 W 103% 100%
...
AMD Radeon RX 5700 (Desktop)
...
0 20 40 60 80 100 120 140 160 180 200 220 240 260 280 300 320 Tooltip AMD Radeon RX 5700: Ø302 (296-322)
Power Consumption - The Witcher 3 Power Consumption - external Monitor *
min: 287 avg: 300.1 median: 295.9 (41%) max: 317.5 Watt
GPU TDP ? TDP 180 W 100% 105%
...
AMD Radeon RX 5700 (Desktop)
Intel Arc A580
...
0 20 40 60 80 100 120 140 160 180 200 220 240 260 280 300 320 340 360 Tooltip AMD Radeon RX 5700: Ø287 (279-376)
Power Consumption - Witcher 3 ultra Power Efficiency - external Monitor
0.3 fps per Watt (22%)
...
AMD Radeon RX 5700 (Desktop)
...
Clock Speed - GPU Clock Speed Furmark
1400 MHz (55%)
...
AMD Radeon RX 5700 (Desktop)
...
- Range of benchmark values for this graphics card
- Average benchmark values for this graphics card
* Smaller numbers mean a higher performance
v1.26
log 05. 06:08:02
#0 no ids found in url (should be separated by "_") +0s ... 0s
#1 not redirecting to Ajax server +0s ... 0s
#2 did not recreate cache, as it is less than 5 days old! Created at Sat, 04 May 2024 05:42:18 +0200 +0.001s ... 0.001s
#3 getting avg benchmarks for device 9875 +0.026s ... 0.027s
#4 got single benchmarks 9875 +0.028s ... 0.056s
#5 got avg benchmarks for devices +0s ... 0.056s
#6 min, max, avg, median took s +1.17s ... 1.226s
#7 return log +0s ... 1.226s
Game Benchmarks The following benchmarks stem from our benchmarks of review laptops. The performance depends on the used graphics memory, clock rate, processor, system settings, drivers, and operating systems. So the results don't have to be representative for all laptops with this GPU. For detailed information on the benchmark results, click on the fps number.
...
AMD Radeon RX 5700 (Desktop)
...
...
AMD Radeon RX 5700 (Desktop)
...
...
AMD Radeon RX 5700 (Desktop)
...
...
Intel Arc A580
AMD Radeon RX 5700 (Desktop)
...
» With all tested laptops playable in detail settings high.
Additional Benchmarks
Low Preset 1280x720
85.8 [X] AMD Radeon RX 5700 Intel Core i9-14900K 3.2GHz
Radeon RX 5700 (Desktop)
min:
27.5 fps, P0.1:
46.3 fps, P1:
64.3 fps, max:
115.9 fps
...
Intel Arc A580
AMD Radeon RX 5700 (Desktop)
...
...
Intel Arc A580
AMD Radeon RX 5700 (Desktop)
...
...
Intel Arc A580
AMD Radeon RX 5700 (Desktop)
...
...
Intel Arc A380
AMD Radeon RX 5700 (Desktop)
Intel Arc A580
...
AMD Radeon RX 5700 (Desktop)
Intel Arc A580
...
...
Intel Arc A580
AMD Radeon RX 5700 (Desktop)
...
» With all tested laptops playable in detail settings ultra.
Additional Benchmarks
Very Low Preset 1280x720
135.3 [X] AMD Radeon RX 5700 Intel Core i9-14900K 3.2GHz
Radeon RX 5700 (Desktop)
min:
79.5 fps, P0.1:
84.7 fps, P1:
99.2 fps, max:
270 fps
...
Intel Arc A580
AMD Radeon RX 5700 (Desktop)
...
140.6 [X] AMD Radeon RX 5700 Intel Core i9-14900K 3.2GHz
Radeon RX 5700 (Desktop)
min:
56.4 fps, P0.1:
93.4 fps, P1:
113.7 fps, max:
408 fps
169.8 [X] AMD Radeon RX 5700 Intel Core i9-14900K 3.2GHz
Radeon RX 5700 (Desktop)
min:
50.8 fps, P0.1:
115.9 fps, P1:
129.6 fps, max:
424 fps
~ 155 fps
+ Compare
- Hide Comparison
+ 📈 Graph
- 📈 Hide Graph
0 100 200 Tooltip : Ø140.2 (120.5-175.7)
: Ø169.5 (137.8-224)
...
AMD Radeon RX 5700 (Desktop)
...
...
Intel Arc A580
AMD Radeon RX 5700 (Desktop)
...
AMD Radeon RX 5700 (Desktop)
Intel Arc A580
...
» With all tested laptops playable in detail settings ultra.
Additional Benchmarks
Low Preset 1280x720
309 [X] AMD Radeon RX 5700 Intel Core i9-14900K 3.2GHz
Radeon RX 5700 (Desktop)
min:
71 fps, P0.1:
182.3 fps, P1:
209 fps, max:
546 fps
...
AMD Radeon RX 5700 (Desktop)
...
...
AMD Radeon RX 5700 (Desktop)
...
...
Intel Arc A580
AMD Radeon RX 5700 (Desktop)
...
...
AMD Radeon RX 5700 (Desktop)
Intel Arc A580
...
...
Intel Arc A580
AMD Radeon RX 5700 (Desktop)
...
...
Intel Arc A580
AMD Radeon RX 5700 (Desktop)
...
» With all tested laptops playable in detail settings ultra.
Additional Benchmarks
Very Low Preset 1280x720
296 [X] AMD Radeon RX 5700 Intel Core i9-14900K 3.2GHz
Radeon RX 5700 (Desktop)
min:
26 fps, P0.1:
95.1 fps, P1:
239 fps, max:
443 fps
...
Intel Arc A580
AMD Radeon RX 5700 (Desktop)
...
...
Intel Arc A580
AMD Radeon RX 5700 (Desktop)
...
...
Intel Arc A580
AMD Radeon RX 5700 (Desktop)
...
...
AMD Radeon RX 5700 (Desktop)
...
...
Intel Arc A580
AMD Radeon RX 5700 (Desktop)
...
AMD Radeon RX 5700 (Desktop)
Intel Arc A580
...
Intel Arc A580
AMD Radeon RX 5700 (Desktop)
...
» With all tested laptops playable in detail settings ultra.
Additional Benchmarks
Low Preset TAA 1280x720
120 [X] AMD Radeon RX 5700 Intel Core i9-14900K 3.2GHz
Radeon RX 5700 (Desktop)
...
Intel Arc A580
AMD Radeon RX 5700 (Desktop)
...
...
AMD Radeon RX 5700 (Desktop)
Intel Arc A580
...
...
Intel Arc A380
AMD Radeon RX 5700 (Desktop)
Intel Arc A580
...
...
Intel Arc A380
AMD Radeon RX 5700 (Desktop)
Intel Arc A580
...
...
AMD Radeon RX 5700 (Desktop)
Intel Arc A580
...
...
AMD Radeon RX 5700 (Desktop)
Intel Arc A580
...
» With all tested laptops playable in detail settings ultra.
Additional Benchmarks
Low Preset 1280x720
139 [X] AMD Radeon RX 5700 Intel Core i9-14900K 3.2GHz
Radeon RX 5700 (Desktop)
min:
4.84 fps, P0.1:
18 fps, P1:
130 fps, max:
271 fps
...
AMD Radeon RX 5700 (Desktop)
Intel Arc A580
...
...
AMD Radeon RX 5700 (Desktop)
Intel Arc A580
...
...
AMD Radeon RX 5700 (Desktop)
Intel Arc A580
...
...
AMD Radeon RX 5700 (Desktop)
Intel Arc A580
...
...
AMD Radeon RX 5700 (Desktop)
Intel Arc A580
...
AMD Radeon RX 5700 (Desktop)
Intel Arc A580
...
AMD Radeon RX 5700 (Desktop)
Intel Arc A580
...
» With all tested laptops playable in detail settings ultra.
Additional Benchmarks
Max. Performance 1280x720
94.8 [X] AMD Radeon RX 5700 Intel Core i9-14900K 3.2GHz
Radeon RX 5700 (Desktop)
min:
43.1 fps, P0.1:
58.4 fps, P1:
68.1 fps, max:
202 fps
...
Intel Arc A580
AMD Radeon RX 5700 (Desktop)
...
...
AMD Radeon RX 5700 (Desktop)
Intel Arc A580
...
...
AMD Radeon RX 5700 (Desktop)
Intel Arc A580
...
...
AMD Radeon RX 5700 (Desktop)
Intel Arc A580
...
AMD Radeon RX 5700 (Desktop)
Intel Arc A580
...
AMD Radeon RX 5700 (Desktop)
Intel Arc A580
...
» With all tested laptops playable in detail settings ultra.
Additional Benchmarks
Very Low Preset 1280x720
202 [X] AMD Radeon RX 5700 Intel Core i9-14900K 3.2GHz
Radeon RX 5700 (Desktop)
min:
17 fps, P0.1:
23.5 fps, P1:
95.8 fps, max:
410 fps
Intel UHD Graphics 32EUs (Alder Lake)
...
AMD Radeon RX 5700 (Desktop)
...
...
Intel Arc A580
AMD Radeon RX 5700 (Desktop)
...
...
Intel Arc A580
AMD Radeon RX 5700 (Desktop)
...
...
Intel Arc A580
AMD Radeon RX 5700 (Desktop)
...
...
Intel Arc A580
AMD Radeon RX 5700 (Desktop)
...
» With all tested laptops playable in detail settings ultra.
...
AMD Radeon RX 5700 (Desktop)
Intel Arc A580
...
...
AMD Radeon RX 5700 (Desktop)
Intel Arc A580
...
...
AMD Radeon RX 5700 (Desktop)
Intel Arc A580
...
...
AMD Radeon RX 5700 (Desktop)
Intel Arc A580
...
...
AMD Radeon RX 5700 (Desktop)
Intel Arc A580
...
...
AMD Radeon RX 5700 (Desktop)
Intel Arc A580
...
» With all tested laptops playable in detail settings ultra.
...
Intel Arc A580
AMD Radeon RX 5700 (Desktop)
...
Intel UHD Graphics 32EUs (Alder Lake)
...
AMD Radeon RX 5700 (Desktop)
Intel Arc A580
...
Intel UHD Graphics 32EUs (Alder Lake)
...
AMD Radeon RX 5700 (Desktop)
Intel Arc A580
...
Intel UHD Graphics 32EUs (Alder Lake)
...
AMD Radeon RX 5700 (Desktop)
Intel Arc A580
...
AMD Radeon RX 5700 (Desktop)
Intel Arc A580
...
...
AMD Radeon RX 5700 (Desktop)
Intel Arc A580
...
» With all tested laptops playable in detail settings ultra.
Additional Benchmarks
Low Preset 1280x720
299 [X] AMD Radeon RX 5700 AMD Ryzen 9 7950X 4.5GHz
Radeon RX 5700 (Desktop)
min:
82.2 fps, P0.1:
137.6 fps, P1:
217 fps, max:
564 fps
...
AMD Radeon RX 5700 (Desktop)
...
...
AMD Radeon RX 5700 (Desktop)
...
...
AMD Radeon RX 5700 (Desktop)
...
...
Intel Arc A580
AMD Radeon RX 5700 (Desktop)
...
...
Intel Arc A580
AMD Radeon RX 5700 (Desktop)
...
...
AMD Radeon RX 5700 (Desktop)
...
» With all tested laptops playable in detail settings ultra.
Additional Benchmarks
Low Preset TAA 1280x720
94 [X] AMD Radeon RX 5700 AMD Ryzen 9 7950X 4.5GHz
Radeon RX 5700 (Desktop)
min:
62 fps, max:
112 fps
...
Intel Arc A580
AMD Radeon RX 5700 (Desktop)
...
...
Intel Arc A580
AMD Radeon RX 5700 (Desktop)
...
...
Intel Arc A580
AMD Radeon RX 5700 (Desktop)
...
...
Intel Arc A580
AMD Radeon RX 5700 (Desktop)
...
...
AMD Radeon RX 5700 (Desktop)
Intel Arc A580
...
AMD Radeon RX 5700 (Desktop)
Intel Arc A580
...
» With all tested laptops playable in detail settings ultra.
Additional Benchmarks
Minimum Preset 1280x720
167 [X] AMD Radeon RX 5700 AMD Ryzen 9 7950X 4.5GHz
Radeon RX 5700 (Desktop)
...
Intel Arc A580
AMD Radeon RX 5700 (Desktop)
...
...
Intel Arc A580
AMD Radeon RX 5700 (Desktop)
...
...
Intel Arc A580
AMD Radeon RX 5700 (Desktop)
...
...
Intel Arc A580
AMD Radeon RX 5700 (Desktop)
...
...
Intel Arc A580
AMD Radeon RX 5700 (Desktop)
...
Intel Arc A580
AMD Radeon RX 5700 (Desktop)
...
» With all tested laptops playable in detail settings ultra.
Additional Benchmarks
Ultra Low Preset LowAA 1280x720
281 [X] AMD Radeon RX 5700 AMD Ryzen 9 7950X 4.5GHz
Radeon RX 5700 (Desktop)
min:
10.7 fps, P0.1:
96 fps, P1:
197 fps, max:
483 fps
...
AMD Radeon RX 5700 (Desktop)
Intel Arc A580
...
...
AMD Radeon RX 5700 (Desktop)
Intel Arc A580
...
...
AMD Radeon RX 5700 (Desktop)
Intel Arc A580
...
AMD Radeon RX 5700 (Desktop)
Intel Arc A580
...
AMD Radeon RX 5700 (Desktop)
Intel Arc A580
...
» With all tested laptops playable in detail settings low.
Additional Benchmarks
Low Preset 1280x720
49.5 [X] AMD Radeon RX 5700 AMD Ryzen 9 7950X 4.5GHz
Radeon RX 5700 (Desktop)
min:
15.1 fps, P0.1:
15.3 fps, P1:
22.5 fps, max:
142.2 fps
0 100 200 300 400 500 600 700 800 Tooltip
...
Intel Arc A580
AMD Radeon RX 5700 (Desktop)
...
...
AMD Radeon RX 5700 (Desktop)
Intel Arc A580
...
0 100 200 300 400 500 600 700 800 900 1000 1100 1200 1300 1400 1500 1600 1700 1800 1900 2000 2100 2200 2300 2400 2500 2600 2700 2800 2900 3000 3100 3200 3300 3400 3500 3600 3700 3800 3900 4000 4100 4200 4300 4400 4500 4600 4700 4800 4900 5000 5100 5200 5300 5400 5500 5600 5700 5800 5900 6000 6100 6200 6300 6400 6500 6600 6700 6800 6900 7000 7100 7200 7300 7400 7500 7600 7700 7800 7900 8000 8100 8200 8300 8400 8500 8600 8700 8800 8900 9000 9100 9200 9300 9400 9500 9600 9700 9800 9900 Tooltip
...
Intel Arc A380
AMD Radeon RX 5700 (Desktop)
...
...
Intel Arc A380
AMD Radeon RX 5700 (Desktop)
...
...
AMD Radeon RX 5700 (Desktop)
...
AMD Radeon RX 5700 (Desktop)
...
» With all tested laptops playable in detail settings high.
Additional Benchmarks
Low Preset 1280x720
102.6 [X] AMD Radeon RX 5700 AMD Ryzen 9 7950X 4.5GHz
Radeon RX 5700 (Desktop)
min:
20.4 fps, P0.1:
73.8 fps, P1:
84.4 fps, max:
250 fps
...
AMD Radeon RX 5700 (Desktop)
Intel Arc A580
...
...
Intel Arc A580
AMD Radeon RX 5700 (Desktop)
...
...
AMD Radeon RX 5700 (Desktop)
Intel Arc A580
...
...
AMD Radeon RX 5700 (Desktop)
Intel Arc A580
...
...
AMD Radeon RX 5700 (Desktop)
Intel Arc A580
...
...
AMD Radeon RX 5700 (Desktop)
Intel Arc A580
...
» With all tested laptops playable in detail settings ultra.
Additional Benchmarks
Low Preset 1280x720
500 [X] AMD Radeon RX 5700 AMD Ryzen 9 7950X 4.5GHz
Radeon RX 5700 (Desktop)
86 [X] AMD Radeon RX 5700 AMD Ryzen 9 7950X 4.5GHz
Radeon RX 5700 (Desktop)
min:
41 fps, P0.1:
51 fps, P1:
67 fps, max:
106 fps
fps
+ Compare
- Hide Comparison
...
Intel Arc A580
AMD Radeon RX 5700 (Desktop)
...
78 [X] AMD Radeon RX 5700 AMD Ryzen 9 7950X 4.5GHz
Radeon RX 5700 (Desktop)
min:
34 fps, P0.1:
43 fps, P1:
53 fps, max:
236 fps
fps
+ Compare
- Hide Comparison
...
Intel Arc A580
AMD Radeon RX 5700 (Desktop)
...
73 [X] AMD Radeon RX 5700 AMD Ryzen 9 7950X 4.5GHz
Radeon RX 5700 (Desktop)
min:
36 fps, P0.1:
42 fps, P1:
50 fps, max:
175 fps
fps
+ Compare
- Hide Comparison
...
AMD Radeon RX 5700 (Desktop)
Intel Arc A580
...
59 [X] AMD Radeon RX 5700 AMD Ryzen 9 7950X 4.5GHz
Radeon RX 5700 (Desktop)
min:
33 fps, P0.1:
36 fps, P1:
41 fps, max:
114 fps
fps
+ Compare
- Hide Comparison
...
Intel Arc A580
AMD Radeon RX 5700 (Desktop)
...
46 [X] AMD Radeon RX 5700 AMD Ryzen 9 7950X 4.5GHz
Radeon RX 5700 (Desktop)
min:
26 fps, P0.1:
28 fps, P1:
33 fps, max:
65 fps
fps
+ Compare
- Hide Comparison
...
AMD Radeon RX 5700 (Desktop)
Intel Arc A580
...
28 [X] AMD Radeon RX 5700 AMD Ryzen 9 7950X 4.5GHz
Radeon RX 5700 (Desktop)
min:
20 fps, P0.1:
21 fps, P1:
23 fps, max:
39 fps
fps
+ Compare
- Hide Comparison
...
AMD Radeon RX 5700 (Desktop)
Intel Arc A580
...
» With all tested laptops playable in detail settings ultra.
Additional Benchmarks
Low Preset (Adaptive Quality Off) 1280x720
114 [X] AMD Radeon RX 5700 AMD Ryzen 9 7950X 4.5GHz
Radeon RX 5700 (Desktop)
min:
48 fps, P0.1:
59 fps, P1:
87 fps, max:
150 fps
0 100 200 300 400 500 600 700 Tooltip
...
AMD Radeon RX 5700 (Desktop)
...
...
AMD Radeon RX 5700 (Desktop)
...
...
AMD Radeon RX 5700 (Desktop)
...
...
AMD Radeon RX 5700 (Desktop)
...
...
AMD Radeon RX 5700 (Desktop)
...
...
AMD Radeon RX 5700 (Desktop)
...
» With all tested laptops playable in detail settings ultra.
Additional Benchmarks
Low Preset 1280x720
341 [X] AMD Radeon RX 5700 AMD Ryzen 9 7950X 4.5GHz
Radeon RX 5700 (Desktop)
min:
4.43 fps, P0.1:
237 fps, P1:
258 fps, max:
462 fps
Intel UHD Graphics 32EUs (Alder Lake)
...
Intel Arc A580
AMD Radeon RX 5700 (Desktop)
...
Intel UHD Graphics 32EUs (Alder Lake)
...
Intel Arc A580
AMD Radeon RX 5700 (Desktop)
...
0 100 200 Tooltip : Ø176.5 (105.042-221.848)
Intel UHD Graphics 32EUs (Alder Lake)
...
Intel Arc A580
AMD Radeon RX 5700 (Desktop)
...
0 100 200 Tooltip : Ø136.8 (93.986-220.079)
...
Intel Arc A580
AMD Radeon RX 5700 (Desktop)
...
...
Intel Arc A580
AMD Radeon RX 5700 (Desktop)
...
...
Intel Arc A580
AMD Radeon RX 5700 (Desktop)
...
» With all tested laptops playable in detail settings ultra.
Additional Benchmarks
Low Preset 1280x720
351 [X] AMD Radeon RX 5700 AMD Ryzen 9 7950X 4.5GHz
Radeon RX 5700 (Desktop)
min:
50.9 fps, P0.1:
146.6 fps, P1:
170.5 fps, max:
845 fps
...
AMD Radeon RX 5700 (Desktop)
Intel Arc A580
...
...
AMD Radeon RX 5700 (Desktop)
Intel Arc A580
...
...
AMD Radeon RX 5700 (Desktop)
...
...
AMD Radeon RX 5700 (Desktop)
...
...
AMD Radeon RX 5700 (Desktop)
...
...
AMD Radeon RX 5700 (Desktop)
...
» With all tested laptops playable in detail settings ultra.
Additional Benchmarks
Low Preset (FSR off) 1280x720
112.6 [X] AMD Radeon RX 5700 AMD Ryzen 9 7950X 4.5GHz
Radeon RX 5700 (Desktop)
min:
70.3 fps, max:
190.8 fps
Steam Deck 1280x720
123.9 [X] AMD Radeon RX 5700 AMD Ryzen 9 7950X 4.5GHz
Radeon RX 5700 (Desktop)
min:
69.2 fps, max:
220 fps
Ultra Preset (FSR on) 1920x1080
61.5 [X] AMD Radeon RX 5700 AMD Ryzen 9 7950X 4.5GHz
Radeon RX 5700 (Desktop)
min:
40.9 fps, max:
98 fps
...
Intel Arc A580
AMD Radeon RX 5700 (Desktop)
...
...
AMD Radeon RX 5700 (Desktop)
Intel Arc A580
...
...
AMD Radeon RX 5700 (Desktop)
Intel Arc A580
...
...
AMD Radeon RX 5700 (Desktop)
Intel Arc A580
...
...
AMD Radeon RX 5700 (Desktop)
Intel Arc A580
...
...
AMD Radeon RX 5700 (Desktop)
Intel Arc A580
...
» With all tested laptops playable in detail settings ultra.
Additional Benchmarks
Low Preset 1280x720
224 [X] AMD Radeon RX 5700 AMD Ryzen 9 7950X 4.5GHz
Radeon RX 5700 (Desktop)
min:
26.2 fps, P0.1:
121.4 fps, P1:
141.8 fps, max:
490 fps
...
Intel Arc A580
AMD Radeon RX 5700 (Desktop)
...
...
Intel Arc A580
AMD Radeon RX 5700 (Desktop)
...
...
Intel Arc A580
AMD Radeon RX 5700 (Desktop)
...
...
Intel Arc A580
AMD Radeon RX 5700 (Desktop)
...
...
AMD Radeon RX 5700 (Desktop)
...
...
AMD Radeon RX 5700 (Desktop)
...
» With all tested laptops playable in detail settings ultra.
Additional Benchmarks
Low Preset 1280x720
73.5 [X] AMD Radeon RX 5700 AMD Ryzen 9 7950X 4.5GHz
Radeon RX 5700 (Desktop)
min:
56.1 fps, P0.1:
58.2 fps, P1:
61.5 fps, max:
108.7 fps
...
Intel Arc A580
AMD Radeon RX 5700 (Desktop)
...
...
AMD Radeon RX 5700 (Desktop)
Intel Arc A580
...
...
AMD Radeon RX 5700 (Desktop)
Intel Arc A580
...
...
AMD Radeon RX 5700 (Desktop)
Intel Arc A580
...
AMD Radeon RX 5700 (Desktop)
Intel Arc A580
...
...
AMD Radeon RX 5700 (Desktop)
Intel Arc A580
...
» With all tested laptops playable in detail settings ultra.
Additional Benchmarks
Low Preset 1280x720
119.8 [X] AMD Radeon RX 5700 AMD Ryzen 9 7950X 4.5GHz
Radeon RX 5700 (Desktop)
min:
80.9 fps, P0.1:
86.2 fps, P1:
95.9 fps, max:
195.9 fps
...
Intel Arc A580
AMD Radeon RX 5700 (Desktop)
...
...
Intel Arc A580
AMD Radeon RX 5700 (Desktop)
...
0 100 200 300 400 500 600 700 800 900 1000 1100 1200 1300 1400 1500 1600 1700 1800 1900 2000 Tooltip
...
AMD Radeon RX 5700 (Desktop)
Intel Arc A580
...
...
AMD Radeon RX 5700 (Desktop)
Intel Arc A580
...
...
Intel Arc A580
AMD Radeon RX 5700 (Desktop)
...
» With all tested laptops playable in detail settings ultra.
Additional Benchmarks
Low 1280x720
89.1 [X] AMD Radeon RX 5700 AMD Ryzen 9 7950X 4.5GHz
Radeon RX 5700 (Desktop)
min:
20.5 fps, P0.1:
37.9 fps, P1:
65.5 fps, max:
212 fps
...
Intel Arc A580
AMD Radeon RX 5700 (Desktop)
...
...
Intel Arc A580
AMD Radeon RX 5700 (Desktop)
...
...
AMD Radeon RX 5700 (Desktop)
Intel Arc A580
...
...
AMD Radeon RX 5700 (Desktop)
Intel Arc A580
...
...
AMD Radeon RX 5700 (Desktop)
Intel Arc A580
...
...
Intel Arc A580
AMD Radeon RX 5700 (Desktop)
...
» With all tested laptops playable in detail settings ultra.
Additional Benchmarks
Low Preset 1280x720
183.3 [X] AMD Radeon RX 5700 AMD Ryzen 9 7950X 4.5GHz
Radeon RX 5700 (Desktop)
min:
83.5 fps, P0.1:
131.1 fps, P1:
151.3 fps, max:
233 fps
...
AMD Radeon RX 5700 (Desktop)
Intel Arc A580
...
...
AMD Radeon RX 5700 (Desktop)
Intel Arc A580
...
...
AMD Radeon RX 5700 (Desktop)
...
...
AMD Radeon RX 5700 (Desktop)
...
...
AMD Radeon RX 5700 (Desktop)
Intel Arc A580
...
...
AMD Radeon RX 5700 (Desktop)
Intel Arc A580
...
» With all tested laptops playable in detail settings ultra.
Additional Benchmarks
Low Preset 1280x720
140 [X] AMD Radeon RX 5700 AMD Ryzen 9 7950X 4.5GHz
Radeon RX 5700 (Desktop)
min:
10.7 fps, P0.1:
76.2 fps, P1:
126.1 fps, max:
390 fps
...
AMD Radeon RX 5700 (Desktop)
...
...
AMD Radeon RX 5700 (Desktop)
Intel Arc A580
...
...
AMD Radeon RX 5700 (Desktop)
Intel Arc A580
...
...
AMD Radeon RX 5700 (Desktop)
Intel Arc A580
...
...
AMD Radeon RX 5700 (Desktop)
Intel Arc A580
...
...
AMD Radeon RX 5700 (Desktop)
Intel Arc A580
...
» With all tested laptops playable in detail settings ultra.
Additional Benchmarks
Very Low Preset 1280x720
95.3 [X] AMD Radeon RX 5700 AMD Ryzen 9 7950X 4.5GHz
Radeon RX 5700 (Desktop)
min:
70.2 fps, P0.1:
75.9 fps, P1:
80.4 fps, max:
118.9 fps
...
AMD Radeon RX 5700 (Desktop)
Intel Arc A580
...
...
AMD Radeon RX 5700 (Desktop)
Intel Arc A580
...
...
AMD Radeon RX 5700 (Desktop)
Intel Arc A580
...
...
AMD Radeon RX 5700 (Desktop)
...
...
AMD Radeon RX 5700 (Desktop)
...
...
AMD Radeon RX 5700 (Desktop)
» With all tested laptops playable in detail settings ultra.
Additional Benchmarks
Ultra Low Preset TAA 1280x720
398 [X] AMD Radeon RX 5700 AMD Ryzen 9 7950X 4.5GHz
Radeon RX 5700 (Desktop)
min:
288 fps, P1:
273 fps, max:
471 fps
...
Intel Arc A580
AMD Radeon RX 5700 (Desktop)
...
...
AMD Radeon RX 5700 (Desktop)
Intel Arc A580
...
Intel UHD Graphics 32EUs (Alder Lake)
...
AMD Radeon RX 5700 (Desktop)
Intel Arc A580
...
Intel UHD Graphics 32EUs (Alder Lake)
...
AMD Radeon RX 5700 (Desktop)
Intel Arc A580
...
AMD Radeon RX 5700 (Desktop)
Intel Arc A580
...
AMD Radeon RX 5700 (Desktop)
Intel Arc A580
...
» With all tested laptops playable in detail settings ultra.
Additional Benchmarks
Low Preset 1280x720
298 [X] AMD Radeon RX 5700 AMD Ryzen 9 7950X 4.5GHz
Radeon RX 5700 (Desktop)
min:
17.8 fps, P0.1:
68.4 fps, P1:
226 fps, max:
709 fps
...
Intel Arc A580
AMD Radeon RX 5700 (Desktop)
...
...
AMD Radeon RX 5700 (Desktop)
Intel Arc A580
...
...
AMD Radeon RX 5700 (Desktop)
Intel Arc A580
...
...
AMD Radeon RX 5700 (Desktop)
Intel Arc A580
...
AMD Radeon RX 5700 (Desktop)
Intel Arc A580
...
0 100 200 300 400 500 600 700 800 900 1000 1100 1200 Tooltip
...
AMD Radeon RX 5700 (Desktop)
Intel Arc A580
...
» With all tested laptops playable in detail settings ultra.
Additional Benchmarks
Low Preset 1280x720
111 [X] AMD Radeon RX 5700 AMD Ryzen 9 7950X 4.5GHz
Radeon RX 5700 (Desktop)
min:
39.8 fps, P0.1:
67.3 fps, P1:
83.1 fps, max:
175.7 fps
...
Intel Arc A580
AMD Radeon RX 5700 (Desktop)
...
...
Intel Arc A580
AMD Radeon RX 5700 (Desktop)
...
...
AMD Radeon RX 5700 (Desktop)
Intel Arc A580
...
...
AMD Radeon RX 5700 (Desktop)
Intel Arc A580
...
AMD Radeon RX 5700 (Desktop)
Intel Arc A580
...
AMD Radeon RX 5700 (Desktop)
Intel Arc A580
...
» With all tested laptops playable in detail settings ultra.
Additional Benchmarks
Low Preset Low TAA 1280x720
332 [X] AMD Radeon RX 5700 AMD Ryzen 9 7950X 4.5GHz
Radeon RX 5700 (Desktop)
min:
14.5 fps, P0.1:
31.5 fps, P1:
217 fps, max:
571 fps
...
Intel Arc A580
AMD Radeon RX 5700 (Desktop)
...
...
AMD Radeon RX 5700 (Desktop)
...
...
Intel Arc A580
AMD Radeon RX 5700 (Desktop)
...
...
AMD Radeon RX 5700 (Desktop)
...
...
Intel Arc A580
AMD Radeon RX 5700 (Desktop)
...
...
Intel Arc A580
AMD Radeon RX 5700 (Desktop)
...
» With all tested laptops playable in detail settings ultra.
Additional Benchmarks
Low Preset 1280x720
121.9 [X] AMD Radeon RX 5700 AMD Ryzen 9 7950X 4.5GHz
Radeon RX 5700 (Desktop)
min:
61 fps, P0.1:
98.9 fps, P1:
101.2 fps, max:
164.5 fps
0 100 Tooltip : Ø131.9 (122.416-155.03)
...
AMD Radeon RX 5700 (Desktop)
Intel Arc A580
...
...
AMD Radeon RX 5700 (Desktop)
Intel Arc A580
...
...
AMD Radeon RX 5700 (Desktop)
Intel Arc A580
...
...
Intel Arc A580
AMD Radeon RX 5700 (Desktop)
...
...
Intel Arc A580
AMD Radeon RX 5700 (Desktop)
...
...
Intel Arc A580
AMD Radeon RX 5700 (Desktop)
...
» With all tested laptops playable in detail settings ultra.
Additional Benchmarks
Prioritize Performance Preset 1280x720
193.3 [X] AMD Radeon RX 5700 AMD Ryzen 9 7950X 4.5GHz
Radeon RX 5700 (Desktop)
min:
24.8 fps, P0.1:
120.1 fps, P1:
163.3 fps, max:
265 fps
...
AMD Radeon RX 5700 (Desktop)
Intel Arc A580
...
...
AMD Radeon RX 5700 (Desktop)
Intel Arc A580
...
...
AMD Radeon RX 5700 (Desktop)
Intel Arc A580
...
...
AMD Radeon RX 5700 (Desktop)
Intel Arc A580
...
...
AMD Radeon RX 5700 (Desktop)
Intel Arc A580
...
...
AMD Radeon RX 5700 (Desktop)
Intel Arc A580
...
» With all tested laptops playable in detail settings ultra.
Additional Benchmarks
Minimum Settings 1280x720
240 [X] AMD Radeon RX 5700 AMD Ryzen 9 7950X 4.5GHz
Radeon RX 5700 (Desktop)
...
AMD Radeon RX 5700 (Desktop)
...
...
Intel Arc A580
AMD Radeon RX 5700 (Desktop)
...
...
Intel Arc A580
AMD Radeon RX 5700 (Desktop)
...
...
Intel Arc A580
AMD Radeon RX 5700 (Desktop)
...
...
Intel Arc A580
AMD Radeon RX 5700 (Desktop)
...
...
Intel Arc A580
AMD Radeon RX 5700 (Desktop)
...
» With all tested laptops playable in detail settings ultra.
Additional Benchmarks
Ultra Low Preset 1280x720
129.4 [X] AMD Radeon RX 5700 AMD Ryzen 9 7950X 4.5GHz
Radeon RX 5700 (Desktop)
min:
73.8 fps, P0.1:
89.4 fps, P1:
94.9 fps, max:
185.4 fps
...
Intel Arc A580
AMD Radeon RX 5700 (Desktop)
...
...
Intel Arc A580
AMD Radeon RX 5700 (Desktop)
...
...
AMD Radeon RX 5700 (Desktop)
Intel Arc A580
...
...
AMD Radeon RX 5700 (Desktop)
Intel Arc A580
...
...
AMD Radeon RX 5700 (Desktop)
Intel Arc A580
...
...
AMD Radeon RX 5700 (Desktop)
Intel Arc A580
...
» With all tested laptops playable in detail settings ultra.
Additional Benchmarks
Low Preset 1280x720
240 [X] AMD Radeon RX 5700 AMD Ryzen 9 7950X 4.5GHz
Radeon RX 5700 (Desktop)
min:
109.5 fps, P0.1:
186 fps, P1:
206 fps, max:
377 fps
...
AMD Radeon RX 5700 (Desktop)
Intel Arc A580
...
...
AMD Radeon RX 5700 (Desktop)
Intel Arc A580
...
...
AMD Radeon RX 5700 (Desktop)
...
...
AMD Radeon RX 5700 (Desktop)
Intel Arc A580
...
AMD Radeon RX 5700 (Desktop)
Intel Arc A580
...
...
AMD Radeon RX 5700 (Desktop)
...
» With all tested laptops playable in detail settings ultra.
Additional Benchmarks
Low Preset 1280x720
75 [X] AMD Radeon RX 5700 AMD Ryzen 9 7950X 4.5GHz
Radeon RX 5700 (Desktop)
...
Intel Arc A580
AMD Radeon RX 5700 (Desktop)
...
...
Intel Arc A580
AMD Radeon RX 5700 (Desktop)
...
...
Intel Arc A580
AMD Radeon RX 5700 (Desktop)
...
...
AMD Radeon RX 5700 (Desktop)
Intel Arc A580
...
...
AMD Radeon RX 5700 (Desktop)
Intel Arc A580
...
...
AMD Radeon RX 5700 (Desktop)
Intel Arc A580
...
» With all tested laptops playable in detail settings ultra.
Additional Benchmarks
Low Preset Low TAA 1280x720
167.4 [X] AMD Radeon RX 5700 AMD Ryzen 9 7950X 4.5GHz
Radeon RX 5700 (Desktop)
min:
58 fps, P0.1:
113.2 fps, P1:
140.2 fps, max:
231 fps
...
Intel Arc A580
AMD Radeon RX 5700 (Desktop)
...
...
Intel Arc A580
AMD Radeon RX 5700 (Desktop)
...
...
Intel Arc A580
AMD Radeon RX 5700 (Desktop)
...
...
Intel Arc A580
AMD Radeon RX 5700 (Desktop)
...
...
Intel Arc A580
AMD Radeon RX 5700 (Desktop)
...
...
Intel Arc A580
AMD Radeon RX 5700 (Desktop)
...
» With all tested laptops playable in detail settings ultra.
Additional Benchmarks
Low Preset TAA 1280x720
110.8 [X] AMD Radeon RX 5700 AMD Ryzen 9 7950X 4.5GHz
Radeon RX 5700 (Desktop)
min:
34.6 fps, P0.1:
47.8 fps, P1:
66.1 fps, max:
1127 fps
0 100 Tooltip : Ø169.5 (153.171-183.61)
...
AMD Radeon RX 5700 (Desktop)
Intel Arc A580
...
Intel UHD Graphics 32EUs (Alder Lake)
...
AMD Radeon RX 5700 (Desktop)
Intel Arc A580
...
...
AMD Radeon RX 5700 (Desktop)
Intel Arc A580
...
...
AMD Radeon RX 5700 (Desktop)
Intel Arc A580
...
...
AMD Radeon RX 5700 (Desktop)
Intel Arc A580
...
...
AMD Radeon RX 5700 (Desktop)
Intel Arc A580
...
» With all tested laptops playable in detail settings ultra.
Additional Benchmarks
Low Preset / Off 1280x720
262 [X] AMD Radeon RX 5700 AMD Ryzen 9 7950X 4.5GHz
Radeon RX 5700 (Desktop)
min:
13.1 fps, P0.1:
158.5 fps, P1:
207 fps, max:
411 fps
...
AMD Radeon RX 5700 (Desktop)
Intel Arc A580
...
...
AMD Radeon RX 5700 (Desktop)
Intel Arc A580
...
...
AMD Radeon RX 5700 (Desktop)
Intel Arc A580
...
...
AMD Radeon RX 5700 (Desktop)
Intel Arc A580
...
...
AMD Radeon RX 5700 (Desktop)
Intel Arc A580
...
...
AMD Radeon RX 5700 (Desktop)
...
» With all tested laptops playable in detail settings ultra.
Additional Benchmarks
Low Preset 1280x720
330 [X] AMD Radeon RX 5700 AMD Ryzen 9 7950X 4.5GHz
Radeon RX 5700 (Desktop)
min:
66.5 fps, P0.1:
179.9 fps, P1:
213 fps, max:
501 fps
...
AMD Radeon RX 5700 (Desktop)
Intel Arc A580
...
...
AMD Radeon RX 5700 (Desktop)
Intel Arc A580
...
...
AMD Radeon RX 5700 (Desktop)
...
...
AMD Radeon RX 5700 (Desktop)
Intel Arc A580
...
...
AMD Radeon RX 5700 (Desktop)
Intel Arc A580
...
...
AMD Radeon RX 5700 (Desktop)
...
» With all tested laptops playable in detail settings ultra.
Additional Benchmarks
Low Preset (without FSR Upscaling) 1280x720
212 [X] AMD Radeon RX 5700 AMD Ryzen 9 7950X 4.5GHz
Radeon RX 5700 (Desktop)
...
Intel Arc A580
AMD Radeon RX 5700 (Desktop)
...
...
AMD Radeon RX 5700 (Desktop)
...
...
AMD Radeon RX 5700 (Desktop)
...
...
Intel Arc A580
AMD Radeon RX 5700 (Desktop)
...
...
AMD Radeon RX 5700 (Desktop)
...
...
Intel Arc A580
AMD Radeon RX 5700 (Desktop)
...
» With all tested laptops playable in detail settings ultra.
Additional Benchmarks
Low Preset 1280x720
141.5 [X] AMD Radeon RX 5700 AMD Ryzen 9 7950X 4.5GHz
Radeon RX 5700 (Desktop)
min:
36.9 fps, P0.1:
84.9 fps, P1:
99.5 fps, max:
221 fps
...
AMD Radeon RX 5700 (Desktop)
...
...
AMD Radeon RX 5700 (Desktop)
...
...
AMD Radeon RX 5700 (Desktop)
Intel Arc A580
...
...
AMD Radeon RX 5700 (Desktop)
Intel Arc A580
...
...
AMD Radeon RX 5700 (Desktop)
...
...
AMD Radeon RX 5700 (Desktop)
Intel Arc A580
...
» With all tested laptops playable in detail settings ultra.
Additional Benchmarks
Very Low Preset 1280x720
141.6 [X] AMD Radeon RX 5700 AMD Ryzen 9 7950X 4.5GHz
Radeon RX 5700 (Desktop)
min:
88.6 fps, P0.1:
91.1 fps, P1:
98.4 fps, max:
256 fps
...
AMD Radeon RX 5700 (Desktop)
...
...
AMD Radeon RX 5700 (Desktop)
...
...
AMD Radeon RX 5700 (Desktop)
...
...
AMD Radeon RX 5700 (Desktop)
...
...
AMD Radeon RX 5700 (Desktop)
...
...
AMD Radeon RX 5700 (Desktop)
...
» With all tested laptops playable in detail settings ultra.
Additional Benchmarks
Basic Quality Preset T2X SMAA 1280x720
182 [X] AMD Radeon RX 5700 AMD Ryzen 9 7950X 4.5GHz
Radeon RX 5700 (Desktop)
...
AMD Radeon RX 5700 (Desktop)
...
...
AMD Radeon RX 5700 (Desktop)
...
...
AMD Radeon RX 5700 (Desktop)
...
...
AMD Radeon RX 5700 (Desktop)
...
...
AMD Radeon RX 5700 (Desktop)
...
...
Intel Arc A580
AMD Radeon RX 5700 (Desktop)
...
» With all tested laptops playable in detail settings ultra.
Additional Benchmarks
Low Preset 1280x720
92.5 [X] AMD Radeon RX 5700 AMD Ryzen 9 7950X 4.5GHz
Radeon RX 5700 (Desktop)
min:
80.3 fps, P0.1:
81.4 fps, P1:
83 fps, max:
117.1 fps
0 100 200 300 400 500 600 700 800 900 1000 1100 1200 1300 1400 1500 Tooltip
...
Intel Arc A580
AMD Radeon RX 5700 (Desktop)
...
...
Intel Arc A580
AMD Radeon RX 5700 (Desktop)
...
...
AMD Radeon RX 5700 (Desktop)
Intel Arc A580
...
0 100 200 300 400 500 600 700 800 900 1000 Tooltip
...
AMD Radeon RX 5700 (Desktop)
Intel Arc A580
...
...
AMD Radeon RX 5700 (Desktop)
Intel Arc A580
...
...
AMD Radeon RX 5700 (Desktop)
Intel Arc A580
...
» With all tested laptops playable in detail settings ultra.
Additional Benchmarks
Low Preset 1280x720
124.8 [X] AMD Radeon RX 5700 AMD Ryzen 9 7950X 4.5GHz
Radeon RX 5700 (Desktop)
min:
17 fps, P0.1:
69.4 fps, P1:
98.7 fps, max:
216 fps
0 100 200 300 400 500 600 700 Tooltip
...
AMD Radeon RX 5700 (Desktop)
...
...
AMD Radeon RX 5700 (Desktop)
...
...
AMD Radeon RX 5700 (Desktop)
...
...
AMD Radeon RX 5700 (Desktop)
...
...
AMD Radeon RX 5700 (Desktop)
...
...
AMD Radeon RX 5700 (Desktop)
...
» With all tested laptops playable in detail settings ultra.
Additional Benchmarks
Low Rendering Quality 1280x720
336 [X] AMD Radeon RX 5700 AMD Ryzen 9 7950X 4.5GHz
Radeon RX 5700 (Desktop)
min:
48.1 fps, P0.1:
216 fps, P1:
255 fps, max:
434 fps
120.5 [X] AMD Radeon RX 5700 AMD Ryzen 9 7900X 4.7GHz
Radeon RX 5700 (Desktop)
min:
43.9 fps, P0.1:
68.7 fps, P1:
95.9 fps, max:
318 fps
120.8 [X] AMD Radeon RX 5700 AMD Ryzen 9 7950X 4.5GHz
Radeon RX 5700 (Desktop)
min:
42.2 fps, P0.1:
66.6 fps, P1:
95.3 fps, max:
346 fps
~ 121 fps
+ Compare
- Hide Comparison
+ 📈 Graph
- 📈 Hide Graph
0 100 Tooltip : Ø124.4 (103.78-188.2)
: Ø122.4 (105.22-142.8)
...
Intel Arc A580
AMD Radeon RX 5700 (Desktop)
...
94.3 [X] AMD Radeon RX 5700 AMD Ryzen 9 7950X 4.5GHz
Radeon RX 5700 (Desktop)
min:
10.5 fps, P0.1:
16.2 fps, P1:
73.2 fps, max:
248 fps
95 [X] AMD Radeon RX 5700 AMD Ryzen 9 7900X 4.7GHz
Radeon RX 5700 (Desktop)
min:
35.5 fps, P0.1:
52.4 fps, P1:
71.9 fps, max:
277 fps
~ 95 fps
+ Compare
- Hide Comparison
+ 📈 Graph
- 📈 Hide Graph
0 100 Tooltip : Ø97.3 (58.008-124.4)
: Ø97.7 (75.225-123.1)
...
Intel Arc A580
AMD Radeon RX 5700 (Desktop)
...
76 [X] AMD Radeon RX 5700 AMD Ryzen 9 7900X 4.7GHz
Radeon RX 5700 (Desktop)
min:
32.4 fps, P0.1:
46.9 fps, P1:
56.3 fps, max:
234 fps
77.5 [X] AMD Radeon RX 5700 AMD Ryzen 9 7950X 4.5GHz
Radeon RX 5700 (Desktop)
min:
35.2 fps, P0.1:
44.1 fps, P1:
59.4 fps, max:
268 fps
~ 77 fps
+ Compare
- Hide Comparison
+ 📈 Graph
- 📈 Hide Graph
0 100 200 300 400 500 Tooltip : Ø80.8 (58.468-117.3)
: Ø95.8 (60.508-572)
...
Intel Arc A580
AMD Radeon RX 5700 (Desktop)
...
56 [X] AMD Radeon RX 5700 AMD Ryzen 9 7950X 4.5GHz
Radeon RX 5700 (Desktop)
min:
22.4 fps, P0.1:
24.4 fps, P1:
48.2 fps, max:
237 fps
56.1 [X] AMD Radeon RX 5700 AMD Ryzen 9 7900X 4.7GHz
Radeon RX 5700 (Desktop)
min:
22 fps, P0.1:
24.4 fps, P1:
46.4 fps, max:
132.7 fps
~ 56 fps
+ Compare
- Hide Comparison
+ 📈 Graph
- 📈 Hide Graph
0 100 Tooltip : Ø59.9 (51.383-76.3)
: Ø60 (49.814-103.3)
...
Intel Arc A580
AMD Radeon RX 5700 (Desktop)
...
36.5 [X] AMD Radeon RX 5700 AMD Ryzen 9 7900X 4.7GHz
Radeon RX 5700 (Desktop)
min:
13.8 fps, P0.1:
14.3 fps, P1:
31.1 fps, max:
93.9 fps
36.5 [X] AMD Radeon RX 5700 AMD Ryzen 9 7950X 4.5GHz
Radeon RX 5700 (Desktop)
min:
13.8 fps, P0.1:
13.9 fps, P1:
31.1 fps, max:
90.2 fps
~ 37 fps
+ Compare
- Hide Comparison
+ 📈 Graph
- 📈 Hide Graph
0 100 Tooltip : Ø40.1 (33.015-119.1)
: Ø40.4 (33.018-69.9)
...
Intel Arc A580
AMD Radeon RX 5700 (Desktop)
...
13.3 [X] AMD Radeon RX 5700 AMD Ryzen 9 7900X 4.7GHz
Radeon RX 5700 (Desktop)
min:
5.21 fps, P0.1:
5.43 fps, P1:
10.6 fps, max:
17.2 fps
13.8 [X] AMD Radeon RX 5700 AMD Ryzen 9 7950X 4.5GHz
Radeon RX 5700 (Desktop)
min:
1.254 fps, P0.1:
2.2 fps, P1:
5.64 fps, max:
37.5 fps
~ 14 fps
+ Compare
- Hide Comparison
+ 📈 Graph
- 📈 Hide Graph
0 100 200 300 400 500 600 Tooltip : Ø26.7 (10.237-640)
: Ø18.1 (7.16-88.6)
...
AMD Radeon RX 5700 (Desktop)
Intel Arc A580
...
» With all tested laptops playable in detail settings ultra.
Additional Benchmarks
Low Preset 1280x720
167.4 [X] AMD Radeon RX 5700 AMD Ryzen 9 7950X 4.5GHz
Radeon RX 5700 (Desktop)
min:
16.1 fps, P0.1:
101 fps, P1:
142.4 fps, max:
324 fps
227 [X] AMD Radeon RX 5700 923650
AMD Ryzen 9 7900X 4.7GHz
Radeon RX 5700 (Desktop)
min:
171 fps, P1:
159 fps, max:
260 fps
234 [X] AMD Radeon RX 5700 959964
AMD Ryzen 9 7950X 4.5GHz
Radeon RX 5700 (Desktop)
min:
173 fps, P1:
158 fps, max:
278 fps
~ 231 fps
+ Compare
- Hide Comparison
...
AMD Radeon RX 5700 (Desktop)
...
208 [X] AMD Radeon RX 5700 959964
AMD Ryzen 9 7950X 4.5GHz
Radeon RX 5700 (Desktop)
min:
164 fps, P1:
146 fps, max:
241 fps
214 [X] AMD Radeon RX 5700 923650
AMD Ryzen 9 7900X 4.7GHz
Radeon RX 5700 (Desktop)
min:
168 fps, P1:
153 fps, max:
253 fps
~ 211 fps
+ Compare
- Hide Comparison
...
AMD Radeon RX 5700 (Desktop)
...
153.9 [X] AMD Radeon RX 5700 959964
AMD Ryzen 9 7950X 4.5GHz
Radeon RX 5700 (Desktop)
min:
120 fps, P1:
112 fps, max:
175 fps
155.1 [X] AMD Radeon RX 5700 923650
AMD Ryzen 9 7900X 4.7GHz
Radeon RX 5700 (Desktop)
min:
121 fps, P1:
113 fps, max:
182 fps
~ 155 fps
+ Compare
- Hide Comparison
...
AMD Radeon RX 5700 (Desktop)
...
102.2 [X] AMD Radeon RX 5700 923650
AMD Ryzen 9 7900X 4.7GHz
Radeon RX 5700 (Desktop)
min:
82 fps, P1:
81 fps, max:
124 fps
105.1 [X] AMD Radeon RX 5700 959964
AMD Ryzen 9 7950X 4.5GHz
Radeon RX 5700 (Desktop)
min:
81 fps, P1:
81 fps, max:
127 fps
~ 104 fps
+ Compare
- Hide Comparison
...
AMD Radeon RX 5700 (Desktop)
...
79.3 [X] AMD Radeon RX 5700 923650
AMD Ryzen 9 7900X 4.7GHz
Radeon RX 5700 (Desktop)
min:
66 fps, P1:
66 fps, max:
95 fps
80.7 [X] AMD Radeon RX 5700 959964
AMD Ryzen 9 7950X 4.5GHz
Radeon RX 5700 (Desktop)
min:
66 fps, P1:
67 fps, max:
95 fps
~ 80 fps
+ Compare
- Hide Comparison
...
AMD Radeon RX 5700 (Desktop)
...
47.8 [X] AMD Radeon RX 5700 959964
AMD Ryzen 9 7950X 4.5GHz
Radeon RX 5700 (Desktop)
min:
41 fps, P1:
41 fps, max:
56 fps
48.1 [X] AMD Radeon RX 5700 923650
AMD Ryzen 9 7900X 4.7GHz
Radeon RX 5700 (Desktop)
min:
41 fps, P1:
41 fps, max:
56 fps
~ 48 fps
+ Compare
- Hide Comparison
...
AMD Radeon RX 5700 (Desktop)
» With all tested laptops playable in detail settings ultra.
Additional Benchmarks
Ultra Low Preset 16xAF TAA 1280x720
326 [X] AMD Radeon RX 5700 AMD Ryzen 9 7900X 4.7GHz
Radeon RX 5700 (Desktop)
min:
235 fps, P1:
212 fps, max:
412 fps
348 [X] AMD Radeon RX 5700 AMD Ryzen 9 7950X 4.5GHz
Radeon RX 5700 (Desktop)
min:
256 fps, P1:
223 fps, max:
435 fps
...
AMD Radeon RX 5700 (Desktop)
...
0 100 Tooltip : Ø161.3 (137.034-188.054)
...
AMD Radeon RX 5700 (Desktop)
...
0 100 Tooltip : Ø157.9 (136.74-184.946)
...
AMD Radeon RX 5700 (Desktop)
...
...
AMD Radeon RX 5700 (Desktop)
...
...
AMD Radeon RX 5700 (Desktop)
...
...
AMD Radeon RX 5700 (Desktop)
...
» With all tested laptops playable in detail settings ultra.
Additional Benchmarks
Low Preset 1280x720
411 [X] AMD Radeon RX 5700 AMD Ryzen 9 5900X 3.7GHz
Radeon RX 5700 (Desktop)
min:
5.65 fps, P0.1:
135.2 fps, P1:
263 fps, max:
628 fps
127.1 [X] AMD Radeon RX 5700 AMD Ryzen 9 5900X 3.7GHz
Radeon RX 5700 (Desktop)
min:
46.9 fps, P0.1:
59.7 fps, P1:
84.1 fps, max:
297 fps
132.6 [X] AMD Radeon RX 5700 AMD Ryzen 9 7950X 4.5GHz
Radeon RX 5700 (Desktop)
min:
37.5 fps, P0.1:
78.9 fps, P1:
81.4 fps, max:
416 fps
252 [X] AMD Radeon RX 5700 AMD Ryzen 9 7950X 4.5GHz
Radeon RX 5700 (Desktop)
min:
27.2 fps, P0.1:
127.6 fps, P1:
185.7 fps, max:
459 fps
~ 171 fps
+ Compare
- Hide Comparison
+ 📈 Graph
- 📈 Hide Graph
0 100 200 300 Tooltip : Ø129.3 (118.009-151.6)
: Ø136.3 (123.4-209.9)
: Ø258 (212.003-356.4)
...
AMD Radeon RX 5700 (Desktop)
...
124 [X] AMD Radeon RX 5700 AMD Ryzen 9 7950X 4.5GHz
Radeon RX 5700 (Desktop)
min:
47.1 fps, P0.1:
72 fps, P1:
74.7 fps, max:
415 fps
126.6 [X] AMD Radeon RX 5700 AMD Ryzen 9 5900X 3.7GHz
Radeon RX 5700 (Desktop)
min:
48.1 fps, P0.1:
71.7 fps, P1:
83.1 fps, max:
293 fps
~ 125 fps
+ Compare
- Hide Comparison
+ 📈 Graph
- 📈 Hide Graph
0 100 200 300 400 500 600 700 800 900 1000 1100 1200 1300 1400 1500 1600 1700 1800 1900 2000 2100 2200 2300 2400 2500 2600 2700 2800 2900 3000 3100 3200 3300 3400 3500 3600 3700 3800 3900 4000 4100 4200 4300 4400 4500 4600 4700 4800 4900 5000 5100 5200 5300 5400 5500 Tooltip : Ø127.2 (117.267-172.3)
: Ø282 (117.314-5515)
...
Intel Arc A580
AMD Radeon RX 5700 (Desktop)
...
121.9 [X] AMD Radeon RX 5700 AMD Ryzen 9 5900X 3.7GHz
Radeon RX 5700 (Desktop)
min:
47.3 fps, P0.1:
63.9 fps, P1:
78.4 fps, max:
284 fps
123 [X] AMD Radeon RX 5700 AMD Ryzen 9 7950X 4.5GHz
Radeon RX 5700 (Desktop)
min:
49.2 fps, P0.1:
71.7 fps, P1:
74.3 fps, max:
410 fps
~ 122 fps
+ Compare
- Hide Comparison
+ 📈 Graph
- 📈 Hide Graph
0 100 Tooltip : Ø125 (117-150.5)
: Ø127.8 (117.015-176.8)
...
Intel Arc A580
AMD Radeon RX 5700 (Desktop)
...
115.7 [X] AMD Radeon RX 5700 AMD Ryzen 9 7950X 4.5GHz
Radeon RX 5700 (Desktop)
min:
47.9 fps, P0.1:
63.9 fps, P1:
68.8 fps, max:
399 fps
123.4 [X] AMD Radeon RX 5700 AMD Ryzen 9 5900X 3.7GHz
Radeon RX 5700 (Desktop)
min:
29.3 fps, P0.1:
67.7 fps, P1:
80.8 fps, max:
297 fps
~ 120 fps
+ Compare
- Hide Comparison
+ 📈 Graph
- 📈 Hide Graph
0 100 Tooltip : Ø118.3 (110.703-145.7)
: Ø128.3 (115.405-187.3)
...
Intel Arc A580
AMD Radeon RX 5700 (Desktop)
...
75.4 [X] AMD Radeon RX 5700 AMD Ryzen 9 7950X 4.5GHz
Radeon RX 5700 (Desktop)
min:
35.2 fps, P0.1:
40.2 fps, P1:
41.7 fps, max:
371 fps
78.2 [X] AMD Radeon RX 5700 AMD Ryzen 9 5900X 3.7GHz
Radeon RX 5700 (Desktop)
min:
24.4 fps, P0.1:
44.2 fps, P1:
46.2 fps, max:
260 fps
~ 77 fps
+ Compare
- Hide Comparison
+ 📈 Graph
- 📈 Hide Graph
0 100 200 300 400 500 600 700 Tooltip : Ø98.2 (70.355-763)
: Ø80.6 (74.714-91.94)
...
AMD Radeon RX 5700 (Desktop)
Intel Arc A580
...
36 [X] AMD Radeon RX 5700 AMD Ryzen 9 7950X 4.5GHz
Radeon RX 5700 (Desktop)
min:
16.3 fps, P0.1:
18 fps, P1:
18.4 fps, max:
335 fps
37.8 [X] AMD Radeon RX 5700 AMD Ryzen 9 5900X 3.7GHz
Radeon RX 5700 (Desktop)
min:
19.6 fps, P0.1:
19.6 fps, P1:
20.2 fps, max:
243 fps
~ 37 fps
+ Compare
- Hide Comparison
+ 📈 Graph
- 📈 Hide Graph
0 Tooltip : Ø39.2 (34.029-68.4)
: Ø40.8 (36.055-55.9)
...
AMD Radeon RX 5700 (Desktop)
Intel Arc A580
...
» With all tested laptops playable in detail settings ultra.
Additional Benchmarks
Lowest Settings 1280x720
198.8 [X] AMD Radeon RX 5700 AMD Ryzen 9 5900X 3.7GHz
Radeon RX 5700 (Desktop)
min:
16.4 fps, P0.1:
81.4 fps, P1:
143.5 fps, max:
315 fps
174.3 [X] AMD Radeon RX 5700 AMD Ryzen 9 5900X 3.7GHz
Radeon RX 5700 (Desktop)
196.8 [X] AMD Radeon RX 5700 AMD Ryzen 9 7950X 4.5GHz
Radeon RX 5700 (Desktop)
197.3 [X] AMD Radeon RX 5700 AMD Ryzen 9 7900X 4.7GHz
Radeon RX 5700 (Desktop)
~ 189 fps
+ Compare
- Hide Comparison
...
Intel Arc A580
AMD Radeon RX 5700 (Desktop)
...
139.2 [X] AMD Radeon RX 5700 AMD Ryzen 9 5900X 3.7GHz
Radeon RX 5700 (Desktop)
154.2 [X] AMD Radeon RX 5700 AMD Ryzen 9 7900X 4.7GHz
Radeon RX 5700 (Desktop)
154.2 [X] AMD Radeon RX 5700 AMD Ryzen 9 7950X 4.5GHz
Radeon RX 5700 (Desktop)
~ 149 fps
+ Compare
- Hide Comparison
...
Intel Arc A580
AMD Radeon RX 5700 (Desktop)
...
93.9 [X] AMD Radeon RX 5700 AMD Ryzen 9 5900X 3.7GHz
Radeon RX 5700 (Desktop)
98.1 [X] AMD Radeon RX 5700 AMD Ryzen 9 7900X 4.7GHz
Radeon RX 5700 (Desktop)
98.2 [X] AMD Radeon RX 5700 AMD Ryzen 9 7950X 4.5GHz
Radeon RX 5700 (Desktop)
~ 97 fps
+ Compare
- Hide Comparison
...
Intel Arc A580
AMD Radeon RX 5700 (Desktop)
...
72.2 [X] AMD Radeon RX 5700 AMD Ryzen 9 5900X 3.7GHz
Radeon RX 5700 (Desktop)
74.3 [X] AMD Radeon RX 5700 AMD Ryzen 9 7900X 4.7GHz
Radeon RX 5700 (Desktop)
74.3 [X] AMD Radeon RX 5700 AMD Ryzen 9 7950X 4.5GHz
Radeon RX 5700 (Desktop)
~ 74 fps
+ Compare
- Hide Comparison
...
AMD Radeon RX 5700 (Desktop)
Intel Arc A580
...
51.1 [X] AMD Radeon RX 5700 AMD Ryzen 9 7950X 4.5GHz
Radeon RX 5700 (Desktop)
51.2 [X] AMD Radeon RX 5700 AMD Ryzen 9 5900X 3.7GHz
Radeon RX 5700 (Desktop)
51.2 [X] AMD Radeon RX 5700 AMD Ryzen 9 7900X 4.7GHz
Radeon RX 5700 (Desktop)
~ 51 fps
+ Compare
- Hide Comparison
...
AMD Radeon RX 5700 (Desktop)
Intel Arc A580
...
25 [X] AMD Radeon RX 5700 AMD Ryzen 9 7900X 4.7GHz
Radeon RX 5700 (Desktop)
26.4 [X] AMD Radeon RX 5700 AMD Ryzen 9 7950X 4.5GHz
Radeon RX 5700 (Desktop)
27.3 [X] AMD Radeon RX 5700 AMD Ryzen 9 5900X 3.7GHz
Radeon RX 5700 (Desktop)
~ 26 fps
+ Compare
- Hide Comparison
...
AMD Radeon RX 5700 (Desktop)
Intel Arc A580
...
» With all tested laptops playable in detail settings ultra.
Additional Benchmarks
Lowest Preset (DX12) 1280x720
279 [X] AMD Radeon RX 5700 AMD Ryzen 9 5900X 3.7GHz
Radeon RX 5700 (Desktop)
358 [X] AMD Radeon RX 5700 AMD Ryzen 9 7900X 4.7GHz
Radeon RX 5700 (Desktop)
365 [X] AMD Radeon RX 5700 AMD Ryzen 9 7950X 4.5GHz
Radeon RX 5700 (Desktop)
...
AMD Radeon RX 5700 (Desktop)
...
...
AMD Radeon RX 5700 (Desktop)
...
...
Intel Arc A580
AMD Radeon RX 5700 (Desktop)
...
...
Intel Arc A580
AMD Radeon RX 5700 (Desktop)
...
...
AMD Radeon RX 5700 (Desktop)
Intel Arc A580
...
...
AMD Radeon RX 5700 (Desktop)
...
» With all tested laptops playable in detail settings ultra.
Additional Benchmarks
Low Preset 1280x720
79.6 [X] AMD Radeon RX 5700 AMD Ryzen 9 5900X 3.7GHz
Radeon RX 5700 (Desktop)
129 [X] AMD Radeon RX 5700 AMD Ryzen 9 7950X 4.5GHz
Radeon RX 5700 (Desktop)
...
AMD Radeon RX 5700 (Desktop)
...
...
AMD Radeon RX 5700 (Desktop)
...
...
AMD Radeon RX 5700 (Desktop)
...
...
AMD Radeon RX 5700 (Desktop)
...
...
AMD Radeon RX 5700 (Desktop)
...
...
AMD Radeon RX 5700 (Desktop)
...
» With all tested laptops playable in detail settings ultra.
Additional Benchmarks
Low / Off 1280x720
75.1 [X] AMD Radeon RX 5700 AMD Ryzen 9 5900X 3.7GHz
Radeon RX 5700 (Desktop)
min:
43.7 fps, P0.1:
45.4 fps, P1:
52.3 fps, max:
109 fps
215.5 [X] AMD Radeon RX 5700 AMD Ryzen 9 5900X 3.7GHz
Radeon RX 5700 (Desktop)
219 [X] AMD Radeon RX 5700 712825
AMD Ryzen 9 7950X 4.5GHz
Radeon RX 5700 (Desktop)
min:
102 fps, max:
471 fps
235.3 [X] AMD Radeon RX 5700 AMD Ryzen 9 7900X 4.7GHz
Radeon RX 5700 (Desktop)
~ 223 fps
+ Compare
- Hide Comparison
...
AMD Radeon RX 5700 (Desktop)
...
169.6 [X] AMD Radeon RX 5700 AMD Ryzen 9 5900X 3.7GHz
Radeon RX 5700 (Desktop)
177.5 [X] AMD Radeon RX 5700 712825
AMD Ryzen 9 7950X 4.5GHz
Radeon RX 5700 (Desktop)
min:
77.7 fps, max:
404 fps
197.1 [X] AMD Radeon RX 5700 AMD Ryzen 9 7900X 4.7GHz
Radeon RX 5700 (Desktop)
~ 181 fps
+ Compare
- Hide Comparison
...
AMD Radeon RX 5700 (Desktop)
...
139.8 [X] AMD Radeon RX 5700 AMD Ryzen 9 5900X 3.7GHz
Radeon RX 5700 (Desktop)
142.7 [X] AMD Radeon RX 5700 712825
AMD Ryzen 9 7950X 4.5GHz
Radeon RX 5700 (Desktop)
min:
94 fps, max:
371 fps
164.5 [X] AMD Radeon RX 5700 AMD Ryzen 9 7900X 4.7GHz
Radeon RX 5700 (Desktop)
~ 149 fps
+ Compare
- Hide Comparison
...
AMD Radeon RX 5700 (Desktop)
...
109.9 [X] AMD Radeon RX 5700 AMD Ryzen 9 5900X 3.7GHz
Radeon RX 5700 (Desktop)
116.5 [X] AMD Radeon RX 5700 712825
AMD Ryzen 9 7950X 4.5GHz
Radeon RX 5700 (Desktop)
min:
23.6 fps, max:
312 fps
132.4 [X] AMD Radeon RX 5700 AMD Ryzen 9 7900X 4.7GHz
Radeon RX 5700 (Desktop)
~ 120 fps
+ Compare
- Hide Comparison
...
AMD Radeon RX 5700 (Desktop)
...
90.5 [X] AMD Radeon RX 5700 AMD Ryzen 9 5900X 3.7GHz
Radeon RX 5700 (Desktop)
95.3 [X] AMD Radeon RX 5700 712825
AMD Ryzen 9 7950X 4.5GHz
Radeon RX 5700 (Desktop)
min:
71.3 fps, max:
171.4 fps
106.6 [X] AMD Radeon RX 5700 AMD Ryzen 9 7900X 4.7GHz
Radeon RX 5700 (Desktop)
~ 97 fps
+ Compare
- Hide Comparison
...
AMD Radeon RX 5700 (Desktop)
...
56.9 [X] AMD Radeon RX 5700 AMD Ryzen 9 5900X 3.7GHz
Radeon RX 5700 (Desktop)
61.6 [X] AMD Radeon RX 5700 712825
AMD Ryzen 9 7950X 4.5GHz
Radeon RX 5700 (Desktop)
min:
39.3 fps, max:
85.4 fps
67 [X] AMD Radeon RX 5700 AMD Ryzen 9 7900X 4.7GHz
Radeon RX 5700 (Desktop)
~ 62 fps
+ Compare
- Hide Comparison
...
AMD Radeon RX 5700 (Desktop)
...
» With all tested laptops playable in detail settings ultra.
Additional Benchmarks
Low Preset 1280x720
259.8 [X] AMD Radeon RX 5700 AMD Ryzen 9 5900X 3.7GHz
Radeon RX 5700 (Desktop)
329.1 [X] AMD Radeon RX 5700 AMD Ryzen 9 7900X 4.7GHz
Radeon RX 5700 (Desktop)
261 [X] AMD Radeon RX 5700 AMD Ryzen 9 7950X 4.5GHz
Radeon RX 5700 (Desktop)
min:
20.2 fps, max:
534 fps
...
AMD Radeon RX 5700 (Desktop)
...
...
AMD Radeon RX 5700 (Desktop)
...
...
AMD Radeon RX 5700 (Desktop)
...
...
AMD Radeon RX 5700 (Desktop)
...
...
AMD Radeon RX 5700 (Desktop)
...
...
AMD Radeon RX 5700 (Desktop)
...
» With all tested laptops playable in detail settings ultra.
Additional Benchmarks
Low Preset 1280x720
60 [X] AMD Radeon RX 5700 AMD Ryzen 9 5900X 3.7GHz
Radeon RX 5700 (Desktop)
...
AMD Radeon RX 5700 (Desktop)
...
...
AMD Radeon RX 5700 (Desktop)
...
...
AMD Radeon RX 5700 (Desktop)
...
...
AMD Radeon RX 5700 (Desktop)
...
...
AMD Radeon RX 5700 (Desktop)
...
» With all tested laptops playable in detail settings high.
Additional Benchmarks
Low Quality 1280x720
175 [X] AMD Radeon RX 5700 AMD Ryzen 9 5900X 3.7GHz
Radeon RX 5700 (Desktop)
min:
67.6 fps, P0.1:
89.2 fps, P1:
126 fps, max:
259 fps
...
AMD Radeon RX 5700 (Desktop)
...
...
AMD Radeon RX 5700 (Desktop)
...
...
AMD Radeon RX 5700 (Desktop)
...
...
AMD Radeon RX 5700 (Desktop)
...
...
AMD Radeon RX 5700 (Desktop)
...
...
AMD Radeon RX 5700 (Desktop)
...
» With all tested laptops playable in detail settings ultra.
Additional Benchmarks
Ultra Low Preset (with Fixed Resolution Quality) 1280x720
319 [X] AMD Radeon RX 5700 AMD Ryzen 9 5900X 3.7GHz
Radeon RX 5700 (Desktop)
116 [X] AMD Radeon RX 5700 AMD Ryzen 9 5900X 3.7GHz
Radeon RX 5700 (Desktop)
min:
71.9 fps, P0.1:
79.1 fps, P1:
95.7 fps, max:
159 fps
118.1 [X] AMD Radeon RX 5700 AMD Ryzen 9 7950X 4.5GHz
Radeon RX 5700 (Desktop)
min:
100.6 fps, P0.1:
102.5 fps, P1:
105.8 fps, max:
143.7 fps
122.2 [X] AMD Radeon RX 5700 AMD Ryzen 9 7900X 4.7GHz
Radeon RX 5700 (Desktop)
min:
66.1 fps, P0.1:
98.4 fps, P1:
104.2 fps, max:
220 fps
~ 119 fps
+ Compare
- Hide Comparison
+ 📈 Graph
- 📈 Hide Graph
0 100 200 Tooltip : Ø120 (107.282-147.6)
: Ø119.1 (109.038-135.27)
: Ø130.2 (113.411-221.2)
...
AMD Radeon RX 5700 (Desktop)
...
81.2 [X] AMD Radeon RX 5700 AMD Ryzen 9 7950X 4.5GHz
Radeon RX 5700 (Desktop)
min:
72 fps, P0.1:
72.2 fps, P1:
74.5 fps, max:
93.8 fps
97 [X] AMD Radeon RX 5700 AMD Ryzen 9 5900X 3.7GHz
Radeon RX 5700 (Desktop)
min:
72.6 fps, P0.1:
78.3 fps, P1:
85.3 fps, max:
137 fps
100.9 [X] AMD Radeon RX 5700 AMD Ryzen 9 7900X 4.7GHz
Radeon RX 5700 (Desktop)
min:
83.5 fps, P0.1:
88.2 fps, P1:
91.9 fps, max:
116.9 fps
~ 93 fps
+ Compare
- Hide Comparison
+ 📈 Graph
- 📈 Hide Graph
0 100 200 300 400 500 600 Tooltip : Ø103.8 (78.037-664)
: Ø103.1 (93.317-165.1)
: Ø105.3 (94.007-153.2)
...
AMD Radeon RX 5700 (Desktop)
...
77.6 [X] AMD Radeon RX 5700 AMD Ryzen 9 5900X 3.7GHz
Radeon RX 5700 (Desktop)
min:
63.1 fps, P0.1:
66.1 fps, P1:
69.4 fps, max:
106 fps
82.7 [X] AMD Radeon RX 5700 AMD Ryzen 9 7900X 4.7GHz
Radeon RX 5700 (Desktop)
min:
63 fps, P0.1:
72.4 fps, P1:
74.9 fps, max:
109.4 fps
99.5 [X] AMD Radeon RX 5700 AMD Ryzen 9 7950X 4.5GHz
Radeon RX 5700 (Desktop)
min:
88 fps, P0.1:
89.1 fps, P1:
91.3 fps, max:
113.7 fps
~ 87 fps
+ Compare
- Hide Comparison
+ 📈 Graph
- 📈 Hide Graph
0 100 200 300 400 500 600 700 800 900 Tooltip : Ø81.8 (72.15-137.6)
: Ø86.1 (76.13-98.9)
: Ø131.7 (94.259-914)
...
AMD Radeon RX 5700 (Desktop)
...
53.7 [X] AMD Radeon RX 5700 AMD Ryzen 9 5900X 3.7GHz
Radeon RX 5700 (Desktop)
min:
45.2 fps, P0.1:
45.6 fps, P1:
47 fps, max:
71 fps
57.5 [X] AMD Radeon RX 5700 AMD Ryzen 9 7950X 4.5GHz
Radeon RX 5700 (Desktop)
min:
46.7 fps, P0.1:
48 fps, P1:
48.7 fps, max:
67.6 fps
58.7 [X] AMD Radeon RX 5700 AMD Ryzen 9 7900X 4.7GHz
Radeon RX 5700 (Desktop)
min:
48.5 fps, P0.1:
48.6 fps, P1:
49.7 fps, max:
69.3 fps
~ 57 fps
+ Compare
- Hide Comparison
+ 📈 Graph
- 📈 Hide Graph
0 100 200 300 Tooltip : Ø65.9 (47.424-343)
: Ø60.6 (51.66-77.4)
: Ø71.3 (50.727-367)
...
AMD Radeon RX 5700 (Desktop)
...
43 [X] AMD Radeon RX 5700 AMD Ryzen 9 5900X 3.7GHz
Radeon RX 5700 (Desktop)
min:
34.2 fps, P0.1:
36.7 fps, P1:
37.6 fps, max:
50 fps
45.5 [X] AMD Radeon RX 5700 AMD Ryzen 9 7950X 4.5GHz
Radeon RX 5700 (Desktop)
min:
39.2 fps, P0.1:
39.3 fps, P1:
39.7 fps, max:
51.6 fps
46.2 [X] AMD Radeon RX 5700 AMD Ryzen 9 7900X 4.7GHz
Radeon RX 5700 (Desktop)
min:
39.7 fps, P0.1:
40.1 fps, P1:
41 fps, max:
53.9 fps
~ 45 fps
+ Compare
- Hide Comparison
+ 📈 Graph
- 📈 Hide Graph
0 100 Tooltip : Ø49.7 (38.081-158)
: Ø51.9 (40.216-103.2)
: Ø47.9 (41.15-58.9)
...
Intel Arc A580
AMD Radeon RX 5700 (Desktop)
...
26.8 [X] AMD Radeon RX 5700 AMD Ryzen 9 5900X 3.7GHz
Radeon RX 5700 (Desktop)
min:
2.5 fps, P0.1:
2.64 fps, P1:
24.6 fps, max:
30.2 fps
28.4 [X] AMD Radeon RX 5700 AMD Ryzen 9 7950X 4.5GHz
Radeon RX 5700 (Desktop)
min:
26.3 fps, P0.1:
26.4 fps, P1:
26.5 fps, max:
31.3 fps
28.7 [X] AMD Radeon RX 5700 AMD Ryzen 9 7900X 4.7GHz
Radeon RX 5700 (Desktop)
min:
26.1 fps, P0.1:
26.2 fps, P1:
26.4 fps, max:
31.2 fps
~ 28 fps
+ Compare
- Hide Comparison
+ 📈 Graph
- 📈 Hide Graph
0 100 200 Tooltip : Ø38 (16.118-284)
: Ø34.5 (26.224-110.8)
: Ø35.7 (26.241-99.3)
...
Intel Arc A580
AMD Radeon RX 5700 (Desktop)
...
» With all tested laptops playable in detail settings ultra.
Additional Benchmarks
Low Preset 1280x720
135 [X] AMD Radeon RX 5700 AMD Ryzen 9 5900X 3.7GHz
Radeon RX 5700 (Desktop)
min:
51.9 fps, P0.1:
69.9 fps, P1:
92.4 fps, max:
305 fps
174 [X] AMD Radeon RX 5700 AMD Ryzen 9 7900X 4.7GHz
Radeon RX 5700 (Desktop)
min:
109 fps, P0.1:
131.4 fps, P1:
144.1 fps, max:
291 fps
170.3 [X] AMD Radeon RX 5700 AMD Ryzen 9 7950X 4.5GHz
Radeon RX 5700 (Desktop)
min:
63.9 fps, P0.1:
73.3 fps, P1:
128.3 fps, max:
234 fps
...
AMD Radeon RX 5700 (Desktop)
...
...
AMD Radeon RX 5700 (Desktop)
...
...
AMD Radeon RX 5700 (Desktop)
...
0 100 200 300 400 500 600 700 800 900 1000 1100 1200 1300 1400 1500 1600 1700 1800 1900 2000 Tooltip
...
AMD Radeon RX 5700 (Desktop)
...
...
AMD Radeon RX 5700 (Desktop)
...
» With all tested laptops playable in detail settings ultra.
Additional Benchmarks
Low Preset 1920x1080
94.3 [X] AMD Radeon RX 5700 AMD Ryzen 9 5900X 3.7GHz
Radeon RX 5700 (Desktop)
min:
37.4 fps, P0.1:
52.1 fps, P1:
72.9 fps, max:
288 fps
...
AMD Radeon RX 5700 (Desktop)
...
...
AMD Radeon RX 5700 (Desktop)
...
...
AMD Radeon RX 5700 (Desktop)
...
...
AMD Radeon RX 5700 (Desktop)
...
...
AMD Radeon RX 5700 (Desktop)
...
...
AMD Radeon RX 5700 (Desktop)
Intel Arc A580
...
» With all tested laptops playable in detail settings ultra.
Additional Benchmarks
Low Preset 1920x1080
292 [X] AMD Radeon RX 5700 AMD Ryzen 9 5900X 3.7GHz
Radeon RX 5700 (Desktop)
min:
26.5 fps, P0.1:
148 fps, P1:
168 fps, max:
376 fps
...
AMD Radeon RX 5700 (Desktop)
...
0 100 Tooltip : Ø116.8 (102.776-130.34)
...
AMD Radeon RX 5700 (Desktop)
...
...
AMD Radeon RX 5700 (Desktop)
...
...
AMD Radeon RX 5700 (Desktop)
...
0 100 200 300 400 500 600 700 800 900 1000 1100 1200 1300 1400 1500 1600 1700 1800 1900 2000 2100 2200 2300 2400 2500 2600 2700 2800 2900 3000 Tooltip
...
AMD Radeon RX 5700 (Desktop)
...
...
AMD Radeon RX 5700 (Desktop)
...
» With all tested laptops playable in detail settings ultra.
206 [X] AMD Radeon RX 5700 AMD Ryzen 9 5900X 3.7GHz
Radeon RX 5700 (Desktop)
283 [X] AMD Radeon RX 5700 AMD Ryzen 9 7900X 4.7GHz
Radeon RX 5700 (Desktop)
283 [X] AMD Radeon RX 5700 AMD Ryzen 9 7950X 4.5GHz
Radeon RX 5700 (Desktop)
~ 257 fps
+ Compare
- Hide Comparison
...
Intel Arc A580
AMD Radeon RX 5700 (Desktop)
...
106 [X] AMD Radeon RX 5700 AMD Ryzen 9 5900X 3.7GHz
Radeon RX 5700 (Desktop)
150 [X] AMD Radeon RX 5700 AMD Ryzen 9 7900X 4.7GHz
Radeon RX 5700 (Desktop)
160 [X] AMD Radeon RX 5700 AMD Ryzen 9 7950X 4.5GHz
Radeon RX 5700 (Desktop)
~ 139 fps
+ Compare
- Hide Comparison
...
AMD Radeon RX 5700 (Desktop)
...
93 [X] AMD Radeon RX 5700 AMD Ryzen 9 5900X 3.7GHz
Radeon RX 5700 (Desktop)
132 [X] AMD Radeon RX 5700 AMD Ryzen 9 7900X 4.7GHz
Radeon RX 5700 (Desktop)
137 [X] AMD Radeon RX 5700 AMD Ryzen 9 7950X 4.5GHz
Radeon RX 5700 (Desktop)
~ 121 fps
+ Compare
- Hide Comparison
...
Intel Arc A580
AMD Radeon RX 5700 (Desktop)
...
50 [X] AMD Radeon RX 5700 AMD Ryzen 9 5900X 3.7GHz
Radeon RX 5700 (Desktop)
71 [X] AMD Radeon RX 5700 AMD Ryzen 9 7900X 4.7GHz
Radeon RX 5700 (Desktop)
73 [X] AMD Radeon RX 5700 AMD Ryzen 9 7950X 4.5GHz
Radeon RX 5700 (Desktop)
~ 65 fps
+ Compare
- Hide Comparison
...
AMD Radeon RX 5700 (Desktop)
Intel Arc A580
...
42 [X] AMD Radeon RX 5700 AMD Ryzen 9 5900X 3.7GHz
Radeon RX 5700 (Desktop)
59 [X] AMD Radeon RX 5700 AMD Ryzen 9 7900X 4.7GHz
Radeon RX 5700 (Desktop)
61 [X] AMD Radeon RX 5700 AMD Ryzen 9 7950X 4.5GHz
Radeon RX 5700 (Desktop)
~ 54 fps
+ Compare
- Hide Comparison
...
AMD Radeon RX 5700 (Desktop)
Intel Arc A580
...
30 [X] AMD Radeon RX 5700 AMD Ryzen 9 5900X 3.7GHz
Radeon RX 5700 (Desktop)
40 [X] AMD Radeon RX 5700 AMD Ryzen 9 7900X 4.7GHz
Radeon RX 5700 (Desktop)
42 [X] AMD Radeon RX 5700 AMD Ryzen 9 7950X 4.5GHz
Radeon RX 5700 (Desktop)
~ 37 fps
+ Compare
- Hide Comparison
...
AMD Radeon RX 5700 (Desktop)
Intel Arc A580
...
» With all tested laptops playable in detail settings ultra.
Additional Benchmarks
Low Preset 1920x1080
135 [X] AMD Radeon RX 5700 AMD Ryzen 9 5900X 3.7GHz
Radeon RX 5700 (Desktop)
181 [X] AMD Radeon RX 5700 AMD Ryzen 9 7950X 4.5GHz
Radeon RX 5700 (Desktop)
AMD Radeon RX 5700 (Desktop)
...
...
AMD Radeon RX 5700 (Desktop)
...
...
AMD Radeon RX 5700 (Desktop)
...
...
AMD Radeon RX 5700 (Desktop)
...
0 100 200 300 400 500 600 700 800 900 1000 1100 1200 1300 1400 1500 1600 1700 1800 1900 2000 2100 2200 2300 2400 2500 2600 2700 2800 2900 3000 Tooltip
...
AMD Radeon RX 5700 (Desktop)
...
...
AMD Radeon RX 5700 (Desktop)
...
» With all tested laptops playable in detail settings ultra.
Additional Benchmarks
Low Preset 1920x1080
74.9 [X] AMD Radeon RX 5700 AMD Ryzen 9 5900X 3.7GHz
Radeon RX 5700 (Desktop)
min:
64.6 fps, P0.1:
66 fps, P1:
68.5 fps, max:
88.2 fps
...
AMD Radeon RX 5700 (Desktop)
...
...
AMD Radeon RX 5700 (Desktop)
...
...
AMD Radeon RX 5700 (Desktop)
...
...
AMD Radeon RX 5700 (Desktop)
...
...
AMD Radeon RX 5700 (Desktop)
...
...
AMD Radeon RX 5700 (Desktop)
...
» With all tested laptops playable in detail settings ultra.
Additional Benchmarks
Low Preset 1920x1080
132 [X] AMD Radeon RX 5700 AMD Ryzen 9 5900X 3.7GHz
Radeon RX 5700 (Desktop)
...
Intel Arc A380
AMD Radeon RX 5700 (Desktop)
Intel Arc A580
...
...
AMD Radeon RX 5700 (Desktop)
...
...
AMD Radeon RX 5700 (Desktop)
...
...
AMD Radeon RX 5700 (Desktop)
Intel Arc A580
...
...
AMD Radeon RX 5700 (Desktop)
Intel Arc A580
...
...
AMD Radeon RX 5700 (Desktop)
Intel Arc A580
...
» With all tested laptops playable in detail settings ultra.
Additional Benchmarks
Low Preset 1920x1080
91 [X] AMD Radeon RX 5700 AMD Ryzen 9 5900X 3.7GHz
Radeon RX 5700 (Desktop)
min:
54 fps, max:
137 fps
...
AMD Radeon RX 5700 (Desktop)
...
0 100 Tooltip : Ø159.6 (133.346-196.613)
...
AMD Radeon RX 5700 (Desktop)
...
...
AMD Radeon RX 5700 (Desktop)
...
...
AMD Radeon RX 5700 (Desktop)
...
0 100 200 300 400 500 600 700 800 900 1000 1100 1200 1300 1400 1500 1600 1700 Tooltip
...
AMD Radeon RX 5700 (Desktop)
...
» With all tested laptops playable in detail settings ultra.
Additional Benchmarks
Low Preset (DX12) 1920x1080
264 [X] AMD Radeon RX 5700 AMD Ryzen 9 5900X 3.7GHz
Radeon RX 5700 (Desktop)
min:
22.8 fps, P0.1:
37.1 fps, P1:
138 fps, max:
590 fps
147 [X] AMD Radeon RX 5700 AMD Ryzen 9 5900X 3.7GHz
Radeon RX 5700 (Desktop)
min:
118 fps, max:
200 fps
211 [X] AMD Radeon RX 5700 AMD Ryzen 9 7900X 4.7GHz
Radeon RX 5700 (Desktop)
min:
165 fps, max:
245 fps
226 [X] AMD Radeon RX 5700 AMD Ryzen 9 7950X 4.5GHz
Radeon RX 5700 (Desktop)
min:
190 fps, max:
263 fps
~ 195 fps
+ Compare
- Hide Comparison
+ 📈 Graph
- 📈 Hide Graph
0 100 200 Tooltip : Ø211 (165-245)
: Ø226 (190-263)
...
Intel Arc A580
AMD Radeon RX 5700 (Desktop)
...
122 [X] AMD Radeon RX 5700 AMD Ryzen 9 5900X 3.7GHz
Radeon RX 5700 (Desktop)
min:
73 fps, max:
142 fps
134.6 [X] AMD Radeon RX 5700 AMD Ryzen 9 7900X 4.7GHz
Radeon RX 5700 (Desktop)
min:
121 fps, max:
147 fps
135.8 [X] AMD Radeon RX 5700 AMD Ryzen 9 7950X 4.5GHz
Radeon RX 5700 (Desktop)
min:
122 fps, max:
149 fps
~ 131 fps
+ Compare
- Hide Comparison
+ 📈 Graph
- 📈 Hide Graph
0 100 Tooltip : Ø134.6 (121-147)
: Ø135.8 (122-149)
...
Intel Arc A580
AMD Radeon RX 5700 (Desktop)
...
107 [X] AMD Radeon RX 5700 AMD Ryzen 9 5900X 3.7GHz
Radeon RX 5700 (Desktop)
min:
60 fps, max:
121 fps
115.8 [X] AMD Radeon RX 5700 AMD Ryzen 9 7900X 4.7GHz
Radeon RX 5700 (Desktop)
min:
102 fps, max:
125 fps
116.8 [X] AMD Radeon RX 5700 AMD Ryzen 9 7950X 4.5GHz
Radeon RX 5700 (Desktop)
min:
104 fps, max:
125 fps
~ 113 fps
+ Compare
- Hide Comparison
+ 📈 Graph
- 📈 Hide Graph
0 100 Tooltip : Ø115.8 (102-125)
: Ø116.8 (104-125)
...
AMD Radeon RX 5700 (Desktop)
...
92.4 [X] AMD Radeon RX 5700 AMD Ryzen 9 7900X 4.7GHz
Radeon RX 5700 (Desktop)
min:
84 fps, max:
101 fps
96 [X] AMD Radeon RX 5700 AMD Ryzen 9 5900X 3.7GHz
Radeon RX 5700 (Desktop)
min:
54 fps, max:
107 fps
98.3 [X] AMD Radeon RX 5700 AMD Ryzen 9 7950X 4.5GHz
Radeon RX 5700 (Desktop)
min:
76 fps, max:
107 fps
~ 96 fps
+ Compare
- Hide Comparison
+ 📈 Graph
- 📈 Hide Graph
0 100 Tooltip : Ø92.4 (84-101)
: Ø98.3 (76-107)
...
AMD Radeon RX 5700 (Desktop)
...
65 [X] AMD Radeon RX 5700 AMD Ryzen 9 5900X 3.7GHz
Radeon RX 5700 (Desktop)
min:
43 fps, max:
73 fps
65.5 [X] AMD Radeon RX 5700 AMD Ryzen 9 7950X 4.5GHz
Radeon RX 5700 (Desktop)
min:
54 fps, max:
71 fps
66.7 [X] AMD Radeon RX 5700 AMD Ryzen 9 7900X 4.7GHz
Radeon RX 5700 (Desktop)
min:
62 fps, max:
72 fps
~ 66 fps
+ Compare
- Hide Comparison
+ 📈 Graph
- 📈 Hide Graph
0 Tooltip : Ø65.5 (54-71)
: Ø66.7 (62-72)
...
Intel Arc A580
AMD Radeon RX 5700 (Desktop)
...
14 [X] AMD Radeon RX 5700 AMD Ryzen 9 7900X 4.7GHz
Radeon RX 5700 (Desktop)
min:
10 fps, max:
16 fps
19 [X] AMD Radeon RX 5700 AMD Ryzen 9 5900X 3.7GHz
Radeon RX 5700 (Desktop)
min:
12 fps, max:
21 fps
24.5 [X] AMD Radeon RX 5700 AMD Ryzen 9 7950X 4.5GHz
Radeon RX 5700 (Desktop)
min:
19 fps, max:
27 fps
~ 19 fps
+ Compare
- Hide Comparison
+ 📈 Graph
- 📈 Hide Graph
0 Tooltip : Ø14 (10-16)
: Ø24.5 (19-27)
...
AMD Radeon RX 5700 (Desktop)
Intel Arc A580
...
» With all tested laptops playable in detail settings ultra.
Additional Benchmarks
Low Graphics Quality 1920x1080
139 [X] AMD Radeon RX 5700 AMD Ryzen 9 5900X 3.7GHz
Radeon RX 5700 (Desktop)
min:
115 fps, max:
167 fps
160.9 [X] AMD Radeon RX 5700 AMD Ryzen 9 7950X 4.5GHz
Radeon RX 5700 (Desktop)
min:
144 fps, max:
178 fps
0 100 200 Tooltip : Ø103.9 (89.067-200.941)
...
AMD Radeon RX 5700 (Desktop)
...
...
AMD Radeon RX 5700 (Desktop)
...
...
AMD Radeon RX 5700 (Desktop)
...
...
AMD Radeon RX 5700 (Desktop)
...
» With all tested laptops playable in detail settings high.
Additional Benchmarks
Low Preset 1920x1080
104 [X] AMD Radeon RX 5700 AMD Ryzen 9 5900X 3.7GHz
Radeon RX 5700 (Desktop)
min:
13.1 fps, P0.1:
28.8 fps, P1:
80.6 fps, max:
229 fps
...
AMD Radeon RX 5700 (Desktop)
...
...
AMD Radeon RX 5700 (Desktop)
...
...
AMD Radeon RX 5700 (Desktop)
...
...
AMD Radeon RX 5700 (Desktop)
...
...
AMD Radeon RX 5700 (Desktop)
...
...
AMD Radeon RX 5700 (Desktop)
...
» With all tested laptops playable in detail settings ultra.
Additional Benchmarks
Low Video Quality 1920x1080
119 [X] AMD Radeon RX 5700 AMD Ryzen 9 5900X 3.7GHz
Radeon RX 5700 (Desktop)
min:
36.1 fps, P0.1:
61.6 fps, P1:
85.9 fps, max:
199 fps
...
AMD Radeon RX 5700 (Desktop)
...
AMD Radeon RX 5700 (Desktop)
...
...
AMD Radeon RX 5700 (Desktop)
...
...
AMD Radeon RX 5700 (Desktop)
...
...
AMD Radeon RX 5700 (Desktop)
...
...
AMD Radeon RX 5700 (Desktop)
...
» With all tested laptops playable in detail settings ultra.
Additional Benchmarks
Low Preset 1920x1080
124 [X] AMD Radeon RX 5700 AMD Ryzen 9 5900X 3.7GHz
Radeon RX 5700 (Desktop)
min:
36 fps, P0.1:
79 fps, P1:
98.4 fps, max:
170 fps
460 [X] AMD Radeon RX 5700 824817
AMD Ryzen 9 5900X 3.7GHz
Radeon RX 5700 (Desktop)
min:
317 fps, P1:
282 fps, max:
516 fps
576 [X] AMD Radeon RX 5700 874931
AMD Ryzen 9 7900X 4.7GHz
Radeon RX 5700 (Desktop)
min:
424 fps, P1:
353 fps, max:
683 fps
581 [X] AMD Radeon RX 5700 874931
AMD Ryzen 9 7950X 4.5GHz
Radeon RX 5700 (Desktop)
min:
449 fps, P1:
372 fps, max:
675 fps
~ 539 fps
+ Compare
- Hide Comparison
...
Intel Arc A580
AMD Radeon RX 5700 (Desktop)
...
292 [X] AMD Radeon RX 5700 824817
AMD Ryzen 9 5900X 3.7GHz
Radeon RX 5700 (Desktop)
min:
246 fps, P1:
220 fps, max:
341 fps
305 [X] AMD Radeon RX 5700 874931
AMD Ryzen 9 7950X 4.5GHz
Radeon RX 5700 (Desktop)
min:
252 fps, P1:
235 fps, max:
364 fps
306 [X] AMD Radeon RX 5700 874931
AMD Ryzen 9 7900X 4.7GHz
Radeon RX 5700 (Desktop)
min:
257 fps, P1:
238 fps, max:
366 fps
~ 301 fps
+ Compare
- Hide Comparison
...
Intel Arc A580
AMD Radeon RX 5700 (Desktop)
...
235 [X] AMD Radeon RX 5700 824817
AMD Ryzen 9 5900X 3.7GHz
Radeon RX 5700 (Desktop)
min:
196 fps, P1:
194 fps, max:
264 fps
239 [X] AMD Radeon RX 5700 874931
AMD Ryzen 9 7950X 4.5GHz
Radeon RX 5700 (Desktop)
min:
202 fps, P1:
197 fps, max:
268 fps
241 [X] AMD Radeon RX 5700 874931
AMD Ryzen 9 7900X 4.7GHz
Radeon RX 5700 (Desktop)
min:
203 fps, P1:
200 fps, max:
276 fps
~ 238 fps
+ Compare
- Hide Comparison
...
Intel Arc A580
AMD Radeon RX 5700 (Desktop)
...
152 [X] AMD Radeon RX 5700 824817
AMD Ryzen 9 5900X 3.7GHz
Radeon RX 5700 (Desktop)
min:
125 fps, P1:
125 fps, max:
172 fps
155.3 [X] AMD Radeon RX 5700 874931
AMD Ryzen 9 7950X 4.5GHz
Radeon RX 5700 (Desktop)
min:
127 fps, P1:
127 fps, max:
176 fps
156.8 [X] AMD Radeon RX 5700 874931
AMD Ryzen 9 7900X 4.7GHz
Radeon RX 5700 (Desktop)
min:
128 fps, P1:
128 fps, max:
180 fps
~ 155 fps
+ Compare
- Hide Comparison
...
AMD Radeon RX 5700 (Desktop)
...
114 [X] AMD Radeon RX 5700 824817
AMD Ryzen 9 5900X 3.7GHz
Radeon RX 5700 (Desktop)
min:
94 fps, P1:
94 fps, max:
129 fps
116.5 [X] AMD Radeon RX 5700 874931
AMD Ryzen 9 7950X 4.5GHz
Radeon RX 5700 (Desktop)
min:
97 fps, P1:
96 fps, max:
132 fps
117 [X] AMD Radeon RX 5700 874931
AMD Ryzen 9 7900X 4.7GHz
Radeon RX 5700 (Desktop)
min:
97 fps, P1:
97 fps, max:
132 fps
~ 116 fps
+ Compare
- Hide Comparison
...
AMD Radeon RX 5700 (Desktop)
...
66.1 [X] AMD Radeon RX 5700 824817
AMD Ryzen 9 5900X 3.7GHz
Radeon RX 5700 (Desktop)
min:
55 fps, P1:
55 fps, max:
75 fps
67.2 [X] AMD Radeon RX 5700 874931
AMD Ryzen 9 7950X 4.5GHz
Radeon RX 5700 (Desktop)
min:
55 fps, P1:
56 fps, max:
76 fps
67.4 [X] AMD Radeon RX 5700 874931
AMD Ryzen 9 7900X 4.7GHz
Radeon RX 5700 (Desktop)
min:
56 fps, P1:
56 fps, max:
76 fps
~ 67 fps
+ Compare
- Hide Comparison
...
AMD Radeon RX 5700 (Desktop)
...
» With all tested laptops playable in detail settings ultra.
0 100 200 300 400 500 600 700 800 900 Tooltip
...
AMD Radeon RX 5700 (Desktop)
...
...
AMD Radeon RX 5700 (Desktop)
...
...
AMD Radeon RX 5700 (Desktop)
...
0 100 Tooltip : Ø145.5 (143.008-152.98)
...
AMD Radeon RX 5700 (Desktop)
...
...
AMD Radeon RX 5700 (Desktop)
...
» With all tested laptops playable in detail settings high.
Additional Benchmarks
Low Preset 1920x1080
144 [X] AMD Radeon RX 5700 AMD Ryzen 9 5900X 3.7GHz
Radeon RX 5700 (Desktop)
min:
33.8 fps, P0.1:
102 fps, P1:
109 fps, max:
196 fps
0 100 200 300 400 500 600 700 800 900 1000 1100 1200 1300 1400 1500 1600 1700 1800 1900 2000 Tooltip
...
AMD Radeon RX 5700 (Desktop)
...
...
AMD Radeon RX 5700 (Desktop)
...
...
AMD Radeon RX 5700 (Desktop)
...
...
AMD Radeon RX 5700 (Desktop)
...
...
AMD Radeon RX 5700 (Desktop)
...
...
AMD Radeon RX 5700 (Desktop)
...
» With all tested laptops playable in detail settings ultra.
Additional Benchmarks
Low Preset 1920x1080
151 [X] AMD Radeon RX 5700 AMD Ryzen 9 5900X 3.7GHz
Radeon RX 5700 (Desktop)
min:
20.5 fps, P0.1:
42.9 fps, P1:
73 fps, max:
297 fps
0 100 200 300 400 500 600 700 800 Tooltip
...
AMD Radeon RX 5700 (Desktop)
...
...
AMD Radeon RX 5700 (Desktop)
...
...
AMD Radeon RX 5700 (Desktop)
...
...
AMD Radeon RX 5700 (Desktop)
...
» With all tested laptops playable in detail settings ultra.
...
AMD Radeon RX 5700 (Desktop)
...
AMD Radeon RX 5700 (Desktop)
...
0 100 200 300 400 500 600 Tooltip
...
AMD Radeon RX 5700 (Desktop)
...
...
AMD Radeon RX 5700 (Desktop)
...
...
AMD Radeon RX 5700 (Desktop)
...
...
AMD Radeon RX 5700 (Desktop)
...
» With all tested laptops playable in detail settings ultra.
Additional Benchmarks
Prioritize Performance Preset 1920x1080
235 [X] AMD Radeon RX 5700 AMD Ryzen 9 5900X 3.7GHz
Radeon RX 5700 (Desktop)
min:
2.85 fps, P0.1:
139 fps, P1:
178 fps, max:
330 fps
0 100 200 Tooltip : Ø154.1 (113.92-219.255)
...
AMD Radeon RX 5700 (Desktop)
0 100 Tooltip : Ø148.5 (115.421-186.182)
...
AMD Radeon RX 5700 (Desktop)
...
AMD Radeon RX 5700 (Desktop)
...
...
AMD Radeon RX 5700 (Desktop)
...
...
AMD Radeon RX 5700 (Desktop)
...
...
AMD Radeon RX 5700 (Desktop)
...
» With all tested laptops playable in detail settings ultra.
Additional Benchmarks
Low Preset 1920x1080
177 [X] AMD Radeon RX 5700 AMD Ryzen 9 5900X 3.7GHz
Radeon RX 5700 (Desktop)
min:
45.6 fps, P0.1:
61.1 fps, P1:
87.5 fps, max:
411 fps
...
AMD Radeon RX 5700 (Desktop)
...
AMD Radeon RX 5700 (Desktop)
...
...
AMD Radeon RX 5700 (Desktop)
...
...
AMD Radeon RX 5700 (Desktop)
...
...
AMD Radeon RX 5700 (Desktop)
...
...
AMD Radeon RX 5700 (Desktop)
...
» With all tested laptops playable in detail settings ultra.
...
AMD Radeon RX 5700 (Desktop)
...
AMD Radeon RX 5700 (Desktop)
...
...
AMD Radeon RX 5700 (Desktop)
...
0 100 200 300 400 500 600 700 800 900 1000 1100 Tooltip
...
AMD Radeon RX 5700 (Desktop)
...
...
AMD Radeon RX 5700 (Desktop)
...
...
AMD Radeon RX 5700 (Desktop)
...
» With all tested laptops playable in detail settings ultra.
Additional Benchmarks
Low Preset 1920x1080
91.2 [X] AMD Radeon RX 5700 AMD Ryzen 9 5900X 3.7GHz
Radeon RX 5700 (Desktop)
min:
18.8 fps, P0.1:
36.2 fps, P1:
65.5 fps, max:
221 fps
...
AMD Radeon RX 5700 (Desktop)
...
...
AMD Radeon RX 5700 (Desktop)
...
...
AMD Radeon RX 5700 (Desktop)
...
...
AMD Radeon RX 5700 (Desktop)
...
...
AMD Radeon RX 5700 (Desktop)
...
...
AMD Radeon RX 5700 (Desktop)
...
» With all tested laptops playable in detail settings ultra.
...
AMD Radeon RX 5700 (Desktop)
...
...
AMD Radeon RX 5700 (Desktop)
...
...
AMD Radeon RX 5700 (Desktop)
...
...
AMD Radeon RX 5700 (Desktop)
...
...
AMD Radeon RX 5700 (Desktop)
...
...
AMD Radeon RX 5700 (Desktop)
...
» With all tested laptops playable in detail settings ultra.
...
AMD Radeon RX 5700 (Desktop)
...
...
AMD Radeon RX 5700 (Desktop)
...
...
AMD Radeon RX 5700 (Desktop)
...
...
AMD Radeon RX 5700 (Desktop)
...
...
AMD Radeon RX 5700 (Desktop)
...
...
AMD Radeon RX 5700 (Desktop)
...
» With all tested laptops playable in detail settings ultra.
...
AMD Radeon RX 5700 (Desktop)
...
...
AMD Radeon RX 5700 (Desktop)
...
...
AMD Radeon RX 5700 (Desktop)
...
...
AMD Radeon RX 5700 (Desktop)
...
...
Intel Arc A580
AMD Radeon RX 5700 (Desktop)
...
...
Intel Arc A580
AMD Radeon RX 5700 (Desktop)
...
» With all tested laptops playable in detail settings ultra.
162 [X] AMD Radeon RX 5700 AMD Ryzen 9 5900X 3.7GHz
Radeon RX 5700 (Desktop)
min:
47.4 fps, P0.1:
128 fps, P1:
140.4 fps, max:
195.5 fps
fps
+ Compare
- Hide Comparison
...
AMD Radeon RX 5700 (Desktop)
...
102 [X] AMD Radeon RX 5700 AMD Ryzen 9 5900X 3.7GHz
Radeon RX 5700 (Desktop)
min:
39.2 fps, P0.1:
71.9 fps, P1:
86.8 fps, max:
121.2 fps
fps
+ Compare
- Hide Comparison
...
AMD Radeon RX 5700 (Desktop)
...
83.4 [X] AMD Radeon RX 5700 AMD Ryzen 9 5900X 3.7GHz
Radeon RX 5700 (Desktop)
min:
42.2 fps, P0.1:
57.1 fps, P1:
72.4 fps, max:
97.5 fps
fps
+ Compare
- Hide Comparison
...
AMD Radeon RX 5700 (Desktop)
...
73.1 [X] AMD Radeon RX 5700 AMD Ryzen 9 5900X 3.7GHz
Radeon RX 5700 (Desktop)
min:
35.5 fps, P0.1:
53.7 fps, P1:
62.7 fps, max:
89.3 fps
fps
+ Compare
- Hide Comparison
...
AMD Radeon RX 5700 (Desktop)
...
59.6 [X] AMD Radeon RX 5700 AMD Ryzen 9 5900X 3.7GHz
Radeon RX 5700 (Desktop)
min:
40.2 fps, P0.1:
44.6 fps, P1:
51.9 fps, max:
70.3 fps
fps
+ Compare
- Hide Comparison
...
AMD Radeon RX 5700 (Desktop)
...
...
AMD Radeon RX 5700 (Desktop)
...
» With all tested laptops playable in detail settings ultra.
...
AMD Radeon RX 5700 (Desktop)
...
...
AMD Radeon RX 5700 (Desktop)
...
...
AMD Radeon RX 5700 (Desktop)
...
...
AMD Radeon RX 5700 (Desktop)
Intel Arc A580
...
...
AMD Radeon RX 5700 (Desktop)
...
AMD Radeon RX 5700 (Desktop)
...
» With all tested laptops playable in detail settings ultra.
...
AMD Radeon RX 5700 (Desktop)
...
...
AMD Radeon RX 5700 (Desktop)
...
AMD Radeon RX 5700 (Desktop)
...
...
AMD Radeon RX 5700 (Desktop)
...
AMD Radeon RX 5700 (Desktop)
...
AMD Radeon RX 5700 (Desktop)
...
» With all tested laptops playable in detail settings ultra.
...
AMD Radeon RX 5700 (Desktop)
...
AMD Radeon RX 5700 (Desktop)
...
...
AMD Radeon RX 5700 (Desktop)
...
...
AMD Radeon RX 5700 (Desktop)
...
...
AMD Radeon RX 5700 (Desktop)
...
...
AMD Radeon RX 5700 (Desktop)
...
» With all tested laptops playable in detail settings ultra.
...
AMD Radeon RX 5700 (Desktop)
...
...
AMD Radeon RX 5700 (Desktop)
...
...
AMD Radeon RX 5700 (Desktop)
...
...
AMD Radeon RX 5700 (Desktop)
...
...
AMD Radeon RX 5700 (Desktop)
...
» With all tested laptops playable in detail settings high.
...
AMD Radeon RX 5700 (Desktop)
...
...
AMD Radeon RX 5700 (Desktop)
...
...
AMD Radeon RX 5700 (Desktop)
...
...
AMD Radeon RX 5700 (Desktop)
...
...
AMD Radeon RX 5700 (Desktop)
...
...
AMD Radeon RX 5700 (Desktop)
...
» With all tested laptops playable in detail settings ultra.
...
AMD Radeon RX 5700 (Desktop)
...
...
AMD Radeon RX 5700 (Desktop)
...
0 100 200 300 400 500 600 700 Tooltip
...
AMD Radeon RX 5700 (Desktop)
...
...
AMD Radeon RX 5700 (Desktop)
...
0 100 200 300 400 500 600 700 800 900 1000 1100 1200 1300 1400 1500 1600 1700 1800 1900 2000 2100 2200 2300 2400 2500 2600 2700 2800 2900 3000 3100 3200 3300 3400 3500 3600 3700 3800 3900 4000 4100 4200 4300 4400 4500 4600 4700 4800 4900 5000 5100 5200 5300 5400 5500 5600 5700 5800 5900 6000 6100 6200 6300 6400 6500 6600 6700 6800 6900 7000 7100 7200 7300 7400 7500 7600 7700 7800 7900 8000 8100 8200 8300 8400 8500 8600 8700 8800 8900 9000 9100 9200 9300 9400 9500 9600 9700 9800 9900 Tooltip
...
AMD Radeon RX 5700 (Desktop)
...
...
AMD Radeon RX 5700 (Desktop)
...
» With all tested laptops playable in detail settings ultra.
...
AMD Radeon RX 5700 (Desktop)
...
...
AMD Radeon RX 5700 (Desktop)
...
...
AMD Radeon RX 5700 (Desktop)
...
...
AMD Radeon RX 5700 (Desktop)
...
...
AMD Radeon RX 5700 (Desktop)
...
...
AMD Radeon RX 5700 (Desktop)
...
» With all tested laptops playable in detail settings high.
...
AMD Radeon RX 5700 (Desktop)
...
...
AMD Radeon RX 5700 (Desktop)
...
...
Intel Arc A580
AMD Radeon RX 5700 (Desktop)
...
...
AMD Radeon RX 5700 (Desktop)
Intel Arc A580
...
...
AMD Radeon RX 5700 (Desktop)
Intel Arc A580
...
...
AMD Radeon RX 5700 (Desktop)
Intel Arc A580
...
» With all tested laptops playable in detail settings ultra.
...
AMD Radeon RX 5700 (Desktop)
...
...
AMD Radeon RX 5700 (Desktop)
...
...
Intel Arc A580
AMD Radeon RX 5700 (Desktop)
...
...
Intel Arc A580
AMD Radeon RX 5700 (Desktop)
...
...
AMD Radeon RX 5700 (Desktop)
Intel Arc A580
...
...
AMD Radeon RX 5700 (Desktop)
Intel Arc A580
...
» With all tested laptops playable in detail settings ultra.
341 [X] AMD Radeon RX 5700 675864
AMD Ryzen 9 3900X 3.8GHz
Radeon RX 5700 (Desktop)
min:
274 fps, max:
377 fps
350 [X] AMD Radeon RX 5700 759689
AMD Ryzen 9 7900X 4.7GHz
Radeon RX 5700 (Desktop)
min:
285 fps, max:
405 fps
355 [X] AMD Radeon RX 5700 759689
AMD Ryzen 9 7950X 4.5GHz
Radeon RX 5700 (Desktop)
min:
292 fps, max:
421 fps
~ 349 fps
+ Compare
- Hide Comparison
...
AMD Radeon RX 5700 (Desktop)
...
217 [X] AMD Radeon RX 5700 759689
AMD Ryzen 9 7900X 4.7GHz
Radeon RX 5700 (Desktop)
min:
180 fps, max:
249 fps
220 [X] AMD Radeon RX 5700 759689
AMD Ryzen 9 7950X 4.5GHz
Radeon RX 5700 (Desktop)
min:
182 fps, max:
255 fps
252 [X] AMD Radeon RX 5700 675864
AMD Ryzen 9 3900X 3.8GHz
Radeon RX 5700 (Desktop)
min:
222 fps, max:
286 fps
~ 230 fps
+ Compare
- Hide Comparison
...
AMD Radeon RX 5700 (Desktop)
...
176.1 [X] AMD Radeon RX 5700 759689
AMD Ryzen 9 7900X 4.7GHz
Radeon RX 5700 (Desktop)
min:
145 fps, max:
205 fps
177.5 [X] AMD Radeon RX 5700 759689
AMD Ryzen 9 7950X 4.5GHz
Radeon RX 5700 (Desktop)
min:
148 fps, max:
206 fps
209 [X] AMD Radeon RX 5700 675864
AMD Ryzen 9 3900X 3.8GHz
Radeon RX 5700 (Desktop)
min:
170 fps, max:
238 fps
~ 188 fps
+ Compare
- Hide Comparison
...
AMD Radeon RX 5700 (Desktop)
...
117.7 [X] AMD Radeon RX 5700 759689
AMD Ryzen 9 7900X 4.7GHz
Radeon RX 5700 (Desktop)
min:
88 fps, max:
145 fps
119.4 [X] AMD Radeon RX 5700 759689
AMD Ryzen 9 7950X 4.5GHz
Radeon RX 5700 (Desktop)
min:
90 fps, max:
146 fps
143 [X] AMD Radeon RX 5700 675864
AMD Ryzen 9 3900X 3.8GHz
Radeon RX 5700 (Desktop)
min:
106 fps, max:
175 fps
~ 127 fps
+ Compare
- Hide Comparison
...
AMD Radeon RX 5700 (Desktop)
...
91.8 [X] AMD Radeon RX 5700 759689
AMD Ryzen 9 7900X 4.7GHz
Radeon RX 5700 (Desktop)
min:
70 fps, max:
111 fps
93.2 [X] AMD Radeon RX 5700 759689
AMD Ryzen 9 7950X 4.5GHz
Radeon RX 5700 (Desktop)
min:
72 fps, max:
113 fps
106 [X] AMD Radeon RX 5700 675864
AMD Ryzen 9 3900X 3.8GHz
Radeon RX 5700 (Desktop)
min:
83 fps, max:
125 fps
~ 97 fps
+ Compare
- Hide Comparison
...
AMD Radeon RX 5700 (Desktop)
...
54.7 [X] AMD Radeon RX 5700 759689
AMD Ryzen 9 7900X 4.7GHz
Radeon RX 5700 (Desktop)
min:
44 fps, max:
66 fps
55.2 [X] AMD Radeon RX 5700 759689
AMD Ryzen 9 7950X 4.5GHz
Radeon RX 5700 (Desktop)
min:
44 fps, max:
66 fps
60 [X] AMD Radeon RX 5700 675864
AMD Ryzen 9 3900X 3.8GHz
Radeon RX 5700 (Desktop)
min:
49 fps, max:
70 fps
~ 57 fps
+ Compare
- Hide Comparison
...
AMD Radeon RX 5700 (Desktop)
...
» With all tested laptops playable in detail settings ultra.
...
AMD Radeon RX 5700 (Desktop)
...
...
AMD Radeon RX 5700 (Desktop)
...
AMD Radeon RX 5700 (Desktop)
...
AMD Radeon RX 5700 (Desktop)
...
AMD Radeon RX 5700 (Desktop)
...
» With all tested laptops playable in detail settings high.
...
AMD Radeon RX 5700 (Desktop)
...
AMD Radeon RX 5700 (Desktop)
...
...
AMD Radeon RX 5700 (Desktop)
...
...
AMD Radeon RX 5700 (Desktop)
...
...
AMD Radeon RX 5700 (Desktop)
...
...
AMD Radeon RX 5700 (Desktop)
...
» With all tested laptops playable in detail settings ultra.
...
AMD Radeon RX 5700 (Desktop)
...
...
AMD Radeon RX 5700 (Desktop)
...
...
AMD Radeon RX 5700 (Desktop)
...
...
AMD Radeon RX 5700 (Desktop)
...
...
AMD Radeon RX 5700 (Desktop)
...
...
AMD Radeon RX 5700 (Desktop)
...
» With all tested laptops playable in detail settings ultra.
...
AMD Radeon RX 5700 (Desktop)
...
...
AMD Radeon RX 5700 (Desktop)
...
...
AMD Radeon RX 5700 (Desktop)
...
...
AMD Radeon RX 5700 (Desktop)
...
...
AMD Radeon RX 5700 (Desktop)
...
» With all tested laptops playable in detail settings high.
...
AMD Radeon RX 5700 (Desktop)
...
AMD Radeon RX 5700 (Desktop)
...
...
AMD Radeon RX 5700 (Desktop)
...
AMD Radeon RX 5700 (Desktop)
...
...
AMD Radeon RX 5700 (Desktop)
...
...
AMD Radeon RX 5700 (Desktop)
...
» With all tested laptops playable in detail settings ultra.
...
AMD Radeon RX 5700 (Desktop)
...
...
AMD Radeon RX 5700 (Desktop)
...
...
AMD Radeon RX 5700 (Desktop)
...
...
AMD Radeon RX 5700 (Desktop)
...
...
AMD Radeon RX 5700 (Desktop)
...
...
AMD Radeon RX 5700 (Desktop)
...
» With all tested laptops playable in detail settings ultra.
...
AMD Radeon RX 5700 (Desktop)
...
...
AMD Radeon RX 5700 (Desktop)
...
...
AMD Radeon RX 5700 (Desktop)
...
...
AMD Radeon RX 5700 (Desktop)
...
...
AMD Radeon RX 5700 (Desktop)
...
» With all tested laptops playable in detail settings ultra.
...
AMD Radeon RX 5700 (Desktop)
...
...
AMD Radeon RX 5700 (Desktop)
...
AMD Radeon RX 5700 (Desktop)
...
...
AMD Radeon RX 5700 (Desktop)
...
...
AMD Radeon RX 5700 (Desktop)
...
...
AMD Radeon RX 5700 (Desktop)
...
» With all tested laptops playable in detail settings ultra.
...
AMD Radeon RX 5700 (Desktop)
...
...
AMD Radeon RX 5700 (Desktop)
...
...
AMD Radeon RX 5700 (Desktop)
...
...
AMD Radeon RX 5700 (Desktop)
...
...
AMD Radeon RX 5700 (Desktop)
...
...
AMD Radeon RX 5700 (Desktop)
...
» With all tested laptops playable in detail settings ultra.
...
AMD Radeon RX 5700 (Desktop)
...
...
AMD Radeon RX 5700 (Desktop)
...
...
AMD Radeon RX 5700 (Desktop)
...
AMD Radeon RX 5700 (Desktop)
...
...
AMD Radeon RX 5700 (Desktop)
...
...
AMD Radeon RX 5700 (Desktop)
...
» With all tested laptops playable in detail settings ultra.
...
AMD Radeon RX 5700 (Desktop)
...
...
AMD Radeon RX 5700 (Desktop)
...
...
AMD Radeon RX 5700 (Desktop)
...
...
AMD Radeon RX 5700 (Desktop)
...
...
AMD Radeon RX 5700 (Desktop)
...
...
AMD Radeon RX 5700 (Desktop)
...
» With all tested laptops playable in detail settings ultra.
...
AMD Radeon RX 5700 (Desktop)
...
AMD Radeon RX 5700 (Desktop)
...
AMD Radeon RX 5700 (Desktop)
...
AMD Radeon RX 5700 (Desktop)
...
AMD Radeon RX 5700 (Desktop)
...
AMD Radeon RX 5700 (Desktop)
...
» With all tested laptops playable in detail settings ultra.
138.7 [X] AMD Radeon RX 5700 AMD Ryzen 9 3900X 3.8GHz
Radeon RX 5700 (Desktop)
198.2 [X] AMD Radeon RX 5700 AMD Ryzen 9 7900X 4.7GHz
Radeon RX 5700 (Desktop)
218 [X] AMD Radeon RX 5700 AMD Ryzen 9 7950X 4.5GHz
Radeon RX 5700 (Desktop)
~ 185 fps
+ Compare
- Hide Comparison
...
AMD Radeon RX 5700 (Desktop)
...
119.5 [X] AMD Radeon RX 5700 AMD Ryzen 9 3900X 3.8GHz
Radeon RX 5700 (Desktop)
146.6 [X] AMD Radeon RX 5700 AMD Ryzen 9 7900X 4.7GHz
Radeon RX 5700 (Desktop)
146.9 [X] AMD Radeon RX 5700 AMD Ryzen 9 7950X 4.5GHz
Radeon RX 5700 (Desktop)
~ 138 fps
+ Compare
- Hide Comparison
...
AMD Radeon RX 5700 (Desktop)
...
84.7 [X] AMD Radeon RX 5700 AMD Ryzen 9 3900X 3.8GHz
Radeon RX 5700 (Desktop)
94.7 [X] AMD Radeon RX 5700 AMD Ryzen 9 7950X 4.5GHz
Radeon RX 5700 (Desktop)
95.5 [X] AMD Radeon RX 5700 AMD Ryzen 9 7900X 4.7GHz
Radeon RX 5700 (Desktop)
~ 92 fps
+ Compare
- Hide Comparison
...
AMD Radeon RX 5700 (Desktop)
Intel Arc A580
...
66.7 [X] AMD Radeon RX 5700 AMD Ryzen 9 3900X 3.8GHz
Radeon RX 5700 (Desktop)
69.9 [X] AMD Radeon RX 5700 AMD Ryzen 9 7950X 4.5GHz
Radeon RX 5700 (Desktop)
70.1 [X] AMD Radeon RX 5700 AMD Ryzen 9 7900X 4.7GHz
Radeon RX 5700 (Desktop)
~ 69 fps
+ Compare
- Hide Comparison
...
AMD Radeon RX 5700 (Desktop)
Intel Arc A580
...
45.3 [X] AMD Radeon RX 5700 AMD Ryzen 9 3900X 3.8GHz
Radeon RX 5700 (Desktop)
49.2 [X] AMD Radeon RX 5700 AMD Ryzen 9 7950X 4.5GHz
Radeon RX 5700 (Desktop)
49.5 [X] AMD Radeon RX 5700 AMD Ryzen 9 7900X 4.7GHz
Radeon RX 5700 (Desktop)
~ 48 fps
+ Compare
- Hide Comparison
...
AMD Radeon RX 5700 (Desktop)
Intel Arc A580
...
24.7 [X] AMD Radeon RX 5700 AMD Ryzen 9 3900X 3.8GHz
Radeon RX 5700 (Desktop)
26.5 [X] AMD Radeon RX 5700 AMD Ryzen 9 7950X 4.5GHz
Radeon RX 5700 (Desktop)
26.7 [X] AMD Radeon RX 5700 AMD Ryzen 9 7900X 4.7GHz
Radeon RX 5700 (Desktop)
~ 26 fps
+ Compare
- Hide Comparison
...
AMD Radeon RX 5700 (Desktop)
Intel Arc A580
...
» With all tested laptops playable in detail settings ultra.
Additional Benchmarks
Very Low Overall Quality (DX11) 1920x1080
201 [X] AMD Radeon RX 5700 AMD Ryzen 9 7950X 4.5GHz
Radeon RX 5700 (Desktop)
...
AMD Radeon RX 5700 (Desktop)
...
...
Intel Arc A580
AMD Radeon RX 5700 (Desktop)
...
...
AMD Radeon RX 5700 (Desktop)
Intel Arc A580
...
...
AMD Radeon RX 5700 (Desktop)
Intel Arc A580
...
...
AMD Radeon RX 5700 (Desktop)
Intel Arc A580
...
» With all tested laptops playable in detail settings high.
...
AMD Radeon RX 5700 (Desktop)
...
...
AMD Radeon RX 5700 (Desktop)
...
...
AMD Radeon RX 5700 (Desktop)
...
...
AMD Radeon RX 5700 (Desktop)
...
...
AMD Radeon RX 5700 (Desktop)
...
...
AMD Radeon RX 5700 (Desktop)
...
» With all tested laptops playable in detail settings ultra.
...
AMD Radeon RX 5700 (Desktop)
...
...
AMD Radeon RX 5700 (Desktop)
...
...
AMD Radeon RX 5700 (Desktop)
Intel Arc A580
...
...
Intel Arc A580
AMD Radeon RX 5700 (Desktop)
...
...
AMD Radeon RX 5700 (Desktop)
Intel Arc A580
...
...
AMD Radeon RX 5700 (Desktop)
Intel Arc A580
...
» With all tested laptops playable in detail settings ultra.
...
AMD Radeon RX 5700 (Desktop)
...
...
AMD Radeon RX 5700 (Desktop)
...
...
AMD Radeon RX 5700 (Desktop)
...
...
AMD Radeon RX 5700 (Desktop)
...
» With all tested laptops playable in detail settings med..
...
AMD Radeon RX 5700 (Desktop)
...
Intel Arc A580
...
AMD Radeon RX 5700 (Desktop)
...
...
AMD Radeon RX 5700 (Desktop)
...
...
AMD Radeon RX 5700 (Desktop)
...
...
AMD Radeon RX 5700 (Desktop)
...
...
AMD Radeon RX 5700 (Desktop)
...
» With all tested laptops playable in detail settings ultra.
0 100 200 300 400 500 600 700 Tooltip
...
Intel Arc A380
AMD Radeon RX 5700 (Desktop)
...
0 100 200 300 400 500 600 700 800 Tooltip
...
AMD Radeon RX 5700 (Desktop)
Intel Arc A580
...
0 100 200 300 400 500 600 700 800 900 1000 1100 1200 1300 Tooltip
...
AMD Radeon RX 5700 (Desktop)
Intel Arc A580
...
0 100 200 300 400 500 600 Tooltip
...
AMD Radeon RX 5700 (Desktop)
Intel Arc A580
...
...
AMD Radeon RX 5700 (Desktop)
...
0 100 200 300 400 500 600 700 800 900 1000 1100 1200 1300 1400 1500 1600 1700 1800 1900 2000 2100 2200 2300 2400 2500 2600 2700 2800 2900 3000 3100 3200 3300 3400 3500 3600 3700 3800 3900 Tooltip
...
AMD Radeon RX 5700 (Desktop)
...
» With all tested laptops playable in detail settings ultra.
...
AMD Radeon RX 5700 (Desktop)
...
...
AMD Radeon RX 5700 (Desktop)
...
...
AMD Radeon RX 5700 (Desktop)
...
...
AMD Radeon RX 5700 (Desktop)
...
AMD Radeon RX 5700 (Desktop)
...
...
AMD Radeon RX 5700 (Desktop)
...
» With all tested laptops playable in detail settings ultra.
...
AMD Radeon RX 5700 (Desktop)
...
...
AMD Radeon RX 5700 (Desktop)
...
...
AMD Radeon RX 5700 (Desktop)
...
...
AMD Radeon RX 5700 (Desktop)
...
...
AMD Radeon RX 5700 (Desktop)
...
...
AMD Radeon RX 5700 (Desktop)
...
» With all tested laptops playable in detail settings ultra.
106 [X] AMD Ryzen 7 2700X 3.7GHz
Radeon RX 5700 (Desktop)
min:
73 fps, max:
146 fps
185 [X] AMD Radeon RX 5700 AMD Ryzen 9 7950X 4.5GHz
Radeon RX 5700 (Desktop)
min:
140 fps, max:
278 fps
186 [X] AMD Radeon RX 5700 AMD Ryzen 9 7900X 4.7GHz
Radeon RX 5700 (Desktop)
min:
139 fps, max:
284 fps
~ 159 fps
+ Compare
- Hide Comparison
+ 📈 Graph
- 📈 Hide Graph
0 100 200 Tooltip : Ø106.3 (73-146)
: Ø185.1 (140-278)
: Ø185.7 (139-284)
...
AMD Radeon RX 5700 (Desktop)
...
95 [X] AMD Ryzen 7 2700X 3.7GHz
Radeon RX 5700 (Desktop)
min:
77 fps, max:
138 fps
148 [X] AMD Radeon RX 5700 AMD Ryzen 9 7900X 4.7GHz
Radeon RX 5700 (Desktop)
min:
127 fps, max:
190 fps
149 [X] AMD Radeon RX 5700 AMD Ryzen 9 7950X 4.5GHz
Radeon RX 5700 (Desktop)
min:
126 fps, max:
191 fps
~ 131 fps
+ Compare
- Hide Comparison
+ 📈 Graph
- 📈 Hide Graph
0 100 Tooltip : Ø95.5 (77-138)
: Ø147.5 (127-190)
: Ø149.1 (126-191)
...
AMD Radeon RX 5700 (Desktop)
Intel Arc A580
...
93 [X] AMD Ryzen 7 2700X 3.7GHz
Radeon RX 5700 (Desktop)
min:
73 fps, max:
132 fps
138 [X] AMD Radeon RX 5700 AMD Ryzen 9 7900X 4.7GHz
Radeon RX 5700 (Desktop)
min:
117 fps, max:
175 fps
139 [X] AMD Radeon RX 5700 AMD Ryzen 9 7950X 4.5GHz
Radeon RX 5700 (Desktop)
min:
116 fps, max:
176 fps
~ 123 fps
+ Compare
- Hide Comparison
+ 📈 Graph
- 📈 Hide Graph
0 100 Tooltip : Ø92.6 (73-132)
: Ø138 (117-175)
: Ø139 (116-176)
...
AMD Radeon RX 5700 (Desktop)
Intel Arc A580
...
83 [X] AMD Ryzen 7 2700X 3.7GHz
Radeon RX 5700 (Desktop)
min:
60 fps, max:
132 fps
124 [X] AMD Radeon RX 5700 AMD Ryzen 9 7900X 4.7GHz
Radeon RX 5700 (Desktop)
min:
96 fps, max:
167 fps
125 [X] AMD Radeon RX 5700 AMD Ryzen 9 7950X 4.5GHz
Radeon RX 5700 (Desktop)
min:
99 fps, max:
167 fps
~ 111 fps
+ Compare
- Hide Comparison
+ 📈 Graph
- 📈 Hide Graph
0 100 Tooltip : Ø83.1 (60-132)
: Ø123.9 (96-167)
: Ø125.2 (99-167)
...
AMD Radeon RX 5700 (Desktop)
Intel Arc A580
...
79 [X] AMD Ryzen 7 2700X 3.7GHz
Radeon RX 5700 (Desktop)
min:
59 fps, max:
118 fps
94 [X] AMD Radeon RX 5700 AMD Ryzen 9 7900X 4.7GHz
Radeon RX 5700 (Desktop)
min:
76 fps, max:
120 fps
94 [X] AMD Radeon RX 5700 AMD Ryzen 9 7950X 4.5GHz
Radeon RX 5700 (Desktop)
min:
76 fps, max:
120 fps
~ 89 fps
+ Compare
- Hide Comparison
+ 📈 Graph
- 📈 Hide Graph
0 100 Tooltip : Ø78.8 (59-118)
: Ø94 (76-120)
: Ø94.2 (76-120)
...
AMD Radeon RX 5700 (Desktop)
Intel Arc A580
...
50 [X] AMD Radeon RX 5700 AMD Ryzen 9 7900X 4.7GHz
Radeon RX 5700 (Desktop)
min:
41 fps, max:
63 fps
50 [X] AMD Radeon RX 5700 AMD Ryzen 9 7950X 4.5GHz
Radeon RX 5700 (Desktop)
min:
41 fps, max:
63 fps
51 [X] AMD Ryzen 7 2700X 3.7GHz
Radeon RX 5700 (Desktop)
min:
42 fps, max:
67 fps
~ 50 fps
+ Compare
- Hide Comparison
+ 📈 Graph
- 📈 Hide Graph
0 Tooltip : Ø49.6 (41-63)
: Ø49.6 (41-63)
: Ø51.4 (42-67)
...
AMD Radeon RX 5700 (Desktop)
Intel Arc A580
...
» With all tested laptops playable in detail settings ultra.
142 [X] AMD Ryzen 7 2700X 3.7GHz
Radeon RX 5700 (Desktop)
min:
78.07 fps, max:
228.57 fps
228 [X] AMD Radeon RX 5700 AMD Ryzen 9 7900X 4.7GHz
Radeon RX 5700 (Desktop)
min:
120.8 fps, max:
354.11 fps
233 [X] AMD Radeon RX 5700 AMD Ryzen 9 7950X 4.5GHz
Radeon RX 5700 (Desktop)
min:
123.33 fps, max:
360.1 fps
~ 201 fps
+ Compare
- Hide Comparison
...
AMD Radeon RX 5700 (Desktop)
Intel Arc A580
...
74 [X] AMD Ryzen 7 2700X 3.7GHz
Radeon RX 5700 (Desktop)
min:
40.3 fps, max:
99.66 fps
113.2 [X] AMD Radeon RX 5700 AMD Ryzen 9 7900X 4.7GHz
Radeon RX 5700 (Desktop)
min:
55.72 fps, max:
164.99 fps
114.3 [X] AMD Radeon RX 5700 AMD Ryzen 9 7950X 4.5GHz
Radeon RX 5700 (Desktop)
min:
56.27 fps, max:
165.95 fps
~ 101 fps
+ Compare
- Hide Comparison
...
AMD Radeon RX 5700 (Desktop)
...
64 [X] AMD Ryzen 7 2700X 3.7GHz
Radeon RX 5700 (Desktop)
min:
35.65 fps, max:
92.61 fps
82.3 [X] AMD Radeon RX 5700 AMD Ryzen 9 7900X 4.7GHz
Radeon RX 5700 (Desktop)
min:
42.64 fps, max:
123.09 fps
83.1 [X] AMD Radeon RX 5700 AMD Ryzen 9 7950X 4.5GHz
Radeon RX 5700 (Desktop)
min:
43.01 fps, max:
124.94 fps
~ 76 fps
+ Compare
- Hide Comparison
...
AMD Radeon RX 5700 (Desktop)
...
58.6 [X] AMD Ryzen 7 2700X 3.7GHz
Radeon RX 5700 (Desktop)
min:
32.67 fps, max:
85.8 fps
65.4 [X] AMD Radeon RX 5700 AMD Ryzen 9 7900X 4.7GHz
Radeon RX 5700 (Desktop)
min:
36.8 fps, max:
96.02 fps
66.3 [X] AMD Radeon RX 5700 AMD Ryzen 9 7950X 4.5GHz
Radeon RX 5700 (Desktop)
min:
37.09 fps, max:
97.98 fps
~ 63 fps
+ Compare
- Hide Comparison
...
AMD Radeon RX 5700 (Desktop)
Intel Arc A580
...
48.4 [X] AMD Ryzen 7 2700X 3.7GHz
Radeon RX 5700 (Desktop)
min:
28.7 fps, max:
68.51 fps
50.8 [X] AMD Radeon RX 5700 AMD Ryzen 9 7900X 4.7GHz
Radeon RX 5700 (Desktop)
min:
31.06 fps, max:
69.71 fps
51.3 [X] AMD Radeon RX 5700 AMD Ryzen 9 7950X 4.5GHz
Radeon RX 5700 (Desktop)
min:
31.18 fps, max:
70.37 fps
~ 50 fps
+ Compare
- Hide Comparison
...
AMD Radeon RX 5700 (Desktop)
...
28.6 [X] AMD Ryzen 7 2700X 3.7GHz
Radeon RX 5700 (Desktop)
min:
19.67 fps, max:
36.24 fps
31.2 [X] AMD Radeon RX 5700 AMD Ryzen 9 7900X 4.7GHz
Radeon RX 5700 (Desktop)
min:
20.88 fps, max:
40.12 fps
31.4 [X] AMD Radeon RX 5700 AMD Ryzen 9 7950X 4.5GHz
Radeon RX 5700 (Desktop)
min:
20.88 fps, max:
40.48 fps
~ 30 fps
+ Compare
- Hide Comparison
...
AMD Radeon RX 5700 (Desktop)
...
» With all tested laptops playable in detail settings ultra.
...
AMD Radeon RX 5700 (Desktop)
...
AMD Radeon RX 5700 (Desktop)
...
AMD Radeon RX 5700 (Desktop)
...
...
AMD Radeon RX 5700 (Desktop)
...
...
AMD Radeon RX 5700 (Desktop)
...
...
AMD Radeon RX 5700 (Desktop)
...
» With all tested laptops playable in detail settings ultra.
...
AMD Radeon RX 5700 (Desktop)
...
...
AMD Radeon RX 5700 (Desktop)
...
...
AMD Radeon RX 5700 (Desktop)
...
...
AMD Radeon RX 5700 (Desktop)
...
...
AMD Radeon RX 5700 (Desktop)
...
...
AMD Radeon RX 5700 (Desktop)
...
» With all tested laptops playable in detail settings ultra.
...
AMD Radeon RX 5700 (Desktop)
...
...
AMD Radeon RX 5700 (Desktop)
...
...
AMD Radeon RX 5700 (Desktop)
...
...
AMD Radeon RX 5700 (Desktop)
...
...
AMD Radeon RX 5700 (Desktop)
...
...
AMD Radeon RX 5700 (Desktop)
...
» With all tested laptops playable in detail settings ultra.
...
AMD Radeon RX 5700 (Desktop)
...
...
AMD Radeon RX 5700 (Desktop)
...
...
AMD Radeon RX 5700 (Desktop)
...
...
AMD Radeon RX 5700 (Desktop)
...
...
AMD Radeon RX 5700 (Desktop)
...
...
AMD Radeon RX 5700 (Desktop)
...
» With all tested laptops playable in detail settings ultra.
...
AMD Radeon RX 5700 (Desktop)
...
...
AMD Radeon RX 5700 (Desktop)
...
...
AMD Radeon RX 5700 (Desktop)
...
...
AMD Radeon RX 5700 (Desktop)
...
...
AMD Radeon RX 5700 (Desktop)
...
...
AMD Radeon RX 5700 (Desktop)
...
» With all tested laptops playable in detail settings ultra.
...
AMD Radeon RX 5700 (Desktop)
...
AMD Radeon RX 5700 (Desktop)
...
AMD Radeon RX 5700 (Desktop)
...
...
AMD Radeon RX 5700 (Desktop)
...
AMD Radeon RX 5700 (Desktop)
...
AMD Radeon RX 5700 (Desktop)
...
» With all tested laptops playable in detail settings ultra.
...
AMD Radeon RX 5700 (Desktop)
...
...
AMD Radeon RX 5700 (Desktop)
...
AMD Radeon RX 5700 (Desktop)
...
AMD Radeon RX 5700 (Desktop)
...
...
AMD Radeon RX 5700 (Desktop)
...
AMD Radeon RX 5700 (Desktop)
...
» With all tested laptops playable in detail settings ultra.
...
AMD Radeon RX 5700 (Desktop)
...
...
AMD Radeon RX 5700 (Desktop)
...
...
AMD Radeon RX 5700 (Desktop)
...
...
AMD Radeon RX 5700 (Desktop)
...
...
AMD Radeon RX 5700 (Desktop)
Intel Arc A580
...
...
AMD Radeon RX 5700 (Desktop)
Intel Arc A580
...
» With all tested laptops playable in detail settings ultra.
...
Intel Arc A380
AMD Radeon RX 5700 (Desktop)
Intel Arc A580
...
...
AMD Radeon RX 5700 (Desktop)
...
...
AMD Radeon RX 5700 (Desktop)
...
...
AMD Radeon RX 5700 (Desktop)
...
...
AMD Radeon RX 5700 (Desktop)
...
...
Intel Arc A580
AMD Radeon RX 5700 (Desktop)
...
» With all tested laptops playable in detail settings ultra.
...
AMD Radeon RX 5700 (Desktop)
...
...
AMD Radeon RX 5700 (Desktop)
...
...
AMD Radeon RX 5700 (Desktop)
...
AMD Radeon RX 5700 (Desktop)
...
AMD Radeon RX 5700 (Desktop)
...
AMD Radeon RX 5700 (Desktop)
...
» With all tested laptops playable in detail settings ultra.
108 [X] AMD Ryzen 7 2700X 3.7GHz
Radeon RX 5700 (Desktop)
315 [X] AMD Radeon RX 5700 AMD Ryzen 9 7900X 4.7GHz
Radeon RX 5700 (Desktop)
max:
494.5 fps
319 [X] AMD Radeon RX 5700 AMD Ryzen 9 7950X 4.5GHz
Radeon RX 5700 (Desktop)
max:
491.1 fps
~ 247 fps
+ Compare
- Hide Comparison
...
AMD Radeon RX 5700 (Desktop)
Intel Arc A580
...
99 [X] AMD Ryzen 7 2700X 3.7GHz
Radeon RX 5700 (Desktop)
136.6 [X] AMD Radeon RX 5700 AMD Ryzen 9 7950X 4.5GHz
Radeon RX 5700 (Desktop)
max:
215.7 fps
138 [X] AMD Radeon RX 5700 AMD Ryzen 9 7900X 4.7GHz
Radeon RX 5700 (Desktop)
max:
216.3 fps
~ 125 fps
+ Compare
- Hide Comparison
...
Intel Arc A580
AMD Radeon RX 5700 (Desktop)
...
97 [X] AMD Ryzen 7 2700X 3.7GHz
Radeon RX 5700 (Desktop)
124.8 [X] AMD Radeon RX 5700 AMD Ryzen 9 7950X 4.5GHz
Radeon RX 5700 (Desktop)
max:
190.9 fps
125.6 [X] AMD Radeon RX 5700 AMD Ryzen 9 7900X 4.7GHz
Radeon RX 5700 (Desktop)
max:
192.1 fps
~ 116 fps
+ Compare
- Hide Comparison
...
Intel Arc A580
AMD Radeon RX 5700 (Desktop)
...
90 [X] AMD Ryzen 7 2700X 3.7GHz
Radeon RX 5700 (Desktop)
106.1 [X] AMD Radeon RX 5700 AMD Ryzen 9 7950X 4.5GHz
Radeon RX 5700 (Desktop)
max:
164.1 fps
107.6 [X] AMD Radeon RX 5700 AMD Ryzen 9 7900X 4.7GHz
Radeon RX 5700 (Desktop)
max:
166 fps
~ 101 fps
+ Compare
- Hide Comparison
...
Intel Arc A580
AMD Radeon RX 5700 (Desktop)
...
68 [X] AMD Ryzen 7 2700X 3.7GHz
Radeon RX 5700 (Desktop)
71.1 [X] AMD Radeon RX 5700 AMD Ryzen 9 7950X 4.5GHz
Radeon RX 5700 (Desktop)
max:
104.2 fps
71.4 [X] AMD Radeon RX 5700 AMD Ryzen 9 7900X 4.7GHz
Radeon RX 5700 (Desktop)
max:
104.2 fps
~ 70 fps
+ Compare
- Hide Comparison
...
AMD Radeon RX 5700 (Desktop)
Intel Arc A580
...
34 [X] AMD Ryzen 7 2700X 3.7GHz
Radeon RX 5700 (Desktop)
36.5 [X] AMD Radeon RX 5700 AMD Ryzen 9 7950X 4.5GHz
Radeon RX 5700 (Desktop)
max:
50.7 fps
36.8 [X] AMD Radeon RX 5700 AMD Ryzen 9 7900X 4.7GHz
Radeon RX 5700 (Desktop)
max:
51.3 fps
~ 36 fps
+ Compare
- Hide Comparison
...
AMD Radeon RX 5700 (Desktop)
Intel Arc A580
...
» With all tested laptops playable in detail settings ultra.
Additional Benchmarks
Lowest Preset 1920x1080
232 [X] AMD Radeon RX 5700 AMD Ryzen 9 7950X 4.5GHz
Radeon RX 5700 (Desktop)
max:
357.1 fps
454 [X] AMD Radeon RX 5700 1.47.22.14 D3D12
AMD Ryzen 9 3900X 3.8GHz
Radeon RX 5700 (Desktop)
min:
148 fps, P1:
364 fps, max:
619 fps
504 [X] AMD Radeon RX 5700 1.47.22.14 D3D12
AMD Ryzen 9 7900X 4.7GHz
Radeon RX 5700 (Desktop)
min:
315 fps, P1:
435 fps, max:
683 fps
510 [X] AMD Radeon RX 5700 1.47.22.14 D3D12
AMD Ryzen 9 7950X 4.5GHz
Radeon RX 5700 (Desktop)
min:
248 fps, P1:
442 fps, max:
661 fps
~ 489 fps
+ Compare
- Hide Comparison
...
AMD Radeon RX 5700 (Desktop)
...
196 [X] AMD Radeon RX 5700 1.47.22.14 D3D12
AMD Ryzen 9 3900X 3.8GHz
Radeon RX 5700 (Desktop)
min:
165 fps, P1:
169 fps, max:
248 fps
214 [X] AMD Radeon RX 5700 1.47.22.14 D3D12
AMD Ryzen 9 7950X 4.5GHz
Radeon RX 5700 (Desktop)
min:
179.3 fps, P1:
186 fps, max:
265 fps
215 [X] AMD Radeon RX 5700 1.47.22.14 D3D12
AMD Ryzen 9 7900X 4.7GHz
Radeon RX 5700 (Desktop)
min:
167 fps, P1:
185.6 fps, max:
313 fps
~ 208 fps
+ Compare
- Hide Comparison
...
AMD Radeon RX 5700 (Desktop)
...
160 [X] AMD Radeon RX 5700 1.47.22.14 D3D12
AMD Ryzen 9 3900X 3.8GHz
Radeon RX 5700 (Desktop)
min:
108 fps, P1:
112 fps, max:
219 fps
175.1 [X] AMD Radeon RX 5700 1.47.22.14 D3D12
AMD Ryzen 9 7900X 4.7GHz
Radeon RX 5700 (Desktop)
min:
115.5 fps, P1:
121.8 fps, max:
282 fps
176.1 [X] AMD Radeon RX 5700 1.47.22.14 D3D12
AMD Ryzen 9 7950X 4.5GHz
Radeon RX 5700 (Desktop)
min:
117.7 fps, P1:
122.4 fps, max:
263 fps
~ 170 fps
+ Compare
- Hide Comparison
...
AMD Radeon RX 5700 (Desktop)
...
140 [X] AMD Radeon RX 5700 1.47.22.14 D3D12
AMD Ryzen 9 3900X 3.8GHz
Radeon RX 5700 (Desktop)
min:
49.3 fps, P1:
99 fps, max:
312 fps
155.3 [X] AMD Radeon RX 5700 1.47.22.14 D3D12
AMD Ryzen 9 7900X 4.7GHz
Radeon RX 5700 (Desktop)
min:
103.6 fps, P1:
108 fps, max:
253 fps
155.4 [X] AMD Radeon RX 5700 1.47.22.14 D3D12
AMD Ryzen 9 7950X 4.5GHz
Radeon RX 5700 (Desktop)
min:
104.8 fps, P1:
108.4 fps, max:
244 fps
~ 150 fps
+ Compare
- Hide Comparison
...
AMD Radeon RX 5700 (Desktop)
...
100 [X] AMD Radeon RX 5700 1.47.22.14 D3D12
AMD Ryzen 9 3900X 3.8GHz
Radeon RX 5700 (Desktop)
min:
75.2 fps, P1:
77.1 fps, max:
134 fps
108.3 [X] AMD Radeon RX 5700 1.47.22.14 D3D12
AMD Ryzen 9 7950X 4.5GHz
Radeon RX 5700 (Desktop)
min:
32.3 fps, P1:
83.1 fps, max:
383 fps
109.2 [X] AMD Radeon RX 5700 1.47.22.14 D3D12
AMD Ryzen 9 7900X 4.7GHz
Radeon RX 5700 (Desktop)
min:
47.8 fps, P1:
83.4 fps, max:
273 fps
~ 106 fps
+ Compare
- Hide Comparison
...
AMD Radeon RX 5700 (Desktop)
...
59.3 [X] AMD Radeon RX 5700 1.47.22.14 D3D12
AMD Ryzen 9 3900X 3.8GHz
Radeon RX 5700 (Desktop)
min:
48.5 fps, P1:
49.2 fps, max:
74.7 fps
63.8 [X] AMD Radeon RX 5700 1.47.22.14 D3D12
AMD Ryzen 9 7950X 4.5GHz
Radeon RX 5700 (Desktop)
min:
30.9 fps, P1:
53.3 fps, max:
236 fps
64 [X] AMD Radeon RX 5700 1.47.22.14 D3D12
AMD Ryzen 9 7900X 4.7GHz
Radeon RX 5700 (Desktop)
min:
49.5 fps, P1:
53.9 fps, max:
137.2 fps
~ 62 fps
+ Compare
- Hide Comparison
...
AMD Radeon RX 5700 (Desktop)
...
» With all tested laptops playable in detail settings ultra.
...
AMD Radeon RX 5700 (Desktop)
...
...
AMD Radeon RX 5700 (Desktop)
...
...
AMD Radeon RX 5700 (Desktop)
...
...
AMD Radeon RX 5700 (Desktop)
...
...
AMD Radeon RX 5700 (Desktop)
...
...
AMD Radeon RX 5700 (Desktop)
...
» With all tested laptops playable in detail settings ultra.
...
AMD Radeon RX 5700 (Desktop)
...
...
AMD Radeon RX 5700 (Desktop)
...
...
AMD Radeon RX 5700 (Desktop)
...
...
AMD Radeon RX 5700 (Desktop)
...
...
AMD Radeon RX 5700 (Desktop)
...
...
AMD Radeon RX 5700 (Desktop)
...
» With all tested laptops playable in detail settings ultra.
108 [X] AMD Ryzen 7 2700X 3.7GHz
Radeon RX 5700 (Desktop)
min:
87 fps, max:
149 fps
216 [X] AMD Radeon RX 5700 AMD Ryzen 9 7900X 4.7GHz
Radeon RX 5700 (Desktop)
min:
166 fps, max:
292 fps
217 [X] AMD Radeon RX 5700 AMD Ryzen 9 7950X 4.5GHz
Radeon RX 5700 (Desktop)
min:
150 fps, max:
286 fps
~ 180 fps
+ Compare
- Hide Comparison
+ 📈 Graph
- 📈 Hide Graph
0 100 200 Tooltip : Ø107.7 (87-149)
: Ø216 (166-292)
: Ø217 (150-286)
...
AMD Radeon RX 5700 (Desktop)
...
93 [X] AMD Ryzen 7 2700X 3.7GHz
Radeon RX 5700 (Desktop)
min:
72 fps, max:
120 fps
156 [X] AMD Radeon RX 5700 AMD Ryzen 9 7900X 4.7GHz
Radeon RX 5700 (Desktop)
min:
141 fps, max:
184 fps
156 [X] AMD Radeon RX 5700 AMD Ryzen 9 7950X 4.5GHz
Radeon RX 5700 (Desktop)
min:
141 fps, max:
183 fps
~ 135 fps
+ Compare
- Hide Comparison
+ 📈 Graph
- 📈 Hide Graph
0 100 Tooltip : Ø93.1 (72-120)
: Ø155.7 (141-184)
: Ø156.3 (141-183)
...
Intel Arc A580
AMD Radeon RX 5700 (Desktop)
...
90 [X] AMD Ryzen 7 2700X 3.7GHz
Radeon RX 5700 (Desktop)
min:
68 fps, max:
120 fps
144 [X] AMD Radeon RX 5700 AMD Ryzen 9 7900X 4.7GHz
Radeon RX 5700 (Desktop)
min:
128 fps, max:
176 fps
144 [X] AMD Radeon RX 5700 AMD Ryzen 9 7950X 4.5GHz
Radeon RX 5700 (Desktop)
min:
128 fps, max:
176 fps
~ 126 fps
+ Compare
- Hide Comparison
+ 📈 Graph
- 📈 Hide Graph
0 100 Tooltip : Ø90.3 (68-120)
: Ø144.3 (128-176)
: Ø143.8 (128-176)
...
Intel Arc A580
AMD Radeon RX 5700 (Desktop)
...
84 [X] AMD Ryzen 7 2700X 3.7GHz
Radeon RX 5700 (Desktop)
min:
59 fps, max:
114 fps
135 [X] AMD Radeon RX 5700 AMD Ryzen 9 7900X 4.7GHz
Radeon RX 5700 (Desktop)
min:
121 fps, max:
164 fps
135 [X] AMD Radeon RX 5700 AMD Ryzen 9 7950X 4.5GHz
Radeon RX 5700 (Desktop)
min:
120 fps, max:
164 fps
~ 118 fps
+ Compare
- Hide Comparison
+ 📈 Graph
- 📈 Hide Graph
0 100 Tooltip : Ø84 (59-114)
: Ø134.5 (121-164)
: Ø134.5 (120-164)
...
Intel Arc A580
AMD Radeon RX 5700 (Desktop)
...
80 [X] AMD Ryzen 7 2700X 3.7GHz
Radeon RX 5700 (Desktop)
min:
65 fps, max:
93 fps
93 [X] AMD Radeon RX 5700 AMD Ryzen 9 7900X 4.7GHz
Radeon RX 5700 (Desktop)
min:
81 fps, max:
116 fps
93 [X] AMD Radeon RX 5700 AMD Ryzen 9 7950X 4.5GHz
Radeon RX 5700 (Desktop)
min:
81 fps, max:
116 fps
~ 89 fps
+ Compare
- Hide Comparison
+ 📈 Graph
- 📈 Hide Graph
0 100 Tooltip : Ø80 (65-93)
: Ø92.9 (81-116)
: Ø92.8 (81-116)
...
Intel Arc A580
AMD Radeon RX 5700 (Desktop)
...
45 [X] AMD Ryzen 7 2700X 3.7GHz
Radeon RX 5700 (Desktop)
min:
38 fps, max:
58 fps
47 [X] AMD Radeon RX 5700 AMD Ryzen 9 7900X 4.7GHz
Radeon RX 5700 (Desktop)
min:
40 fps, max:
61 fps
47 [X] AMD Radeon RX 5700 AMD Ryzen 9 7950X 4.5GHz
Radeon RX 5700 (Desktop)
min:
40 fps, max:
61 fps
~ 46 fps
+ Compare
- Hide Comparison
+ 📈 Graph
- 📈 Hide Graph
0 Tooltip : Ø44.9 (38-58)
: Ø47.5 (40-61)
: Ø47.2 (40-61)
...
AMD Radeon RX 5700 (Desktop)
Intel Arc A580
...
» With all tested laptops playable in detail settings ultra.
Additional Benchmarks
Low Preset TAA 1920x1080
176 [X] AMD Radeon RX 5700 AMD Ryzen 9 7950X 4.5GHz
Radeon RX 5700 (Desktop)
min:
154 fps, max:
205 fps
64 [X] AMD Ryzen 7 2700X 3.7GHz
Radeon RX 5700 (Desktop)
134.3 [X] AMD Radeon RX 5700 AMD Ryzen 9 7950X 4.5GHz
Radeon RX 5700 (Desktop)
148.4 [X] AMD Radeon RX 5700 AMD Ryzen 9 7900X 4.7GHz
Radeon RX 5700 (Desktop)
~ 116 fps
+ Compare
- Hide Comparison
...
AMD Radeon RX 5700 (Desktop)
...
54.3 [X] AMD Ryzen 7 2700X 3.7GHz
Radeon RX 5700 (Desktop)
98 [X] AMD Radeon RX 5700 AMD Ryzen 9 7950X 4.5GHz
Radeon RX 5700 (Desktop)
104.5 [X] AMD Radeon RX 5700 AMD Ryzen 9 7900X 4.7GHz
Radeon RX 5700 (Desktop)
~ 86 fps
+ Compare
- Hide Comparison
...
AMD Radeon RX 5700 (Desktop)
...
47 [X] AMD Ryzen 7 2700X 3.7GHz
Radeon RX 5700 (Desktop)
76.7 [X] AMD Radeon RX 5700 AMD Ryzen 9 7950X 4.5GHz
Radeon RX 5700 (Desktop)
78.6 [X] AMD Radeon RX 5700 AMD Ryzen 9 7900X 4.7GHz
Radeon RX 5700 (Desktop)
~ 67 fps
+ Compare
- Hide Comparison
...
Intel Arc A380
AMD Radeon RX 5700 (Desktop)
...
36.7 [X] AMD Ryzen 7 2700X 3.7GHz
Radeon RX 5700 (Desktop)
54.1 [X] AMD Radeon RX 5700 AMD Ryzen 9 7950X 4.5GHz
Radeon RX 5700 (Desktop)
63.2 [X] AMD Radeon RX 5700 AMD Ryzen 9 7900X 4.7GHz
Radeon RX 5700 (Desktop)
~ 51 fps
+ Compare
- Hide Comparison
...
Intel Arc A580
AMD Radeon RX 5700 (Desktop)
...
» With all tested laptops playable in detail settings high.
...
AMD Radeon RX 5700 (Desktop)
...
...
AMD Radeon RX 5700 (Desktop)
...
...
AMD Radeon RX 5700 (Desktop)
...
...
AMD Radeon RX 5700 (Desktop)
...
...
AMD Radeon RX 5700 (Desktop)
...
...
AMD Radeon RX 5700 (Desktop)
...
» With all tested laptops playable in detail settings ultra.
144 [X] AMD Ryzen 7 2700X 3.7GHz
Radeon RX 5700 (Desktop)
min:
64 fps, max:
201 fps
205 [X] AMD Radeon RX 5700 1.3
AMD Ryzen 9 7950X 4.5GHz
Radeon RX 5700 (Desktop)
206 [X] AMD Radeon RX 5700 1.3
AMD Ryzen 9 7900X 4.7GHz
Radeon RX 5700 (Desktop)
~ 185 fps
+ Compare
- Hide Comparison
...
AMD Radeon RX 5700 (Desktop)
...
100 [X] AMD Ryzen 7 2700X 3.7GHz
Radeon RX 5700 (Desktop)
min:
67 fps, max:
125 fps
107.8 [X] AMD Radeon RX 5700 1.3
AMD Ryzen 9 7900X 4.7GHz
Radeon RX 5700 (Desktop)
108.1 [X] AMD Radeon RX 5700 1.3
AMD Ryzen 9 7950X 4.5GHz
Radeon RX 5700 (Desktop)
~ 105 fps
+ Compare
- Hide Comparison
...
AMD Radeon RX 5700 (Desktop)
...
59.6 [X] AMD Ryzen 7 2700X 3.7GHz
Radeon RX 5700 (Desktop)
min:
18 fps, max:
102 fps
78.1 [X] AMD Radeon RX 5700 1.3
AMD Ryzen 9 7950X 4.5GHz
Radeon RX 5700 (Desktop)
78.6 [X] AMD Radeon RX 5700 1.3
AMD Ryzen 9 7900X 4.7GHz
Radeon RX 5700 (Desktop)
~ 72 fps
+ Compare
- Hide Comparison
...
AMD Radeon RX 5700 (Desktop)
...
...
AMD Radeon RX 5700 (Desktop)
...
28.9 [X] AMD Ryzen 7 2700X 3.7GHz
Radeon RX 5700 (Desktop)
min:
18 fps, max:
45 fps
32.8 [X] AMD Radeon RX 5700 1.3
AMD Ryzen 9 7900X 4.7GHz
Radeon RX 5700 (Desktop)
33.9 [X] AMD Radeon RX 5700 1.3
AMD Ryzen 9 7950X 4.5GHz
Radeon RX 5700 (Desktop)
~ 32 fps
+ Compare
- Hide Comparison
...
AMD Radeon RX 5700 (Desktop)
...
» With all tested laptops playable in detail settings high.
...
AMD Radeon RX 5700 (Desktop)
...
...
AMD Radeon RX 5700 (Desktop)
...
...
AMD Radeon RX 5700 (Desktop)
...
...
AMD Radeon RX 5700 (Desktop)
...
...
AMD Radeon RX 5700 (Desktop)
...
...
AMD Radeon RX 5700 (Desktop)
...
» With all tested laptops playable in detail settings ultra.
...
AMD Radeon RX 5700 (Desktop)
Intel Arc A380
...
...
AMD Radeon RX 5700 (Desktop)
Intel Arc A580
...
...
AMD Radeon RX 5700 (Desktop)
Intel Arc A580
...
...
AMD Radeon RX 5700 (Desktop)
...
...
AMD Radeon RX 5700 (Desktop)
...
...
AMD Radeon RX 5700 (Desktop)
...
» With all tested laptops playable in detail settings ultra.
...
AMD Radeon RX 5700 (Desktop)
...
...
AMD Radeon RX 5700 (Desktop)
...
...
AMD Radeon RX 5700 (Desktop)
...
...
AMD Radeon RX 5700 (Desktop)
...
...
AMD Radeon RX 5700 (Desktop)
...
AMD Radeon RX 5700 (Desktop)
...
» With all tested laptops playable in detail settings ultra.
...
AMD Radeon RX 5700 (Desktop)
...
...
AMD Radeon RX 5700 (Desktop)
...
...
AMD Radeon RX 5700 (Desktop)
...
...
AMD Radeon RX 5700 (Desktop)
...
AMD Radeon RX 5700 (Desktop)
» With all tested laptops playable in detail settings ultra.
...
AMD Radeon RX 5700 (Desktop)
...
...
AMD Radeon RX 5700 (Desktop)
...
...
AMD Radeon RX 5700 (Desktop)
...
...
AMD Radeon RX 5700 (Desktop)
...
» With all tested laptops playable in detail settings high.
Additional Benchmarks
Performance 1920x1080
233 [X] AMD Ryzen 7 2700X 3.7GHz
Radeon RX 5700 (Desktop)
min:
157 fps, max:
243 fps
...
AMD Radeon RX 5700 (Desktop)
...
...
AMD Radeon RX 5700 (Desktop)
...
...
AMD Radeon RX 5700 (Desktop)
...
...
AMD Radeon RX 5700 (Desktop)
...
...
AMD Radeon RX 5700 (Desktop)
...
» With all tested laptops playable in detail settings ultra.
Additional Benchmarks
Ultra Preset 16xAF TAA 3840x2160
31.4 [X] AMD Ryzen 7 2700X 3.7GHz
Radeon RX 5700 (Desktop)
min:
24 fps, max:
36 fps
...
AMD Radeon RX 5700 (Desktop)
...
...
AMD Radeon RX 5700 (Desktop)
...
...
AMD Radeon RX 5700 (Desktop)
...
...
AMD Radeon RX 5700 (Desktop)
...
...
AMD Radeon RX 5700 (Desktop)
...
» With all tested laptops playable in detail settings ultra.
Additional Benchmarks
Extreme Preset 16xAF TAA 3840x2160
48.5 [X] AMD Ryzen 7 2700X 3.7GHz
Radeon RX 5700 (Desktop)
min:
39 fps, max:
59 fps
...
AMD Radeon RX 5700 (Desktop)
...
...
AMD Radeon RX 5700 (Desktop)
...
AMD Radeon RX 5700 (Desktop)
...
...
AMD Radeon RX 5700 (Desktop)
...
» With all tested laptops playable in detail settings ultra.
Additional Benchmarks
Medium (Render Scale 100 %) 2xAF FXAA 1920x1080
298 [X] AMD Ryzen 7 2700X 3.7GHz
Radeon RX 5700 (Desktop)
min:
257 fps, max:
302 fps
Epic (Render Scale 100 %) 16xAF SMAA 3820x2160
74 [X] AMD Ryzen 7 2700X 3.7GHz
Radeon RX 5700 (Desktop)
min:
63 fps, max:
86 fps
Epic (Render Scale 100 %) 16xAF SMAA 2560x1440
139 [X] AMD Ryzen 7 2700X 3.7GHz
Radeon RX 5700 (Desktop)
min:
112 fps, max:
162 fps
...
AMD Radeon RX 5700 (Desktop)
...
AMD Radeon RX 5700 (Desktop)
...
AMD Radeon RX 5700 (Desktop)
...
...
AMD Radeon RX 5700 (Desktop)
...
» With all tested laptops playable in detail settings ultra.
Additional Benchmarks
Medium Preset 4xAF 1920x1080
191.1 [X] AMD Ryzen 7 2700X 3.7GHz
Radeon RX 5700 (Desktop)
Low Preset 1xAF 1920x1080
249.6 [X] AMD Ryzen 7 2700X 3.7GHz
Radeon RX 5700 (Desktop)
Ultra Preset 16xAF 3840x2160
46.5 [X] AMD Ryzen 7 2700X 3.7GHz
Radeon RX 5700 (Desktop)
...
AMD Radeon RX 5700 (Desktop)
...
...
AMD Radeon RX 5700 (Desktop)
...
...
AMD Radeon RX 5700 (Desktop)
...
...
AMD Radeon RX 5700 (Desktop)
...
...
AMD Radeon RX 5700 (Desktop)
...
» With all tested laptops playable in detail settings ultra.
Additional Benchmarks
Low Preset 1920x1080
116 [X] AMD Ryzen 7 2700X 3.7GHz
Radeon RX 5700 (Desktop)
min:
91 fps, max:
137 fps
Ultra Preset + HD Textures SMAA 3840x2160
45 [X] AMD Ryzen 7 2700X 3.7GHz
Radeon RX 5700 (Desktop)
min:
40 fps, max:
50 fps
...
AMD Radeon RX 5700 (Desktop)
...
...
AMD Radeon RX 5700 (Desktop)
...
...
AMD Radeon RX 5700 (Desktop)
...
...
AMD Radeon RX 5700 (Desktop)
...
» With all tested laptops playable in detail settings ultra.
Additional Benchmarks
Ultra Preset 16xAF TAA 3840x2160
82.5 [X] AMD Ryzen 7 2700X 3.7GHz
Radeon RX 5700 (Desktop)
min:
70 fps, max:
99.4 fps
126 [X] AMD Ryzen 7 2700X 3.7GHz
Radeon RX 5700 (Desktop)
min:
104.5 fps
264.1 [X] AMD Radeon RX 5700 AMD Ryzen 9 7900X 4.7GHz
Radeon RX 5700 (Desktop)
min:
218 fps, max:
-1 fps
308.1 [X] AMD Radeon RX 5700 AMD Ryzen 9 7950X 4.5GHz
Radeon RX 5700 (Desktop)
min:
244.1 fps, max:
-1 fps
~ 233 fps
+ Compare
- Hide Comparison
...
AMD Radeon RX 5700 (Desktop)
...
118.3 [X] AMD Ryzen 7 2700X 3.7GHz
Radeon RX 5700 (Desktop)
min:
95.3 fps
231.3 [X] AMD Radeon RX 5700 AMD Ryzen 9 7900X 4.7GHz
Radeon RX 5700 (Desktop)
min:
193.4 fps, max:
-1 fps
269.8 [X] AMD Radeon RX 5700 AMD Ryzen 9 7950X 4.5GHz
Radeon RX 5700 (Desktop)
min:
215.7 fps, max:
-1 fps
~ 206 fps
+ Compare
- Hide Comparison
...
AMD Radeon RX 5700 (Desktop)
...
86.4 [X] AMD Ryzen 7 2700X 3.7GHz
Radeon RX 5700 (Desktop)
min:
64.3 fps
224.9 [X] AMD Radeon RX 5700 AMD Ryzen 9 7900X 4.7GHz
Radeon RX 5700 (Desktop)
min:
196.1 fps, max:
-1 fps
227.5 [X] AMD Radeon RX 5700 AMD Ryzen 9 7950X 4.5GHz
Radeon RX 5700 (Desktop)
min:
200.1 fps, max:
-1 fps
~ 180 fps
+ Compare
- Hide Comparison
...
AMD Radeon RX 5700 (Desktop)
...
85.1 [X] AMD Ryzen 7 2700X 3.7GHz
Radeon RX 5700 (Desktop)
min:
66.3 fps
206.7 [X] AMD Radeon RX 5700 AMD Ryzen 9 7900X 4.7GHz
Radeon RX 5700 (Desktop)
min:
169.3 fps, max:
-1 fps
213.3 [X] AMD Radeon RX 5700 AMD Ryzen 9 7950X 4.5GHz
Radeon RX 5700 (Desktop)
min:
188.7 fps, max:
-1 fps
~ 168 fps
+ Compare
- Hide Comparison
...
AMD Radeon RX 5700 (Desktop)
...
84.4 [X] AMD Ryzen 7 2700X 3.7GHz
Radeon RX 5700 (Desktop)
min:
69.6 fps
114.3 [X] AMD Radeon RX 5700 AMD Ryzen 9 7950X 4.5GHz
Radeon RX 5700 (Desktop)
min:
104.9 fps, max:
-1 fps
114.7 [X] AMD Radeon RX 5700 AMD Ryzen 9 7900X 4.7GHz
Radeon RX 5700 (Desktop)
min:
101.7 fps, max:
-1 fps
~ 104 fps
+ Compare
- Hide Comparison
...
AMD Radeon RX 5700 (Desktop)
...
» With all tested laptops playable in detail settings ultra.
284 [X] AMD Ryzen 7 2700X 3.7GHz
Radeon RX 5700 (Desktop)
min:
217 fps, max:
301 fps
404.9 [X] AMD Radeon RX 5700 AMD Ryzen 9 7950X 4.5GHz
Radeon RX 5700 (Desktop)
412 [X] AMD Radeon RX 5700 AMD Ryzen 9 7900X 4.7GHz
Radeon RX 5700 (Desktop)
min:
84.6 fps, P0.1:
244 fps, P1:
352 fps, max:
945 fps
~ 367 fps
+ Compare
- Hide Comparison
+ 📈 Graph
- 📈 Hide Graph
...
AMD Radeon RX 5700 (Desktop)
...
...
AMD Radeon RX 5700 (Desktop)
Intel Arc A580
...
129 [X] AMD Ryzen 7 2700X 3.7GHz
Radeon RX 5700 (Desktop)
min:
115 fps, max:
141 fps
147.1 [X] AMD Radeon RX 5700 AMD Ryzen 9 7900X 4.7GHz
Radeon RX 5700 (Desktop)
min:
24.8 fps, P0.1:
105.4 fps, P1:
130 fps, max:
371 fps
147.2 [X] AMD Radeon RX 5700 AMD Ryzen 9 7950X 4.5GHz
Radeon RX 5700 (Desktop)
~ 141 fps
+ Compare
- Hide Comparison
+ 📈 Graph
- 📈 Hide Graph
...
AMD Radeon RX 5700 (Desktop)
...
80 [X] AMD Ryzen 7 2700X 3.7GHz
Radeon RX 5700 (Desktop)
min:
70 fps, max:
87 fps
90.5 [X] AMD Radeon RX 5700 AMD Ryzen 9 7900X 4.7GHz
Radeon RX 5700 (Desktop)
min:
61.2 fps, P0.1:
66.2 fps, P1:
80.8 fps, max:
170.6 fps
90.7 [X] AMD Radeon RX 5700 AMD Ryzen 9 7950X 4.5GHz
Radeon RX 5700 (Desktop)
~ 87 fps
+ Compare
- Hide Comparison
+ 📈 Graph
- 📈 Hide Graph
0 100 Tooltip : Ø84.2 (82-87)
: Ø92.7 (84.432-120.8)
...
AMD Radeon RX 5700 (Desktop)
...
46.8 [X] AMD Ryzen 7 2700X 3.7GHz
Radeon RX 5700 (Desktop)
min:
42 fps, max:
51 fps
47.7 [X] AMD Radeon RX 5700 AMD Ryzen 9 7950X 4.5GHz
Radeon RX 5700 (Desktop)
48.9 [X] AMD Radeon RX 5700 AMD Ryzen 9 7900X 4.7GHz
Radeon RX 5700 (Desktop)
min:
39.8 fps, P0.1:
43.2 fps, P1:
44.9 fps, max:
62.5 fps
~ 48 fps
+ Compare
- Hide Comparison
+ 📈 Graph
- 📈 Hide Graph
...
AMD Radeon RX 5700 (Desktop)
...
» With all tested laptops playable in detail settings ultra.
Additional Benchmarks
Ultra Graphics & Postprocessing (HBAO+) 3840x2160
35.6 [X] AMD Ryzen 7 2700X 3.7GHz
Radeon RX 5700 (Desktop)
min:
32 fps, max:
40 fps
35.8 [X] AMD Radeon RX 5700 AMD Ryzen 9 7950X 4.5GHz
Radeon RX 5700 (Desktop)
Medium Graphics & Postprocessing 1920x1080
173.8 [X] AMD Radeon RX 5700 AMD Ryzen 9 7950X 4.5GHz
Radeon RX 5700 (Desktop)
167 [X] AMD Ryzen 7 2700X 3.7GHz
Radeon RX 5700 (Desktop)
min:
3.3 fps, P1:
100 fps, max:
310 fps
187.3 [X] AMD Radeon RX 5700 AMD Ryzen 9 7900X 4.7GHz
Radeon RX 5700 (Desktop)
min:
5.74 fps, P1:
200 fps, max:
668 fps
~ 177 fps
+ Compare
- Hide Comparison
...
AMD Radeon RX 5700 (Desktop)
...
161 [X] AMD Ryzen 7 2700X 3.7GHz
Radeon RX 5700 (Desktop)
min:
4.52 fps, P1:
100 fps, max:
269 fps
187.1 [X] AMD Radeon RX 5700 AMD Ryzen 9 7900X 4.7GHz
Radeon RX 5700 (Desktop)
min:
8.69 fps, P1:
200 fps, max:
499 fps
187.9 [X] AMD Radeon RX 5700 AMD Ryzen 9 7950X 4.5GHz
Radeon RX 5700 (Desktop)
min:
6.57 fps, P1:
200 fps, max:
665 fps
~ 179 fps
+ Compare
- Hide Comparison
...
AMD Radeon RX 5700 (Desktop)
...
142 [X] AMD Ryzen 7 2700X 3.7GHz
Radeon RX 5700 (Desktop)
min:
3.33 fps, P1:
76.9 fps, max:
266 fps
178.3 [X] AMD Radeon RX 5700 AMD Ryzen 9 7900X 4.7GHz
Radeon RX 5700 (Desktop)
min:
8.48 fps, P1:
111.1 fps, max:
404 fps
180.7 [X] AMD Radeon RX 5700 AMD Ryzen 9 7950X 4.5GHz
Radeon RX 5700 (Desktop)
min:
4.87 fps, P1:
142.9 fps, max:
550 fps
~ 167 fps
+ Compare
- Hide Comparison
...
AMD Radeon RX 5700 (Desktop)
...
83 [X] AMD Ryzen 7 2700X 3.7GHz
Radeon RX 5700 (Desktop)
min:
6.93 fps, P1:
52.6 fps, max:
165 fps
96.2 [X] AMD Radeon RX 5700 AMD Ryzen 9 7900X 4.7GHz
Radeon RX 5700 (Desktop)
min:
17.3 fps, P1:
71.4 fps, max:
185 fps
96.2 [X] AMD Radeon RX 5700 AMD Ryzen 9 7950X 4.5GHz
Radeon RX 5700 (Desktop)
min:
17 fps, P1:
71.4 fps, max:
230 fps
~ 92 fps
+ Compare
- Hide Comparison
...
AMD Radeon RX 5700 (Desktop)
...
71.6 [X] AMD Radeon RX 5700 AMD Ryzen 9 7900X 4.7GHz
Radeon RX 5700 (Desktop)
min:
9.8 fps, P1:
52.6 fps, max:
297 fps
72.3 [X] AMD Radeon RX 5700 AMD Ryzen 9 7950X 4.5GHz
Radeon RX 5700 (Desktop)
min:
12.8 fps, P1:
52.6 fps, max:
186.3 fps
~ 72 fps
+ Compare
- Hide Comparison
...
AMD Radeon RX 5700 (Desktop)
...
71.3 [X] AMD Radeon RX 5700 AMD Ryzen 9 7900X 4.7GHz
Radeon RX 5700 (Desktop)
min:
19.4 fps, P1:
55.6 fps, max:
185.7 fps
71.6 [X] AMD Radeon RX 5700 AMD Ryzen 9 7950X 4.5GHz
Radeon RX 5700 (Desktop)
min:
8.28 fps, P1:
55.6 fps, max:
278 fps
82 [X] AMD Ryzen 7 2700X 3.7GHz
Radeon RX 5700 (Desktop)
min:
13.1 fps, P1:
66.7 fps, max:
128 fps
~ 75 fps
+ Compare
- Hide Comparison
...
AMD Radeon RX 5700 (Desktop)
...
» With all tested laptops playable in detail settings ultra.
Additional Benchmarks
Highest Settings possible 16xAF 4xMSAA + FXAA 3840x2160
38.4 [X] AMD Radeon RX 5700 AMD Ryzen 9 7900X 4.7GHz
Radeon RX 5700 (Desktop)
min:
7.47 fps, P1:
27.8 fps, max:
280 fps
38.5 [X] AMD Radeon RX 5700 AMD Ryzen 9 7950X 4.5GHz
Radeon RX 5700 (Desktop)
min:
8.73 fps, P1:
27.8 fps, max:
186.5 fps
Normal/Off 4xAF 1920x1080
187.1 [X] AMD Radeon RX 5700 AMD Ryzen 9 7900X 4.7GHz
Radeon RX 5700 (Desktop)
min:
9.85 fps, P1:
200 fps, max:
387 fps
187.9 [X] AMD Radeon RX 5700 AMD Ryzen 9 7950X 4.5GHz
Radeon RX 5700 (Desktop)
min:
6.44 fps, P1:
200 fps, max:
694 fps
Lowest Settings possible 1920x1080
187.4 [X] AMD Radeon RX 5700 AMD Ryzen 9 7900X 4.7GHz
Radeon RX 5700 (Desktop)
min:
55.4 fps, P1:
200 fps, max:
665 fps
187.8 [X] AMD Radeon RX 5700 AMD Ryzen 9 7950X 4.5GHz
Radeon RX 5700 (Desktop)
min:
9.02 fps, P1:
200 fps, max:
650 fps
 Deutsch
 English
 Español
 Français
 Italiano
 Nederlands
 Polski
 Português
 Русский
 Türkçe
 Svenska
 Chinese
 Magyar