 Deutsch
 English
 Español
 Français
 Italiano
 Nederlands
 Polski
 Português
 Русский
 Türkçe
 Svenska
 Chinese
 Magyar
Intel Arc A570M vs NVIDIA RTX A4000 Laptop GPU vs Intel Arc A310
Intel Arc A570M
► remove from comparison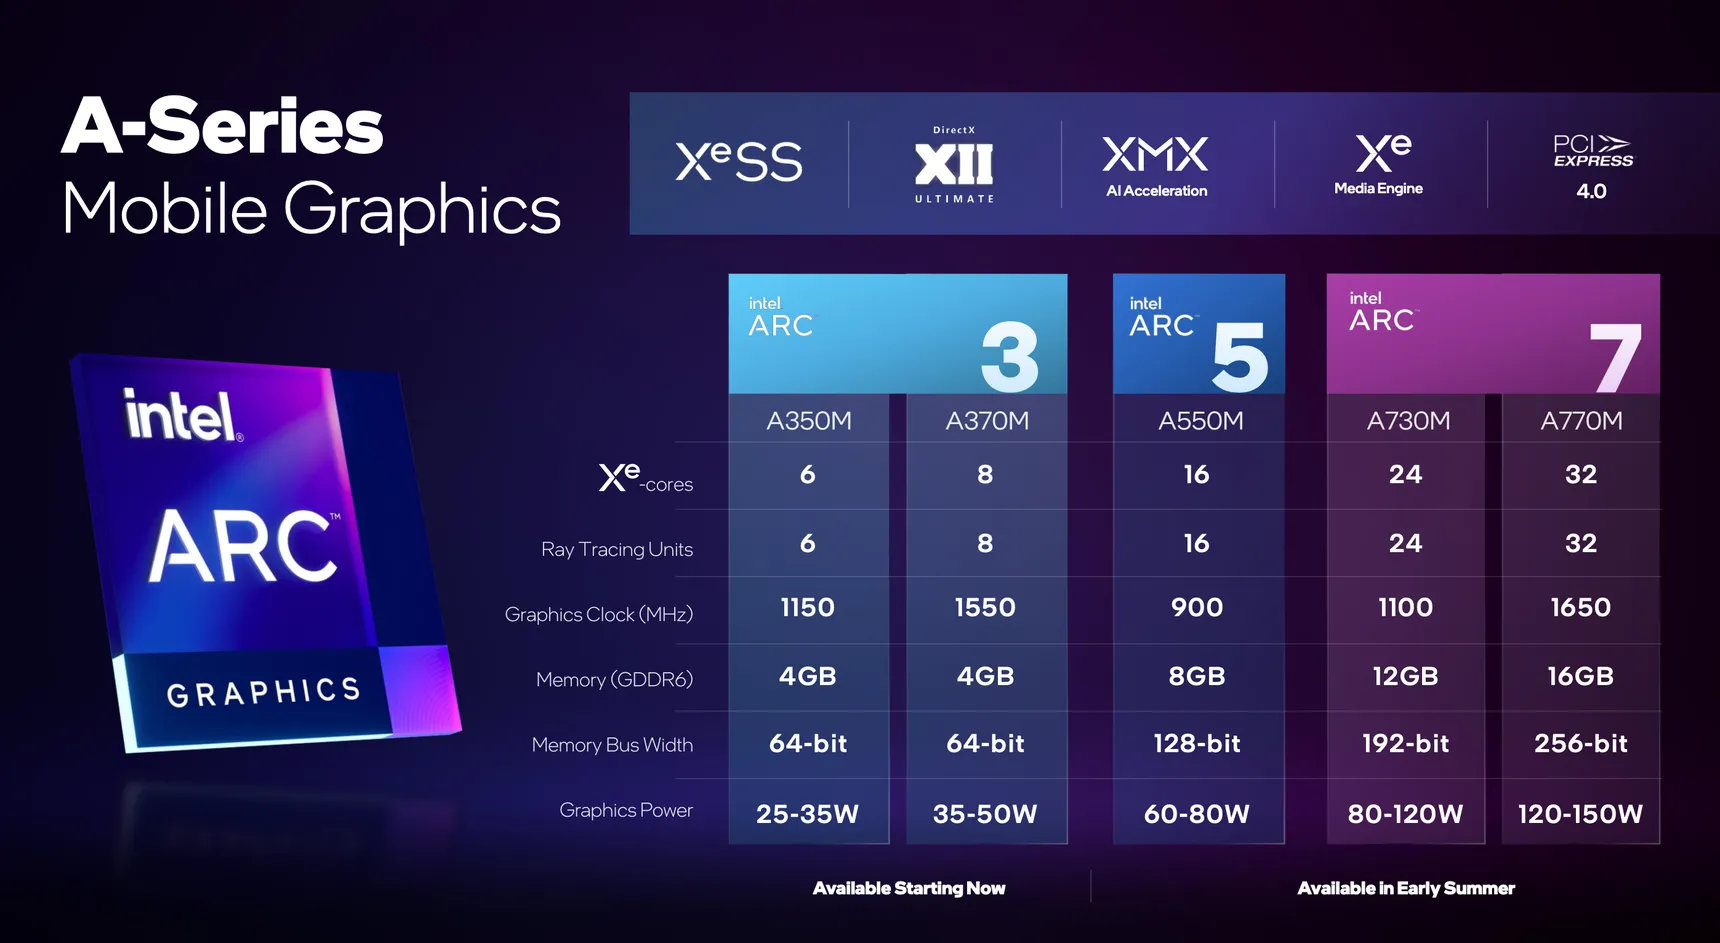
The Intel Arc A570M (device ID 5696) is a dedicated mobile lower- mid-range graphics card for laptops based on Xe HPG microarchitecture. It uses the ACM-G12 chip and offers all 16 Xe-cores (256 ALUs), 16 ray tracing units and a 128-bit memory bus for 8 GB GDDR6 graphics memory. The cores can clock from 300 MHz (low frequency mode) to 1300 MHz (high frequency) or in short bursts 2050+ MHz (short bursts / Turbo).
The performance of the Arc A570M should be between the Radeon RX 6500M and 6600M and therefore well suited even for demanding games in medium to high detail settings and 1080p. The slower Arc A370M is based on the smaller ACM-G11 chip and should be significantly slower, the similar Arc A550M is a slower clocked variant with a slightly lower TDP.
The chip also integrates two media engines for VP9, AVC, HEVC, and AV1 8k en- and decoding. The 4 display pipes support up to 4x 4k120 HDR via DMI 2.0B or DisplayPort 2.0 10G.
The A570M is produced in 6nm at TSMC (N6 process) and supports dynamic power share (using Deep Link) with 12th gen Intel CPUs (Alder Lake).
NVIDIA RTX A4000 Laptop GPU
► remove from comparison
The NVIDIA RTX A4000 Laptop GPU or A4000 Mobile is a professional graphics card for mobile workstations. It is based on the GA104 Ampere chip and similar to the consumer GeForce RTX 3080 Laptop GPU. It offers the same 5.120 graphics cores, 40 RT cores, 160 Tensor cores and 8 GB GDDR6 graphics memory with a 256 Bit memory bus. It supports PCIe 4.0 and will be available in different variants from 80 - 140 Watt (TGP) with different clock speeds (and performance). The GPU supports eDP 1.4b to connect the internal monitor and DisplayPort 1.4 and HDMI 2.1 for external connections.
There is no more Max-Q variant (formerly used for the low power variants) but every OEM can choose to implement Max-Q technologies (Dynamic Boost, WhisperMode).
The raw performance should be similar to the GeForce RTX 3070 for laptops at the same TGP level. Both GPUs depend heavily on good cooling and a high TGP for good performance. At a similar power consumption level the RTX A4000 should be clearly faster than the old Quadro RTX 4000 and 4000 Max-Q. The desktop variant of the A4000 however, is a lot faster.
The GA104 chip offers 6,144 FP32 ALUs of which half can also execute INT32 instructions (i.e. 3,072 INT32 ALUs). With Turing all shaders could still execute FP32 or INT32 instructions. The raytracing and tensor cores on the chip were also improved according to Nvidia. The A4000 only uses 5,120 of the 6,144 CUDA cores. The Ampere chips also include an improved 5th generation video encoder (NVENC for H.264 and H.265) and a 7th generation decoder (for various formats now including AV1).
The GA104 chip is manufactured by Samsung in 8nm (8N), which is not quite able to keep up with the 7nm node at TSMC (e.g. used by AMD and also for the professional GA100 Ampere chip).
Intel Arc A310
► remove from comparison
The Intel Arc A310 is a dedicated entry-level graphics card from Intel for desktops. It is based on the ACM-G11 chip and offers 6 of the 8 Xe cores (96 ALUs), 6 of the 8 ray tracing units, 1.152 MB L1 cache and 4MB L2 cache. The memory interface is 64 bits wide and supports 4GB GDDR6 graphics memory with 15.5 Gbps. The TGP is between 40 and 75 watts depending on the model.
The A310 is similar to the mobile Arc A350Mexcept for the higher clock rates of the cores and memory.
The ACM-G11 chip is manufactured at TSMC in 6nm (N6 process) and offers 7.2 billion transistors and is 157 mm2 in size. It integrates two media engines for VP9, AVC, HEVC, AV1 8k60 12-bit HDR decoding and 8k 10-bit HDR encoding. The integrated 4 display pipes support 4x 4k120 HDR, HDMI 2.0B, DP 2.0 10G and Adaptive Sync.
| Intel Arc A570M | NVIDIA RTX A4000 Laptop GPU | Intel Arc A310 | |||||||||||||||||||||||||||||||||||||||||||||||||||||||||||||||||||||||||||||||||||||||||||||||||
| Arc Series |
|
|
| ||||||||||||||||||||||||||||||||||||||||||||||||||||||||||||||||||||||||||||||||||||||||||||||||
| Codename | Alchemist | GA104 | Alchemist | ||||||||||||||||||||||||||||||||||||||||||||||||||||||||||||||||||||||||||||||||||||||||||||||||
| Architecture | Xe HPG | Ampere | Xe HPG | ||||||||||||||||||||||||||||||||||||||||||||||||||||||||||||||||||||||||||||||||||||||||||||||||
| Pipelines | 16 - unified | 5120 - unified | 6 - unified | ||||||||||||||||||||||||||||||||||||||||||||||||||||||||||||||||||||||||||||||||||||||||||||||||
| TMUs | 128 | 160 | |||||||||||||||||||||||||||||||||||||||||||||||||||||||||||||||||||||||||||||||||||||||||||||||||
| ROPs | 64 | 80 | |||||||||||||||||||||||||||||||||||||||||||||||||||||||||||||||||||||||||||||||||||||||||||||||||
| Raytracing Cores | 16 | 40 | 6 | ||||||||||||||||||||||||||||||||||||||||||||||||||||||||||||||||||||||||||||||||||||||||||||||||
| Core Speed | 900 - 1300 (Boost) MHz | 780 - 1680 (Boost) MHz | 2000 (Boost) MHz | ||||||||||||||||||||||||||||||||||||||||||||||||||||||||||||||||||||||||||||||||||||||||||||||||
| Cache | L2: 8 MB | L2: 4 MB | L1: 1.1 MB, L2: 4 MB | ||||||||||||||||||||||||||||||||||||||||||||||||||||||||||||||||||||||||||||||||||||||||||||||||
| Memory Speed | 14000 effective = 1750 MHz | 12000 effective = 1500 MHz | 15500 MHz | ||||||||||||||||||||||||||||||||||||||||||||||||||||||||||||||||||||||||||||||||||||||||||||||||
| Memory Bus Width | 128 Bit | 256 Bit | 64 Bit | ||||||||||||||||||||||||||||||||||||||||||||||||||||||||||||||||||||||||||||||||||||||||||||||||
| Memory Type | GDDR6 | GDDR6 | GDDR6 | ||||||||||||||||||||||||||||||||||||||||||||||||||||||||||||||||||||||||||||||||||||||||||||||||
| Max. Amount of Memory | 8 GB | 8 GB | 4 GB | ||||||||||||||||||||||||||||||||||||||||||||||||||||||||||||||||||||||||||||||||||||||||||||||||
| Shared Memory | no | no | no | ||||||||||||||||||||||||||||||||||||||||||||||||||||||||||||||||||||||||||||||||||||||||||||||||
| Memory Bandwidth | 224 GB/s | 384 GB/s | 124 GB/s | ||||||||||||||||||||||||||||||||||||||||||||||||||||||||||||||||||||||||||||||||||||||||||||||||
| API | DirectX 12_2, Shader 6.6, OpenGL 4.6, OpenCL 3.0, Vulkan 1.3 | DirectX 12_2, Shader 6.7, OpenGL 4.6 | DirectX 12_2, OpenGL 4.6, Vulkan 1.3 | ||||||||||||||||||||||||||||||||||||||||||||||||||||||||||||||||||||||||||||||||||||||||||||||||
| Power Consumption | 75 Watt (75 - 95 Watt TGP) | 140 Watt (80 - 125 Watt TGP) | 75 Watt (40 - 75 Watt TGP) | ||||||||||||||||||||||||||||||||||||||||||||||||||||||||||||||||||||||||||||||||||||||||||||||||
| technology | 6 nm | 8 nm | 6 nm | ||||||||||||||||||||||||||||||||||||||||||||||||||||||||||||||||||||||||||||||||||||||||||||||||
| PCIe | 4 16x | 4.0 | 4 8x | ||||||||||||||||||||||||||||||||||||||||||||||||||||||||||||||||||||||||||||||||||||||||||||||||
| Displays | 4 Displays (max.), HDMI 2.0b, DisplayPort 2.0 10G Ready | HDMI 2.1, DisplayPort 1.4 | 4 Displays (max.), HDMI 2.0b, DisplayPort 2.0 10G Ready | ||||||||||||||||||||||||||||||||||||||||||||||||||||||||||||||||||||||||||||||||||||||||||||||||
| Date of Announcement | 31.07.2023 | 12.04.2021 | 01.09.2022 | ||||||||||||||||||||||||||||||||||||||||||||||||||||||||||||||||||||||||||||||||||||||||||||||||
| Link to Manufacturer Page | www.intel.com | www.nvidia.com | www.intel.com | ||||||||||||||||||||||||||||||||||||||||||||||||||||||||||||||||||||||||||||||||||||||||||||||||
| Tensor / AI Cores | 160 | ||||||||||||||||||||||||||||||||||||||||||||||||||||||||||||||||||||||||||||||||||||||||||||||||||
| Theoretical Performance | 17.8 TFLOPS FP32 | ||||||||||||||||||||||||||||||||||||||||||||||||||||||||||||||||||||||||||||||||||||||||||||||||||
| Features | DisplayPort 1.4, HDMI 2.1, PCIe 4.0 x16, 17.8 SP-FP TFLOPS Peak, 143 Tensor Performance Peak, up to 384 GB/s Memory Bandwidth, Resizable BAR, Support for Modern Standby | ||||||||||||||||||||||||||||||||||||||||||||||||||||||||||||||||||||||||||||||||||||||||||||||||||
| Notebook Size | large | ||||||||||||||||||||||||||||||||||||||||||||||||||||||||||||||||||||||||||||||||||||||||||||||||||
| Transistors | 7.2 Billion | ||||||||||||||||||||||||||||||||||||||||||||||||||||||||||||||||||||||||||||||||||||||||||||||||||
| Die Size | 157 mm² |


