Intel Arc A350M vs NVIDIA RTX A3000 Laptop GPU
Intel Arc A350M ► remove from comparison
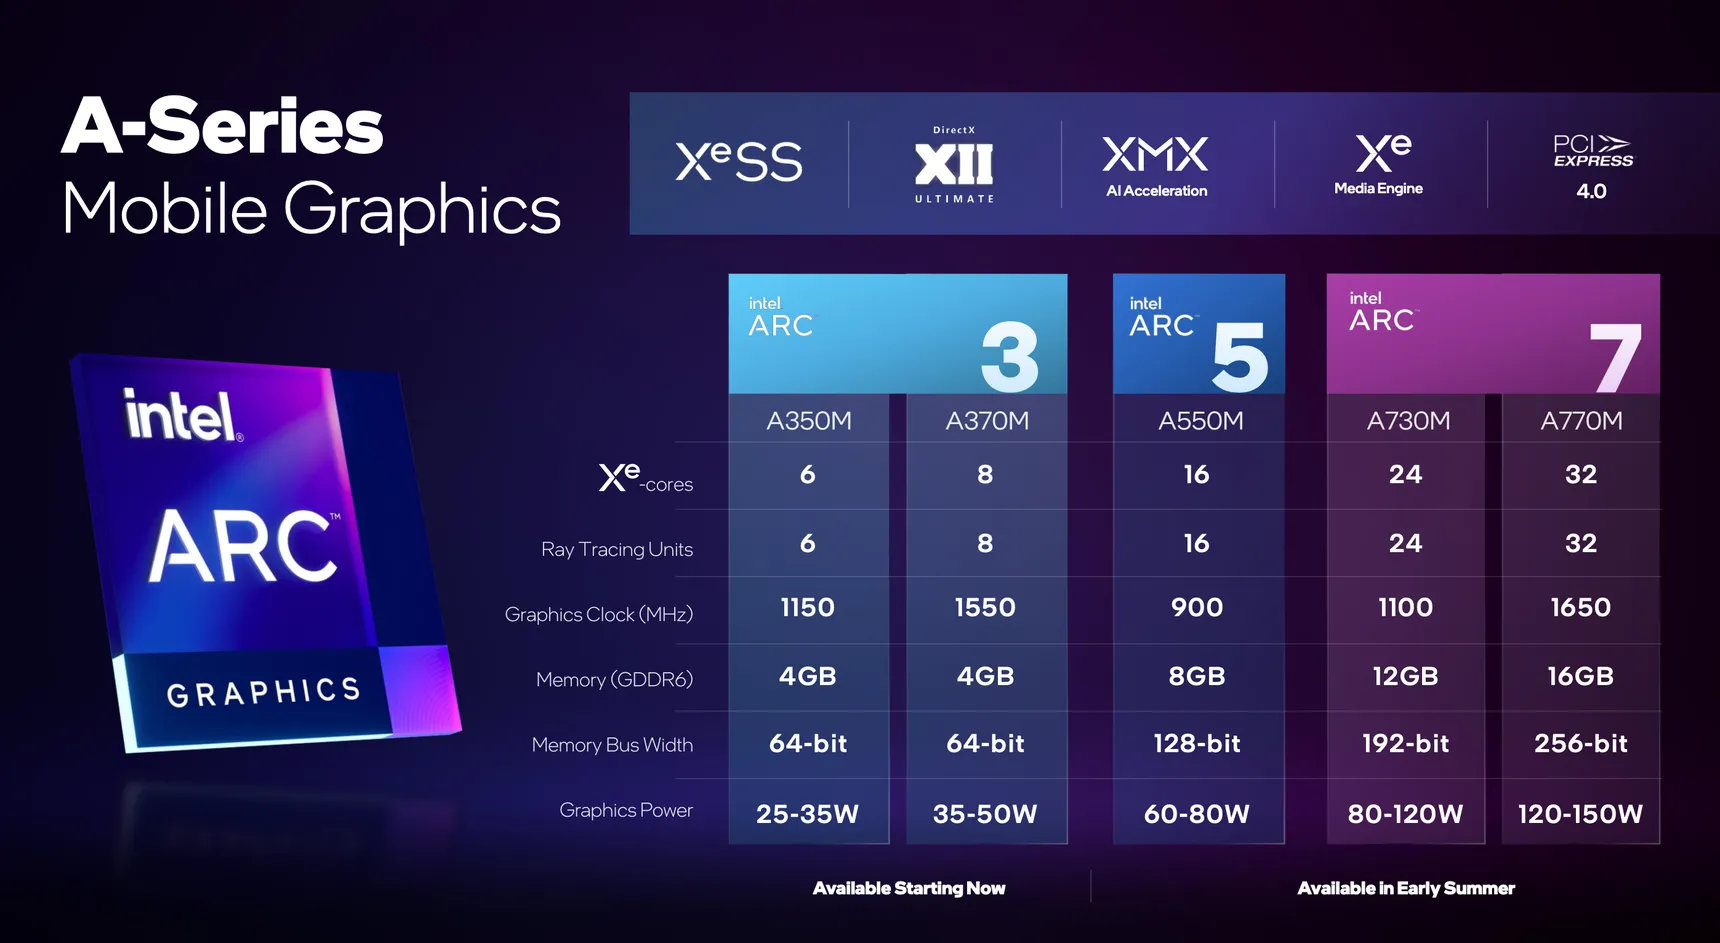
The Intel Arc A350M is a dedicated mobile entry level graphics card for laptops based on Xe HPG microarchitecture. It uses the ACM-G11 chip and offers 6 of the 8 Xe-cores (95 ALUs), 6 of the 8 ray tracing units and a 64-bit memory bus for 4 GB GDDR6 graphics memory. The chip integrates 7.2 billion transistors and the die measures 157 mm2.
The chip also integrates two media engines for VP9, AVC, HEVC, and AV1 8k en- and decoding. The 4 display pipes support up to 4x 4k120 HDR via DMI 2.0B or DisplayPort 2.0 10G.
The A350M is produced in 6nm at TSMC (N6 process) and supports dynamic power share (using Deep Link) with 12th gen Intel CPUs (Alder Lake).
NVIDIA RTX A3000 Laptop GPU ► remove from comparison
The NVIDIA RTX A3000 Laptop GPU or A3000 Mobile is a professional graphics card for mobile workstations. It is based on the GA104 Ampere chip and offers a similar performance to the consumer GeForce RTX 3060 Laptop GPU. However, it offers 256 more CUDA cores (4,096 versus 3,840) and is based on the bigger GA104 chip. The A3000 also supports PCIe 4.0 and integrates 32 RT-cores and 128 Tensor cores of the Ampere generation. It is available in different variants from 60 - 130 Watt (TGP) with different clock speeds (and performance). The GPU supports eDP 1.4b to connect the internal monitor and DisplayPort 1.4 and HDMI 2.1 for external connections.
In 2022 Nvidia released a slightly improved version of the RTX A3000 with more and faster graphics memory. The original 6 GB with 11 Gbits has been doubled to 12 GB GDDR6 clocked at 14 Gbits.
There is no more Max-Q variant (formerly used for the low power variants) but every OEM can choose to implement Max-Q technologies (Dynamic Boost, WhisperMode).
The raw performance should be similar to the GeForce RTX 3060 for laptops at the same TGP level. Both GPUs depend heavily on good cooling and a high TGP for good performance. At a similar power consumption level the RTX A3000 should be clearly faster than the old Quadro RTX 3000 and 3000 Max-Q .
The GA104 chip offers 6,144 FP32 ALUs of which half can also execute INT32 instructions (i.e. 3,072 INT32 ALUs). With Turing all shaders could still execute FP32 or INT32 instructions. The raytracing and tensor cores on the chip were also improved according to Nvidia. The A3000 only uses 4,096 of the 6,144 CUDA cores. The Ampere chips also include an improved 5th generation video encoder (NVENC for H.264 and H.265) and a 7th generation decoder (for various formats now including AV1).
The GA104 chip is manufactured by Samsung in 8nm (8N), which is not quite able to keep up with the 7nm node at TSMC (e.g. used by AMD and also for the professional GA100 Ampere chip).
Intel Arc A350M NVIDIA RTX A3000 Laptop GPU RTX A Series Arc A770 4096 @ 2.1 - 2.4 GHz 256 Bit @ 16000 MHz Arc A750 3584 @ 2.05 - 2.4 GHz 256 Bit @ 16000 MHz Arc A580 3072 @ 1.7 - 2 GHz 256 Bit @ 16000 MHz A770M 4096 @ 1.65 GHz 256 Bit @ 16000 MHz A730M 3072 @ 1.1 GHz 192 Bit @ 14000 MHz A570M 16 @ 0.9 - 1.3 GHz 128 Bit @ 14000 MHz A550M 16 @ 0.9 - 2.01 GHz 128 Bit @ 14000 MHz A530M 12 @ 0.9 - 1.3 GHz 128 Bit @ 14000 MHz A370M 8 @ 1.55 GHz 64 Bit @ 14000 MHz Arc A380 1024 @ 2 GHz 96 Bit @ 15500 MHz A310 6 @ 2 GHz 64 Bit @ 15500 MHz A350M 6 @ 1.15 GHz 64 Bit @ 14000 MHz
Codename Alchemist GA104 Architecture Xe HPG Ampere Pipelines 6 - unified 4096 - unified Raytracing Cores 6 32 Core Speed 1150 MHz 1080 - 1560 (Boost) MHz Cache L1: 1.1 MB, L2: 4 MB Memory Speed 14000 MHz 14000 effective = 1750 MHz Memory Bus Width 64 Bit 192 Bit Memory Type GDDR6 GDDR6 Max. Amount of Memory 4 GB 12 GB Shared Memory no no Memory Bandwidth 112 GB/s 264 GB/s API DirectX 12_2, OpenGL 4.6, Vulkan 1.3 DirectX 12_2, Shader 6.7, OpenGL 4.6 Power Consumption 35 Watt (25 - 35 Watt TGP) 130 Watt (60 - 115 Watt TGP) Transistors 7.2 Billion 17.4 Billion Die Size 157 mm² 392 mm² technology 6 nm 8 nm PCIe 4 8x 4.0 Displays 4 Displays (max.), HDMI 2.0b, DisplayPort 2.0 10G Ready HDMI 2.1, DisplayPort 1.4 Date of Announcement 30.03.2022 12.04.2021 Link to Manufacturer Page ark.intel.com www.nvidia.com TMUs 128 ROPs 64 Tensor / AI Cores 128 Features DisplayPort 1.4, HDMI 2.1, PCIe 4.0 x16, 12.8 SP-FP TFLOPS Peak, 102 Tensor Performance Peak, up to 264 GB/s Memory Bandwidth, Resizable BAR, Support for Modern Standby Notebook Size large
Benchmarks 3DMark - 3DMark Time Spy Score
min: 2976 avg: 3289 median: 3397 (10%) max: 3494 Points
GPU TDP ? TDP 35 W 100% 86%
min: 6490 avg: 7324 median: 7703 (22%) max: 7779 Points
GPU TDP ? TDP 35 W TDP 80 W TDP 90 W TDP 110 W 44% 38% 83% 99% 100%
3DMark - 3DMark Time Spy Graphics
min: 2731 avg: 2993 median: 3050 (8%) max: 3197 Points
GPU TDP ? TDP 35 W 100% 87%
min: 6530 avg: 7129 median: 7320 (19%) max: 7536 Points
GPU TDP ? TDP 35 W TDP 80 W TDP 90 W TDP 110 W 41% 36% 87% 97% 100%
3DMark - 3DMark Cloud Gate Score
min: 23965 avg: 25147 median: 25146.5 (27%) max: 26328 Points
GPU TDP ? TDP 35 W 91% 100%
24449 Points (26%)
GPU TDP ? TDP 35 W TDP 80 W 91% 100% 93%
3DMark - 3DMark Cloud Gate Graphics
min: 28623 avg: 36315 median: 36314.5 (10%) max: 44006 Points
GPU TDP ? TDP 35 W 65% 100%
29996 Points (8%)
GPU TDP ? TDP 35 W TDP 80 W 65% 100% 68%
3DMark - 3DMark Fire Strike Standard Score
min: 5961 avg: 6267 median: 6009 (11%) max: 6832 Points
GPU TDP ? TDP 35 W 100% 94%
min: 15711 avg: 17366 median: 18097 (32%) max: 18291 Points
GPU TDP ? TDP 35 W TDP 80 W TDP 90 W TDP 110 W 35% 33% 86% 99% 100%
3DMark - 3DMark Fire Strike Standard Graphics
min: 6800 avg: 7088 median: 7147 (8%) max: 7318 Points
GPU TDP ? TDP 35 W 100% 94%
min: 17034 avg: 19054 median: 19710 (22%) max: 20417 Points
GPU TDP ? TDP 35 W TDP 80 W TDP 90 W TDP 110 W 35% 33% 83% 97% 100%
3DMark - 3DMark Wild Life Unlimited
19449 Points (10%)
3DMark - 3DMark Wild Life Extreme Unlimited
min: 5189 avg: 5300 median: 5299.5 (6%) max: 5410 Points
GPU TDP ? TDP 35 W 100% 96%
14526 Points (17%)
GPU TDP ? TDP 35 W TDP 90 W 37% 36% 100%
3DMark 11 - 3DM11 Performance Score
min: 10123 avg: 10766 median: 10766 (15%) max: 11409 Points
GPU TDP ? TDP 35 W 100% 89%
min: 20760 avg: 23171 median: 23888 (33%) max: 24865 Points
GPU TDP ? TDP 35 W TDP 80 W TDP 90 W TDP 110 W 46% 41% 83% 100% 96%
3DMark 11 - 3DM11 Performance GPU
min: 10687 avg: 10730 median: 10730 (9%) max: 10773 Points
GPU TDP ? TDP 35 W 100% 99%
min: 23699 avg: 25737 median: 25990 (22%) max: 27523 Points
GPU TDP ? TDP 35 W TDP 80 W TDP 90 W TDP 110 W 39% 39% 86% 94% 100%
3DMark Vantage + Intel Arc A350M 3DMark Vantage - 3DM Vant. Perf. total
31023 Points (9%)
3DM Vant. Perf. total + NVIDIA RTX A3000 Laptop GPU
71308 Points (21%)
GPU TDP 35 W TDP 110 W 44% 100%
3DM Vant. Perf. GPU no PhysX + Intel Arc A350M 3DMark Vantage - 3DM Vant. Perf. GPU no PhysX
28186 Points (16%)
3DM Vant. Perf. GPU no PhysX + NVIDIA RTX A3000 Laptop GPU
76250 Points (43%)
GPU TDP 35 W TDP 110 W 37% 100%
3DMark 06 3DMark 06 - Standard 1280x1024 + Intel Arc A350M
31625 Points (41%)
Unigine Valley 1.0 - Unigine Valley 1.0 DX
19.5 fps (6%)
Blender - Blender 3.3 Classroom CUDA *
60 Seconds (9%)
Blender - Blender 3.3 Classroom OPTIX *
34 Seconds (13%)
SPECviewperf 13 specvp13 sw-04 + Intel Arc A350M SPECviewperf 13 - specvp13 sw-04
57.6 fps (15%)
specvp13 sw-04 + NVIDIA RTX A3000 Laptop GPU
min: 149.8 avg: 152.7 median: 151.6 (41%) max: 156.7 fps
GPU TDP 35 W TDP 80 W TDP 90 W TDP 110 W 37% 96% 97% 100%
specvp13 snx-03 + Intel Arc A350M SPECviewperf 13 - specvp13 snx-03
3.2 fps (0%)
specvp13 snx-03 + NVIDIA RTX A3000 Laptop GPU
min: 232.9 avg: 254.1 median: 250.2 (28%) max: 279.21 fps
GPU TDP 35 W TDP 80 W TDP 90 W TDP 110 W 1% 83% 100% 90%
specvp13 showcase-02 + Intel Arc A350M SPECviewperf 13 - specvp13 showcase-02
27.7 fps (6%)
specvp13 showcase-02 + NVIDIA RTX A3000 Laptop GPU
min: 84.1 avg: 91.3 median: 89.9 (20%) max: 99.91 fps
GPU TDP 35 W TDP 80 W TDP 90 W TDP 110 W 28% 84% 100% 90%
specvp13 medical-02 + Intel Arc A350M SPECviewperf 13 - specvp13 medical-02
19.9 fps (4%)
specvp13 medical-02 + NVIDIA RTX A3000 Laptop GPU
min: 89.2 avg: 95.6 median: 94.8 (20%) max: 102.82 fps
GPU TDP 35 W TDP 80 W TDP 90 W TDP 110 W 19% 92% 100% 87%
specvp13 maya-05 + Intel Arc A350M SPECviewperf 13 - specvp13 maya-05
63.6 fps (7%)
specvp13 maya-05 + NVIDIA RTX A3000 Laptop GPU
min: 194.8 avg: 211.5 median: 211.4 (24%) max: 228.37 fps
GPU TDP 35 W TDP 80 W TDP 90 W TDP 110 W 28% 85% 100% 93%
specvp13 energy-02 + Intel Arc A350M SPECviewperf 13 - specvp13 energy-02
11.8 fps (4%)
specvp13 energy-02 + NVIDIA RTX A3000 Laptop GPU
min: 41.21 avg: 43.5 median: 44.1 (14%) max: 45.12 fps
GPU TDP 35 W TDP 80 W TDP 90 W TDP 110 W 26% 100% 98% 91%
specvp13 creo-02 + Intel Arc A350M SPECviewperf 13 - specvp13 creo-02
49.1 fps (7%)
specvp13 creo-02 + NVIDIA RTX A3000 Laptop GPU
min: 186.9 avg: 210.7 median: 209.6 (31%) max: 235.49 fps
GPU TDP 35 W TDP 80 W TDP 90 W TDP 110 W 21% 79% 100% 89%
specvp13 catia-05 + Intel Arc A350M SPECviewperf 13 - specvp13 catia-05
77 fps (9%)
specvp13 catia-05 + NVIDIA RTX A3000 Laptop GPU
min: 231.4 avg: 246.7 median: 252.3 (28%) max: 256.5 fps
GPU TDP 35 W TDP 80 W TDP 90 W TDP 110 W 30% 90% 98% 100%
specvp13 3dsmax-06 + Intel Arc A350M SPECviewperf 13 - specvp13 3dsmax-06
55.7 fps (10%)
specvp13 3dsmax-06 + NVIDIA RTX A3000 Laptop GPU
min: 145.9 avg: 168.6 median: 179 (31%) max: 181.04 fps
GPU TDP 35 W TDP 80 W TDP 90 W TDP 110 W 31% 81% 100% 99%
SPECviewperf 2020 specvp2020 solidworks-05 1080p + Intel Arc A350M SPECviewperf 2020 - specvp2020 solidworks-05 1080p
17.2 fps (3%)
specvp2020 solidworks-05 1080p + NVIDIA RTX A3000 Laptop GPU
min: 147.4 avg: 155.1 median: 147.9 (29%) max: 170.08 fps
GPU TDP 35 W TDP 80 W TDP 90 W TDP 110 W 10% 87% 100% 87%
specvp2020 snx-04 1080p + Intel Arc A350M SPECviewperf 2020 - specvp2020 snx-04 1080p
3.2 fps (1%)
specvp2020 snx-04 1080p + NVIDIA RTX A3000 Laptop GPU
min: 232.4 avg: 255.6 median: 249.8 (41%) max: 284.49 fps
GPU TDP 35 W TDP 80 W TDP 90 W TDP 110 W 1% 82% 100% 88%
specvp2020 medical-03 1080p + Intel Arc A350M SPECviewperf 2020 - specvp2020 medical-03 1080p
9.1 fps (6%)
specvp2020 medical-03 1080p + NVIDIA RTX A3000 Laptop GPU
min: 42.66 avg: 44.6 median: 44.4 (32%) max: 46.59 fps
GPU TDP 35 W TDP 80 W TDP 90 W TDP 110 W 19% 95% 100% 92%
specvp2020 maya-06 1080p + Intel Arc A350M SPECviewperf 2020 - specvp2020 maya-06 1080p
72 fps (10%)
specvp2020 maya-06 1080p + NVIDIA RTX A3000 Laptop GPU
min: 207 avg: 243.4 median: 236.8 (34%) max: 286.54 fps
GPU TDP 35 W TDP 80 W TDP 90 W TDP 110 W 25% 72% 100% 83%
specvp2020 energy-03 1080p + Intel Arc A350M SPECviewperf 2020 - specvp2020 energy-03 1080p
12 fps (10%)
specvp2020 energy-03 1080p + NVIDIA RTX A3000 Laptop GPU
min: 43.06 avg: 44.3 median: 44.7 (36%) max: 45.04 fps
GPU TDP 35 W TDP 80 W TDP 90 W TDP 110 W 27% 100% 99% 96%
specvp2020 creo-03 1080p + Intel Arc A350M SPECviewperf 2020 - specvp2020 creo-03 1080p
30.8 fps (15%)
specvp2020 creo-03 1080p + NVIDIA RTX A3000 Laptop GPU
min: 101.07 avg: 115.1 median: 119.7 (59%) max: 124.5 fps
GPU TDP 35 W TDP 80 W TDP 90 W TDP 110 W 25% 96% 81% 100%
specvp2020 catia-06 1080p + Intel Arc A350M SPECviewperf 2020 - specvp2020 catia-06 1080p
17.4 fps (11%)
specvp2020 catia-06 1080p + NVIDIA RTX A3000 Laptop GPU
min: 73.7 avg: 78.2 median: 80.3 (52%) max: 80.5 fps
GPU TDP 35 W TDP 80 W TDP 90 W TDP 110 W 22% 92% 100% 100%
specvp2020 3dsmax-07 1080p + Intel Arc A350M SPECviewperf 2020 - specvp2020 3dsmax-07 1080p
20.9 fps (9%)
specvp2020 3dsmax-07 1080p + NVIDIA RTX A3000 Laptop GPU
min: 69.7 avg: 83.6 median: 78.2 (35%) max: 103.02 fps
GPU TDP 35 W TDP 80 W TDP 90 W TDP 110 W 20% 68% 100% 76%
specvp2020 solidworks-05 4k + NVIDIA RTX A3000 Laptop GPU SPECviewperf 2020 - specvp2020 solidworks-05 4k
61.2 fps (18%)
specvp2020 snx-04 4k + NVIDIA RTX A3000 Laptop GPU SPECviewperf 2020 - specvp2020 snx-04 4k
130.3 fps (13%)
specvp2020 medical-03 4k + NVIDIA RTX A3000 Laptop GPU SPECviewperf 2020 - specvp2020 medical-03 4k
14.7 fps (14%)
specvp2020 maya-06 4k + NVIDIA RTX A3000 Laptop GPU SPECviewperf 2020 - specvp2020 maya-06 4k
103.6 fps (17%)
specvp2020 energy-03 4k + NVIDIA RTX A3000 Laptop GPU SPECviewperf 2020 - specvp2020 energy-03 4k
112 fps (25%)
specvp2020 creo-03 4k + NVIDIA RTX A3000 Laptop GPU SPECviewperf 2020 - specvp2020 creo-03 4k
73.3 fps (35%)
specvp2020 catia-06 4k + NVIDIA RTX A3000 Laptop GPU SPECviewperf 2020 - specvp2020 catia-06 4k
43.2 fps (28%)
specvp2020 3dsmax-07 4k + NVIDIA RTX A3000 Laptop GPU SPECviewperf 2020 - specvp2020 3dsmax-07 4k
49.7 fps (21%)
Cinebench R15 + Intel Arc A350M Cinebench R15 - Cinebench R15 OpenGL 64 Bit
min: 138.13 avg: 149.3 median: 149.3 (9%) max: 160.4 fps
GPU TDP ? TDP 35 W 86% 100%
Cinebench R15 OpenGL 64 Bit + NVIDIA RTX A3000 Laptop GPU
min: 135.8 avg: 240.9 median: 290 (17%) max: 297 fps
GPU TDP ? TDP 35 W TDP 80 W TDP 90 W TDP 110 W 47% 54% 100% 46% 98%
Cinebench R15 OpenGL Ref. Match 64 Bit + Intel Arc A350M Cinebench R15 - Cinebench R15 OpenGL Ref. Match 64 Bit
97.8 % (98%)
GPU TDP ? TDP 35 W 100% 100%
Cinebench R15 OpenGL Ref. Match 64 Bit + NVIDIA RTX A3000 Laptop GPU
min: 97.8 avg: 99 median: 99.6 (100%) max: 99.6 %
GPU TDP ? TDP 35 W TDP 80 W TDP 90 W TDP 110 W 98% 98% 100% 98% 100%
GFXBench - GFXBench 5.0 4K Aztec Ruins High Tier Offscreen
29.6 fps (12%)
GFXBench - GFXBench 5.0 Aztec Ruins High Tier Offscreen
62.8 fps (11%)
161.4 fps (29%)
GPU TDP 35 W TDP 110 W 39% 100%
GFXBench - GFXBench 5.0 Aztec Ruins Normal Tier Offscreen
160 fps (12%)
360.7 fps (27%)
GPU TDP 35 W TDP 110 W 44% 100%
GFXBench - GFXBench Car Chase Offscreen
125 fps (14%)
371 fps (42%)
GPU TDP 35 W TDP 110 W 34% 100%
GFXBench 3.1 - GFXBench Manhattan ES 3.1 Offscreen
194 fps (4%)
500 fps (11%)
GPU TDP 35 W TDP 110 W 39% 100%
GFXBench 3.0 - GFXBench 3.0 Manhattan Offscreen
309 fps (18%)
680 fps (40%)
GPU TDP 35 W TDP 110 W 45% 100%
GFXBench (DX / GLBenchmark) 2.7 + Intel Arc A350M GFXBench (DX / GLBenchmark) 2.7 - GFXBench T-Rex HD Offscreen C24Z16
640 fps (5%)
GFXBench T-Rex HD Offscreen C24Z16 + NVIDIA RTX A3000 Laptop GPU
1777 fps (14%)
GPU TDP 35 W TDP 110 W 36% 100%
LuxMark v2.0 64Bit - LuxMark v2.0 Room GPU
1062 Samples/s (5%)
2619 Samples/s (12%)
GPU TDP 35 W TDP 110 W 41% 100%
LuxMark v2.0 64Bit - LuxMark v2.0 Sala GPU
2796 Samples/s (5%)
6178 Samples/s (11%)
GPU TDP 35 W TDP 110 W 45% 100%
ComputeMark v2.1 - ComputeMark v2.1 Result
4447 Points (5%)
18652 Points (20%)
GPU TDP 35 W TDP 110 W 24% 100%
Power Consumption - Furmark Stress Test Power Consumption - external Monitor *
min: 60.5 avg: 69.4 median: 69.4 (10%) max: 78.3 Watt
GPU TDP ? TDP 35 W 100% 103%
min: 119 avg: 135.3 median: 134 (19%) max: 153 Watt
GPU TDP ? TDP 35 W TDP 80 W TDP 90 W TDP 110 W 114% 117% 103% 106% 100%
Power Consumption - The Witcher 3 Power Consumption - external Monitor *
min: 53.2 avg: 65.1 median: 65.1 (9%) max: 77 Watt
GPU TDP ? TDP 35 W 100% 104%
min: 137 avg: 141.8 median: 144 (20%) max: 144.5 Watt
GPU TDP ? TDP 35 W TDP 80 W TDP 90 W TDP 110 W 112% 116% 101% 100% 100%
Power Consumption - Witcher 3 Power Consumption *
min: 56.7 avg: 71.2 median: 71.2 (16%) max: 85.6 Watt
GPU TDP ? TDP 35 W 100% 108%
min: 150 avg: 152 median: 152.1 (33%) max: 154 Watt
GPU TDP ? TDP 35 W TDP 80 W TDP 90 W TDP 110 W 123% 132% 101% 101% 100%
Power Consumption - Witcher 3 ultra Power Efficiency
min: 0.2395 avg: 0.3 median: 0.3 (25%) max: 0.3245 fps per Watt
GPU TDP ? TDP 35 W 74% 100%
min: 0.4073 avg: 0.4 median: 0.4 (39%) max: 0.4532 fps per Watt
GPU TDP ? TDP 35 W TDP 80 W TDP 110 W 53% 72% 90% 100%
Power Consumption - Witcher 3 ultra Power Efficiency - external Monitor
0.3 fps per Watt (29%)
min: 0.446 avg: 0.5 median: 0.5 (39%) max: 0.4847 fps per Watt
GPU TDP 35 W TDP 80 W TDP 110 W 71% 92% 100%
Emissions Witcher 3 Fan Noise + Intel Arc A350M Emissions - Witcher 3 Fan Noise
47.5 dB(A) (76%)
Witcher 3 Fan Noise + NVIDIA RTX A3000 Laptop GPU
min: 44 avg: 44.5 median: 44.5 (71%) max: 44.9 dB(A)
GPU TDP 35 W TDP 80 W TDP 90 W 100% 95% 93%
Average Benchmarks Intel Arc A350M → 100% n=39 Average Benchmarks NVIDIA RTX A3000 Laptop GPU → 691% n=39
- Range of benchmark values for this graphics card
- Average benchmark values for this graphics card
* Smaller numbers mean a higher performance
1 This benchmark is not used for the average calculation
Game Benchmarks The following benchmarks stem from our benchmarks of review laptops. The performance depends on the used graphics memory, clock rate, processor, system settings, drivers, and operating systems. So the results don't have to be representative for all laptops with this GPU. For detailed information on the benchmark results, click on the fps number.
347%
RTX A3000 Laptop GPU:
181 fps
326%
RTX A3000 Laptop GPU:
167.5 fps
341%
RTX A3000 Laptop GPU:
120.9 fps
RTX A3000 Laptop GPU:
39 fps
RTX A3000 Laptop GPU:
26.2 fps
281%
RTX A3000 Laptop GPU:
77 fps
357%
RTX A3000 Laptop GPU:
66 fps
327%
RTX A3000 Laptop GPU:
53 fps
371%
RTX A3000 Laptop GPU:
43 fps
RTX A3000 Laptop GPU:
27 fps
160%
RTX A3000 Laptop GPU:
202 266 334 ~ 267 fps
255%
RTX A3000 Laptop GPU:
131 172 187 ~ 163 fps
RTX A3000 Laptop GPU:
26.9 fps
RTX A3000 Laptop GPU:
227 fps
RTX A3000 Laptop GPU:
146 fps
RTX A3000 Laptop GPU:
129 fps
RTX A3000 Laptop GPU:
118 fps
RTX A3000 Laptop GPU:
78 110 ~ 94 fps
RTX A3000 Laptop GPU:
64 71 ~ 68 fps
RTX A3000 Laptop GPU:
52 60 ~ 56 fps
RTX A3000 Laptop GPU:
45 51 ~ 48 fps
RTX A3000 Laptop GPU:
28 fps
RTX A3000 Laptop GPU:
14 fps
RTX A3000 Laptop GPU:
133 fps
RTX A3000 Laptop GPU:
90 fps
RTX A3000 Laptop GPU:
82 fps
RTX A3000 Laptop GPU:
77 fps
169%
RTX A3000 Laptop GPU:
110 fps
226%
RTX A3000 Laptop GPU:
79 fps
340%
RTX A3000 Laptop GPU:
68 fps
319%
RTX A3000 Laptop GPU:
51 fps
RTX A3000 Laptop GPU:
183 fps
RTX A3000 Laptop GPU:
111 fps
RTX A3000 Laptop GPU:
89 fps
RTX A3000 Laptop GPU:
72 fps
RTX A3000 Laptop GPU:
98 fps
RTX A3000 Laptop GPU:
93 fps
RTX A3000 Laptop GPU:
86 fps
RTX A3000 Laptop GPU:
39 fps
RTX A3000 Laptop GPU:
139 fps
RTX A3000 Laptop GPU:
104 fps
RTX A3000 Laptop GPU:
94 fps
RTX A3000 Laptop GPU:
83 fps
RTX A3000 Laptop GPU:
159 fps
RTX A3000 Laptop GPU:
133 fps
RTX A3000 Laptop GPU:
124 fps
RTX A3000 Laptop GPU:
120 fps
RTX A3000 Laptop GPU:
264 fps
RTX A3000 Laptop GPU:
164 fps
RTX A3000 Laptop GPU:
151 fps
RTX A3000 Laptop GPU:
114 fps
RTX A3000 Laptop GPU:
306 fps
RTX A3000 Laptop GPU:
173 fps
RTX A3000 Laptop GPU:
123 fps
RTX A3000 Laptop GPU:
87 fps
RTX A3000 Laptop GPU:
129 fps
RTX A3000 Laptop GPU:
115 fps
RTX A3000 Laptop GPU:
87 fps
RTX A3000 Laptop GPU:
69 fps
RTX A3000 Laptop GPU:
127 fps
RTX A3000 Laptop GPU:
103 fps
RTX A3000 Laptop GPU:
98 fps
RTX A3000 Laptop GPU:
87 fps
228%
RTX A3000 Laptop GPU:
324 344 365 ~ 344 fps
252%
RTX A3000 Laptop GPU:
152 164 183 ~ 166 fps
255%
RTX A3000 Laptop GPU:
121 134 151 ~ 135 fps
251%
RTX A3000 Laptop GPU:
108 114 118 ~ 113 fps
235%
RTX A3000 Laptop GPU:
85 87 ~ 86 fps
268%
RTX A3000 Laptop GPU:
51 fps
100%
A350M:
65 89 ~ 77 fps
173%
RTX A3000 Laptop GPU:
113 115 170 ~ 133 fps
100%
A350M:
39 44 ~ 42 fps
257%
RTX A3000 Laptop GPU:
84 111 128 ~ 108 fps
100%
A350M:
37 41 ~ 39 fps
256%
RTX A3000 Laptop GPU:
81 103 117 ~ 100 fps
100%
A350M:
35 38 ~ 37 fps
251%
RTX A3000 Laptop GPU:
77 108 ~ 93 fps
276%
RTX A3000 Laptop GPU:
62 76 ~ 69 fps
300%
RTX A3000 Laptop GPU:
36 fps
207%
RTX A3000 Laptop GPU:
40.5 fps
250%
RTX A3000 Laptop GPU:
130 160 176 ~ 155 fps
353%
RTX A3000 Laptop GPU:
45.6 50.7 ~ 48 fps
411%
RTX A3000 Laptop GPU:
28.8 fps
162%
RTX A3000 Laptop GPU:
156 164 182 ~ 167 fps
RTX A3000 Laptop GPU:
77.1 fps
251%
RTX A3000 Laptop GPU:
263 335 381 ~ 326 fps
275%
RTX A3000 Laptop GPU:
176 222 262 ~ 220 fps
100%
A350M:
41 45 ~ 43 fps
321%
RTX A3000 Laptop GPU:
112 151 152 ~ 138 fps
298%
RTX A3000 Laptop GPU:
45 fps
614%
RTX A3000 Laptop GPU:
53.5 71.3 ~ 62 fps
443%
RTX A3000 Laptop GPU:
49.2 fps
Average Gaming Intel Arc A350M → 100% Average Gaming 30-70 fps → 100%
Average Gaming NVIDIA RTX A3000 Laptop GPU → 290% Average Gaming 30-70 fps → 345%
 Deutsch
 English
 Español
 Français
 Italiano
 Nederlands
 Polski
 Português
 Русский
 Türkçe
 Svenska
 Chinese
 Magyar