Intel Arc A310 vs Intel HD Graphics P630
Intel Arc A310 ► remove from comparison
The Intel Arc A310 is a dedicated entry-level graphics card from Intel for desktops. It is based on the ACM-G11 chip and offers 6 of the 8 Xe cores (96 ALUs), 6 of the 8 ray tracing units, 1.152 MB L1 cache and 4MB L2 cache. The memory interface is 64 bits wide and supports 4GB GDDR6 graphics memory with 15.5 Gbps. The TGP is between 40 and 75 watts depending on the model.
The A310 is similar to the mobile Arc A350M except for the higher clock rates of the cores and memory.
The ACM-G11 chip is manufactured at TSMC in 6nm (N6 process) and offers 7.2 billion transistors and is 157 mm2 in size. It integrates two media engines for VP9, AVC, HEVC, AV1 8k60 12-bit HDR decoding and 8k 10-bit HDR encoding. The integrated 4 display pipes support 4x 4k120 HDR, HDMI 2.0B, DP 2.0 10G and Adaptive Sync.
Intel HD Graphics P630 ► remove from comparison
The Intel HD Graphics P630 (GT2) is an integrated graphics unit, which can be found in various Xeon workstation processors of the Kaby Lake generation. The "GT2" version of the Skylake GPU offers 24 Execution Units (EUs) clocked at up to 1050 MHz (depending on the CPU model). Due to its lack of dedicated graphics memory or eDRAM cache, the P630 has to access the main memory (2x 64bit DDR3L-1600 / DDR4-2133). It uses the same silicon as the consumer HD Graphics 630 in Kaby-Lake-H processors but features optimized drivers for workstaion and CAD software. According to Intel it is certified for 15 applications (see list ).
Performance
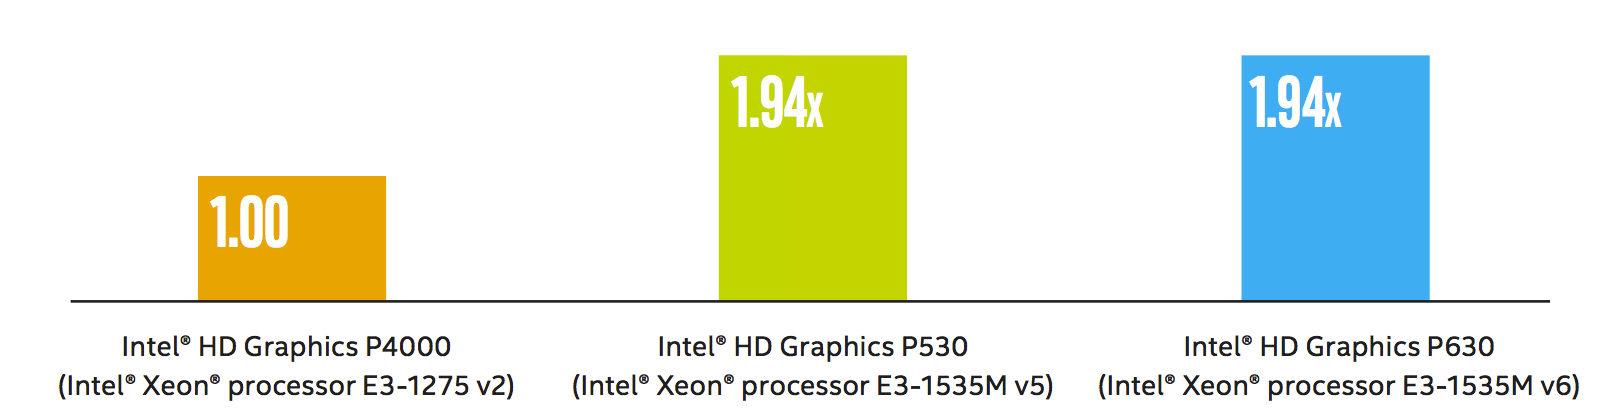
According to Intel, the performance of the P630 is identical to the Intel HD Graphis P530 (Skylake predecessor) processor graphics card and 1.94x faster than the old Intel HD Graphics P4000. Compared to consumer cards, the gaming performance should be on a similar level to the dedicated GeForce 920M and will handle old games (as of 2015) in low or medium settings.
Features
The revised video engine in the Kaby Lake chips now supports H.265/HEVC Main10 profile at 10-bit color depth and also the VP9 codec in hardware. Furthermore, HDCP 2.2 is also supported in all chips, which allows Netflix 4K videos, for instance.
Power Consumption
The HD Graphics P630 can be found in mobile quad-core Xeon processors with 45 W TDP and also desktop processors of the Xeon range with higher TDPs.
Source : http://www.intel.com/content/dam/www/public/us/en/documents/guides/hd-graphics-performance-guide.pdf
Intel Arc A310 Intel HD Graphics P630 Gen. 9.5 Series Arc A770 4096 @ 2.1 - 2.4 GHz 256 Bit @ 16000 MHz Arc A750 3584 @ 2.05 - 2.4 GHz 256 Bit @ 16000 MHz Arc A580 3072 @ 1.7 - 2 GHz 256 Bit @ 16000 MHz A770M 4096 @ 1.65 GHz 256 Bit @ 16000 MHz A730M 3072 @ 1.1 GHz 192 Bit @ 14000 MHz A570M 16 @ 0.9 - 1.3 GHz 128 Bit @ 14000 MHz A550M 16 @ 0.9 - 2.01 GHz 128 Bit @ 14000 MHz A530M 12 @ 0.9 - 1.3 GHz 128 Bit @ 14000 MHz A370M 8 @ 1.55 GHz 64 Bit @ 14000 MHz Arc A380 1024 @ 2 GHz 96 Bit @ 15500 MHz A310 6 @ 2 GHz 64 Bit @ 15500 MHz A350M 6 @ 1.15 GHz 64 Bit @ 14000 MHz
Codename Alchemist Kaby-Lake-H-GT2 Architecture Xe HPG Gen. 9.5 Kaby Lake Pipelines 6 - unified 24 - unified Raytracing Cores 6 Core Speed 2000 (Boost) MHz Cache L1: 1.1 MB, L2: 4 MB Memory Speed 15500 MHz Memory Bus Width 64 Bit 64/128 Bit Memory Type GDDR6 Max. Amount of Memory 4 GB Shared Memory no yes Memory Bandwidth 124 GB/s API DirectX 12_2, OpenGL 4.6, Vulkan 1.3 DirectX 12_1, OpenGL 4.4 Power Consumption 75 Watt (40 - 75 Watt TGP) Transistors 7.2 Billion Die Size 157 mm² technology 6 nm 14 nm PCIe 4 8x Displays 4 Displays (max.), HDMI 2.0b, DisplayPort 2.0 10G Ready Date of Announcement 01.09.2022 05.08.2015 Link to Manufacturer Page www.intel.com Features QuickSync
Benchmarks Performance Rating - 3DMark 11 + Fire Strike + Time Spy - A310
3.9 pt (12%)
...
...
max:
3DMark - 3DMark Time Spy Score
3743 Points (11%)
Model CPU GPU RAM Value Sparkle Intel Arc A310 Elf i9-13900K A310 75 W ? / 1937 MHz 4 GB 48 GB 3743
400 Points (1%)
GPU TDP ? TDP 75 W 11% 100%
3DMark - 3DMark Time Spy Graphics
3269 Points (9%)
Model CPU GPU RAM Value Sparkle Intel Arc A310 Elf i9-13900K A310 75 W ? / 1937 MHz 4 GB 48 GB 3269
3DMark - 3DMark Cloud Gate Score
44891 Points (48%)
Model CPU GPU RAM Value Sparkle Intel Arc A310 Elf i9-13900K A310 75 W ? / 1937 MHz 4 GB 48 GB 44891
8280 Points (9%)
GPU TDP ? TDP 75 W 18% 100%
3DMark - 3DMark Cloud Gate Graphics
53244 Points (14%)
Model CPU GPU RAM Value Sparkle Intel Arc A310 Elf i9-13900K A310 75 W ? / 1937 MHz 4 GB 48 GB 53244
3DMark - 3DMark Fire Strike Standard Score
8192 Points (14%)
Model CPU GPU RAM Value Sparkle Intel Arc A310 Elf i9-13900K A310 75 W ? / 1937 MHz 4 GB 48 GB 8192
1040 Points (2%)
GPU TDP ? TDP 75 W 13% 100%
3DMark - 3DMark Fire Strike Standard Graphics
8464 Points (10%)
Model CPU GPU RAM Value Sparkle Intel Arc A310 Elf i9-13900K A310 75 W ? / 1937 MHz 4 GB 48 GB 8464
3DMark - 3DMark Ice Storm Graphics
257130 Points (31%)
Model CPU GPU RAM Value Sparkle Intel Arc A310 Elf i9-13900K A310 75 W ? / 1937 MHz 4 GB 48 GB 257130
3DMark 11 - 3DM11 Performance Score
13031 Points (18%)
Model CPU GPU RAM Value Sparkle Intel Arc A310 Elf i9-13900K A310 75 W ? / 1937 MHz 4 GB 48 GB 13031
3DMark 11 - 3DM11 Performance GPU
11915 Points (10%)
Model CPU GPU RAM Value Sparkle Intel Arc A310 Elf i9-13900K A310 75 W ? / 1937 MHz 4 GB 48 GB 11915
3DMark Vantage + Intel Arc A310 3DMark Vantage - 3DM Vant. Perf. total
46839 Points (14%)
Model CPU GPU RAM Value Sparkle Intel Arc A310 Elf i9-13900K A310 75 W ? / 1937 MHz 4 GB 48 GB 46839
3DM Vant. Perf. GPU no PhysX + Intel Arc A310 3DMark Vantage - 3DM Vant. Perf. GPU no PhysX
39213 Points (22%)
Model CPU GPU RAM Value Sparkle Intel Arc A310 Elf i9-13900K A310 75 W ? / 1937 MHz 4 GB 48 GB 39213
3DMark 06 3DMark 06 - Standard 1280x1024 + Intel Arc A310
53771 Points (70%)
Model CPU GPU RAM Value 3DMark 06 - Standard 1280x1024 Sparkle Intel Arc A310 Elf (3DMark 06 - Standard 1280x1024) i9-13900K A310 75 W ? / 1937 MHz 4 GB 48 GB 53771
GFXBench - GFXBench 5.0 4K Aztec Ruins High Tier Offscreen
35.9 fps (15%)
Model CPU GPU RAM Value Sparkle Intel Arc A310 Elf i9-13900K A310 75 W ? / 1937 MHz 4 GB 48 GB 35.9
GFXBench - GFXBench 5.0 Aztec Ruins High Tier Offscreen
80.5 fps (15%)
Model CPU GPU RAM Value Sparkle Intel Arc A310 Elf i9-13900K A310 75 W ? / 1937 MHz 4 GB 48 GB 80.5
GFXBench - GFXBench 5.0 Aztec Ruins Normal Tier Offscreen
199.7 fps (15%)
Model CPU GPU RAM Value Sparkle Intel Arc A310 Elf i9-13900K A310 75 W ? / 1937 MHz 4 GB 48 GB 199.7
LuxMark v2.0 64Bit - LuxMark v2.0 Room GPU
854 Samples/s (4%)
Model CPU GPU RAM Value Sparkle Intel Arc A310 Elf i9-13900K A310 75 W ? / 1937 MHz 4 GB 48 GB 854
LuxMark v2.0 64Bit - LuxMark v2.0 Sala GPU
2784 Samples/s (5%)
Model CPU GPU RAM Value Sparkle Intel Arc A310 Elf i9-13900K A310 75 W ? / 1937 MHz 4 GB 48 GB 2784
ComputeMark v2.1 - ComputeMark v2.1 Result
5254 Points (6%)
Model CPU GPU RAM Value Sparkle Intel Arc A310 Elf i9-13900K A310 75 W ? / 1937 MHz 4 GB 48 GB 5254
Average Benchmarks Intel Arc A310 → 100% n=3 Average Benchmarks Intel HD Graphics P630 → 14% n=3
- Range of benchmark values for this graphics card
- Average benchmark values for this graphics card
* Smaller numbers mean a higher performance
1 This benchmark is not used for the average calculation
Game Benchmarks The following benchmarks stem from our benchmarks of review laptops. The performance depends on the used graphics memory, clock rate, processor, system settings, drivers, and operating systems. So the results don't have to be representative for all laptops with this GPU. For detailed information on the benchmark results, click on the fps number.
100%
A310:
62.5 [X] Sparkle Intel Arc A310 Elf Intel Core i9-13900K 3GHz
A310
min:
25.1 fps, P0.1:
27.7 fps, P1:
51.8 fps, max:
397 fps
fps
100%
A310:
53.4 [X] Sparkle Intel Arc A310 Elf Intel Core i9-13900K 3GHz
A310
min:
29.4 fps, P0.1:
30 fps, P1:
37.6 fps, max:
154.9 fps
fps
100%
A310:
39.6 [X] Sparkle Intel Arc A310 Elf Intel Core i9-13900K 3GHz
A310
min:
27.3 fps, P0.1:
27.5 fps, P1:
32.4 fps, max:
70.7 fps
fps
100%
A310:
30.9 [X] Sparkle Intel Arc A310 Elf Intel Core i9-13900K 3GHz
A310
min:
26.4 fps, P0.1:
26.5 fps, P1:
27.4 fps, max:
37.2 fps
fps
A310:
0 (!) [X] Sparkle Intel Arc A310 Elf Intel Core i9-13900K 3GHz
A310
fps
A310:
0 (!) [X] Sparkle Intel Arc A310 Elf Intel Core i9-13900K 3GHz
A310
fps
A310:
0 (!) [X] Sparkle Intel Arc A310 Elf Intel Core i9-13900K 3GHz
A310
fps
A310:
0 (!) [X] Sparkle Intel Arc A310 Elf Intel Core i9-13900K 3GHz
A310
fps
100%
A310:
22.4 [X] Sparkle Intel Arc A310 Elf Intel Core i9-13900K 3GHz
A310
min:
17.2 fps, P0.1:
17.2 fps, P1:
17.4 fps, max:
34 fps
fps
100%
A310:
19.5 [X] Sparkle Intel Arc A310 Elf Intel Core i9-13900K 3GHz
A310
min:
16.5 fps, P0.1:
16.6 fps, P1:
17.5 fps, max:
30 fps
fps
100%
A310:
16.7 [X] Sparkle Intel Arc A310 Elf Intel Core i9-13900K 3GHz
A310
min:
14.8 fps, P0.1:
14.9 fps, P1:
15.2 fps, max:
20.3 fps
fps
100%
A310:
16.3 [X] Sparkle Intel Arc A310 Elf Intel Core i9-13900K 3GHz
A310
min:
14.5 fps, P0.1:
14.7 fps, P1:
14.9 fps, max:
19.3 fps
fps
100%
A310:
20.4 [X] Sparkle Intel Arc A310 Elf Intel Core i9-13900K 3GHz
A310
min:
17.1 fps, P0.1:
17.2 fps, P1:
17.4 fps, max:
27.8 fps
fps
100%
A310:
18 [X] Sparkle Intel Arc A310 Elf Intel Core i9-13900K 3GHz
A310
min:
13.3 fps, P0.1:
13.6 fps, P1:
14.9 fps, max:
23.3 fps
fps
100%
A310:
13.8 [X] Sparkle Intel Arc A310 Elf Intel Core i9-13900K 3GHz
A310
min:
9.34 fps, P0.1:
9.47 fps, P1:
9.79 fps, max:
20.1 fps
fps
100%
A310:
9.9 [X] Sparkle Intel Arc A310 Elf Intel Core i9-13900K 3GHz
A310
min:
6.44 fps, P0.1:
6.45 fps, P1:
6.49 fps, max:
14.8 fps
fps
100%
A310:
38.3 [X] Sparkle Intel Arc A310 Elf Intel Core i9-13900K 3GHz
A310
min:
14.8 fps, P0.1:
15.2 fps, P1:
32.6 fps, max:
122.4 fps
fps
100%
A310:
33.2 [X] Sparkle Intel Arc A310 Elf Intel Core i9-13900K 3GHz
A310
min:
14.4 fps, P0.1:
14.8 fps, P1:
29.3 fps, max:
154.6 fps
fps
100%
A310:
23.2 [X] Sparkle Intel Arc A310 Elf Intel Core i9-13900K 3GHz
A310
min:
12.3 fps, P0.1:
13.2 fps, P1:
19.2 fps, max:
131.3 fps
fps
100%
A310:
20.9 [X] Sparkle Intel Arc A310 Elf Intel Core i9-13900K 3GHz
A310
min:
3.9 fps, P0.1:
5.05 fps, P1:
15.2 fps, max:
26.5 fps
fps
100%
A310:
260 [X] Sparkle Intel Arc A310 Elf Intel Core i9-13900K 3GHz
A310
min:
30 fps, P0.1:
103.3 fps, P1:
195.1 fps, max:
638 fps
fps
100%
A310:
154.7 [X] Sparkle Intel Arc A310 Elf Intel Core i9-13900K 3GHz
A310
min:
25.7 fps, P0.1:
55.4 fps, P1:
126.6 fps, max:
453 fps
fps
100%
A310:
141.6 [X] Sparkle Intel Arc A310 Elf Intel Core i9-13900K 3GHz
A310
min:
26.8 fps, P0.1:
62.4 fps, P1:
117.6 fps, max:
371 fps
fps
100%
A310:
102.2 [X] Sparkle Intel Arc A310 Elf Intel Core i9-13900K 3GHz
A310
min:
20.6 fps, P0.1:
42.2 fps, P1:
55.3 fps, max:
554 fps
fps
100%
A310:
75.6 [X] Sparkle Intel Arc A310 Elf Intel Core i9-13900K 3GHz
A310
min:
32.2 fps, P0.1:
35.1 fps, P1:
41.5 fps, max:
474 fps
fps
100%
A310:
58.3 [X] Sparkle Intel Arc A310 Elf Intel Core i9-13900K 3GHz
A310
min:
13.1 fps, P0.1:
20.1 fps, P1:
29.9 fps, max:
410 fps
fps
100%
A310:
34.6 [X] Sparkle Intel Arc A310 Elf Intel Core i9-13900K 3GHz
A310
min:
14.9 fps, P0.1:
16.6 fps, P1:
17.9 fps, max:
379 fps
fps
100%
A310:
75 [X] Sparkle Intel Arc A310 Elf Intel Core i9-13900K 3GHz
A310
min:
56.9 fps, P0.1:
59.1 fps, P1:
61.1 fps, max:
102 fps
fps
100%
A310:
53.1 [X] Sparkle Intel Arc A310 Elf Intel Core i9-13900K 3GHz
A310
min:
38.4 fps, P0.1:
39 fps, P1:
41 fps, max:
66.5 fps
fps
100%
A310:
46.6 [X] Sparkle Intel Arc A310 Elf Intel Core i9-13900K 3GHz
A310
min:
33.6 fps, P0.1:
34.2 fps, P1:
37.1 fps, max:
57.1 fps
fps
100%
A310:
34.6 [X] Sparkle Intel Arc A310 Elf Intel Core i9-13900K 3GHz
A310
min:
24.6 fps, P0.1:
25 fps, P1:
27.2 fps, max:
40.1 fps
fps
100%
A310:
16 [X] Sparkle Intel Arc A310 Elf Intel Core i9-13900K 3GHz
A310
min:
13 fps
fps
100%
A310:
14 [X] Sparkle Intel Arc A310 Elf Intel Core i9-13900K 3GHz
A310
min:
11 fps
fps
100%
A310:
11 [X] Sparkle Intel Arc A310 Elf Intel Core i9-13900K 3GHz
A310
min:
9 fps
fps
100%
A310:
8.1 [X] Sparkle Intel Arc A310 Elf Intel Core i9-13900K 3GHz
A310
min:
6 fps
fps
100%
A310:
34.3 [X] Sparkle Intel Arc A310 Elf Intel Core i9-13900K 3GHz
A310
min:
11.8 fps, P0.1:
12.3 fps, P1:
16.6 fps, max:
298 fps
fps
100%
A310:
27.3 [X] Sparkle Intel Arc A310 Elf Intel Core i9-13900K 3GHz
A310
min:
13.5 fps, P0.1:
13.6 fps, P1:
13.7 fps, max:
195.6 fps
fps
100%
A310:
18.6 [X] Sparkle Intel Arc A310 Elf Intel Core i9-13900K 3GHz
A310
min:
7.35 fps, P0.1:
10.1 fps, P1:
10.8 fps, max:
114.3 fps
fps
100%
A310:
16.8 [X] Sparkle Intel Arc A310 Elf Intel Core i9-13900K 3GHz
A310
min:
9.44 fps, P0.1:
9.52 fps, P1:
9.99 fps, max:
137.2 fps
fps
100%
A310:
16.3 [X] Sparkle Intel Arc A310 Elf Intel Core i9-13900K 3GHz
A310
min:
13.2 fps, P0.1:
13.3 fps, P1:
14.2 fps, max:
19.2 fps
fps
100%
A310:
13.9 [X] Sparkle Intel Arc A310 Elf Intel Core i9-13900K 3GHz
A310
min:
11.3 fps, P0.1:
11.3 fps, P1:
12.1 fps, max:
15.5 fps
fps
100%
A310:
12.3 [X] Sparkle Intel Arc A310 Elf Intel Core i9-13900K 3GHz
A310
min:
9.9 fps, P0.1:
9.96 fps, P1:
10.5 fps, max:
14 fps
fps
100%
A310:
22.7 [X] Sparkle Intel Arc A310 Elf Intel Core i9-13900K 3GHz
A310
min:
6.77 fps, P0.1:
7.06 fps, P1:
14.2 fps, max:
210 fps
fps
100%
A310:
22.2 [X] Sparkle Intel Arc A310 Elf Intel Core i9-13900K 3GHz
A310
min:
14.9 fps, P0.1:
15.6 fps, P1:
16.7 fps, max:
57.3 fps
fps
100%
A310:
18.4 [X] Sparkle Intel Arc A310 Elf Intel Core i9-13900K 3GHz
A310
min:
4.08 fps, P0.1:
6.38 fps, P1:
14.2 fps, max:
185.5 fps
fps
100%
A310:
14 [X] Sparkle Intel Arc A310 Elf Intel Core i9-13900K 3GHz
A310
min:
5.96 fps, P0.1:
6.51 fps, P1:
8.89 fps, max:
137.8 fps
fps
100%
A310:
111 [X] Sparkle Intel Arc A310 Elf Intel Core i9-13900K 3GHz
A310
min:
92 fps
fps
100%
A310:
73.6 [X] Sparkle Intel Arc A310 Elf Intel Core i9-13900K 3GHz
A310
min:
59 fps
fps
100%
A310:
41.6 [X] Sparkle Intel Arc A310 Elf Intel Core i9-13900K 3GHz
A310
min:
34 fps
fps
100%
A310:
32.3 [X] Sparkle Intel Arc A310 Elf Intel Core i9-13900K 3GHz
A310
min:
26 fps
fps
100%
A310:
37 [X] Sparkle Intel Arc A310 Elf Intel Core i9-13900K 3GHz
A310
min:
18 fps
fps
100%
A310:
32 [X] Sparkle Intel Arc A310 Elf Intel Core i9-13900K 3GHz
A310
min:
20 fps
fps
100%
A310:
25 [X] Sparkle Intel Arc A310 Elf Intel Core i9-13900K 3GHz
A310
min:
13 fps
fps
100%
A310:
20 [X] Sparkle Intel Arc A310 Elf Intel Core i9-13900K 3GHz
A310
min:
2 fps
fps
100%
A310:
153.5 [X] Sparkle Intel Arc A310 Elf Intel Core i9-13900K 3GHz
A310
min:
119.2 fps, P0.1:
121.2 fps, P1:
124.9 fps, max:
243 fps
fps
100%
A310:
106.3 [X] Sparkle Intel Arc A310 Elf Intel Core i9-13900K 3GHz
A310
min:
13 fps, P0.1:
82.6 fps, P1:
87.5 fps, max:
159.8 fps
fps
100%
A310:
37.5 [X] Sparkle Intel Arc A310 Elf Intel Core i9-13900K 3GHz
A310
min:
15 fps, P0.1:
15.4 fps, P1:
30.2 fps, max:
107.6 fps
fps
100%
A310:
27.7 [X] Sparkle Intel Arc A310 Elf Intel Core i9-13900K 3GHz
A310
min:
13.1 fps, P0.1:
14.8 fps, P1:
21.3 fps, max:
103.7 fps
fps
100%
A310:
41 [X] Sparkle Intel Arc A310 Elf Intel Core i9-13900K 3GHz
A310
min:
31 fps
fps
100%
A310:
31.1 [X] Sparkle Intel Arc A310 Elf Intel Core i9-13900K 3GHz
A310
min:
24 fps
fps
100%
A310:
25.7 [X] Sparkle Intel Arc A310 Elf Intel Core i9-13900K 3GHz
A310
min:
2 fps
fps
100%
A310:
23.7 [X] Sparkle Intel Arc A310 Elf Intel Core i9-13900K 3GHz
A310
min:
19 fps
fps
100%
A310:
49.3 [X] Sparkle Intel Arc A310 Elf Intel Core i9-13900K 3GHz
A310
min:
19.9 fps, P0.1:
24 fps, P1:
25.8 fps, max:
354 fps
fps
100%
A310:
42 [X] Sparkle Intel Arc A310 Elf Intel Core i9-13900K 3GHz
A310
min:
20.6 fps, P0.1:
21.2 fps, P1:
21.8 fps, max:
321 fps
fps
100%
A310:
36 [X] Sparkle Intel Arc A310 Elf Intel Core i9-13900K 3GHz
A310
min:
17.4 fps, P0.1:
17.4 fps, P1:
18.1 fps, max:
284 fps
fps
100%
A310:
30.3 [X] Sparkle Intel Arc A310 Elf Intel Core i9-13900K 3GHz
A310
min:
12.8 fps, P0.1:
14.2 fps, P1:
15.3 fps, max:
285 fps
fps
100%
A310:
37 [X] Sparkle Intel Arc A310 Elf Intel Core i9-13900K 3GHz
A310
min:
31 fps
fps
100%
A310:
33 [X] Sparkle Intel Arc A310 Elf Intel Core i9-13900K 3GHz
A310
min:
29 fps
fps
100%
A310:
27 [X] Sparkle Intel Arc A310 Elf Intel Core i9-13900K 3GHz
A310
min:
24 fps
fps
100%
A310:
22 [X] Sparkle Intel Arc A310 Elf Intel Core i9-13900K 3GHz
A310
min:
19 fps
fps
100%
A310:
17.3 [X] Sparkle Intel Arc A310 Elf Intel Core i9-13900K 3GHz
A310
min:
12.3 fps, P0.1:
12.3 fps, P1:
12.7 fps, max:
21.2 fps
fps
100%
A310:
14.2 [X] Sparkle Intel Arc A310 Elf Intel Core i9-13900K 3GHz
A310
min:
10.6 fps, P0.1:
10.7 fps, P1:
10.9 fps, max:
17.2 fps
fps
100%
A310:
13 [X] Sparkle Intel Arc A310 Elf Intel Core i9-13900K 3GHz
A310
min:
10.8 fps, P0.1:
10.9 fps, P1:
11.1 fps, max:
15.6 fps
fps
100%
A310:
10.3 [X] Sparkle Intel Arc A310 Elf Intel Core i9-13900K 3GHz
A310
min:
7.2 fps, P0.1:
7.2 fps, P1:
8.38 fps, max:
12.3 fps
fps
100%
A310:
56.3 [X] Sparkle Intel Arc A310 Elf Intel Core i9-13900K 3GHz
A310
min:
21.5 fps, P0.1:
34.2 fps, P1:
43.6 fps, max:
137.2 fps
fps
100%
A310:
43.8 [X] Sparkle Intel Arc A310 Elf Intel Core i9-13900K 3GHz
A310
min:
30 fps, P0.1:
32 fps, P1:
35.4 fps, max:
56 fps
fps
100%
A310:
39 [X] Sparkle Intel Arc A310 Elf Intel Core i9-13900K 3GHz
A310
min:
8.83 fps, P0.1:
29 fps, P1:
31.6 fps, max:
97.4 fps
fps
100%
A310:
26.9 [X] Sparkle Intel Arc A310 Elf Intel Core i9-13900K 3GHz
A310
min:
21.4 fps, P0.1:
21.6 fps, P1:
23.6 fps, max:
35 fps
fps
100%
A310:
32.6 [X] Sparkle Intel Arc A310 Elf Intel Core i9-13900K 3GHz
A310
min:
20.4 fps, P0.1:
20.4 fps, P1:
20.9 fps, max:
60 fps
fps
100%
A310:
31.8 [X] Sparkle Intel Arc A310 Elf Intel Core i9-13900K 3GHz
A310
min:
19 fps, P0.1:
19.2 fps, P1:
20.5 fps, max:
62.8 fps
fps
100%
A310:
26.7 [X] Sparkle Intel Arc A310 Elf Intel Core i9-13900K 3GHz
A310
min:
19.9 fps, P0.1:
19.9 fps, P1:
20 fps, max:
55.7 fps
fps
100%
A310:
8.1 [X] Sparkle Intel Arc A310 Elf Intel Core i9-13900K 3GHz
A310
min:
4.77 fps, P0.1:
5.19 fps, P1:
6.8 fps, max:
10.2 fps
fps
100%
A310:
40.6 [X] Sparkle Intel Arc A310 Elf Intel Core i9-13900K 3GHz
A310
min:
27 fps, P0.1:
27.1 fps, P1:
28.2 fps, max:
80.9 fps
fps
100%
A310:
32 [X] Sparkle Intel Arc A310 Elf Intel Core i9-13900K 3GHz
A310
min:
16.2 fps, P0.1:
16.5 fps, P1:
21 fps, max:
68.8 fps
fps
100%
A310:
25.5 [X] Sparkle Intel Arc A310 Elf Intel Core i9-13900K 3GHz
A310
min:
11.4 fps, P0.1:
13 fps, P1:
16.2 fps, max:
60.1 fps
fps
100%
A310:
24.9 [X] Sparkle Intel Arc A310 Elf Intel Core i9-13900K 3GHz
A310
min:
14 fps, P0.1:
14 fps, P1:
15.7 fps, max:
55.7 fps
fps
100%
A310:
30.3 [X] Sparkle Intel Arc A310 Elf Intel Core i9-13900K 3GHz
A310
min:
15.6 fps, P0.1:
17.2 fps, P1:
23 fps, max:
45.8 fps
fps
100%
A310:
24.6 [X] Sparkle Intel Arc A310 Elf Intel Core i9-13900K 3GHz
A310
min:
14.7 fps, P0.1:
15.8 fps, P1:
18 fps, max:
36.7 fps
fps
100%
A310:
19.1 [X] Sparkle Intel Arc A310 Elf Intel Core i9-13900K 3GHz
A310
min:
11 fps, P0.1:
11 fps, P1:
13.5 fps, max:
30.8 fps
fps
100%
A310:
16.1 [X] Sparkle Intel Arc A310 Elf Intel Core i9-13900K 3GHz
A310
min:
10.1 fps, P0.1:
10.8 fps, P1:
11.7 fps, max:
22 fps
fps
100%
A310:
88 [X] Sparkle Intel Arc A310 Elf Intel Core i9-13900K 3GHz
A310
min:
78 fps
fps
100%
A310:
75 [X] Sparkle Intel Arc A310 Elf Intel Core i9-13900K 3GHz
A310
min:
68 fps
fps
100%
A310:
42 [X] Sparkle Intel Arc A310 Elf Intel Core i9-13900K 3GHz
A310
min:
21 fps
fps
100%
A310:
12 [X] Sparkle Intel Arc A310 Elf Intel Core i9-13900K 3GHz
A310
min:
9 fps
fps
100%
A310:
42.4 [X] Sparkle Intel Arc A310 Elf Intel Core i9-13900K 3GHz
A310
min:
16 fps, P0.1:
26.1 fps, P1:
29.3 fps, max:
55.9 fps
fps
100%
A310:
30.1 [X] Sparkle Intel Arc A310 Elf Intel Core i9-13900K 3GHz
A310
min:
22.7 fps, P0.1:
22.9 fps, P1:
24.7 fps, max:
38.6 fps
fps
100%
A310:
21.6 [X] Sparkle Intel Arc A310 Elf Intel Core i9-13900K 3GHz
A310
min:
16.3 fps, P0.1:
16.6 fps, P1:
17.6 fps, max:
31.8 fps
fps
100%
A310:
9.5 [X] Sparkle Intel Arc A310 Elf Intel Core i9-13900K 3GHz
A310
min:
7.07 fps, P0.1:
7.11 fps, P1:
7.56 fps, max:
10.9 fps
fps
100%
A310:
35.2 [X] Sparkle Intel Arc A310 Elf Intel Core i9-13900K 3GHz
A310
min:
21 fps
fps
100%
A310:
31.2 [X] Sparkle Intel Arc A310 Elf Intel Core i9-13900K 3GHz
A310
min:
15 fps
fps
100%
A310:
25.4 [X] Sparkle Intel Arc A310 Elf Intel Core i9-13900K 3GHz
A310
min:
14 fps
fps
100%
A310:
24.8 [X] Sparkle Intel Arc A310 Elf Intel Core i9-13900K 3GHz
A310
min:
8 fps
fps
100%
A310:
29.9 [X] Sparkle Intel Arc A310 Elf Intel Core i9-13900K 3GHz
A310
min:
15.3 fps, P0.1:
15.6 fps, P1:
17.5 fps, max:
42.5 fps
fps
100%
A310:
18.9 [X] Sparkle Intel Arc A310 Elf Intel Core i9-13900K 3GHz
A310
min:
8.27 fps, P0.1:
8.43 fps, P1:
10.2 fps, max:
28.5 fps
fps
100%
A310:
17.4 [X] Sparkle Intel Arc A310 Elf Intel Core i9-13900K 3GHz
A310
min:
4.21 fps, P0.1:
4.53 fps, P1:
7.9 fps, max:
77.2 fps
fps
100%
A310:
17.1 [X] Sparkle Intel Arc A310 Elf Intel Core i9-13900K 3GHz
A310
min:
1.534 fps, P0.1:
2.52 fps, P1:
8.67 fps, max:
27.9 fps
fps
100%
A310:
54.2 [X] Sparkle Intel Arc A310 Elf Intel Core i9-13900K 3GHz
A310
min:
44.6 fps, P0.1:
45.2 fps, P1:
47.1 fps, max:
65.9 fps
fps
100%
A310:
40.3 [X] Sparkle Intel Arc A310 Elf Intel Core i9-13900K 3GHz
A310
min:
23.2 fps, P0.1:
33.5 fps, P1:
35.1 fps, max:
96.8 fps
fps
100%
A310:
27.4 [X] Sparkle Intel Arc A310 Elf Intel Core i9-13900K 3GHz
A310
min:
15.3 fps, P0.1:
23.1 fps, P1:
24 fps, max:
80.4 fps
fps
100%
A310:
18.8 [X] Sparkle Intel Arc A310 Elf Intel Core i9-13900K 3GHz
A310
min:
14.6 fps, P0.1:
16.2 fps, P1:
16.9 fps, max:
27 fps
fps
100%
A310:
30 [X] Sparkle Intel Arc A310 Elf Intel Core i9-13900K 3GHz
A310
min:
17 fps
fps
100%
A310:
29 [X] Sparkle Intel Arc A310 Elf Intel Core i9-13900K 3GHz
A310
min:
13 fps
fps
100%
A310:
26 [X] Sparkle Intel Arc A310 Elf Intel Core i9-13900K 3GHz
A310
min:
12 fps
fps
100%
A310:
21 [X] Sparkle Intel Arc A310 Elf Intel Core i9-13900K 3GHz
A310
min:
9 fps
fps
100%
A310:
42.3 [X] Sparkle Intel Arc A310 Elf Intel Core i9-13900K 3GHz
A310
min:
20.2 fps, P0.1:
31.3 fps, P1:
37 fps, max:
177.1 fps
fps
100%
A310:
35.2 [X] Sparkle Intel Arc A310 Elf Intel Core i9-13900K 3GHz
A310
min:
17 fps, P0.1:
23.5 fps, P1:
29 fps, max:
140.1 fps
fps
100%
A310:
21.5 [X] Sparkle Intel Arc A310 Elf Intel Core i9-13900K 3GHz
A310
min:
13.2 fps, P0.1:
14.7 fps, P1:
17.6 fps, max:
32.7 fps
fps
100%
A310:
15.4 [X] Sparkle Intel Arc A310 Elf Intel Core i9-13900K 3GHz
A310
min:
10.1 fps, P0.1:
10.4 fps, P1:
11.3 fps, max:
20.7 fps
fps
100%
A310:
187.3 [X] Sparkle Intel Arc A310 Elf 1.47.22.14 D3D12
Intel Core i9-13900K 3GHz
A310
min:
85.2 fps, P1:
160.6 fps, max:
800 fps
fps
100%
A310:
79.7 [X] Sparkle Intel Arc A310 Elf 1.47.22.14 D3D12
Intel Core i9-13900K 3GHz
A310
min:
65.9 fps, P1:
68.8 fps, max:
99.8 fps
fps
100%
A310:
65.3 [X] Sparkle Intel Arc A310 Elf 1.47.22.14 D3D12
Intel Core i9-13900K 3GHz
A310
min:
48.8 fps, P1:
52.2 fps, max:
84.8 fps
fps
100%
A310:
53.8 [X] Sparkle Intel Arc A310 Elf 1.47.22.14 D3D12
Intel Core i9-13900K 3GHz
A310
min:
33.7 fps, P1:
43.4 fps, max:
112.6 fps
fps
100%
A310:
99 [X] Sparkle Intel Arc A310 Elf Intel Core i9-13900K 3GHz
A310
min:
49 fps
fps
100%
A310:
51 [X] Sparkle Intel Arc A310 Elf Intel Core i9-13900K 3GHz
A310
min:
43 fps
fps
100%
A310:
47 [X] Sparkle Intel Arc A310 Elf Intel Core i9-13900K 3GHz
A310
min:
42 fps
fps
100%
A310:
44 [X] Sparkle Intel Arc A310 Elf Intel Core i9-13900K 3GHz
A310
min:
39 fps
fps
100%
A310:
41.7 [X] Sparkle Intel Arc A310 Elf 1.3
Intel Core i9-13900K 3GHz
A310
fps
100%
A310:
24.1 [X] Sparkle Intel Arc A310 Elf 1.3
Intel Core i9-13900K 3GHz
A310
fps
100%
A310:
176 [X] Sparkle Intel Arc A310 Elf Intel Core i9-13900K 3GHz
A310
fps
100%
A310:
108 [X] Sparkle Intel Arc A310 Elf Intel Core i9-13900K 3GHz
A310
fps
100%
A310:
56 [X] Sparkle Intel Arc A310 Elf Intel Core i9-13900K 3GHz
A310
fps
100%
A310:
29 [X] Sparkle Intel Arc A310 Elf Intel Core i9-13900K 3GHz
A310
fps
100%
A310:
187.7 [X] Sparkle Intel Arc A310 Elf Intel Core i9-13900K 3GHz
A310
min:
4 fps, P1:
200 fps, max:
633 fps
fps
100%
A310:
187.6 [X] Sparkle Intel Arc A310 Elf Intel Core i9-13900K 3GHz
A310
min:
2.91 fps, P1:
200 fps, max:
656 fps
fps
100%
A310:
38.3 [X] Sparkle Intel Arc A310 Elf Intel Core i9-13900K 3GHz
A310
min:
4.4 fps, P1:
28.6 fps, max:
186.9 fps
fps
100%
A310:
16.8 [X] Sparkle Intel Arc A310 Elf Intel Core i9-13900K 3GHz
A310
min:
2.36 fps, P1:
12 fps, max:
236 fps
fps
Average Gaming Intel Arc A310 → 100% Average Gaming 30-70 fps → 100%
 Deutsch
 English
 Español
 Français
 Italiano
 Nederlands
 Polski
 Português
 Русский
 Türkçe
 Svenska
 Chinese
 Magyar