Notebookcheck Logo

Apple A13 Bionic vs Qualcomm Snapdragon G3x Gen 1

Apple A13 Bionic

► remove from comparison Apple A13 Bionic

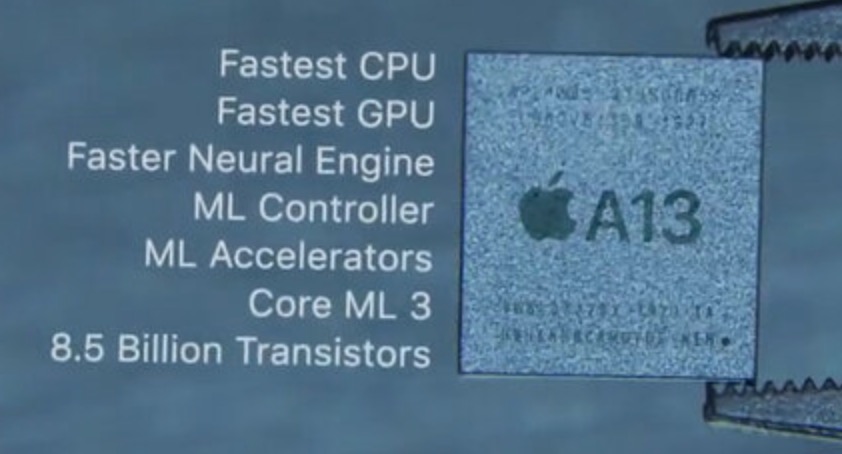
The Apple A13 Bionic is a System on a Chip (SoC) from Apple that is found in the iPhone 11 series. It was announced late 2019 and offers 6 cores divided in 2 performance cores and four power efficiency cores. Compared to the previous A12 Bionic, the A13 should offer a 20% improved CPU performance at 40% lower power (according to Apple).

With 8.5 billion transistors, the A13 Bionic is a big chip especially compared to the Snapdragon 835 (3 Billion) or a Skylake desktop quad-core Soc (1.75 Billion).

Qualcomm Snapdragon G3x Gen 1

► remove from comparison Qualcomm SD G3x Gen 1

The Qualcomm Snapdragon G3x Gen 1 (model number: SG8175P) is a revised version of the Snapdragon 888+ 5Gwhich is intended for use in Android-based gaming handhelds and tablets.

The SoC (system-on-a-chip) integrates a fast ARM Cortex-X1-based "Kryo 680 Prime Core" with up to 3.00 GHz and three additional fast Kryo 680 Gold performance cores (Cortex-A78-based) with up to 2.42 GHz. To save power, four additional Kyro 680 Silver (ARM Cortex-A55 based) cores have also been integrated, which operate at up to 1.8 GHz. An Adreno 660 is responsible for graphics acceleration.

The integrated Snapdragon X60 5G modem enables download speeds of up to 7.5 Gbit/s and upload speeds of up to 3 Gbit/s and supports DSS, mmWave and Sub6. The integrated FastConnect 6900 Wi-Fi modem supports all common standards, including Wi-Fi 6E with 6 GHz. Bluetooth version 5.2 is on board.

The SoC is manufactured using the 5 nm EUV process.

ModelApple A13 BionicQualcomm Snapdragon G3x Gen 1
SeriesApple Apple A-SeriesQualcomm Snapdragon
CodenameLightning and ThunderCortex-X1 / A78 / A55 (Kryo 680)
Clock <=2660 MHz1800 - 2995 MHz
L1 Cache832 KB
L2 Cache12 MB
Cores / Threads6 / 68 / 8
1 x 3.0 GHz ARM Cortex-X1
3 x 2.4 GHz ARM Cortex-A78
4 x 1.8 GHz ARM Cortex-A55
Transistors6900 Million
Technology7 nm5 nm
FeaturesARMv8 Instruction SetAdreno 660 GPU, Spectra 580 ISP, Hexagon 780, X60 5G Modem, FastConnect 6900 WiFi, LPDDR5-6400 (3200 MHz) Memory Controller (64 Bit)
iGPUApple A13 Bionic GPUQualcomm Adreno 660
ArchitectureARMARM
Announced
Series: Snapdragon Cortex-X1 / A78 / A55 (Kryo 680)
Qualcomm Snapdragon G3x Gen 1 « 1.8 - 3 GHz8 / 8 cores3 MB L3 Cortex-X1 / A78 / A55 (Kryo 680)
Qualcomm Snapdragon 888 Plus 5G compare1.8 - 3 GHz8 / 8 cores3 MB L3 Cortex-X1 / A78 / A55 (Kryo 680)
Qualcomm Snapdragon 888 5G compare1.8 - 2.84 GHz8 / 8 cores3 MB L3 Cortex-X1 / A78 / A55 (Kryo 680)
Qualcomm Snapdragon 888 4G compare1.8 - 2.84 GHz8 / 8 cores3 MB L3 Cortex-X1 / A78 / A55 (Kryo 680)
L3 Cache3 MB
TDP5 Watt
Manufacturerwww.qualcomm.com

Benchmarks

3DMark - 3DMark Ice Storm Unlimited Physics
min: 33851     avg: 33885     median: 33881 (29%)     max: 33925 Points
3DMark - 3DMark Sling Shot Extreme (ES 3.1) Unlimited Physics
min: 2078     avg: 2803     median: 2958 (35%)     max: 3219 Points
5062 Points (60%)
3DMark - 3DMark Sling Shot (ES 3.0) Unlimited Physics
min: 3411     avg: 3780     median: 3877 (44%)     max: 4052 Points
Geekbench 6.2 - Geekbench 6.2 Single-Core
1596 Points (43%)
Geekbench 6.2 - Geekbench 6.2 Multi-Core
3757 Points (15%)
Geekbench 5.5 - Geekbench 5.1 - 5.4 64 Bit Single-Core
min: 1326     avg: 1333     median: 1332 (56%)     max: 1342 Points
1170 Points (49%)
Geekbench 5.5 - Geekbench 5.1 - 5.4 64 Bit Multi-Core
min: 3235     avg: 3381     median: 3378.5 (6%)     max: 3531 Points
3553 Points (6%)
Geekbench 5.0 - Geekbench 5.0 64 Bit Single-Core
min: 1343     avg: 1343     median: 1343 (6%)     max: 1344 Points
Geekbench 5.0 - Geekbench 5.0 64 Bit Multi-Core
min: 3242     avg: 3427     median: 3463 (11%)     max: 3575 Points
Geekbench 4.4 - Geekbench 4.1 - 4.4 64 Bit Single-Core
5345 Points (53%)
Geekbench 4.4 - Geekbench 4.1 - 4.4 64 Bit Multi-Core
14328 Points (16%)
Mozilla Kraken 1.1 - Kraken 1.1 Total Score *
min: 545     avg: 562     median: 571 (1%)     max: 573 ms
776 ms (1%)
Sunspider - Sunspider 1.0 Total Score *
132.6 ms (1%)
Octane V2 - Octane V2 Total Score
min: 47288     avg: 48727     median: 48991 (43%)     max: 49388 Points
53177 Points (47%)
WebXPRT 4 - WebXPRT 4 Score
163 Points (47%)
WebXPRT 3 - WebXPRT 3 Score
min: 146     avg: 179.2     median: 183 (38%)     max: 202 Points
201 Points (42%)
AnTuTu v7 - AnTuTu v7 MEM
min: 10494     avg: 12510     median: 12592 (39%)     max: 14443 Points
AnTuTu v7 - AnTuTu v7 UX
min: 77118     avg: 77810     median: 78032 (96%)     max: 78279 Points
AnTuTu v7 - AnTuTu v7 GPU
min: 218738     avg: 219891     median: 218937 (68%)     max: 221998 Points
AnTuTu v7 - AnTuTu v7 CPU
min: 147281     avg: 149542     median: 148191 (91%)     max: 153154 Points
AnTuTu v7 - AnTuTu v7 Total Score
min: 456891     avg: 459752     median: 459850 (81%)     max: 462516 Points
AnTuTu v8 - AnTuTu v8 UX
min: 64361     avg: 75201     median: 78294 (65%)     max: 82947 Points
AnTuTu v8 - AnTuTu v8 MEM
min: 67691     avg: 75819     median: 74262 (60%)     max: 85504 Points
AnTuTu v8 - AnTuTu v8 GPU
min: 190559     avg: 203672     median: 209164 (38%)     max: 211292 Points
AnTuTu v8 - AnTuTu v8 CPU
min: 149088     avg: 156731     median: 152919 (55%)     max: 168185 Points
AnTuTu v8 - AnTuTu v8 Total Score
min: 489463     avg: 511422     median: 510245 (49%)     max: 534558 Points
Antutu v9 - AnTuTu v9 Total Score
622382 Points (38%)
740704 Points (45%)
Antutu v9 - AnTuTu v9 CPU
147649 Points (40%)
178290 Points (49%)
PassMark PerformanceTest Mobile V1 - PerformanceTest Mobile V1 CPU Tests
min: 650706     avg: 678820     median: 683897 (90%)     max: 701856 Points
PCMark for Android - PCM f. Android Storage 2.0 random write internal
68.2 MB/s (50%)
PCMark for Android - PCM f. Android Storage 2.0 seq write internal
617 MB/s (19%)
PCMark for Android - PCM f. Android Storage 2.0 random read internal
32.7 MB/s (40%)
PCMark for Android - PCM f. Android Storage 2.0 seq read internal
1291 MB/s (36%)
PCMark for Android - PCM f. Android Storage 2.0 score
31062 Points (49%)
PCMark for Android - PCM f. Android Work Score 3.0
16261 Points (75%)
CrossMark - CrossMark Overall
min: 776     avg: 835     median: 849 (33%)     max: 864 Points
987 Points (38%)
Power Consumption - Geekbench 5.5 Power Consumption 150cd *
7 Watt (3%)
6.9 Watt (3%)
Power Consumption - Idle Power Consumption 150cd 1min *
2.9 Watt (3%)
1.1 Watt (1%)

Average Benchmarks Apple A13 Bionic → 100% n=9

Average Benchmarks Qualcomm Snapdragon G3x Gen 1 → 115% n=9

- Range of benchmark values for this graphics card
- Average benchmark values for this graphics card
* Smaller numbers mean a higher performance
1 This benchmark is not used for the average calculation

Add one or more devices and compare

In the following list you can select (and also search for) devices that should be added to the comparison. You can select more than one device.

restrict list:

show all (including archived), 2024, 2023
v1.28
log 26. 21:25:41

#0 checking url part for id 11496 +0s ... 0s

#1 checking url part for id 17470 +0s ... 0s

#2 redirected to Ajax server, took 1719429940 +0s ... 0s

#3 did not recreate cache, as it is less than 5 days old! Created at Tue, 25 Jun 2024 05:15:18 +0200 +0s ... 0s

#4 composed specs +0.005s ... 0.005s

#5 did output specs +0s ... 0.005s

#6 getting avg benchmarks for device 11496 +0.001s ... 0.006s

#7 got single benchmarks 11496 +0.007s ... 0.013s

#8 getting avg benchmarks for device 17470 +0.001s ... 0.013s

#9 got single benchmarks 17470 +0.003s ... 0.017s

#10 got avg benchmarks for devices +0s ... 0.017s

#11 min, max, avg, median took s +0.02s ... 0.037s

#12 return log +0.002s ... 0.039s

Please share our article, every link counts!
> Expert Reviews and News on Laptops, Smartphones and Tech Innovations > Benchmarks / Tech > Processor Comparison - Head 2 Head
Redaktion, 2017-09- 8 (Update: 2023-07- 1)