Notebookcheck Logo

Apple A13 Bionic vs Qualcomm Snapdragon 888 Plus 5G vs Qualcomm Snapdragon 888 5G

Apple A13 Bionic

► remove from comparison Apple A13 Bionic

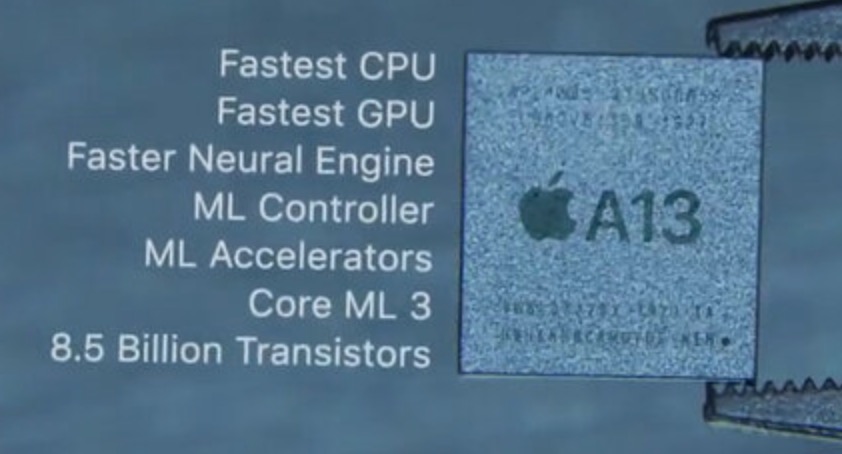
The Apple A13 Bionic is a System on a Chip (SoC) from Apple that is found in the iPhone 11 series. It was announced late 2019 and offers 6 cores divided in 2 performance cores and four power efficiency cores. Compared to the previous A12 Bionic, the A13 should offer a 20% improved CPU performance at 40% lower power (according to Apple).

With 8.5 billion transistors, the A13 Bionic is a big chip especially compared to the Snapdragon 835 (3 Billion) or a Skylake desktop quad-core Soc (1.75 Billion).

Qualcomm Snapdragon 888 Plus 5G

► remove from comparison Qualcomm SD 888+ 5G

The Qualcomm Snapdragon 888+ (Plus) 5G Mobile Platform is a high-end SoC for smartphones that was introduced in mid 2021 and manufactured in 5 nm at Samsung. 

Integrates one “Prime Core” based on a ARM Cortex-X1 architecture clocked at up to 3 GHz. Three more performance cores are based on the A78 but clock up to 2.42 GHz. Furthermore, four energy saving cores are integrated that are based on the ARM Cortex-A55 architecture and clock at up to 1.8 GHz. In addition to the processor cores, the SoC integrates a WiFi 6e modem, a Hexagon 780 DSP (up to 26 TOPS of AI performance) and a Spectra 580 ISP. The integrated memory controller now supports faster LPDDR5 memory with up to 3,200 MHz. 5G is now included in the chip with the Snapdragon X60 modem.

Compared to the older Snapdragon 888, the 888+ offers a slightly higher clocked prime core (+160 MHz) and a 23% faster Hexagon 790 DSP. Therefore, it is now the fastest Android SoC (at the time of announcement), but still slightly slower (CPU and GPU) than the Apple A14 and A15 Bionic SoCs.

Qualcomm Snapdragon 888 5G

► remove from comparison Qualcomm SD 888 5G

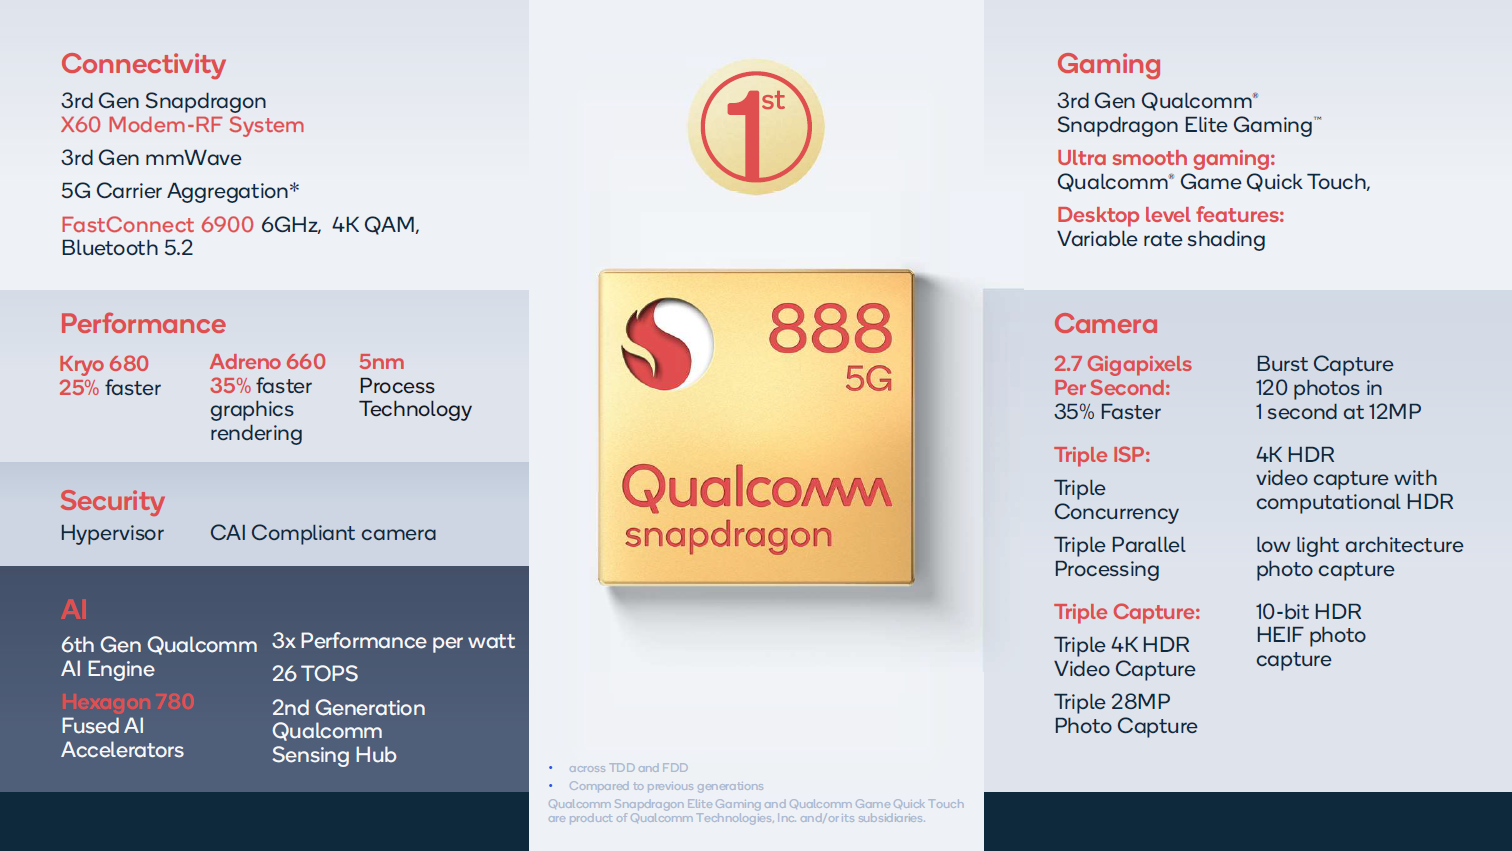
The Qualcomm Snapdragon 888 5G Mobile Platform is a high-end SoC for smartphones that was introduced in late 2020 and manufactured in 5 nm at Samsung. Integrates one “Prime Core” based on a ARM Cortex-X1 architecture clocked at up to 2.84 GHz. Three more performance cores are based on the A78 but clock up to 2.42 GHz. Furthermore, four energy saving cores are integrated that are based on the ARM Cortex-A55 architecture and clock at up to 1.8 GHz. In addition to the processor cores, the SoC integrates a WiFi 6e modem, a Hexagon 780 DSP (up to 26 TOPS of AI performance) and a Spectra 580 ISP. The integrated memory controller now supports faster LPDDR5 memory with up to 3,200 MHz. 5G is now included in the chip with the Snapdragon X60 modem.

The performance of the processor cores should be around 15% better than the old Snapdragon 865+. The integrated Adreon 660 GPU should make a bigger jump by 35% (most likely compared to the SD 865).

ModelApple A13 BionicQualcomm Snapdragon 888 Plus 5GQualcomm Snapdragon 888 5G
SeriesApple Apple A-SeriesQualcomm SnapdragonQualcomm Snapdragon
CodenameLightning and ThunderCortex-X1 / A78 / A55 (Kryo 680)Cortex-X1 / A78 / A55 (Kryo 680)
Clock <=2660 MHz1800 - 3000 MHz1800 - 2840 MHz
L1 Cache832 KB
L2 Cache12 MB
Cores / Threads6 / 68 / 8
1 x 3.0 GHz ARM Cortex-X1
3 x 2.4 GHz ARM Cortex-A78
4 x 1.8 GHz ARM Cortex-A55
8 / 8
1 x 2.8 GHz ARM Cortex-X1
3 x 2.4 GHz ARM Cortex-A78
4 x 1.8 GHz ARM Cortex-A55
Transistors6900 Million
Technology7 nm5 nm5 nm
FeaturesARMv8 Instruction SetAdreno 660 GPU, Spectra 580 ISP, Hexagon 780, X60 5G Modem, FastConnect 6900 WiFi, LPDDR5-6400 (3200 MHz) Memory Controller (64 Bit)Adreno 660 GPU, Spectra 580 ISP, Hexagon 780, X60 5G Modem, FastConnect 6900 WiFi,LPDDR5-6400 / LPDDR4X-4266 MHz Memory Controller (64 Bit)
iGPUApple A13 Bionic GPUQualcomm Adreno 660Qualcomm Adreno 660
ArchitectureARMARMARM
Announced
Series: Snapdragon Cortex-X1 / A78 / A55 (Kryo 680)
Qualcomm Snapdragon G3x Gen 11.8 - 3 GHz8 / 8 cores3 MB L3 Cortex-X1 / A78 / A55 (Kryo 680)
Qualcomm Snapdragon 888 Plus 5G « 1.8 - 3 GHz8 / 8 cores3 MB L3 Cortex-X1 / A78 / A55 (Kryo 680)
Qualcomm Snapdragon 888 5G1.8 - 2.84 GHz8 / 8 cores3 MB L3 Cortex-X1 / A78 / A55 (Kryo 680)
Qualcomm Snapdragon 888 4G1.8 - 2.84 GHz8 / 8 cores3 MB L3 Cortex-X1 / A78 / A55 (Kryo 680)
Qualcomm Snapdragon G3x Gen 11.8 - 3 GHz8 / 8 cores3 MB L3 Cortex-X1 / A78 / A55 (Kryo 680)
Qualcomm Snapdragon 888 Plus 5G1.8 - 3 GHz8 / 8 cores3 MB L3 Cortex-X1 / A78 / A55 (Kryo 680)
Qualcomm Snapdragon 888 5G « 1.8 - 2.84 GHz8 / 8 cores3 MB L3 Cortex-X1 / A78 / A55 (Kryo 680)
Qualcomm Snapdragon 888 4G1.8 - 2.84 GHz8 / 8 cores3 MB L3 Cortex-X1 / A78 / A55 (Kryo 680)
L3 Cache3 MB3 MB
TDP5 Watt5 Watt
Manufacturerwww.qualcomm.comwww.qualcomm.com

Benchmarks

Performance Rating - Geekbench 5.5, PCM Work, Sling Shot Physics, Antutu v8 CPU - SD 888+ 5G
1.3 pt (100%)
Performance Rating - Geekbench 5.5, PCM Work, Sling Shot Physics, Antutu v8 CPU - SD 888 5G
min: 1.289     avg: 1.3     median: 1.3 (99%)     max: 1.3 pt
3DMark - 3DMark Ice Storm Unlimited Physics
min: 33851     avg: 33885     median: 33881 (29%)     max: 33925 Points
44810 Points (38%)
3DMark - 3DMark Sling Shot Extreme (ES 3.1) Unlimited Physics
min: 2078     avg: 2803     median: 2958 (35%)     max: 3219 Points
min: 4387     avg: 4898     median: 4952 (58%)     max: 5260 Points
3DMark - 3DMark Sling Shot (ES 3.0) Unlimited Physics
min: 3411     avg: 3780     median: 3877 (44%)     max: 4052 Points
min: 4365     avg: 4994     median: 5260 (60%)     max: 5293 Points
Geekbench 6.2 - Geekbench 6.2 Single-Core
1480 Points (40%)
Geekbench 6.2 - Geekbench 6.2 Multi-Core
3595 Points (14%)
Geekbench 5.5 - Geekbench 5.1 - 5.4 64 Bit Single-Core
min: 1326     avg: 1333     median: 1332 (56%)     max: 1342 Points
min: 1076     avg: 1143     median: 1157 (49%)     max: 1170 Points
Geekbench 5.5 - Geekbench 5.1 - 5.4 64 Bit Multi-Core
min: 3235     avg: 3381     median: 3378.5 (6%)     max: 3531 Points
min: 3286     avg: 3572     median: 3628.5 (7%)     max: 3675 Points
Geekbench 5.0 - Geekbench 5.0 64 Bit Single-Core
min: 1343     avg: 1343     median: 1343 (6%)     max: 1344 Points
1164 Points (5%)
Geekbench 5.0 - Geekbench 5.0 64 Bit Multi-Core
min: 3242     avg: 3427     median: 3463 (11%)     max: 3575 Points
3699 Points (12%)
Geekbench 4.4 - Geekbench 4.1 - 4.4 64 Bit Single-Core
min: 4754     avg: 4973     median: 4973 (50%)     max: 5192 Points
min: 5033     avg: 5081     median: 5087 (51%)     max: 5099 Points
Geekbench 4.4 - Geekbench 4.1 - 4.4 64 Bit Multi-Core
min: 12433     avg: 13553     median: 13552.5 (15%)     max: 14672 Points
min: 14023     avg: 14426     median: 14326 (16%)     max: 14895 Points
Geekbench 4.0 - Geekbench 4.0 64 Bit Single-Core
5255 Points (72%)
Geekbench 4.0 - Geekbench 4.0 64 Bit Multi-Core
13602 Points (33%)
Geekbench 3 - Geekbench 3 64 Bit Multi-Core
11320 Points (18%)
Geekbench 3 - Geekbench 3 64 Bit Single-Core
3977 Points (60%)
Geekbench 2 - 32 Bit - Geekbench Stream
3422 Points (28%)
4421 Points (36%)
Geekbench 2 - 32 Bit - Geekbench Memory
5554 Points (50%)
5565 Points (50%)
Geekbench 2 - 32 Bit - Geekbench Floating Point
18052 Points (35%)
19860 Points (39%)
Geekbench 2 - 32 Bit - Geekbench Integer
8716 Points (18%)
9335 Points (19%)
Geekbench 2 - 32 Bit - Geekbench Total Score
10821 Points (28%)
11578 Points (30%)
Mozilla Kraken 1.1 - Kraken 1.1 Total Score *
min: 545     avg: 562     median: 571 (1%)     max: 573 ms
min: 1117.9     avg: 1267     median: 1253.5 (1%)     max: 1443 ms
min: 891     avg: 1319     median: 1321.5 (2%)     max: 1841 ms
Sunspider - Sunspider 1.0 Total Score *
342.5 ms (4%)
Octane V2 - Octane V2 Total Score
min: 47288     avg: 48727     median: 48991 (43%)     max: 49388 Points
min: 28695     avg: 38237     median: 37604 (33%)     max: 49046 Points
min: 23491     avg: 35591     median: 35487.5 (31%)     max: 47543 Points
WebXPRT 4 - WebXPRT 4 Score
104 Points (30%)
WebXPRT 3 - WebXPRT 3 Score
min: 146     avg: 179.2     median: 183 (38%)     max: 202 Points
min: 120     avg: 144     median: 147 (31%)     max: 165 Points
min: 103     avg: 143.1     median: 148 (31%)     max: 182 Points
AnTuTu v7 - AnTuTu v7 MEM
min: 10494     avg: 12510     median: 12592 (39%)     max: 14443 Points
AnTuTu v7 - AnTuTu v7 UX
min: 77118     avg: 77810     median: 78032 (96%)     max: 78279 Points
AnTuTu v7 - AnTuTu v7 GPU
min: 218738     avg: 219891     median: 218937 (68%)     max: 221998 Points
AnTuTu v7 - AnTuTu v7 CPU
min: 147281     avg: 149542     median: 148191 (91%)     max: 153154 Points
AnTuTu v7 - AnTuTu v7 Total Score
min: 456891     avg: 459752     median: 459850 (81%)     max: 462516 Points
AnTuTu v8 - AnTuTu v8 UX
min: 64361     avg: 75201     median: 78294 (65%)     max: 82947 Points
min: 108609     avg: 111028     median: 111506 (93%)     max: 112968 Points
AnTuTu v8 - AnTuTu v8 MEM
min: 67691     avg: 75819     median: 74262 (60%)     max: 85504 Points
min: 97862     avg: 106258     median: 102389 (83%)     max: 118523 Points
AnTuTu v8 - AnTuTu v8 GPU
min: 190559     avg: 203672     median: 209164 (38%)     max: 211292 Points
min: 297329     avg: 308231     median: 306570 (56%)     max: 320795 Points
min: 226319     avg: 296422     median: 307949 (57%)     max: 319439 Points
AnTuTu v8 - AnTuTu v8 CPU
min: 149088     avg: 156731     median: 152919 (55%)     max: 168185 Points
min: 181327     avg: 186005     median: 184740 (67%)     max: 191947 Points
min: 146069     avg: 180815     median: 186398 (67%)     max: 197454 Points
AnTuTu v8 - AnTuTu v8 Total Score
min: 489463     avg: 511422     median: 510245 (49%)     max: 534558 Points
min: 695964     avg: 711522     median: 712952 (69%)     max: 725649 Points
min: 569595     avg: 677749     median: 703138 (68%)     max: 740847 Points
Antutu v9 - AnTuTu v9 Total Score
622382 Points (38%)
min: 794271     avg: 813105     median: 815115 (49%)     max: 829929 Points
Antutu v9 - AnTuTu v9 CPU
147649 Points (40%)
min: 196860     avg: 203592     median: 205863 (56%)     max: 208053 Points
PassMark PerformanceTest Mobile V1 - PerformanceTest Mobile V1 CPU Tests
min: 650706     avg: 678820     median: 683897 (90%)     max: 701856 Points
4771 Points (1%)
PCMark for Android - PCM f. Android Storage 2.0 score
min: 28905     avg: 32530     median: 31947 (51%)     max: 36738 Points
PCMark for Android - PCM f. Android Work Score 3.0
min: 12136     avg: 15268     median: 15403 (71%)     max: 18567 Points
PCMark for Android - PCM f. Android Work Score 2.0
12692 Points (83%)
PCMark for Android - PCM f. Android Computer Vision
min: 6823     avg: 9333     median: 9478.5 (50%)     max: 11551 Points
PCMark for Android - PCM f. Android Storage
0 Points (0%)
PCMark for Android - PCM f. Android Work Score
min: 11823     avg: 14555     median: 14328 (72%)     max: 18942 Points
CrossMark - CrossMark Overall
min: 776     avg: 835     median: 849 (33%)     max: 864 Points
min: 828     avg: 872     median: 872 (33%)     max: 916 Points
Power Consumption - Geekbench 5.5 Power Consumption 150cd *
7 Watt (3%)
min: 4.68     avg: 5.3     median: 5.1 (2%)     max: 6.41 Watt
Power Consumption - Idle Power Consumption 150cd 1min *
2.9 Watt (3%)
min: 0.943     avg: 1.1     median: 1 (1%)     max: 1.244 Watt

Average Benchmarks Apple A13 Bionic → 100% n=15

Average Benchmarks Qualcomm Snapdragon 888 Plus 5G → 121% n=15

Average Benchmarks Qualcomm Snapdragon 888 5G → 118% n=15

- Range of benchmark values for this graphics card
- Average benchmark values for this graphics card
* Smaller numbers mean a higher performance
1 This benchmark is not used for the average calculation

v1.28
log 03. 18:52:31

#0 checking url part for id 11496 +0s ... 0s

#1 checking url part for id 13833 +0s ... 0s

#2 checking url part for id 13017 +0s ... 0s

#3 redirected to Ajax server, took 1720025551 +0s ... 0s

#4 did not recreate cache, as it is less than 5 days old! Created at Mon, 01 Jul 2024 05:15:43 +0200 +0s ... 0s

#5 composed specs +0.006s ... 0.007s

#6 did output specs +0s ... 0.007s

#7 getting avg benchmarks for device 11496 +0.001s ... 0.007s

#8 got single benchmarks 11496 +0.006s ... 0.014s

#9 getting avg benchmarks for device 13833 +0.003s ... 0.017s

#10 got single benchmarks 13833 +0.007s ... 0.024s

#11 getting avg benchmarks for device 13017 +0.003s ... 0.026s

#12 got single benchmarks 13017 +0.018s ... 0.045s

#13 got avg benchmarks for devices +0s ... 0.045s

#14 No cached benchmark found, getting uncached values +0.038s ... 0.082s

#15 min, max, avg, median took s +0.004s ... 0.087s

#16 return log +0s ... 0.087s

Please share our article, every link counts!
> Expert Reviews and News on Laptops, Smartphones and Tech Innovations > Benchmarks / Tech > Processor Comparison - Head 2 Head
Redaktion, 2017-09- 8 (Update: 2023-07- 1)