Notebookcheck Logo

Intel Core i5-4590 vs AMD Ryzen 5 5600U vs Intel Core i5-4430

Intel Core i5-4590

► remove from comparison Intel 4590

The Intel Core i5-4590 is a desktop processor with 4 core and 4 threads (no HyperThreading / SMT) based on the Haswell architecture. The cores clock from 3.3. - 3.7 GHz and the SoC integrates 6 MB level 3 cache. The integrated Intel HD graphics 4600 GPU clocks from 350 - 1150 MHz and the integrated memory controller supports up to 32 GB of DDR3-1600.

AMD Ryzen 5 5600U

► remove from comparison AMD R5 5600U

The AMD Ryzen 5 5600U, not to be confused with Intel's Core i7-5600U, is a fairly fast Cezanne family processor designed for use in thinner, lighter laptops. The R5 5600U integrates six of the eight cores based on the Zen 3 microarchitecture and is the third fastest U-series processor at launch. The cores are clocked at 2.3 (guaranteed base clock) to 4.2 GHz (Turbo) and support SMT for a total of 12 threads. The chip is manufactured on the modern 7 nm TSMC process.

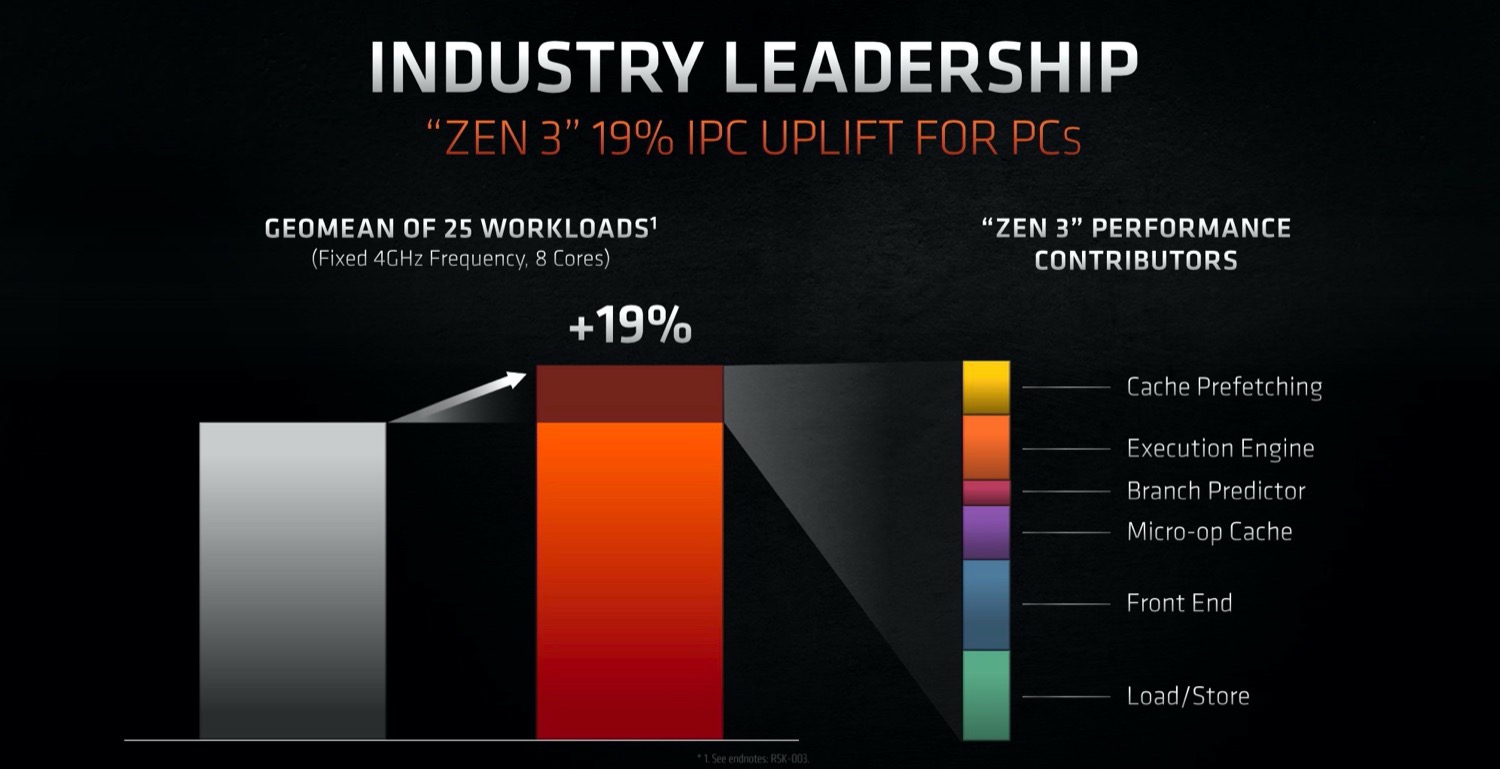
The new Zen 3 microarchitecture offers a significantly higher IPC (instructions per clock) compared to Zen 2. For desktop processors AMD claims 19 percent on average and in applications reviews showed around 12% gains at the same clock speed.

In addition to the six CPU cores, the APU also integrates a Radeon RX Vega 7 integrated graphics card with 7 CUs at up to 1800 MHz. The dual channel memory controller supports DDR4-3200 and energy efficient LPDDR4-4266 RAM. Furthermore, 16 MB level 3 cache (up from 8 MB at the 4800U) can be found on the chip.

Performance

This Ryzen 5 series chip is a solid mid-range CPU, as of early 2022. Its multi-thread benchmark scores nearly match those of the Intel Core i5-11400H (a much more power-hungry hexa-core chip designed for use in gaming laptops). While not nearly as fast as 12th generation Alder Lake-P processors, the 5600U should be good enough for the vast majority of users.

Thanks to its decent cooling solution and a long-term CPU power limit of 30 W, the IdeaPad 5 Pro 14ACN6 is among the fastest laptops powered by the 5600U that we know of. It can be more than 30% faster in CPU-bound workloads than the slowest system featuring the same chip in our database, as of August 2023.

Power consumption

This Ryzen 5 has a default TDP of 15 W, a value that laptop makers are allowed to change to anything between 10 W and 25 W with clock speeds and performance changing accordingly as a result. By going for the lowest value possible, it is possible to build a passively cooled system around this chip. Most laptop makers, however, will do the opposite to maximize performance.

The AMD Ryzen 5 5600U is built with TSMC's 7 nm manufacturing process for average, as of mid 2023, energy efficiency.

Intel Core i5-4430

► remove from comparison Intel 4430

The Intel Core i5-4430 is a quad-core processor for desktops of the Haswell generation. It integrates four cores clocked at 3 - 3.2 GHz but without HyperThreading / SMT (4 threads).

ModelIntel Core i5-4590AMD Ryzen 5 5600UIntel Core i5-4430
SeriesIntel Core i5 (Desktop)AMD Cezanne (Zen 3, Ryzen 5000)Intel Core i5 (Desktop)
CodenameHaswellCezanne-U (Zen 3)Haswell
Series: Core i5 (Desktop) Haswell
Intel Core i5-4590 « 3.3 - 3.7 GHz4 / 4 cores6 MB L3
Intel Core i5-44603.2 - 3.4 GHz4 / 4 cores6 MB L3
Intel Core i5-44303 - 3.2 GHz4 / 4 cores6 MB L3
AMD Ryzen 7 5800U1.9 - 4.4 GHz8 / 16 cores16 MB L3
AMD Ryzen 5 5600U « 2.3 - 4.2 GHz6 / 12 cores16 MB L3
AMD Ryzen 5 5560U2.3 - 4 GHz6 / 12 cores16 MB L3
AMD Ryzen 3 5400U2.6 - 4 GHz4 / 8 cores8 MB L3
Intel Core i5-45903.3 - 3.7 GHz4 / 4 cores6 MB L3
Intel Core i5-44603.2 - 3.4 GHz4 / 4 cores6 MB L3
Intel Core i5-4430 « 3 - 3.2 GHz4 / 4 cores6 MB L3
Clock3300 - 3700 MHz2300 - 4200 MHz3000 - 3200 MHz
L1 Cache256 KB384 KB256 KB
L2 Cache1 MB3 MB1 MB
L3 Cache6 MB16 MB6 MB
Cores / Threads4 / 46 / 124 / 4
TDP84 Watt25 Watt84 Watt
Transistors1400 Million1400 Million
Technology22 nm7 nm22 nm
Die Size177 mm2177 mm2
SocketFCLGA1150FP6FCLGA1150
FeaturesHD Graphics 4600 (350 - 1150 MHz), DDR3-1600 Memory Controller, AVX, AVX2, Quick Sync, Virtualization, vProDDR4-3200/LPDDR4-4266 RAM, PCIe 3, MMX, SSE, SSE2, SSE3, SSSE3, SSE4A, SSE4.1, SSE4.2, AVX, AVX2, BMI2, ABM, FMA, ADX, SMEP, SMAP, SMT, CPB, AES-NI, RDRAND, RDSEED, SHA, SMEDDR3(L)-1600 Memory Controller, AVX, AVX2, AES-NI, Quick Sync, Virtualization
iGPUIntel HD Graphics 4600 (350 - 1150 MHz)AMD Radeon RX Vega 7 ( - 1800 MHz)Intel HD Graphics 4600 (350 - 1100 MHz)
Architecturex86x86x86
$202 U.S.$182 U.S.
Announced
Manufacturerark.intel.comwww.amd.comark.intel.com
max. Temp.105 °C72.72 °C

Benchmarks

Performance Rating - CB R15 + R20 + 7-Zip + X265 + Blender + 3DM11 CPU - R5 5600U
36 pt (50%)
Cinebench 2024 - Cinebench 2024 CPU Single Core
82 Points (57%)
Cinebench 2024 - Cinebench 2024 CPU Multi Core
388 Points (7%)
Cinebench R23 - Cinebench R23 Multi Core
min: 6871     avg: 7929     median: 7792.5 (7%)     max: 9345 Points
Cinebench R23 - Cinebench R23 Single Core
min: 1345     avg: 1365     median: 1371 (58%)     max: 1376 Points
Cinebench R20 - Cinebench R20 CPU (Single Core)
min: 532     avg: 534     median: 534 (59%)     max: 536 Points
Cinebench R20 - Cinebench R20 CPU (Multi Core)
min: 2345     avg: 3036     median: 3067 (7%)     max: 3632 Points
Cinebench R15 - Cinebench R15 CPU Multi 64 Bit
100%
4590 +
530 Points (3%)
min: 1265     avg: 1347     median: 1321 (8%)     max: 1546 Points
463 Points (3%)
Cinebench R15 - Cinebench R15 CPU Single 64 Bit
100%
4590 +
146 Points (44%)
min: 220     avg: 222     median: 223 (67%)     max: 223 Points
127 Points (38%)
Cinebench R11.5 - Cinebench R11.5 CPU Multi 64 Bit
100%
1 4590 +
5.9 Points (8%)
min: 14.5     avg: 15.1     median: 14.8 (19%)     max: 15.96 Points
Cinebench R11.5 - Cinebench R11.5 CPU Single 64 Bit
100%
1 4590 +
1.6 Points (41%)
min: 2.61     avg: 2.6     median: 2.6 (65%)     max: 2.64 Points
Cinebench R10 - Cinebench R10 Rend. Single (32bit)
100%
1 4590 +
5479 Points (33%)
min: 58.49     avg: 2866     median: 2866.3 (17%)     max: 5674 Points
Cinebench R10 - Cinebench R10 Rend. Multi (32bit)
100%
1 4590 +
18998 Points (14%)
min: 27130     avg: 28347     median: 28347 (21%)     max: 29564 Points
Cinebench R10 - Cinebench R10 Rend. Multi (64bit)
min: 45363     avg: 47704     median: 46918 (33%)     max: 50831 Points
Cinebench R10 - Cinebench R10 Rend. Single (64bit)
min: 11098     avg: 11124     median: 11132 (14%)     max: 11143 Points
wPrime 2.10 - wPrime 2.0 1024m *
min: 147.807     avg: 193.8     median: 156.3 (2%)     max: 277.4 s
wPrime 2.10 - wPrime 2.0 32m *
min: 4.848     avg: 6.3     median: 5.4 (1%)     max: 8.78 s
WinRAR - WinRAR 4.0
min: 6346     avg: 6694     median: 6858 (11%)     max: 6877 Points
7-Zip 18.03 - 7-Zip 18.03 Multli Thread 4 runs
min: 32052     avg: 37855     median: 37815.5 (22%)     max: 43071 MIPS
7-Zip 18.03 - 7-Zip 18.03 Single Thread 4 runs
min: 5118     avg: 5198     median: 5204.5 (62%)     max: 5260 MIPS
X264 HD Benchmark 4.0 - x264 Pass 2
min: 76     avg: 78.5     median: 78.5 (27%)     max: 80.95 fps
X264 HD Benchmark 4.0 - x264 Pass 1
min: 234     avg: 235     median: 235 (54%)     max: 236 fps
HWBOT x265 Benchmark v2.2 - HWBOT x265 4k Preset
min: 7.31     avg: 9.7     median: 9.8 (17%)     max: 11.8 fps
TrueCrypt - TrueCrypt Serpent
min: 0.7     avg: 0.8     median: 0.8 (0%)     max: 0.796 GB/s
TrueCrypt - TrueCrypt Twofish
min: 1.1     avg: 1.1     median: 1.1 (19%)     max: 1.2 GB/s
TrueCrypt - TrueCrypt AES
min: 5.1     avg: 7     median: 7.7 (20%)     max: 8.3 GB/s
Blender - Blender 3.3 Classroom CPU *
min: 781     avg: 798     median: 798 (10%)     max: 815 Seconds
Blender - Blender 2.79 BMW27 CPU *
min: 328     avg: 412.8     median: 412.5 (3%)     max: 481 Seconds
R Benchmark 2.5 - R Benchmark 2.5 *
min: 0.537     avg: 0.6     median: 0.6 (12%)     max: 0.59 sec
3DMark 06 - CPU - 3DMark 06 - CPU
min: 10261     avg: 10973     median: 11308 (24%)     max: 11349 Points
Super Pi mod 1.5 XS 1M - Super Pi mod 1.5 XS 1M *
min: 8.417     avg: 8.6     median: 8.7 (2%)     max: 8.767 s
Super Pi mod 1.5 XS 2M - Super Pi mod 1.5 XS 2M *
min: 18.25     avg: 18.8     median: 18.9 (1%)     max: 19.23 s
Super Pi Mod 1.5 XS 32M - Super Pi mod 1.5 XS 32M *
min: 39.78     avg: 333.6     median: 454.6 (2%)     max: 506.532 s
3DMark Vantage - 3DM Vant. Perf. CPU no Physx
min: 39453     avg: 40516     median: 40516 (35%)     max: 41579 Points
3DMark 11 - 3DM11 Performance Physics
100%
1 4590 +
6863 Points (19%)
min: 7823     avg: 11018     median: 11465.5 (31%)     max: 13130 Points
3DMark - 3DMark Ice Storm Physics
100%
4590 +
54816 Points (45%)
min: 70486     avg: 72645     median: 72645 (59%)     max: 74804 Points
min: 47348     avg: 47765     median: 47764.5 (39%)     max: 48181 Points
3DMark - 3DMark Ice Storm Extreme Physics
min: 70573     avg: 71966     median: 71965.5 (58%)     max: 73358 Points
3DMark - 3DMark Ice Storm Unlimited Physics
min: 80047     avg: 81270     median: 81269.5 (68%)     max: 82492 Points
3DMark - 3DMark Cloud Gate Physics
100%
4590 +
5022 Points (13%)
min: 9144     avg: 10893     median: 10921 (28%)     max: 13033 Points
min: 4226     avg: 4286     median: 4285.5 (11%)     max: 4345 Points
3DMark - 3DMark Fire Strike Standard Physics
100%
4590 +
7040 Points (13%)
min: 14756     avg: 17757     median: 17787.5 (32%)     max: 20872 Points
min: 5976     avg: 6044     median: 6043.5 (11%)     max: 6111 Points
3DMark - 3DMark Time Spy CPU
min: 3820     avg: 4931     median: 4984 (21%)     max: 5685 Points
Geekbench 6.2 - Geekbench 6.2 Single-Core
1885 Points (51%)
Geekbench 6.2 - Geekbench 6.2 Multi-Core
7232 Points (29%)
Geekbench 5.5 - Geekbench 5.1 - 5.4 64 Bit Single-Core
min: 1334     avg: 1388     median: 1391 (59%)     max: 1430 Points
Geekbench 5.5 - Geekbench 5.1 - 5.4 64 Bit Multi-Core
min: 4506     avg: 5611     median: 5773 (10%)     max: 6523 Points
Geekbench 5.0 - Geekbench 5.0 64 Bit Single-Core
min: 1340     avg: 1365     median: 1371 (6%)     max: 1383 Points
Geekbench 5.0 - Geekbench 5.0 64 Bit Multi-Core
min: 5031     avg: 5876     median: 6117 (19%)     max: 6479 Points
Geekbench 4.4 - Geekbench 4.1 - 4.4 64 Bit Single-Core
min: 5553     avg: 5775     median: 5854 (58%)     max: 5918 Points
Geekbench 4.4 - Geekbench 4.1 - 4.4 64 Bit Multi-Core
min: 21830     avg: 24021     median: 24495 (27%)     max: 25738 Points
Mozilla Kraken 1.1 - Kraken 1.1 Total Score *
min: 646     avg: 656     median: 654.5 (1%)     max: 667 ms
Octane V2 - Octane V2 Total Score
min: 64294     avg: 65787     median: 65343 (57%)     max: 67723 Points
WebXPRT 4 - WebXPRT 4 Score
min: 198.4     avg: 200.8     median: 200 (57%)     max: 204 Points
WebXPRT 3 - WebXPRT 3 Score
min: 243     avg: 254.5     median: 255.5 (53%)     max: 265 Points
CrossMark - CrossMark Overall
min: 1164     avg: 1255     median: 1241.5 (48%)     max: 1373 Points
Power Consumption - Prime95 Power Consumption - external Monitor *
min: 22.5     avg: 38     median: 34.5 (6%)     max: 64.9 Watt
Power Consumption - Cinebench R15 Multi Power Consumption - external Monitor *
min: 27.6     avg: 40.9     median: 39.3 (7%)     max: 59.8 Watt
Power Consumption - Idle Power Consumption - external Monitor *
min: 3.5     avg: 6.4     median: 6.4 (4%)     max: 9.27 Watt
Power Consumption - Idle Power Consumption 150cd 1min *
5.2 Watt (6%)
Power Consumption - Cinebench R15 Multi Power Efficiency - external Monitor
min: 25.9     avg: 34.8     median: 33.6 (25%)     max: 49 Points per Watt

Average Benchmarks Intel Core i5-4590 → 100% n=5

Average Benchmarks AMD Ryzen 5 5600U → 201% n=5

Average Benchmarks Intel Core i5-4430 → 87% n=5

- Range of benchmark values for this graphics card
- Average benchmark values for this graphics card
* Smaller numbers mean a higher performance
1 This benchmark is not used for the average calculation

v1.28
log 03. 23:52:01

#0 checking url part for id 6948 +0s ... 0s

#1 checking url part for id 12983 +0s ... 0s

#2 checking url part for id 7887 +0s ... 0s

#3 redirected to Ajax server, took 1720043520 +0s ... 0s

#4 did not recreate cache, as it is less than 5 days old! Created at Mon, 01 Jul 2024 05:15:43 +0200 +0s ... 0s

#5 composed specs +0.005s ... 0.005s

#6 did output specs +0s ... 0.005s

#7 getting avg benchmarks for device 6948 +0.001s ... 0.006s

#8 got single benchmarks 6948 +0.004s ... 0.009s

#9 getting avg benchmarks for device 12983 +0.006s ... 0.015s

#10 got single benchmarks 12983 +0.012s ... 0.027s

#11 getting avg benchmarks for device 7887 +0.001s ... 0.028s

#12 got single benchmarks 7887 +0.003s ... 0.031s

#13 got avg benchmarks for devices +0s ... 0.031s

#14 min, max, avg, median took s +0.041s ... 0.072s

#15 return log +0s ... 0.072s

Please share our article, every link counts!
> Expert Reviews and News on Laptops, Smartphones and Tech Innovations > Benchmarks / Tech > Processor Comparison - Head 2 Head
Redaktion, 2017-09- 8 (Update: 2023-07- 1)