Notebookcheck Logo

Qualcomm Snapdragon 400 MSM8926 vs Intel Core i5-13400F

Qualcomm Snapdragon 400 MSM8926

► remove from comparison Qualcomm 400 MSM8926

The Qualcomm Snapdragon 400 MSM8926 is an entry-level ARM-SoC for Android smartphones and tablets. It offers four Cortex-A7 cores clocked at up to 1.2 GHz (Quad-Core) as well as an Adreno 305 graphics card at 450 MHz. Furthermore, a HSPA+/LTE radio is integrated in the SoC, which is manufactured in a 28-nanometer LP process.

Intel Core i5-13400F

► remove from comparison Intel i5-13400F

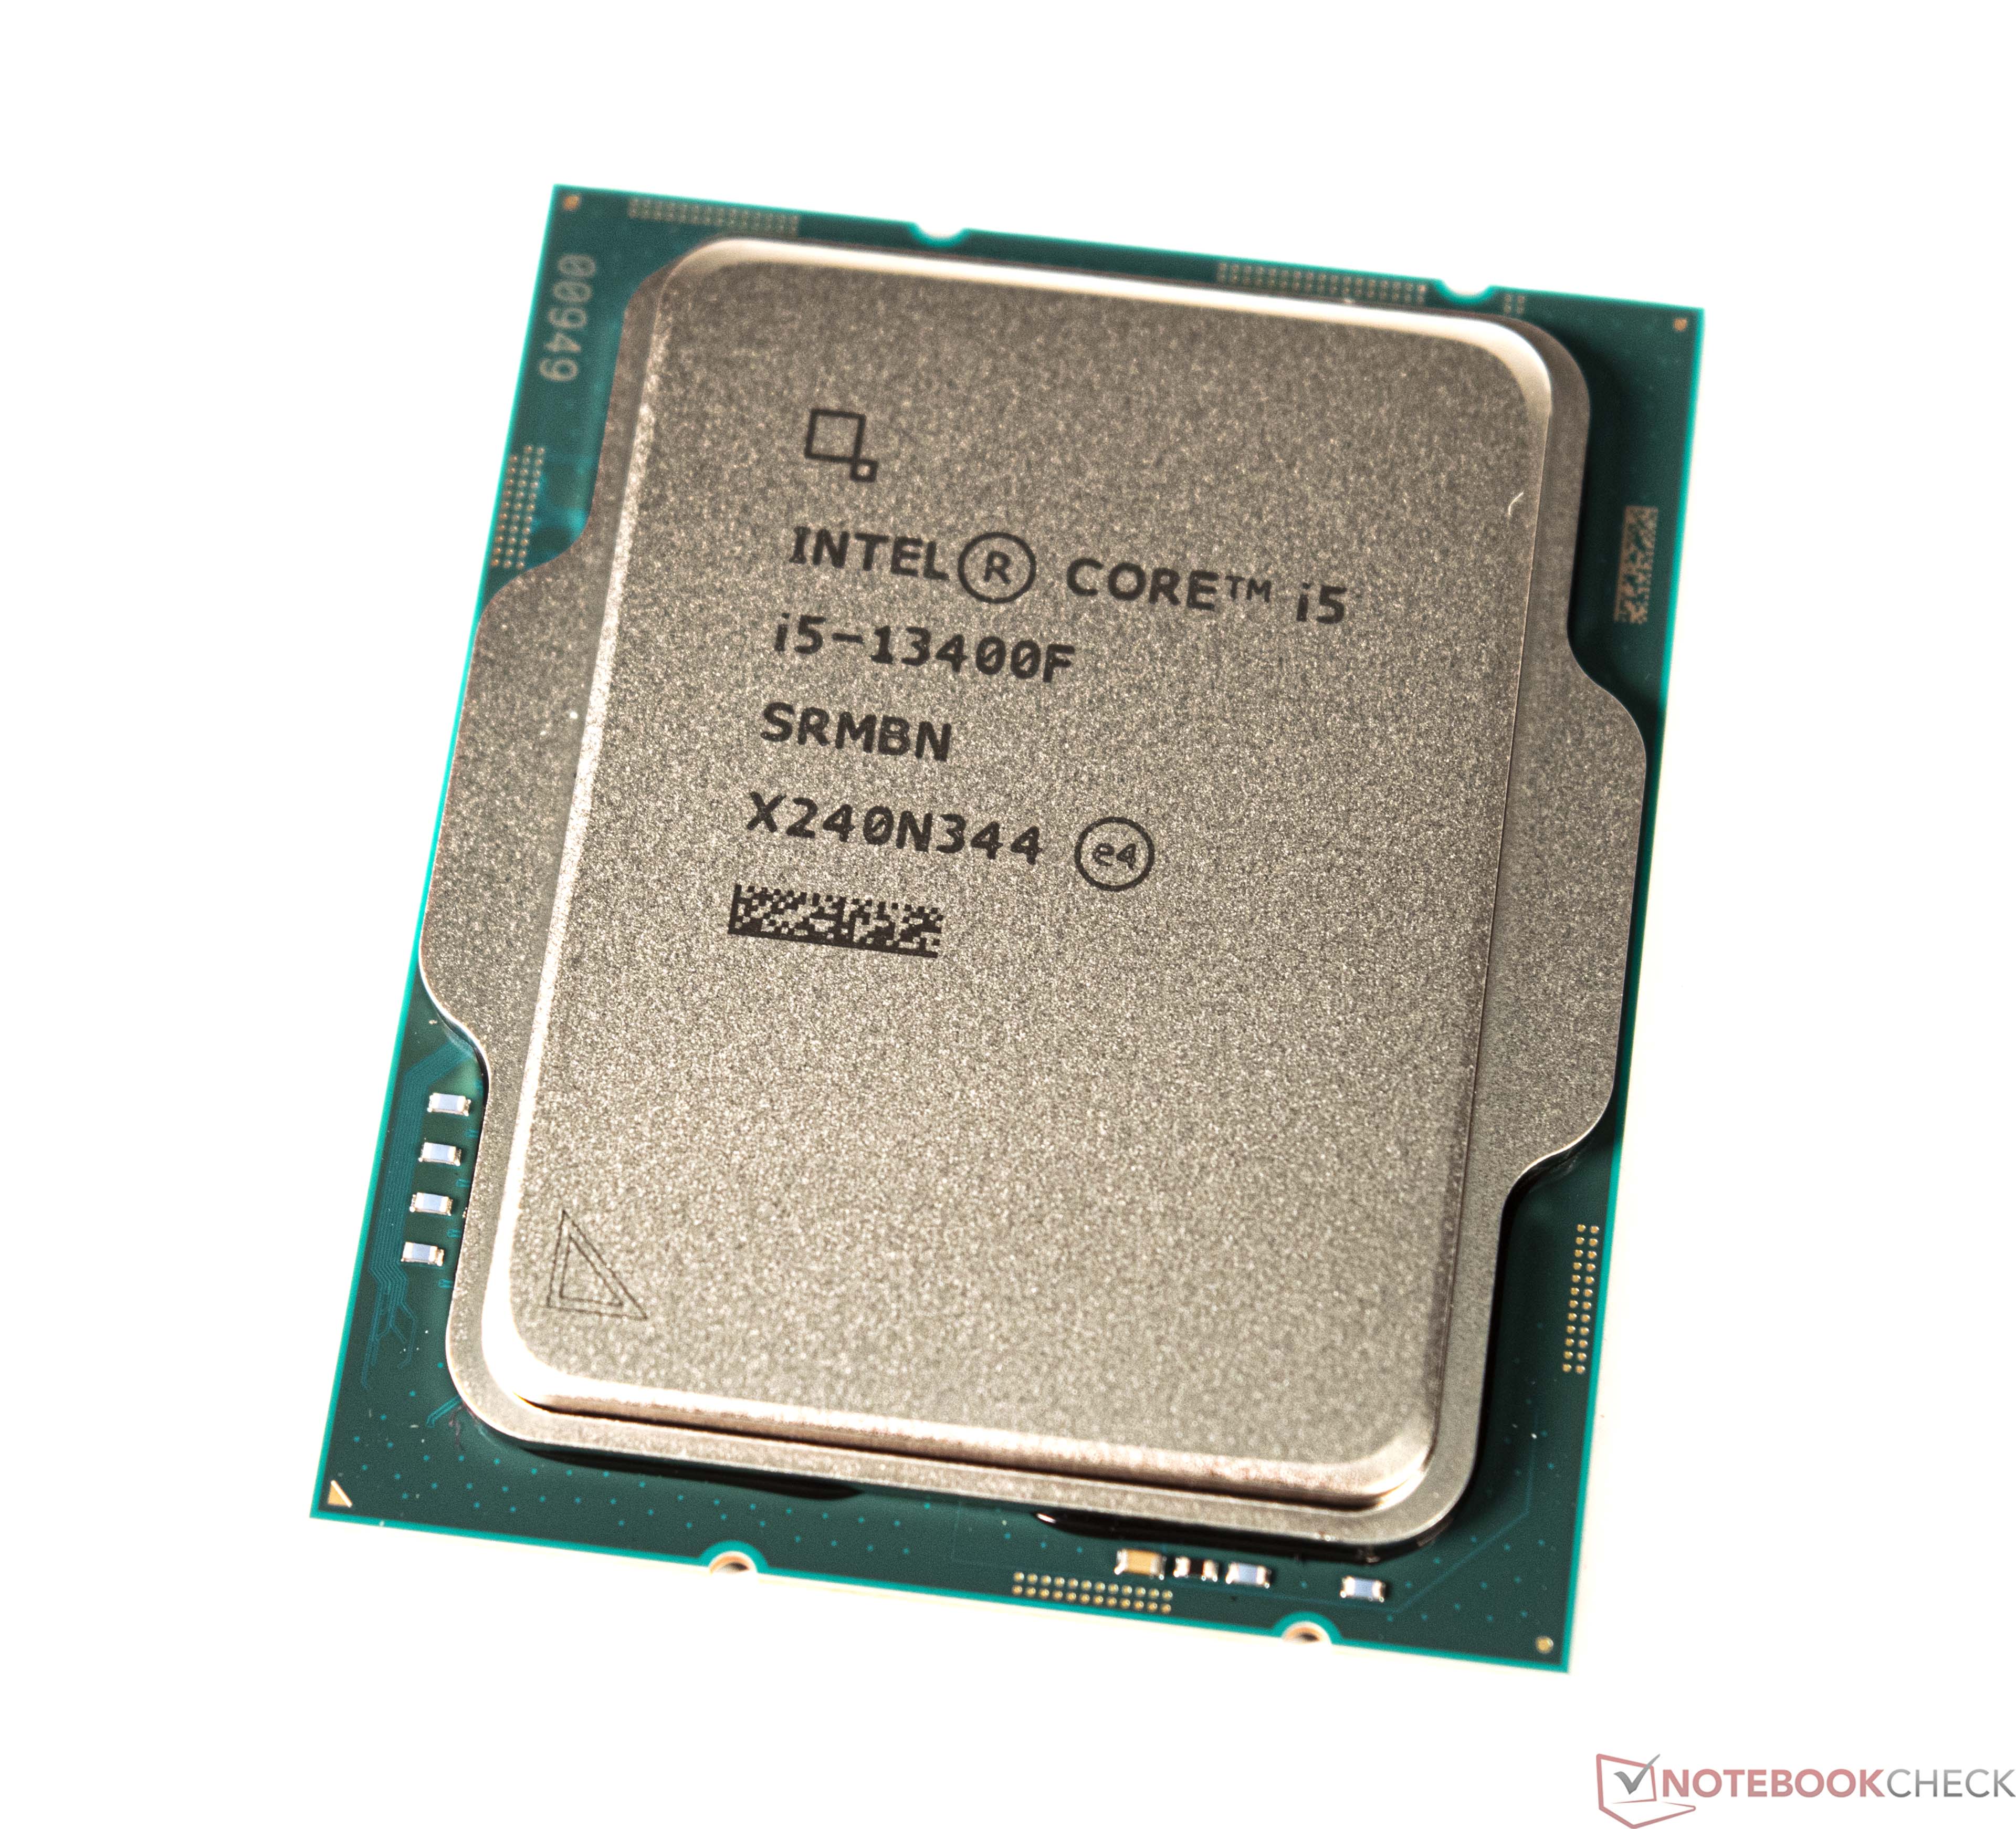
The Intel Core i5-13400F is a mid-range desktop processor of the Raptor Lake series. It includes a hybrid architecture for the CPU cores with combined 10 cores. Six fast Golden Cove / Raptor Cove performance cores (P-cores) with HyperThreading and a clock speed of 3.5 - 5.1 GHz and four Gracemont efficiency cores without HyperThreading and a clock speed of 2.6 - 3.9 GHz. The 13400F can be based on the older Alder Lake chips (at least for early models) or the newer Raptor Lake chips. The F-series of CPUs do not integrate a iGPU.

The performance is clearly higher than the old Core i5-12400F due to the additional four E-cores. These help in multi-threaded workloads and the higher boost core of the p-cores help for single threaded workloads.

The power consumption of the 13400F is rated at 65 Watt for sustained workloads (PL1) and 148 Watt for short bursts (PL2).

ModelQualcomm Snapdragon 400 MSM8926Intel Core i5-13400F
SeriesQualcomm SnapdragonIntel Raptor Lake-S
CodenameARMv7Raptor Lake-S
Series: Raptor Lake-S Raptor Lake-S
Qualcomm Snapdragon S4 Pro APQ8064A compare1.5 GHz4 / 4 cores ARMv7
Qualcomm Snapdragon 400 MSM8928 compare1.6 GHz4 / 4 cores ARMv7
Qualcomm Snapdragon 400 APQ8028 compare1.6 GHz4 / 4 cores ARMv7
Qualcomm Snapdragon S4 Pro MSM8960T compare1.7 GHz2 / 2 cores ARMv7
Qualcomm Snapdragon 400 8930AB compare1.7 GHz2 / 2 cores ARMv7
Qualcomm Snapdragon S4 Plus APQ8060A compare1.5 GHz2 / 2 cores ARMv7
Qualcomm Snapdragon S4 Plus MSM8960 compare1.5 GHz2 / 2 cores ARMv7
Qualcomm Snapdragon S4 Plus MSM8260A compare1.7 GHz2 / 2 cores ARMv7
Qualcomm Snapdragon 400 MSM8926 « 1.2 GHz4 / 4 cores ARMv7
Qualcomm Snapdragon 400 MSM8226 compare1.2 GHz4 / 4 cores ARMv7
Qualcomm Snapdragon 400 APQ8026 compare1.2 GHz4 / 4 cores ARMv7
Qualcomm Snapdragon S4 Plus MSM8930 compare1.2 GHz2 / 2 cores ARMv7
Qualcomm Snapdragon S4 Plus MSM8230 compare1.2 GHz2 / 2 cores ARMv7
Qualcomm Snapdragon S4 Plus MSM8227 compare1 GHz2 / 2 cores ARMv7
Qualcomm Snapdragon S3 MSM8660 compare1.7 GHz2 / 2 cores ARMv7
Qualcomm Snapdragon S3 MSM8260 compare1.5 GHz2 / 2 cores ARMv7
Qualcomm Snapdragon S1 QSD8250 compare1 GHz1 / 1 cores ARMv7
Intel Core i7-13700 compare2.1 - 5.2 GHz16 / 24 cores30 MB L3
Intel Core i5-13400F « 2.5 - 4.6 GHz10 / 16 cores20 MB L3
Intel Core i5-13400 compare2.5 - 4.6 GHz10 / 16 cores20 MB L3
Clock1200 MHz2500 - 4600 MHz
Cores / Threads4 / 410 / 16
Technology28 nm10 nm
FeaturesLTE, HSPA+, EDGE, GSM, GPRS, LPDDR2/3 Memory ControllerIntel SSE4.1, Intel SSE4.2, Intel AVX2
iGPUQualcomm Adreno 305 (450 MHz)
ArchitectureARMx86
Announced
Manufacturerwww.qualcomm.comark.intel.com
L1 Cache0.1 MB
L2 Cache9.5 MB
L3 Cache20 MB
TDP65 Watt
Die Size257 mm2
max. Temp.100 °C
SocketLGA 1700
$196 U.S.

Benchmarks

Performance Rating - CB R15 + R20 + 7-Zip + X265 + Blender + 3DM11 CPU - i5-13400F
42.5 pt (59%)
Intel Core i5-13400F
42.5
max:
72.1 70%
0%
100%
Cinebench R23 - Cinebench R23 Multi Core
15911 Points (15%)
Cinebench R23 - Cinebench R23 Single Core
1744 Points (74%)
Cinebench R20 - Cinebench R20 CPU (Single Core)
672 Points (75%)
Cinebench R20 - Cinebench R20 CPU (Multi Core)
6091 Points (15%)
Cinebench R15 - Cinebench R15 CPU Multi 64 Bit
2364 Points (15%)
Cinebench R15 - Cinebench R15 CPU Single 64 Bit
252 Points (76%)
Cinebench R11.5 - Cinebench R11.5 CPU Multi 64 Bit
27.5 Points (36%)
Cinebench R11.5 - Cinebench R11.5 CPU Single 64 Bit
3.1 Points (76%)
Cinebench R10 - Cinebench R10 Rend. Single (32bit)
8689 Points (52%)
Cinebench R10 - Cinebench R10 Rend. Multi (32bit)
51113 Points (37%)
Cinebench R10 - Cinebench R10 Rend. Multi (64bit)
82988 Points (58%)
Cinebench R10 - Cinebench R10 Rend. Single (64bit)
13947 Points (17%)
wPrime 2.10 - wPrime 2.0 1024m *
367.9 s (4%)
wPrime 2.10 - wPrime 2.0 32m *
3.3 s (1%)
WinRAR - WinRAR 4.0
8602 Points (14%)
7-Zip 18.03 - 7-Zip 18.03 Multli Thread 4 runs
60048 MIPS (34%)
7-Zip 18.03 - 7-Zip 18.03 Single Thread 4 runs
5743 MIPS (69%)
X264 HD Benchmark 4.0 - x264 Pass 2
136.9 fps (48%)
X264 HD Benchmark 4.0 - x264 Pass 1
314.5 fps (73%)
HWBOT x265 Benchmark v2.2 - HWBOT x265 4k Preset
19.2 fps (34%)
TrueCrypt - TrueCrypt Serpent
1.1 GB/s (0%)
TrueCrypt - TrueCrypt Twofish
2 GB/s (34%)
TrueCrypt - TrueCrypt AES
12.2 GB/s (32%)
Blender - Blender 3.3 Classroom CPU *
336 Seconds (4%)
Blender - Blender 2.79 BMW27 CPU *
206 Seconds (1%)
R Benchmark 2.5 - R Benchmark 2.5 *
0.5 sec (10%)
3DMark 06 - CPU - 3DMark 06 - CPU
13989 Points (30%)
Super Pi mod 1.5 XS 1M - Super Pi mod 1.5 XS 1M *
8 s (2%)
Super Pi mod 1.5 XS 2M - Super Pi mod 1.5 XS 2M *
17.9 s (1%)
Super Pi Mod 1.5 XS 32M - Super Pi mod 1.5 XS 32M *
420.5 s (2%)
3DMark Vantage - 3DM Vant. Perf. CPU no Physx
77937 Points (68%)
3DMark 11 - 3DM11 Performance Physics
23820 Points (64%)
3DMark - 3DMark Ice Storm Physics
min: 7428     avg: 7552     median: 7549.5 (6%)     max: 7650 Points
77765 Points (63%)
3DMark - 3DMark Ice Storm Extreme Physics
min: 7235     avg: 7414     median: 7444 (6%)     max: 7552 Points
76636 Points (62%)
3DMark - 3DMark Ice Storm Unlimited Physics
min: 7763     avg: 7985     median: 7964 (7%)     max: 8189 Points
80273 Points (68%)
3DMark - 3DMark Cloud Gate Physics
19846 Points (50%)
3DMark - 3DMark Fire Strike Standard Physics
28087 Points (50%)
3DMark - 3DMark Time Spy CPU
12669 Points (53%)
Geekbench 5.5 - Geekbench 5.1 - 5.4 64 Bit Single-Core
1792 Points (76%)
Geekbench 5.5 - Geekbench 5.1 - 5.4 64 Bit Multi-Core
12095 Points (22%)
Geekbench 5.0 - Geekbench 5.0 64 Bit Single-Core
1721 Points (7%)
Geekbench 5.0 - Geekbench 5.0 64 Bit Multi-Core
12009 Points (38%)
Geekbench 4.4 - Geekbench 4.1 - 4.4 64 Bit Single-Core
7684 Points (77%)
Geekbench 4.4 - Geekbench 4.1 - 4.4 64 Bit Multi-Core
43856 Points (48%)
Geekbench 3 - Geekbench 3 32 Bit Multi-Core
min: 1057     avg: 1118     median: 1123 (2%)     max: 1142 Points
Geekbench 3 - Geekbench 3 32 Bit Single-Core
min: 314     avg: 336.2     median: 340 (7%)     max: 343 Points
Geekbench 2 - 32 Bit - Geekbench Stream
min: 355     avg: 362.5     median: 362.5 (3%)     max: 370 Points
Geekbench 2 - 32 Bit - Geekbench Memory
min: 1326     avg: 1336     median: 1336 (12%)     max: 1346 Points
Geekbench 2 - 32 Bit - Geekbench Floating Point
min: 1916     avg: 1924     median: 1923.5 (4%)     max: 1931 Points
Geekbench 2 - 32 Bit - Geekbench Integer
min: 1143     avg: 1148     median: 1147.5 (2%)     max: 1152 Points
Geekbench 2 - 32 Bit - Geekbench Total Score
min: 1375     avg: 1378     median: 1378 (4%)     max: 1381 Points
Linpack Android / IOS - Linpack Multi Thread
min: 155.7     avg: 228.5     median: 238.2 (8%)     max: 260.7 MFLOPS
Linpack Android / IOS - Linpack Single Thread
min: 59.4     avg: 74.6     median: 78 (8%)     max: 88.7 MFLOPS
Mozilla Kraken 1.1 - Kraken 1.1 Total Score *
min: 15671     avg: 19334     median: 17024 (20%)     max: 27129 ms
535 ms (1%)
Sunspider - Sunspider 1.0 Total Score *
min: 1086     avg: 1600     median: 1607.5 (18%)     max: 2616 ms
Sunspider - Sunspider 0.9.1 Total Score *
min: 1095     avg: 1449     median: 1553 (15%)     max: 1743 ms
Octane V2 - Octane V2 Total Score
min: 1260     avg: 1796     median: 1838 (2%)     max: 2183 Points
WebXPRT 4 - WebXPRT 4 Score
254 Points (73%)
WebXPRT 3 - WebXPRT 3 Score
294 Points (61%)
Vellamo 3.x - Vellamo 3.x Metal
min: 700     avg: 749     median: 763 (20%)     max: 804 Points
Vellamo 3.x - Vellamo 3.x Multicore Beta
min: 1005     avg: 1109     median: 1132 (25%)     max: 1192 Points
Vellamo 3.x - Vellamo 3.x Browser
min: 1554     avg: 1667     median: 1679 (22%)     max: 1767 Points
Quadrant Standard Edition 2.0 - Quadrant Standard 2.0 Total Score
min: 8550     avg: 8619     median: 8555 (20%)     max: 8751 points
AnTuTu v4 - AnTuTu v4 Total Score
min: 17412     avg: 17545     median: 17545 (41%)     max: 17678 Points
AnTuTu v5 - AnTuTu v5 Total Score
min: 17292     avg: 18309     median: 18346 (19%)     max: 19251 Points
AndEBench - AndEBench Java
min: 283     avg: 322.3     median: 333 (10%)     max: 340 Iter./s
AndEBench - AndEBench Native
min: 5998     avg: 6356     median: 6463 (21%)     max: 6500 Iter./s
PassMark PerformanceTest Mobile V1 - PerformanceTest Mobile V1 CPU Tests
min: 7370     avg: 7500     median: 7511.5 (1%)     max: 7608 Points
PCMark for Android - PCM f. Android Work Score
min: 2620     avg: 2695     median: 2694.5 (13%)     max: 2769 Points
CrossMark - CrossMark Overall
1941 Points (74%)
Power Consumption - Prime95 Power Consumption - external Monitor *
214 Watt (37%)
Power Consumption - Cinebench R15 Multi Power Consumption - external Monitor *
184.2 Watt (34%)
Power Consumption - Idle Power Consumption - external Monitor *
76.3 Watt (50%)

Average Benchmarks Qualcomm Snapdragon 400 MSM8926 → 100% n=4

Average Benchmarks Intel Core i5-13400F → 798% n=4

- Range of benchmark values for this graphics card
- Average benchmark values for this graphics card
* Smaller numbers mean a higher performance
1 This benchmark is not used for the average calculation

Add one or more devices and compare

In the following list you can select (and also search for) devices that should be added to the comparison. You can select more than one device.

restrict list:

show all (including archived), 2024, 2023
v1.28
log 04. 14:47:55

#0 checking url part for id 5958 +0s ... 0s

#1 checking url part for id 14966 +0s ... 0s

#2 redirected to Ajax server, took 1720097274 +0s ... 0s

#3 did not recreate cache, as it is less than 5 days old! Created at Thu, 04 Jul 2024 05:15:21 +0200 +0s ... 0s

#4 composed specs +0.005s ... 0.005s

#5 did output specs +0s ... 0.005s

#6 getting avg benchmarks for device 5958 +0.001s ... 0.005s

#7 got single benchmarks 5958 +0.009s ... 0.014s

#8 getting avg benchmarks for device 14966 +0.007s ... 0.021s

#9 got single benchmarks 14966 +0.004s ... 0.025s

#10 got avg benchmarks for devices +0s ... 0.025s

#11 min, max, avg, median took s +0.039s ... 0.064s

#12 return log +0.002s ... 0.066s

Please share our article, every link counts!
> Expert Reviews and News on Laptops, Smartphones and Tech Innovations > Benchmarks / Tech > Processor Comparison - Head 2 Head
Redaktion, 2017-09- 8 (Update: 2023-07- 1)