 Deutsch
 English
 Español
 Français
 Italiano
 Nederlands
 Polski
 Português
 Русский
 Türkçe
 Svenska
 Chinese
 Magyar
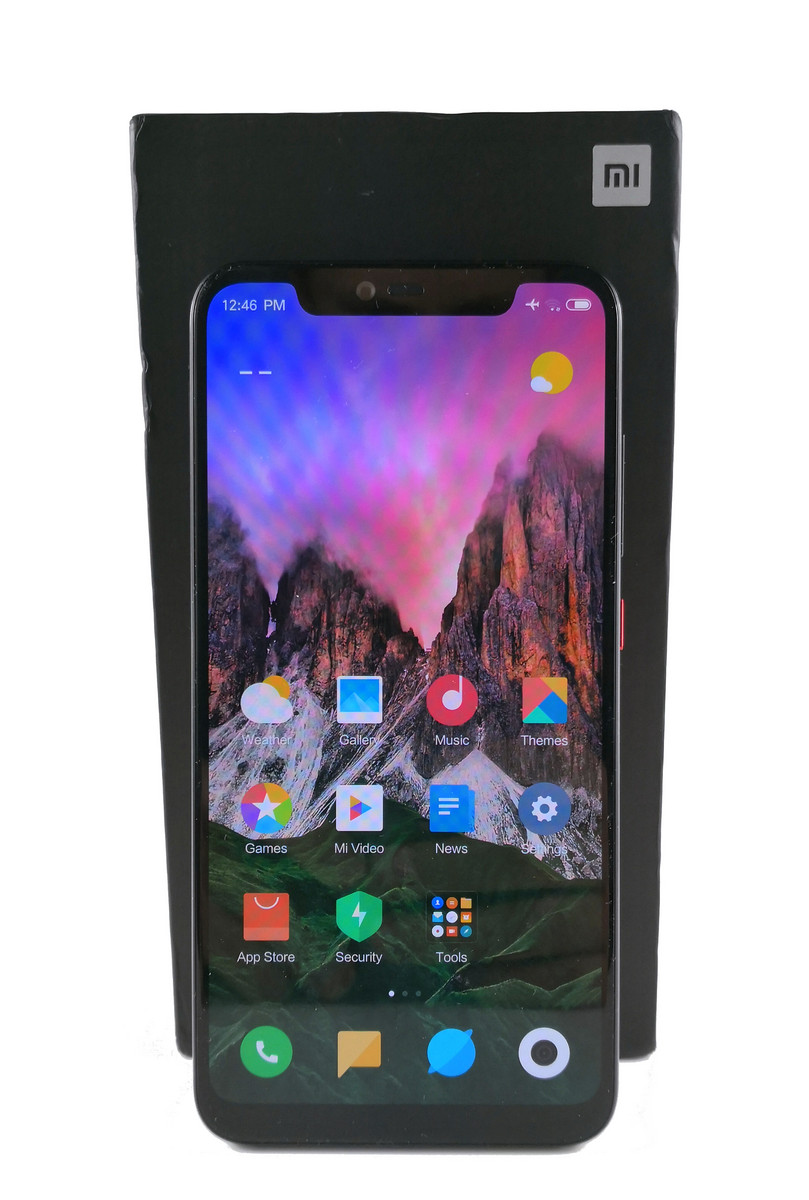
Xiaomi Mi 8 Explorer Edition Smartphone Review

Xiaomi has jumped to naming its devices number eight this year, both because of the company’s eight-year anniversary and potentially because the number seven is considered unlucky in some parts of China. Moreover, representatives for Xiaomi have spoken of their expectations for the Mi 8, and so “7” has been skipped.
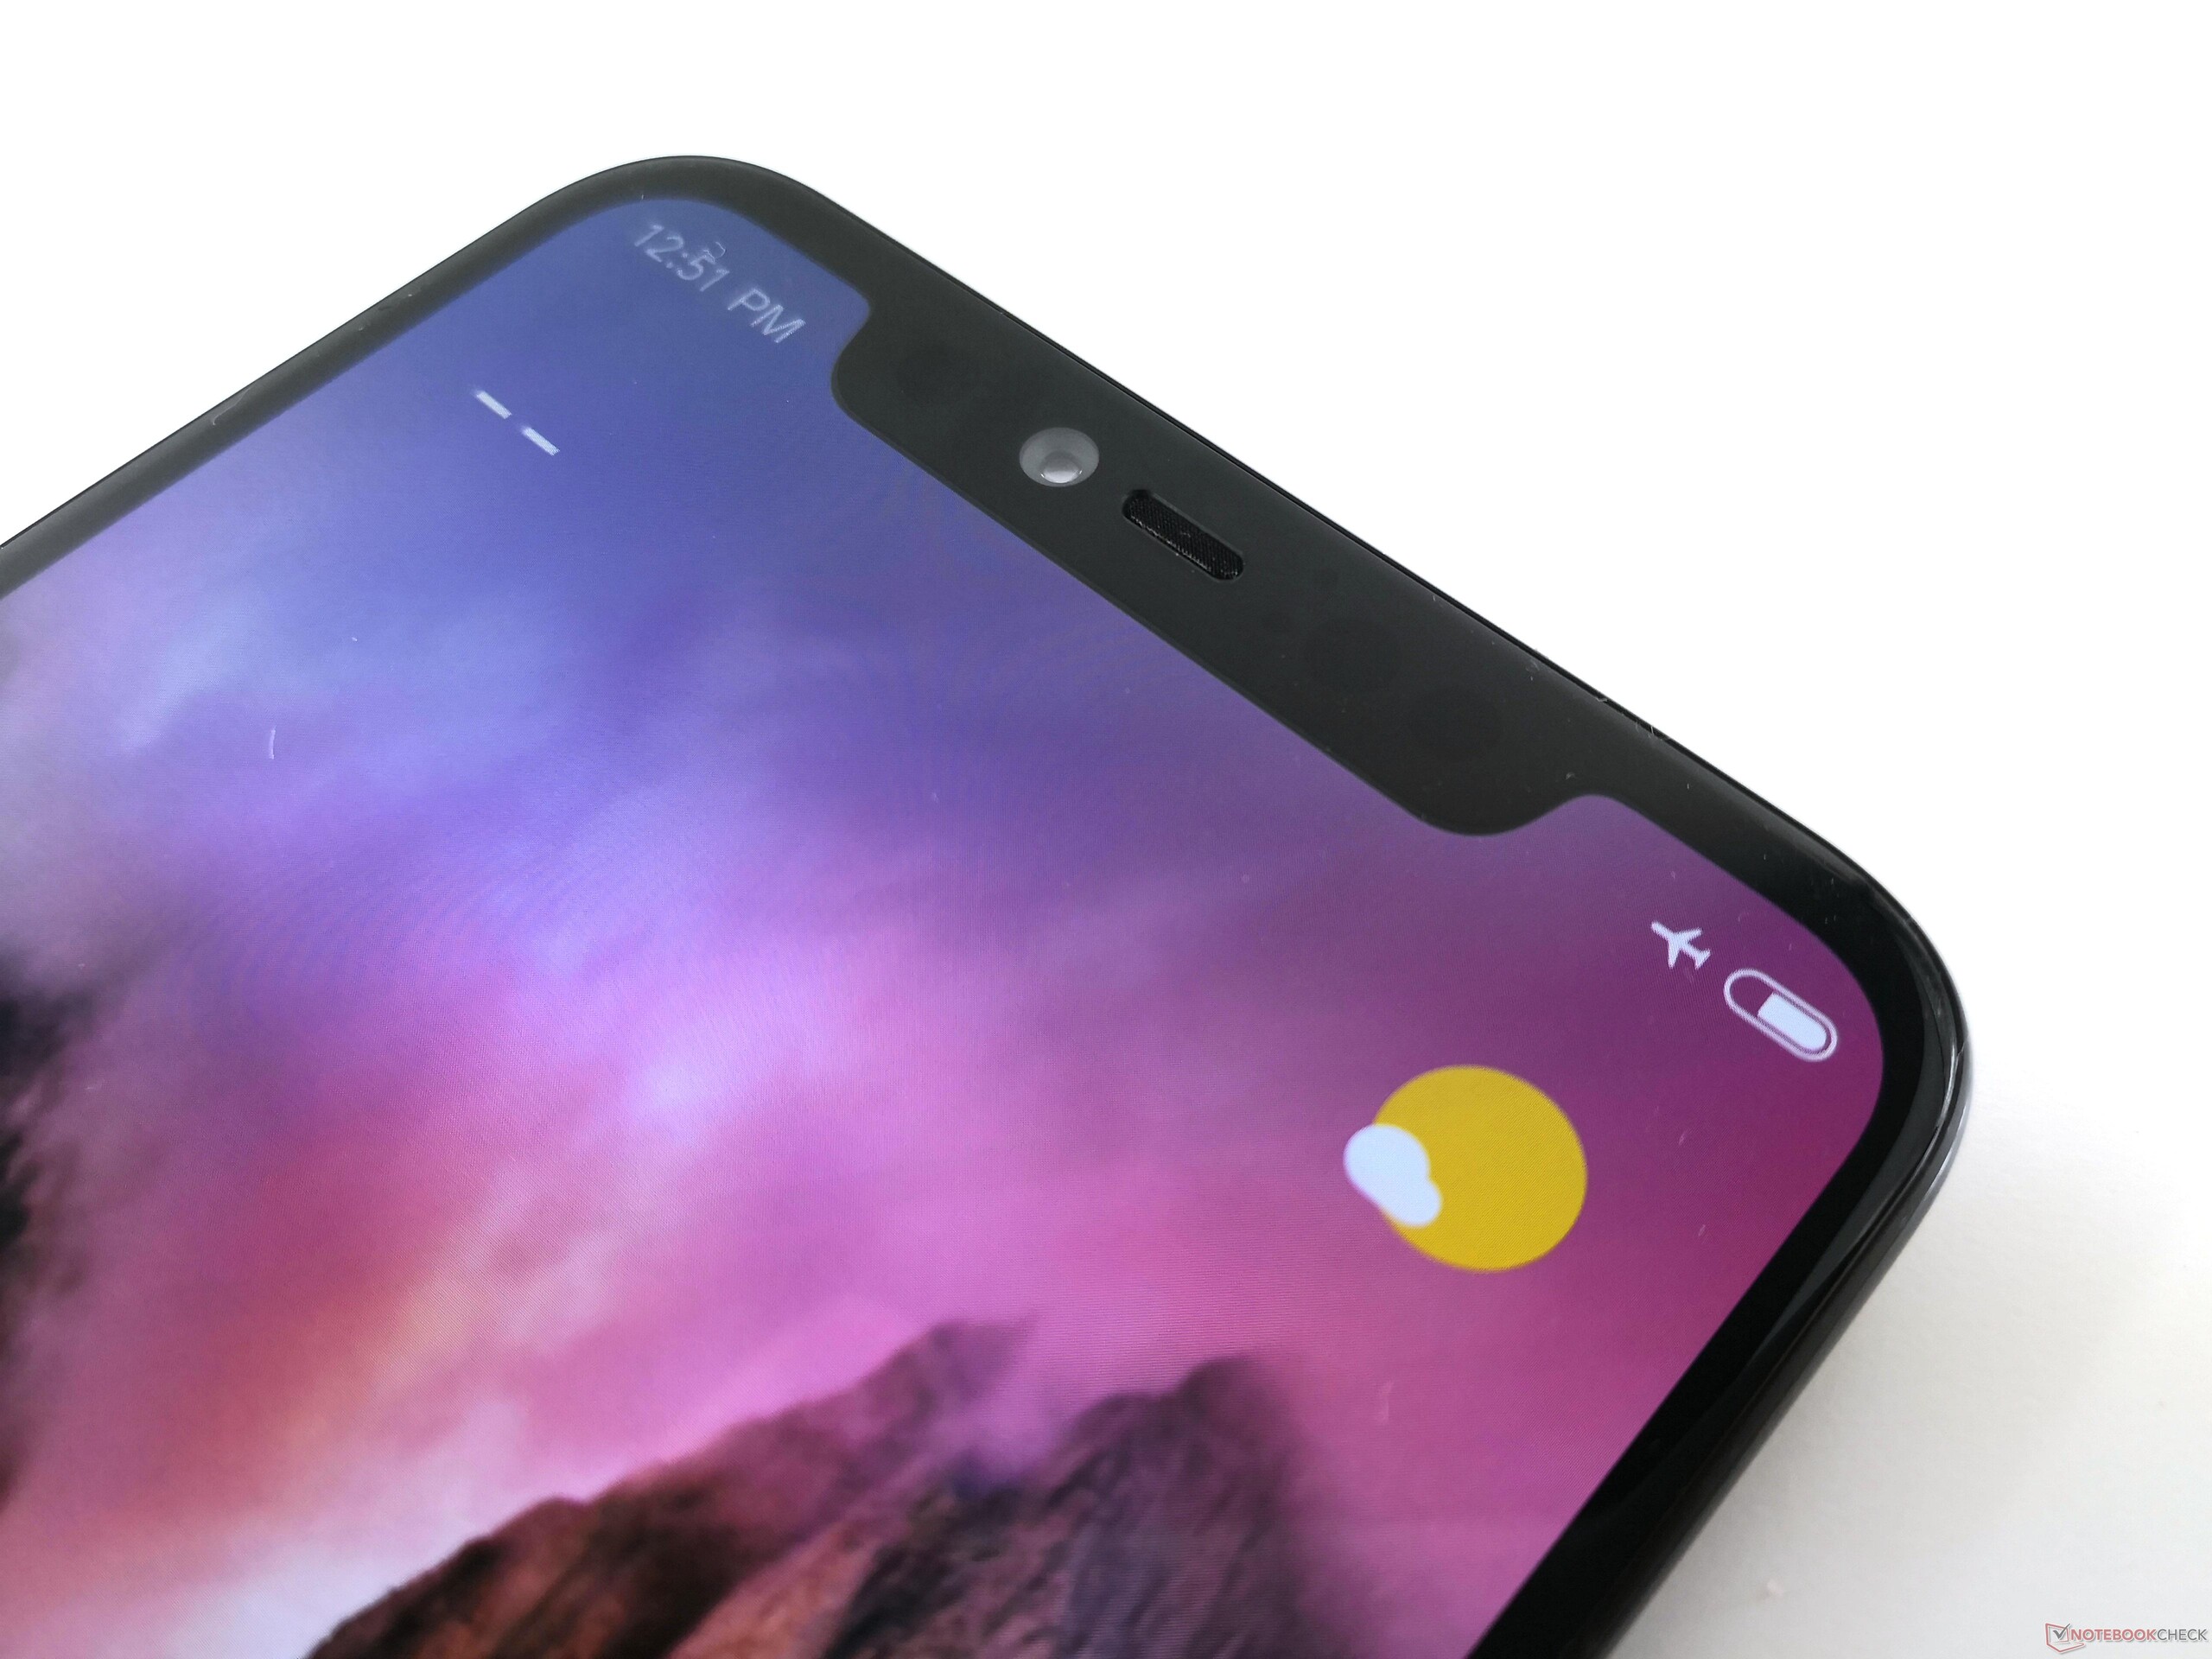
Xiaomi continues to price its flagship models aggressively against its American and South Korean competitors, equipping all Mi 8 devices with a Qualcomm Snapdragon 845 SoC that clocks up to 2.8 GHz. The Mi 8 has a 6.21-inch AMOLED display with an 18.7:9 aspect ratio. The display also has a notch that houses face detection sensors and a 20 MP front-facing camera; notches have practically become obligatory for 2018 flagship smartphones. The Mi 8 is equipped with dual 12 MP rear-facing cameras too.
The Mi 8 is available with 6 GB RAM and either 64 GB, 128 GB or 256 GB of UFS storage. By contrast, Xiaomi only equips the Explorer Edition with 8 GB RAM and 128 GB of storage. We will be highlighting the differences between the Mi 8 and the Mi 8 Explorer Edition throughout this review.
In previous years it has only been possible to import Xiaomi devices from third-party Chinese suppliers. However, the entry level Mi 8 is available from German suppliers for around 430 Euros (~$497) at the time of writing. Importing the device saves around 60-70 Euros (~$69-$80), but there are some things that you must consider before doing so. Please read our article about importing smartphones here for further information.
The Mi 8 Explorer Edition is currently considerably more expensive and only available from Chinese suppliers. The Mi 8 Explorer Edition costs around 580 Euros (~$670) at the time of writing.
We have chosen to compare the Mi 8 Explorer Edition against the HTC U12 Plus, the Huawei P20, the OnePlus 6, the Samsung Galaxy S9, the Xiaomi Mi Mix 2S and the Xiaomi Black Shark. The OnePlus 6 and the two Xiaomi devices are similarly priced to the Mi 8 Explorer Edition, for reference.
Case
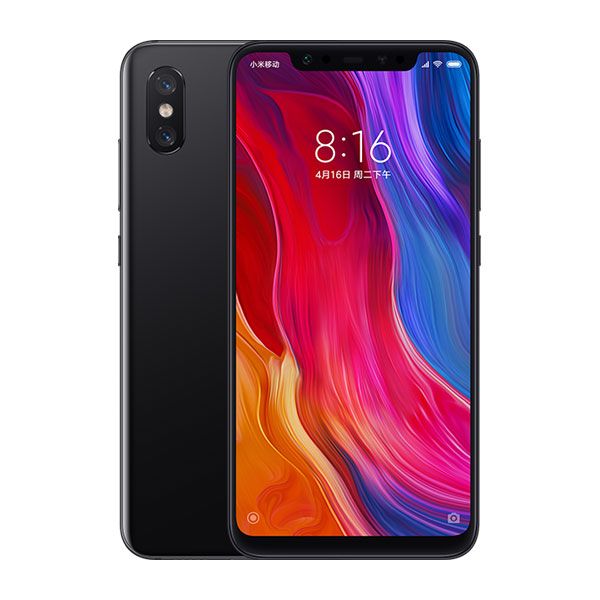

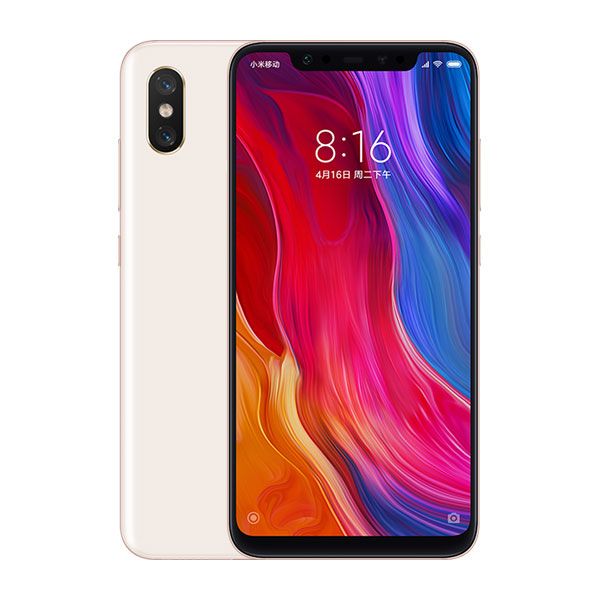
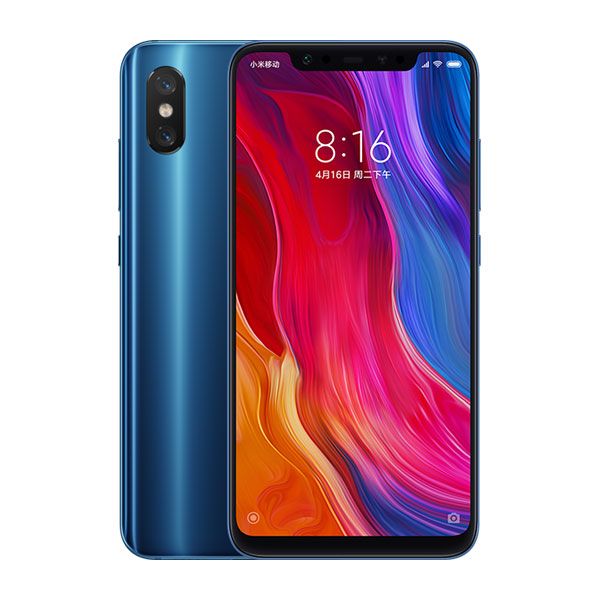
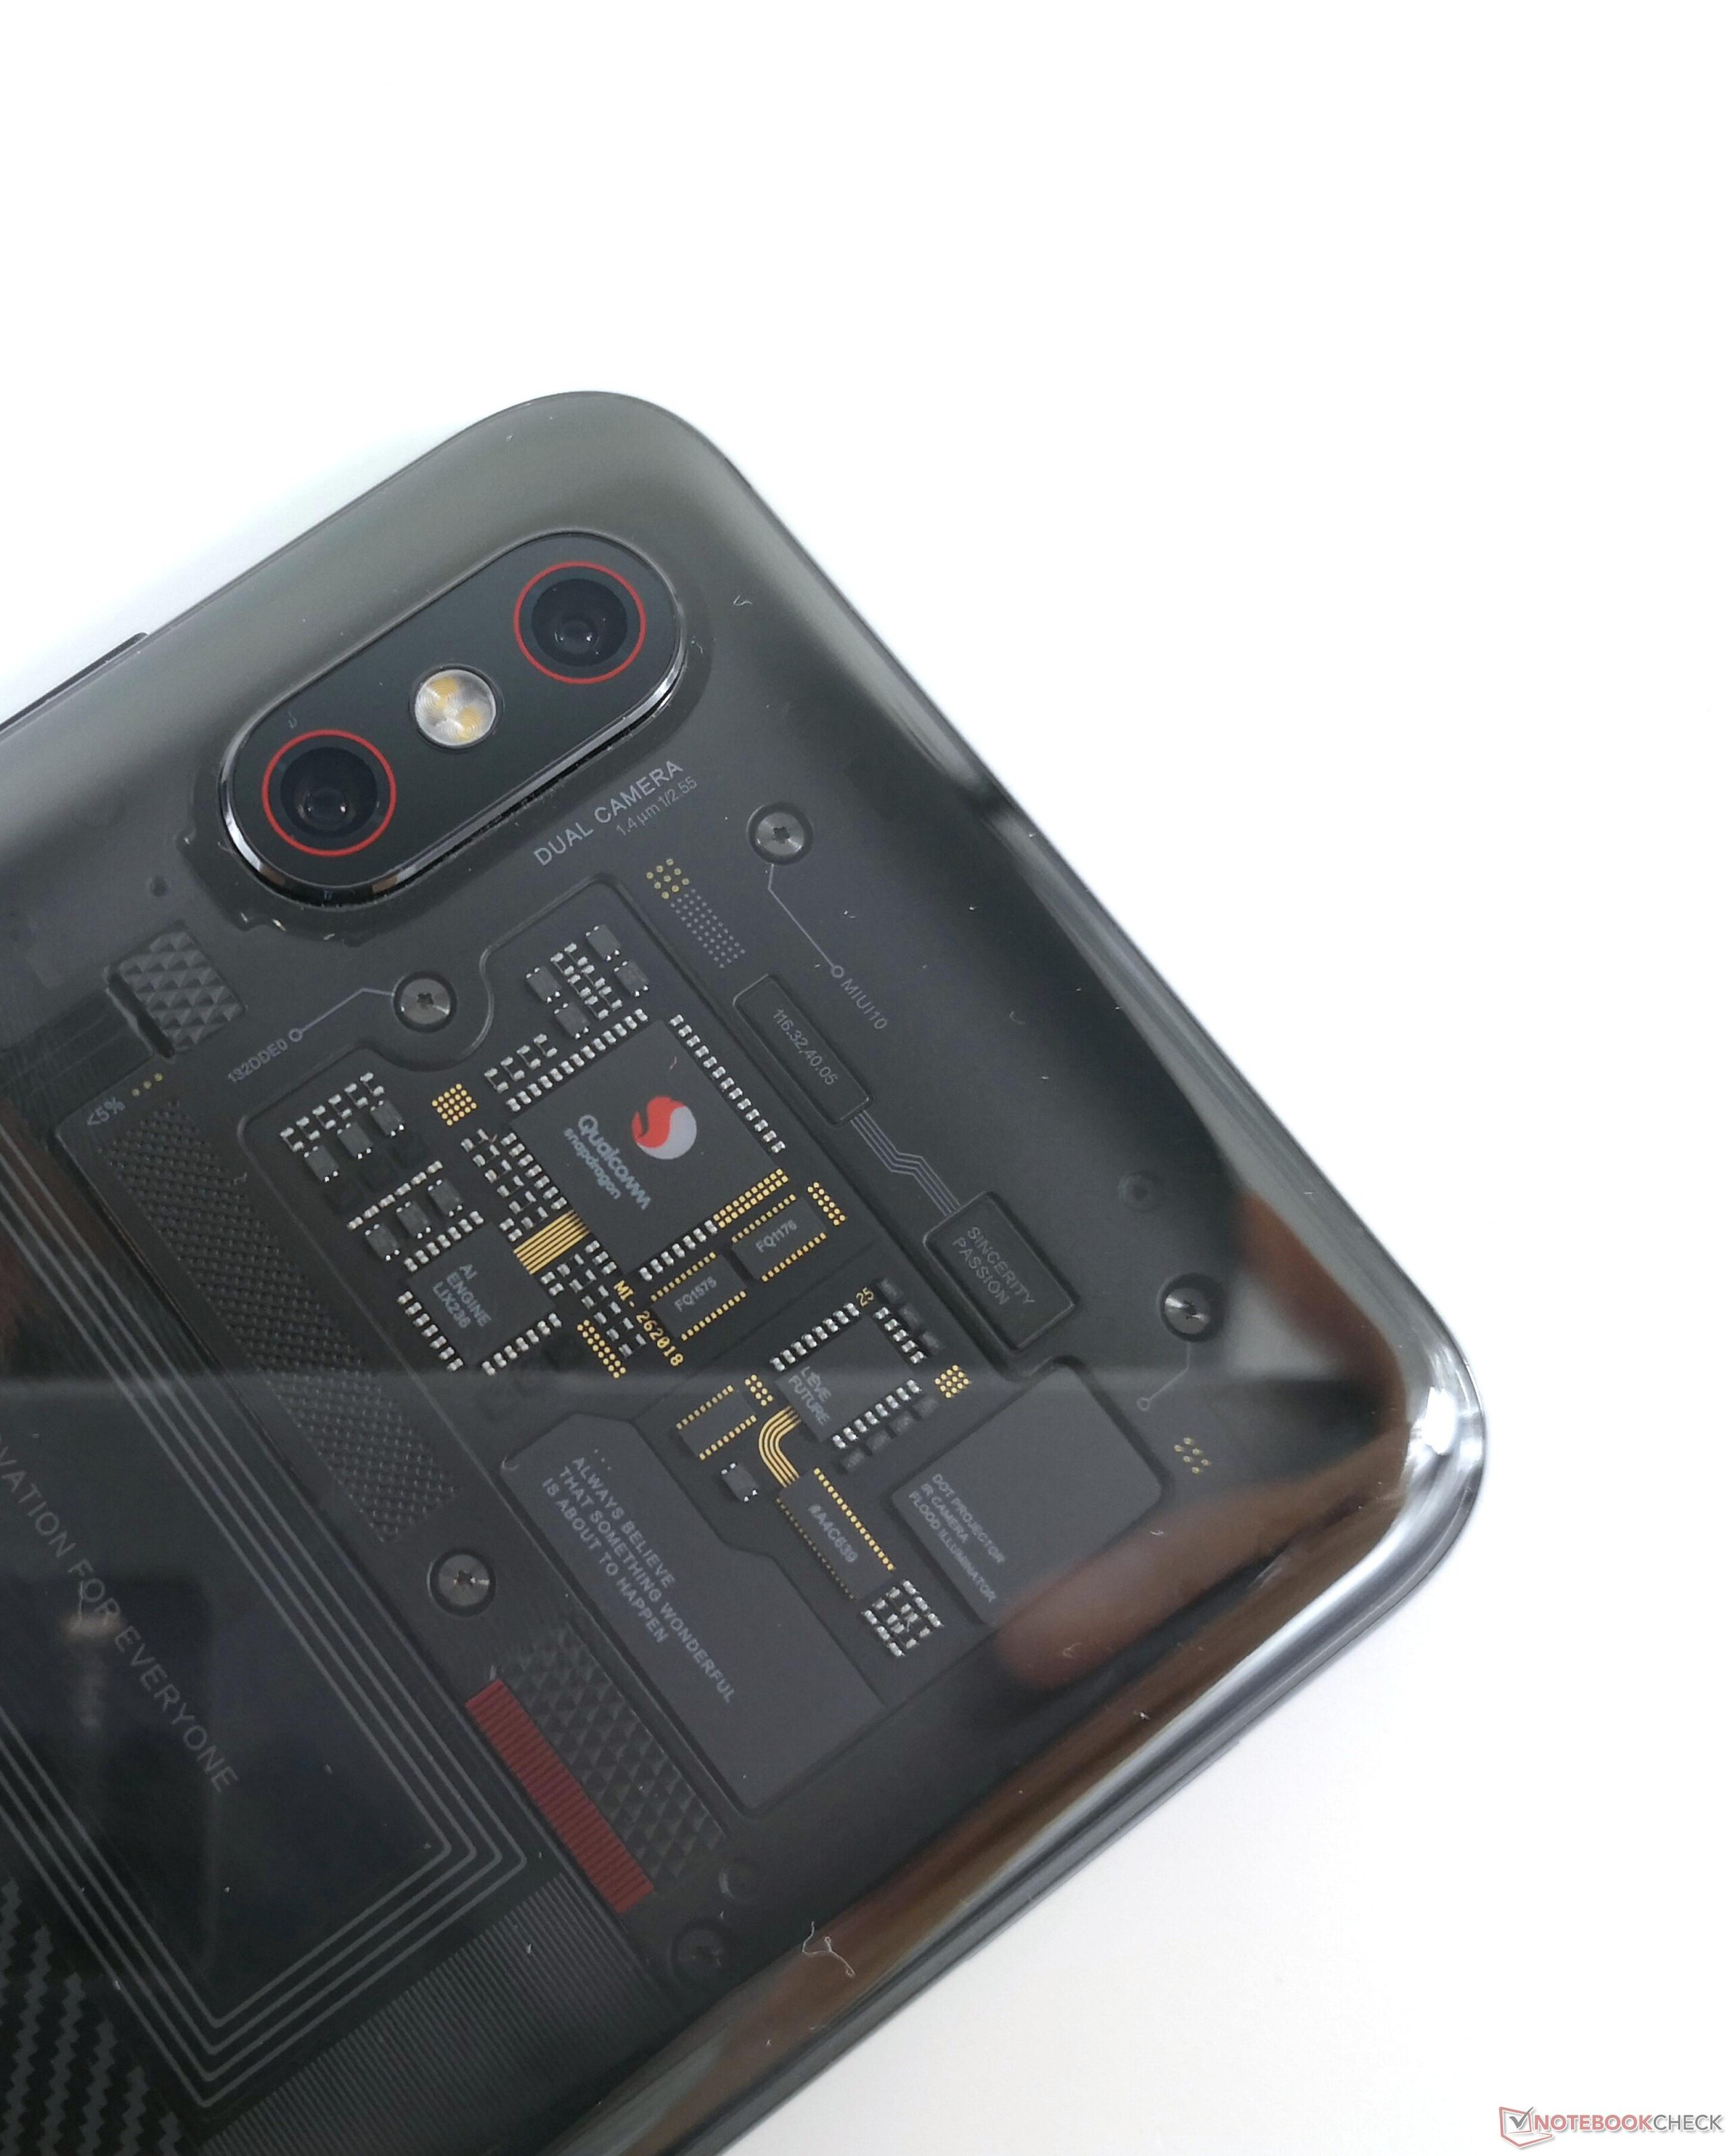
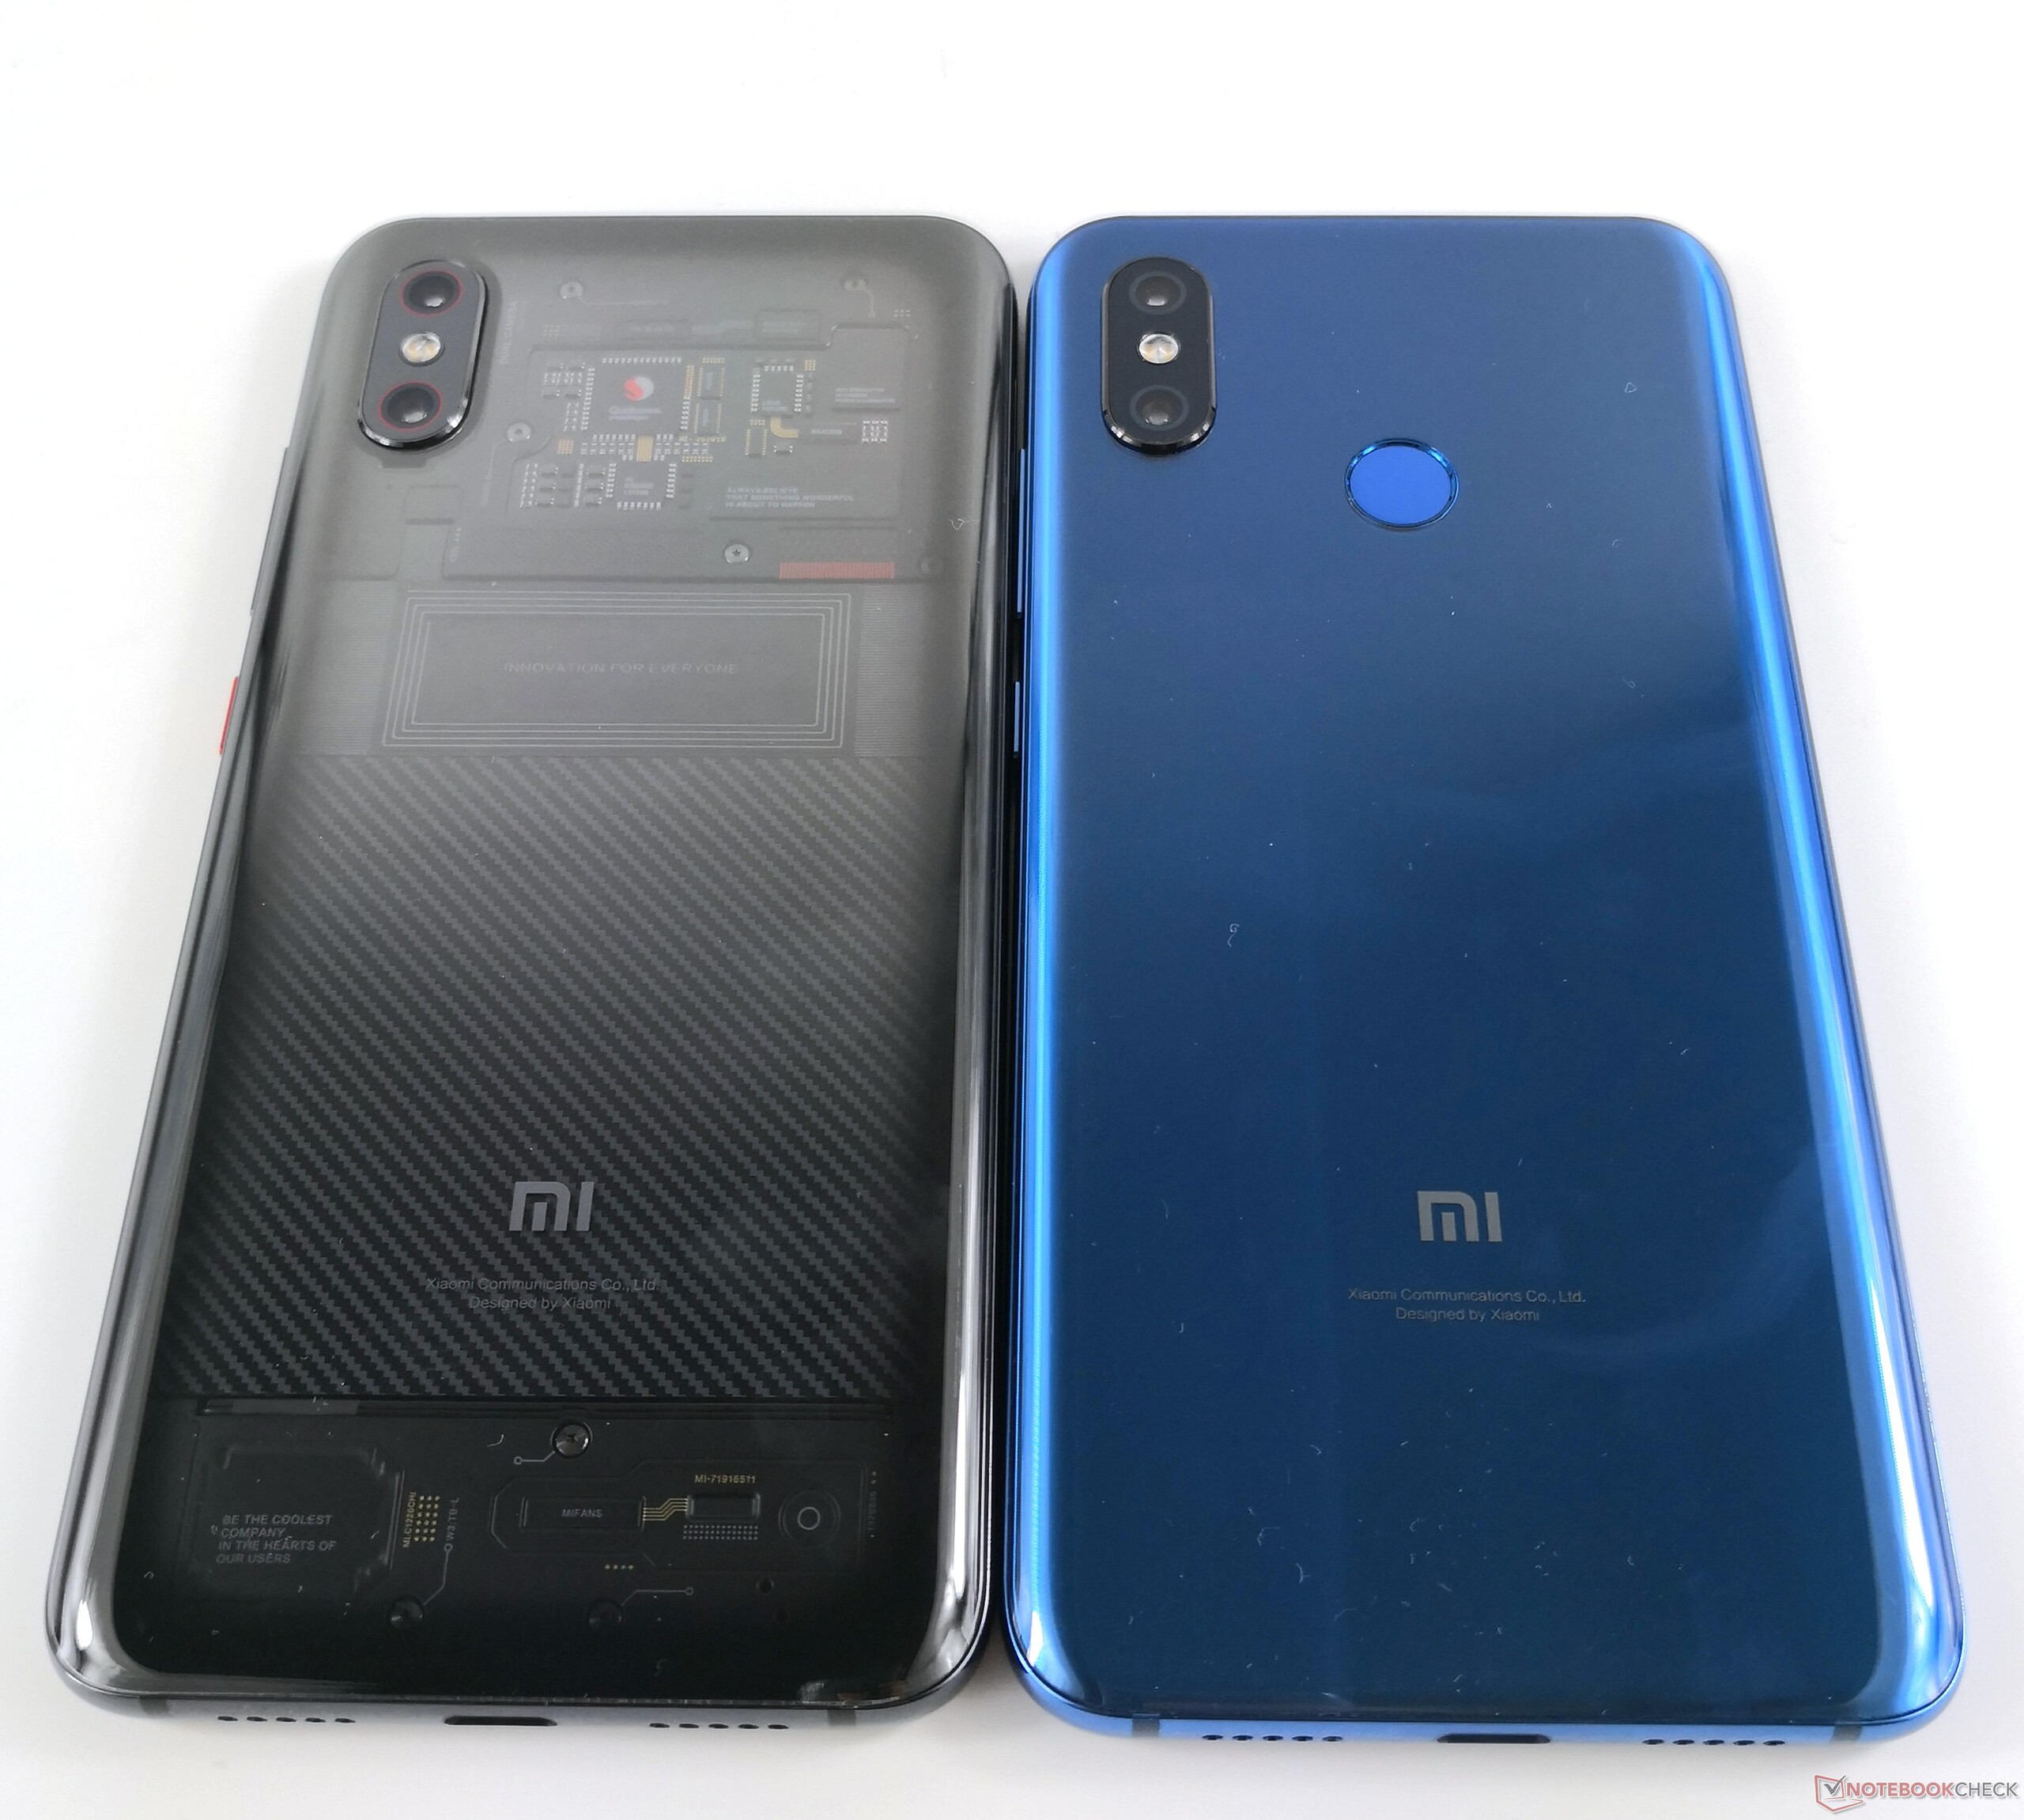
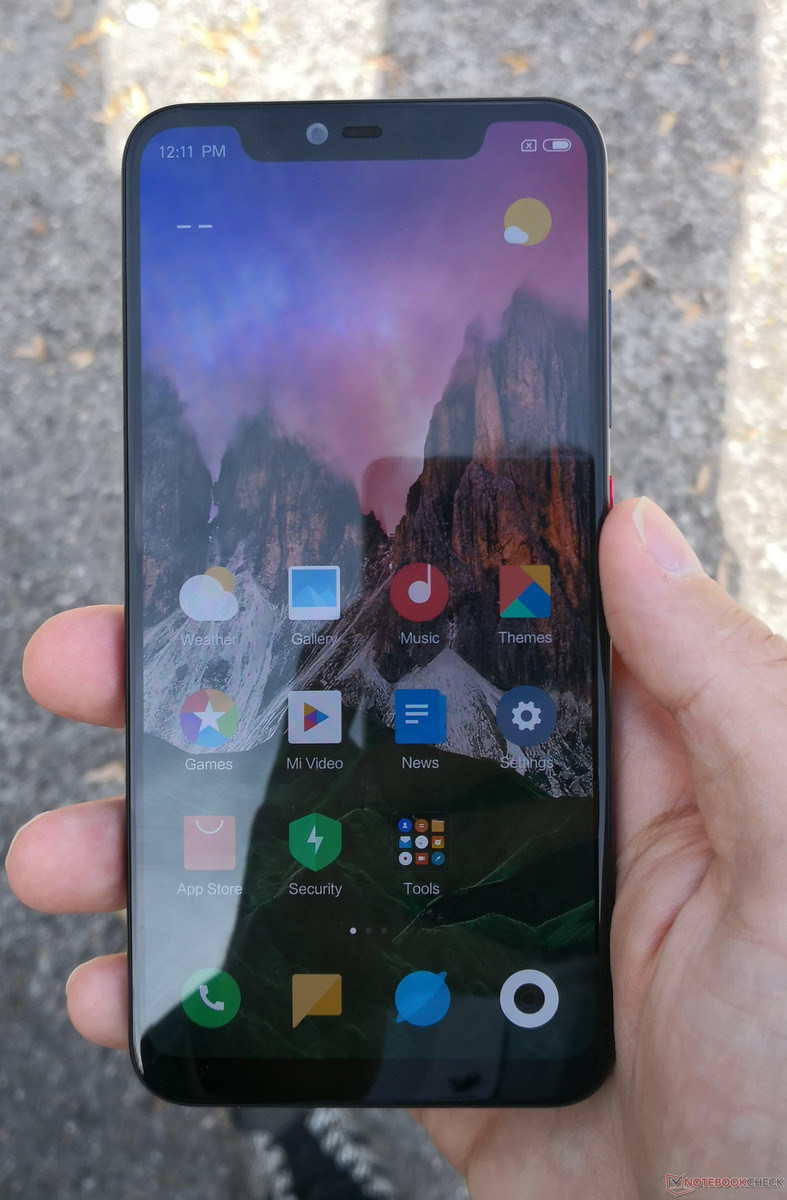
The Mi 8 and the Explorer Edition are made of aluminum and glass. Our test device is well-built and feels good in the hand thanks to both its slightly curved rear edges and its 7.5 mm thick case. The Mi 8 is available in black, blue, gold or white while the Explorer Edition is only available in black with a transparent back.
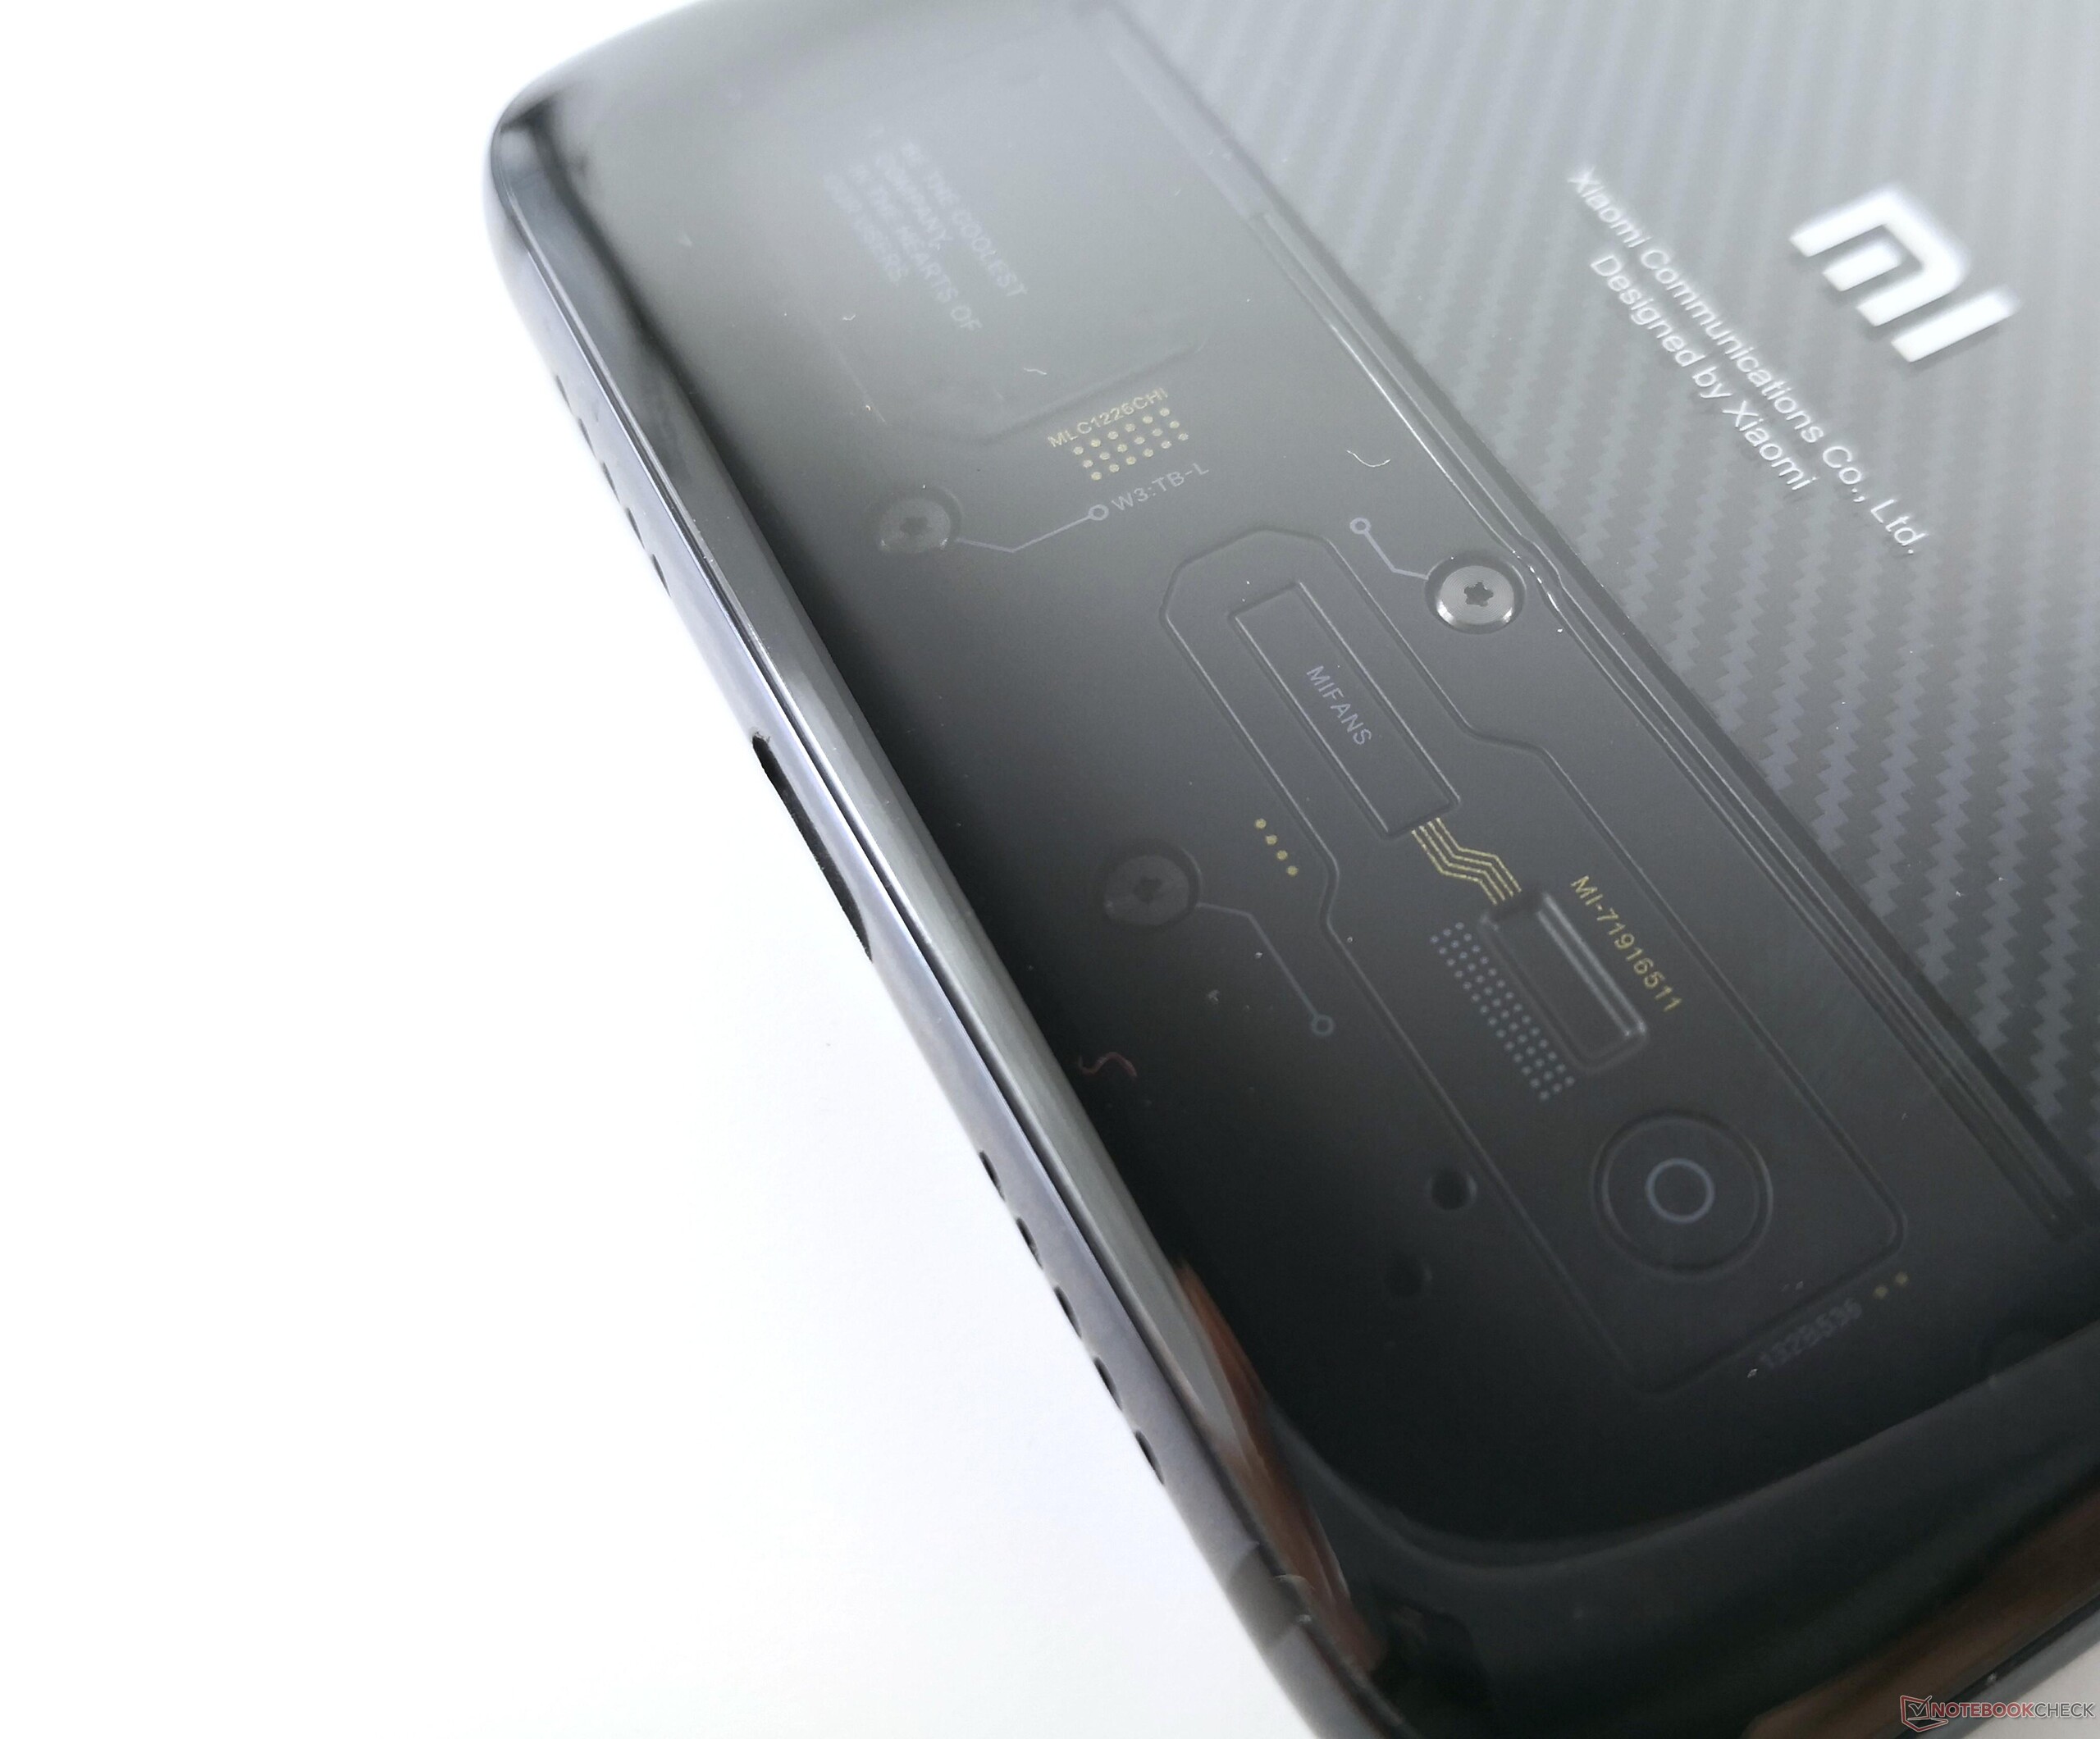
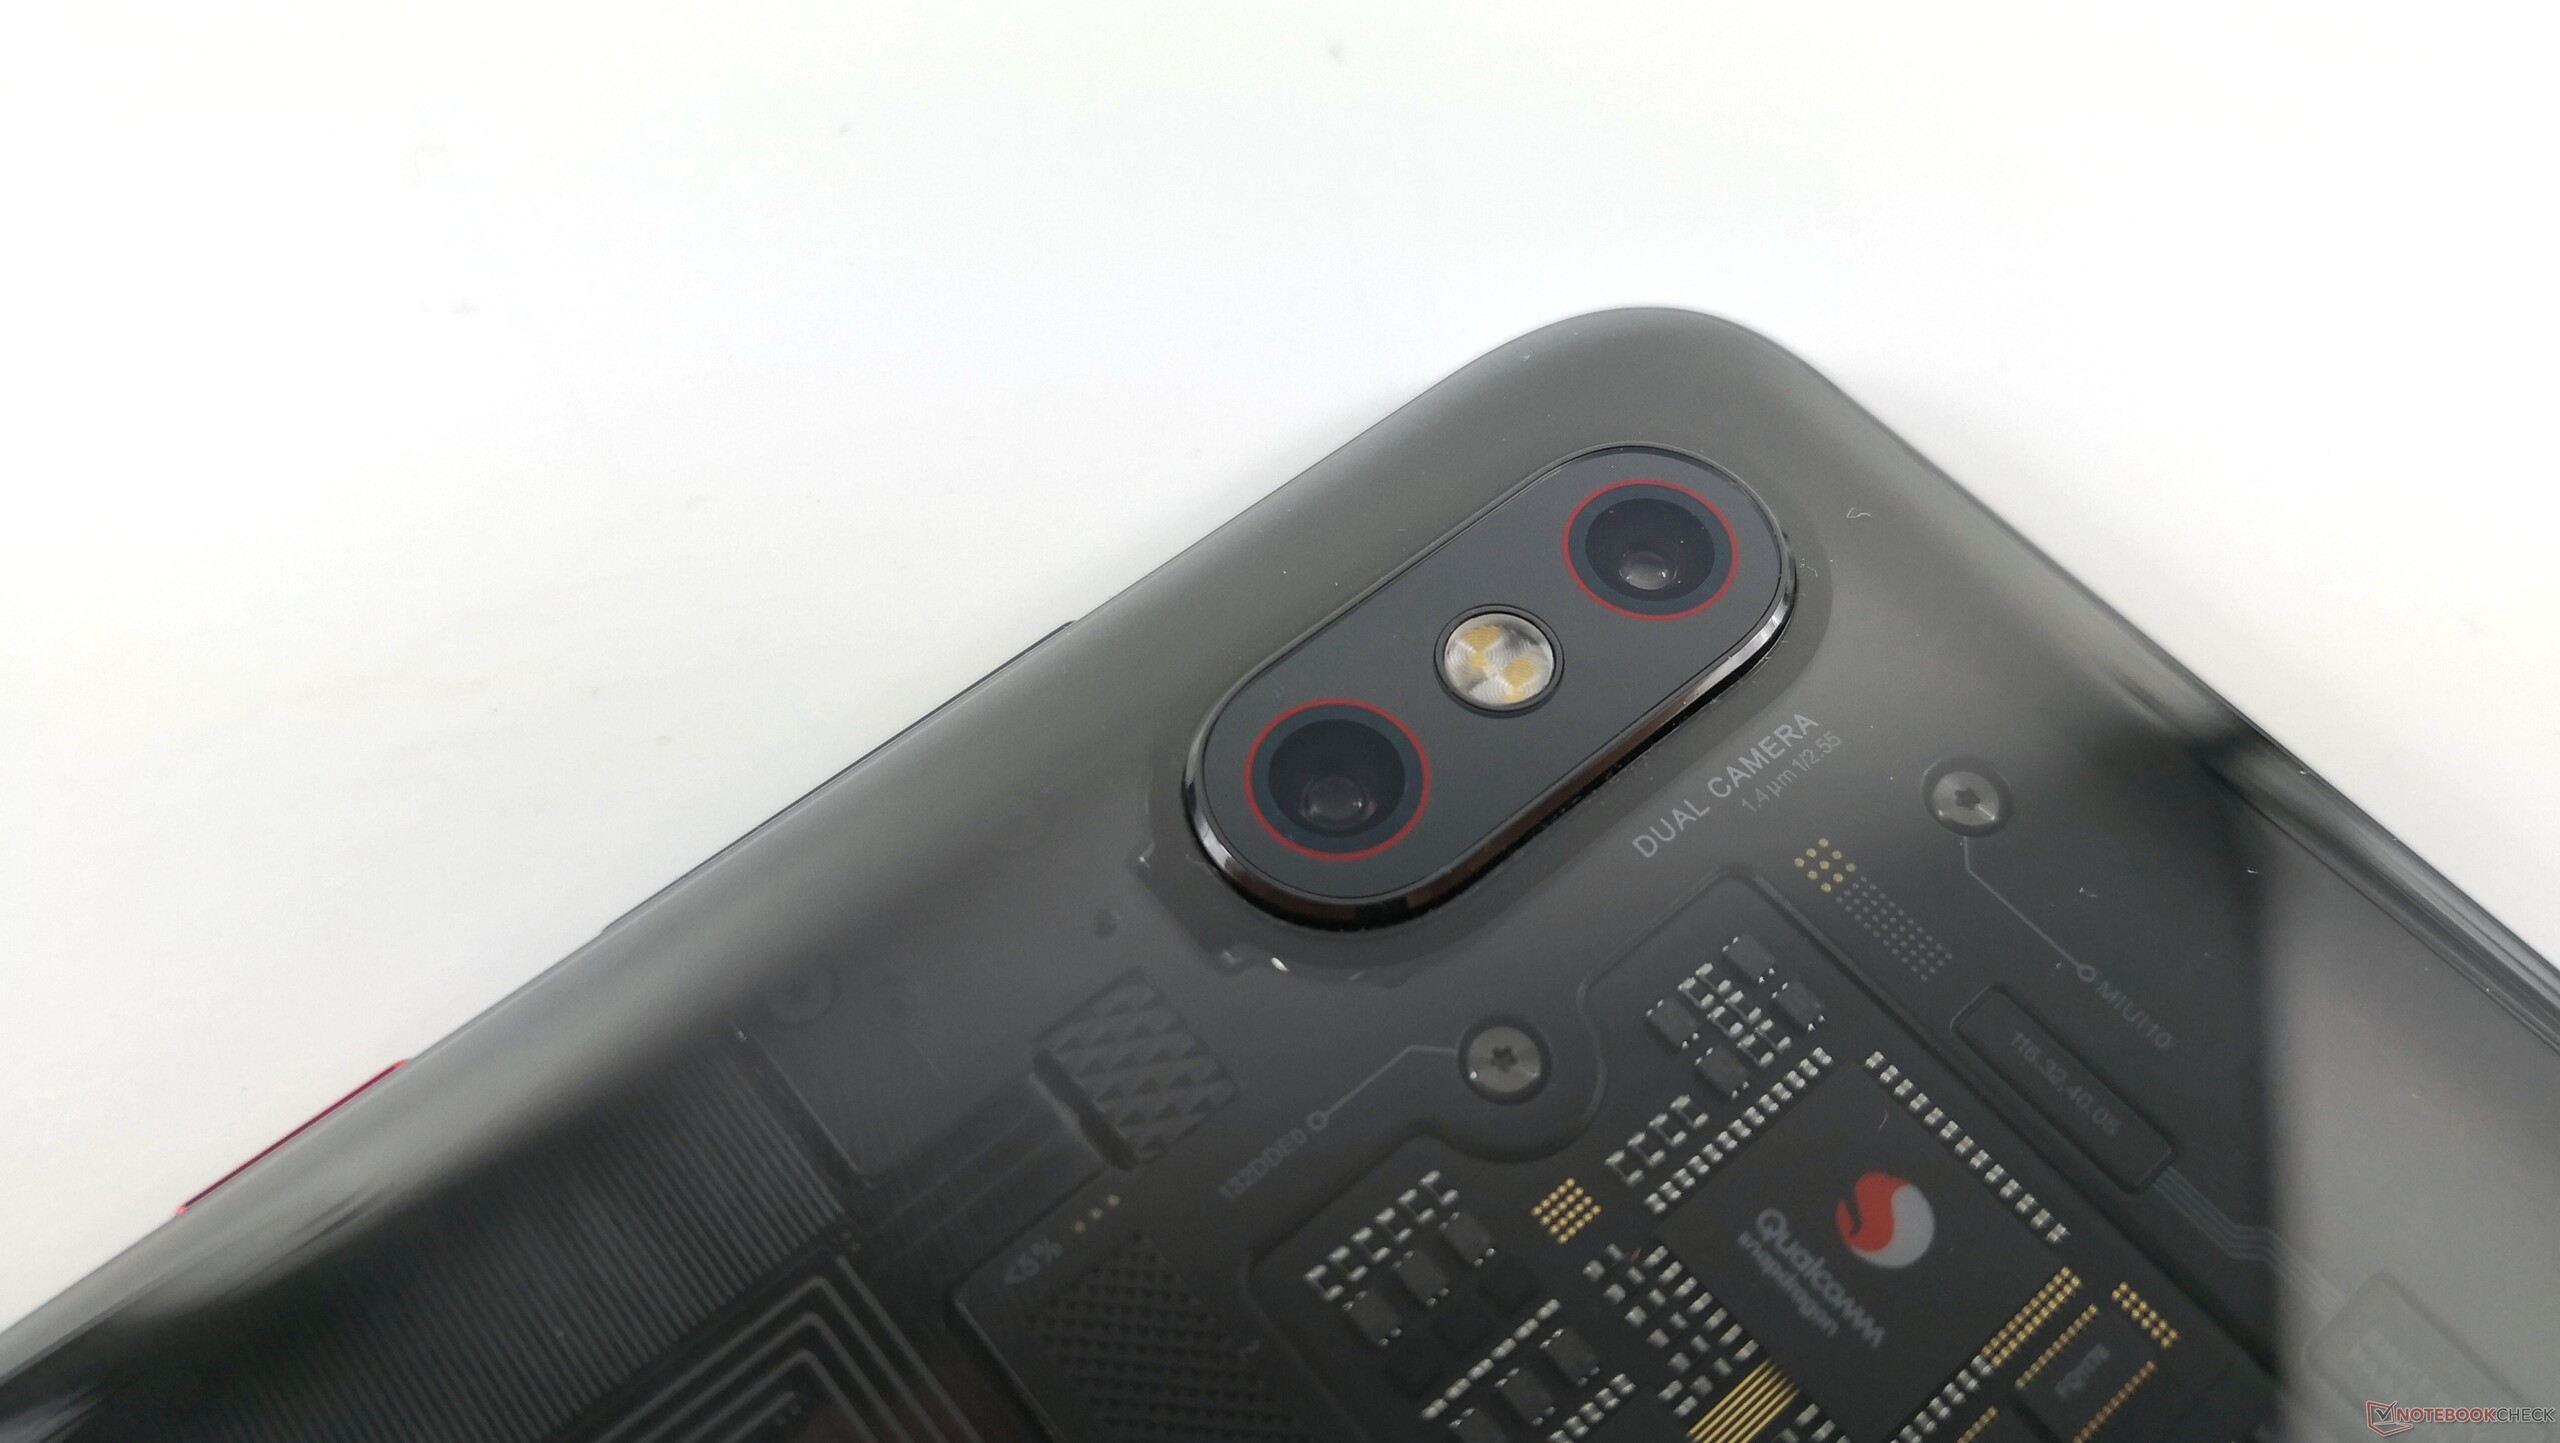
The Explorer Edition’s transparent back appears to show the device’s internal components. Not is all as it seems though. The visible motherboard and processor are just dummies, with the working components hidden beneath. This may be for visual reasons as the real hardware will look less visually attractive than the perfectly arranged and labeled plastic version. Regardless of Xiaomi’s tricks, the Explorer Edition looks great and is a real eye-catcher.
The front of the Mi 8 is made of scratch-resistant 2.5 D Corning Gorilla Glass 5, which blends subtly into the frame. The AMOLED display has around 3-millimeter thick side bezels while the top bezel is reduced because of the notched display. The Mi 8 has an 84% screen-to-body ratio overall.
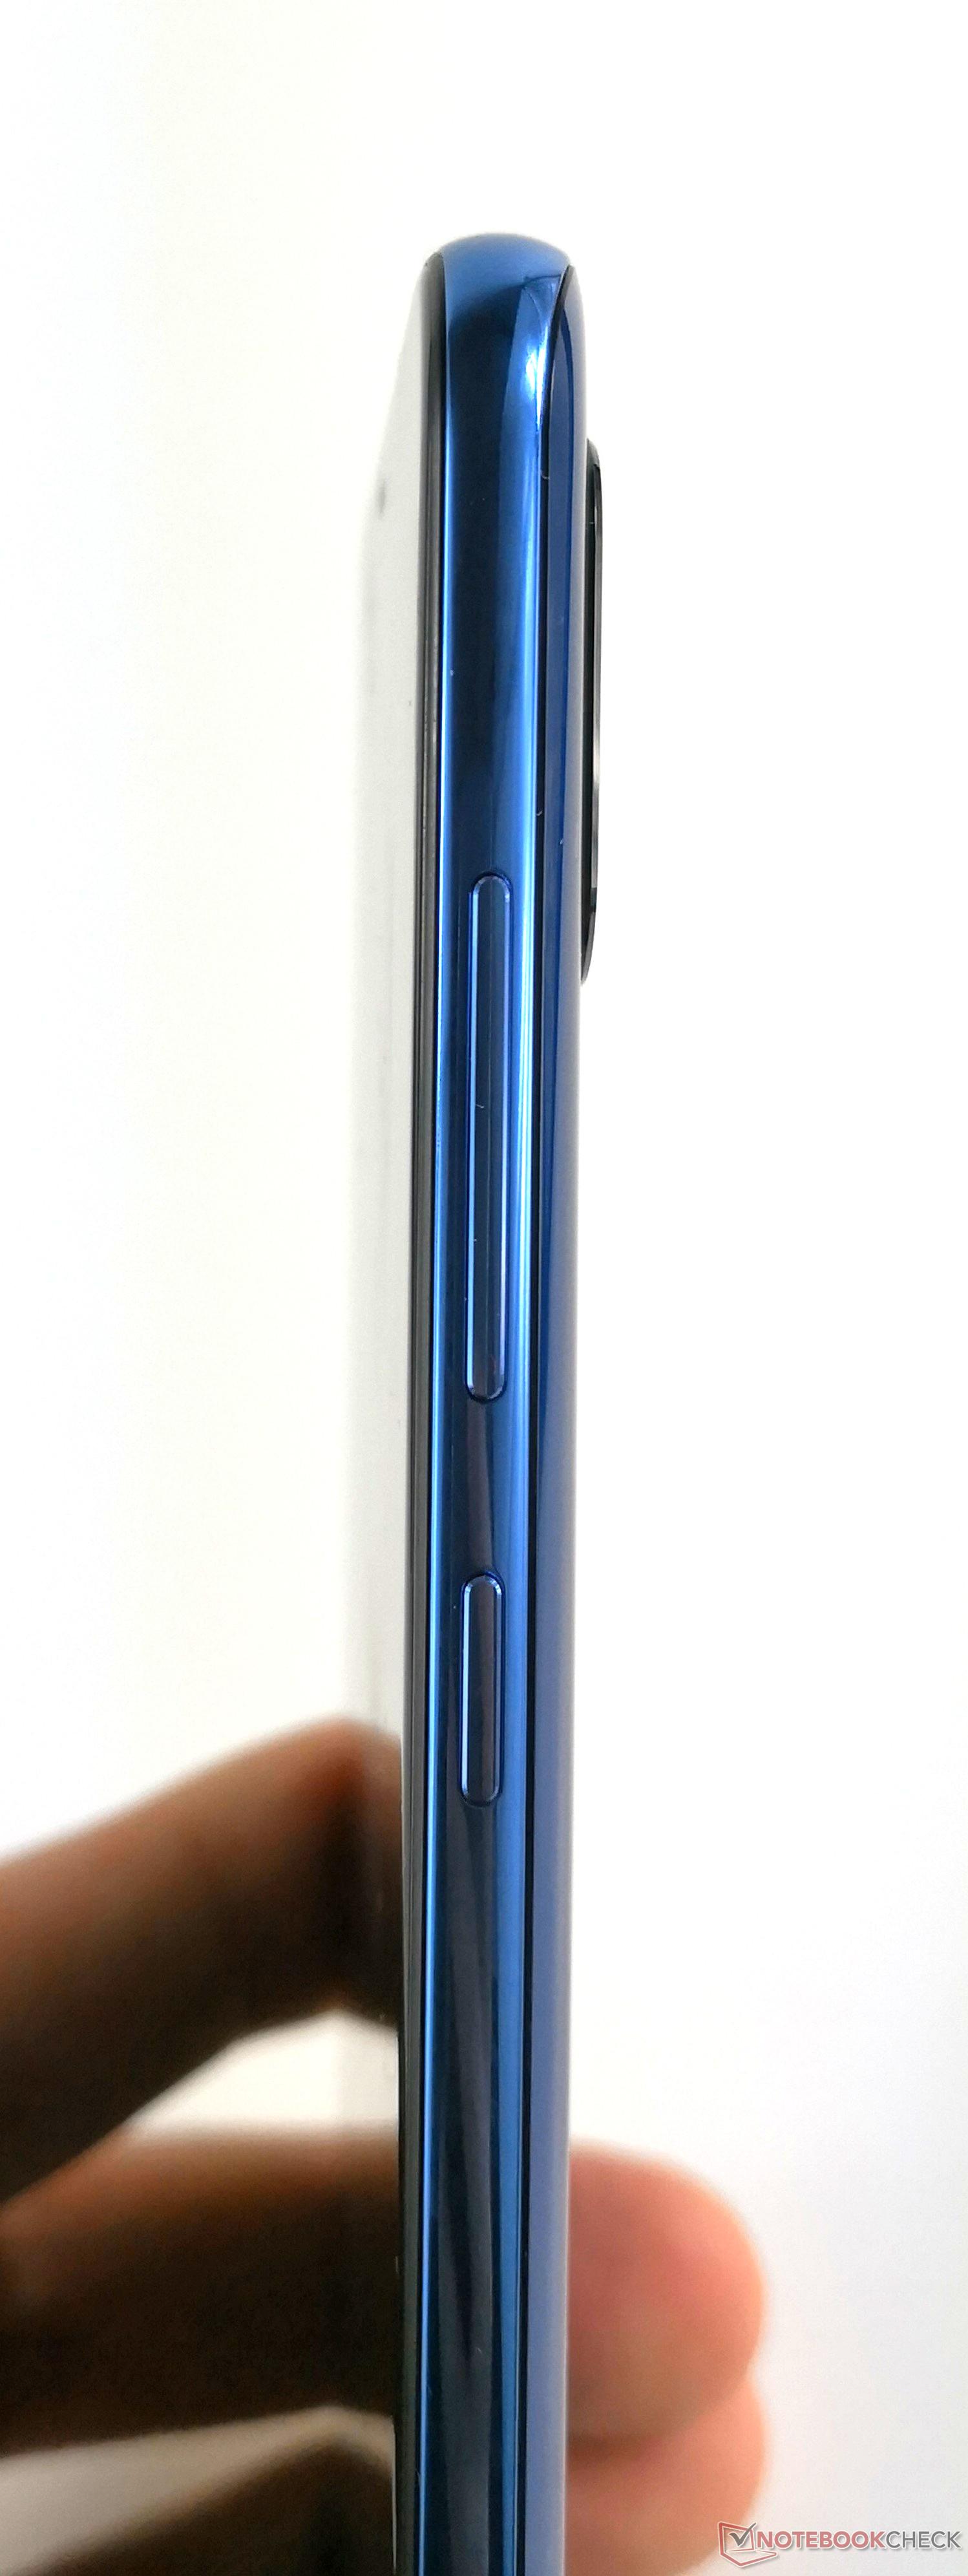
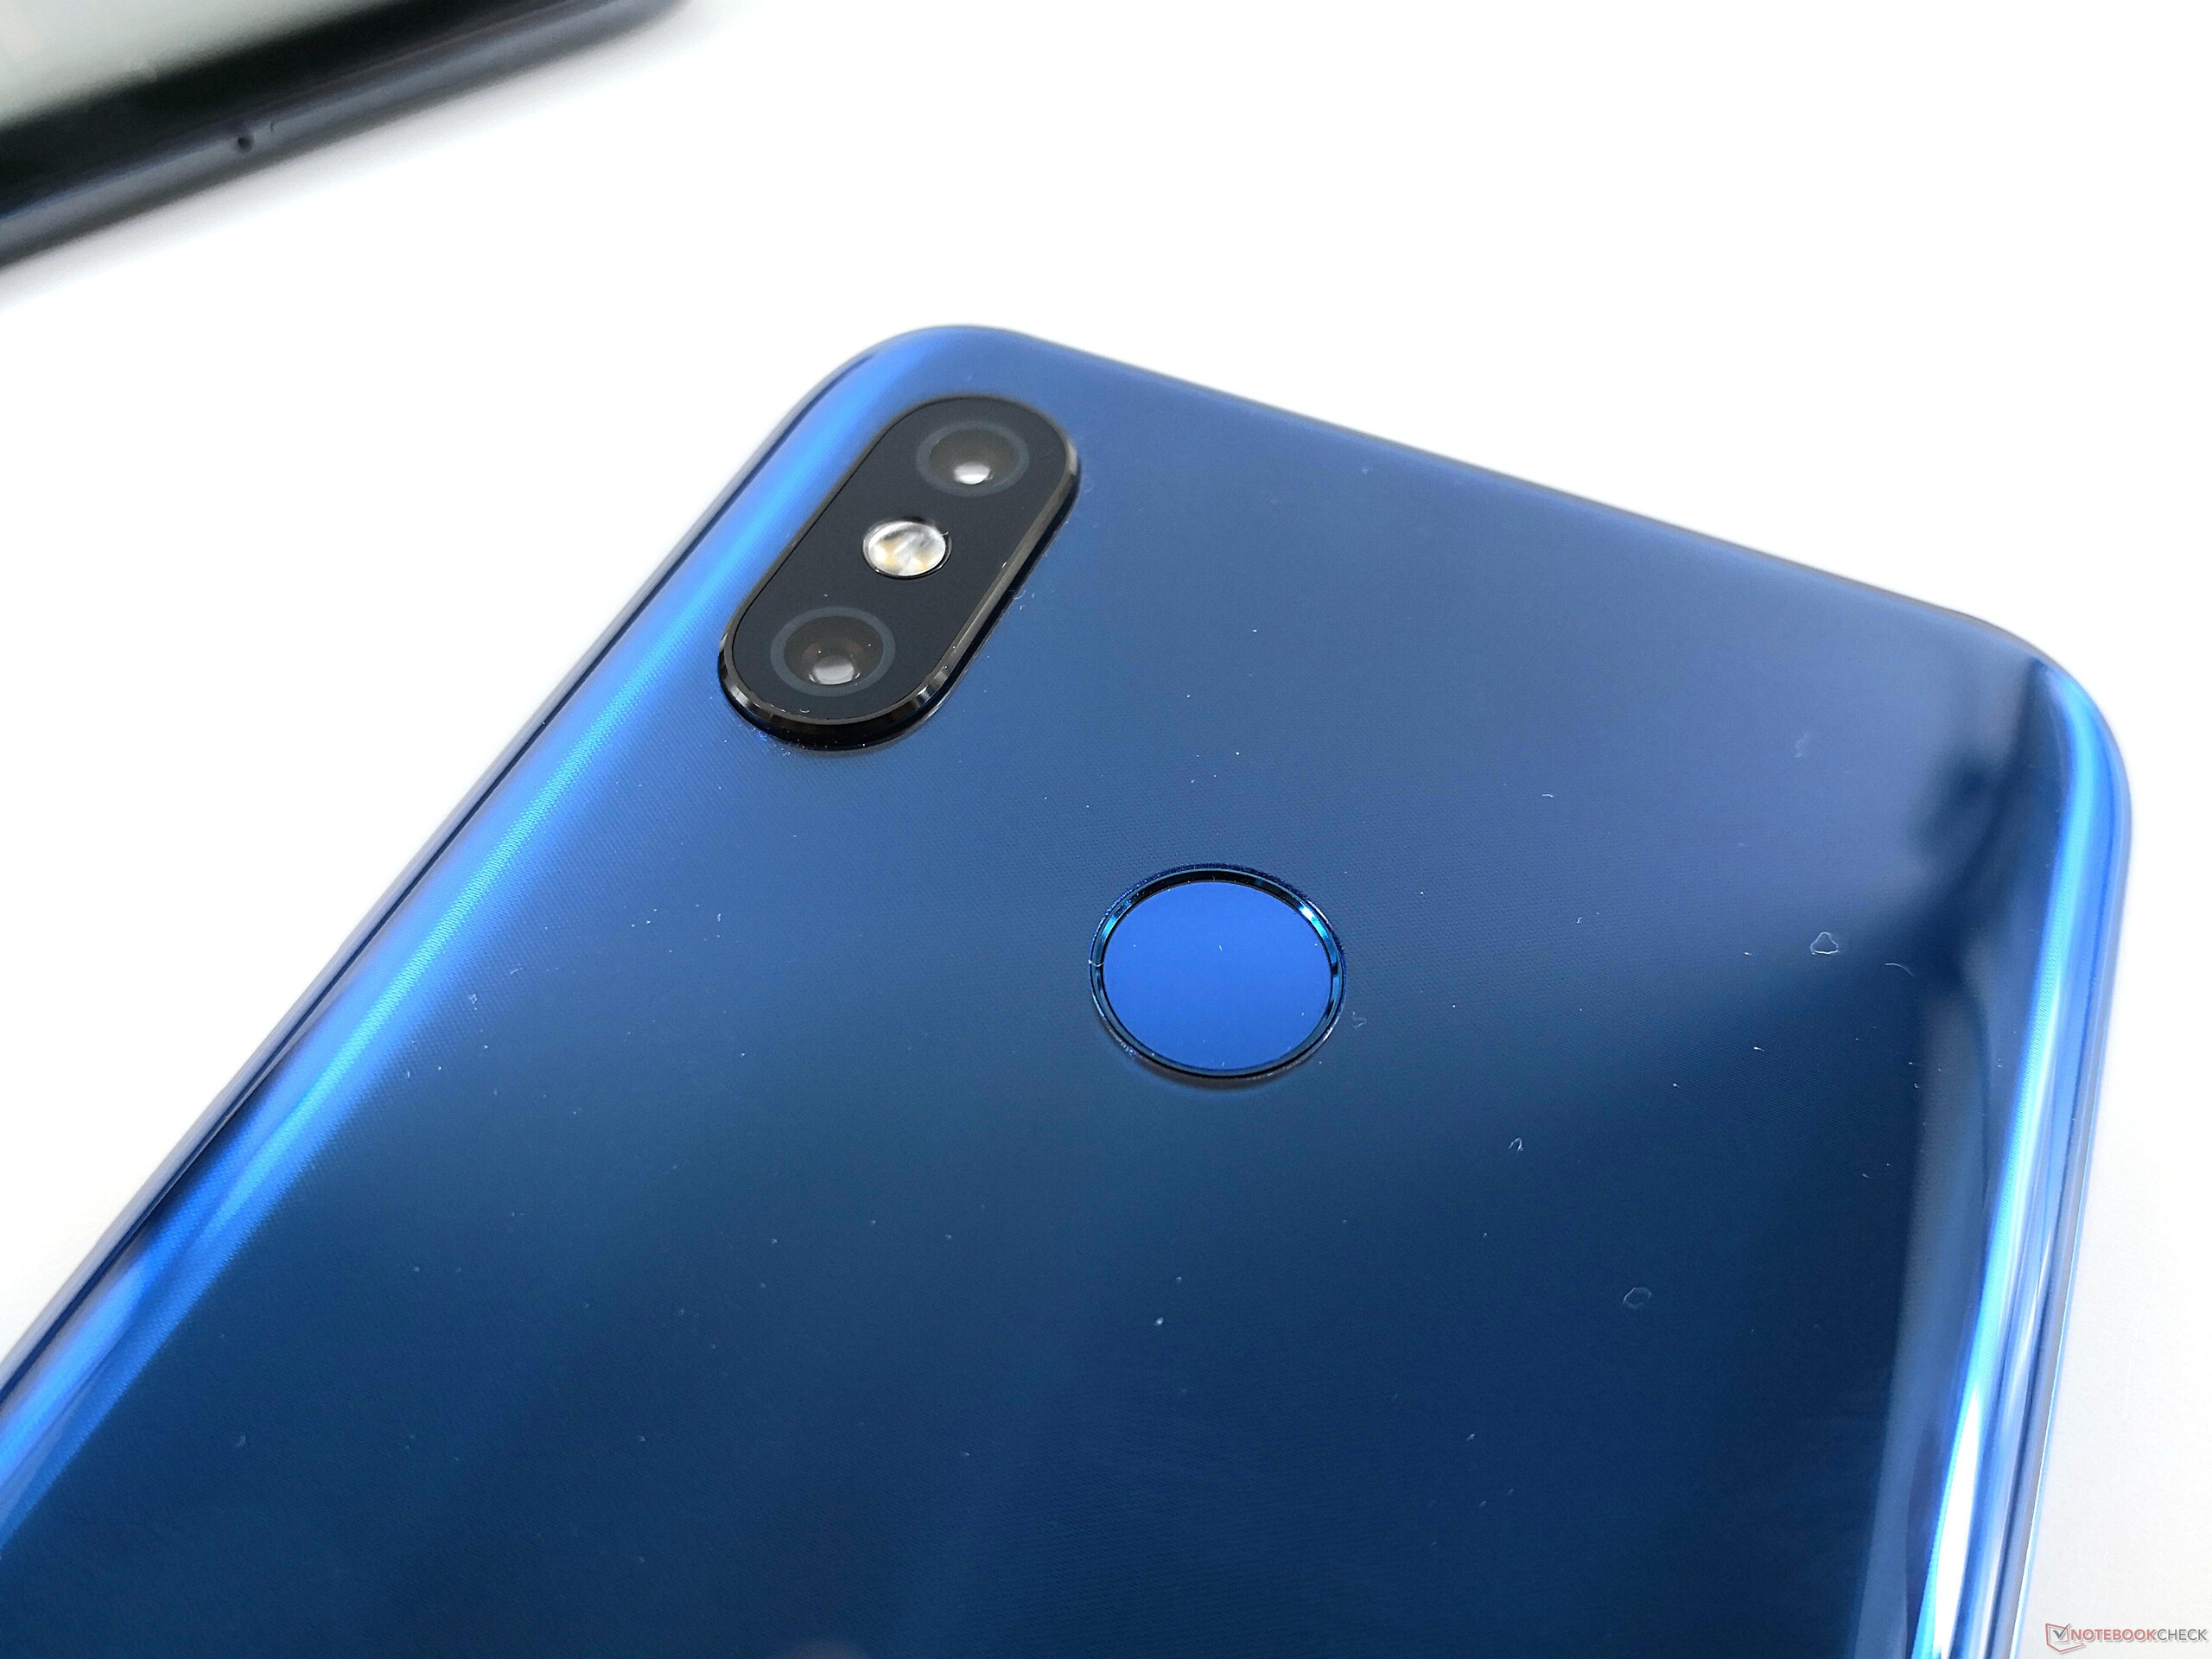
The dual rear-facing camera housing protrudes from the case, which makes our test device shake slightly when we are using it with the device lying flat on a table. One major difference between the Mi 8 and Explorer Edition is the fingerprint sensor. The Mi 8 has a standard rear-mounted sensor, while the Explorer Edition is equipped with an in-screen sensor as we have seen with the Vivo NEX Ultimate.
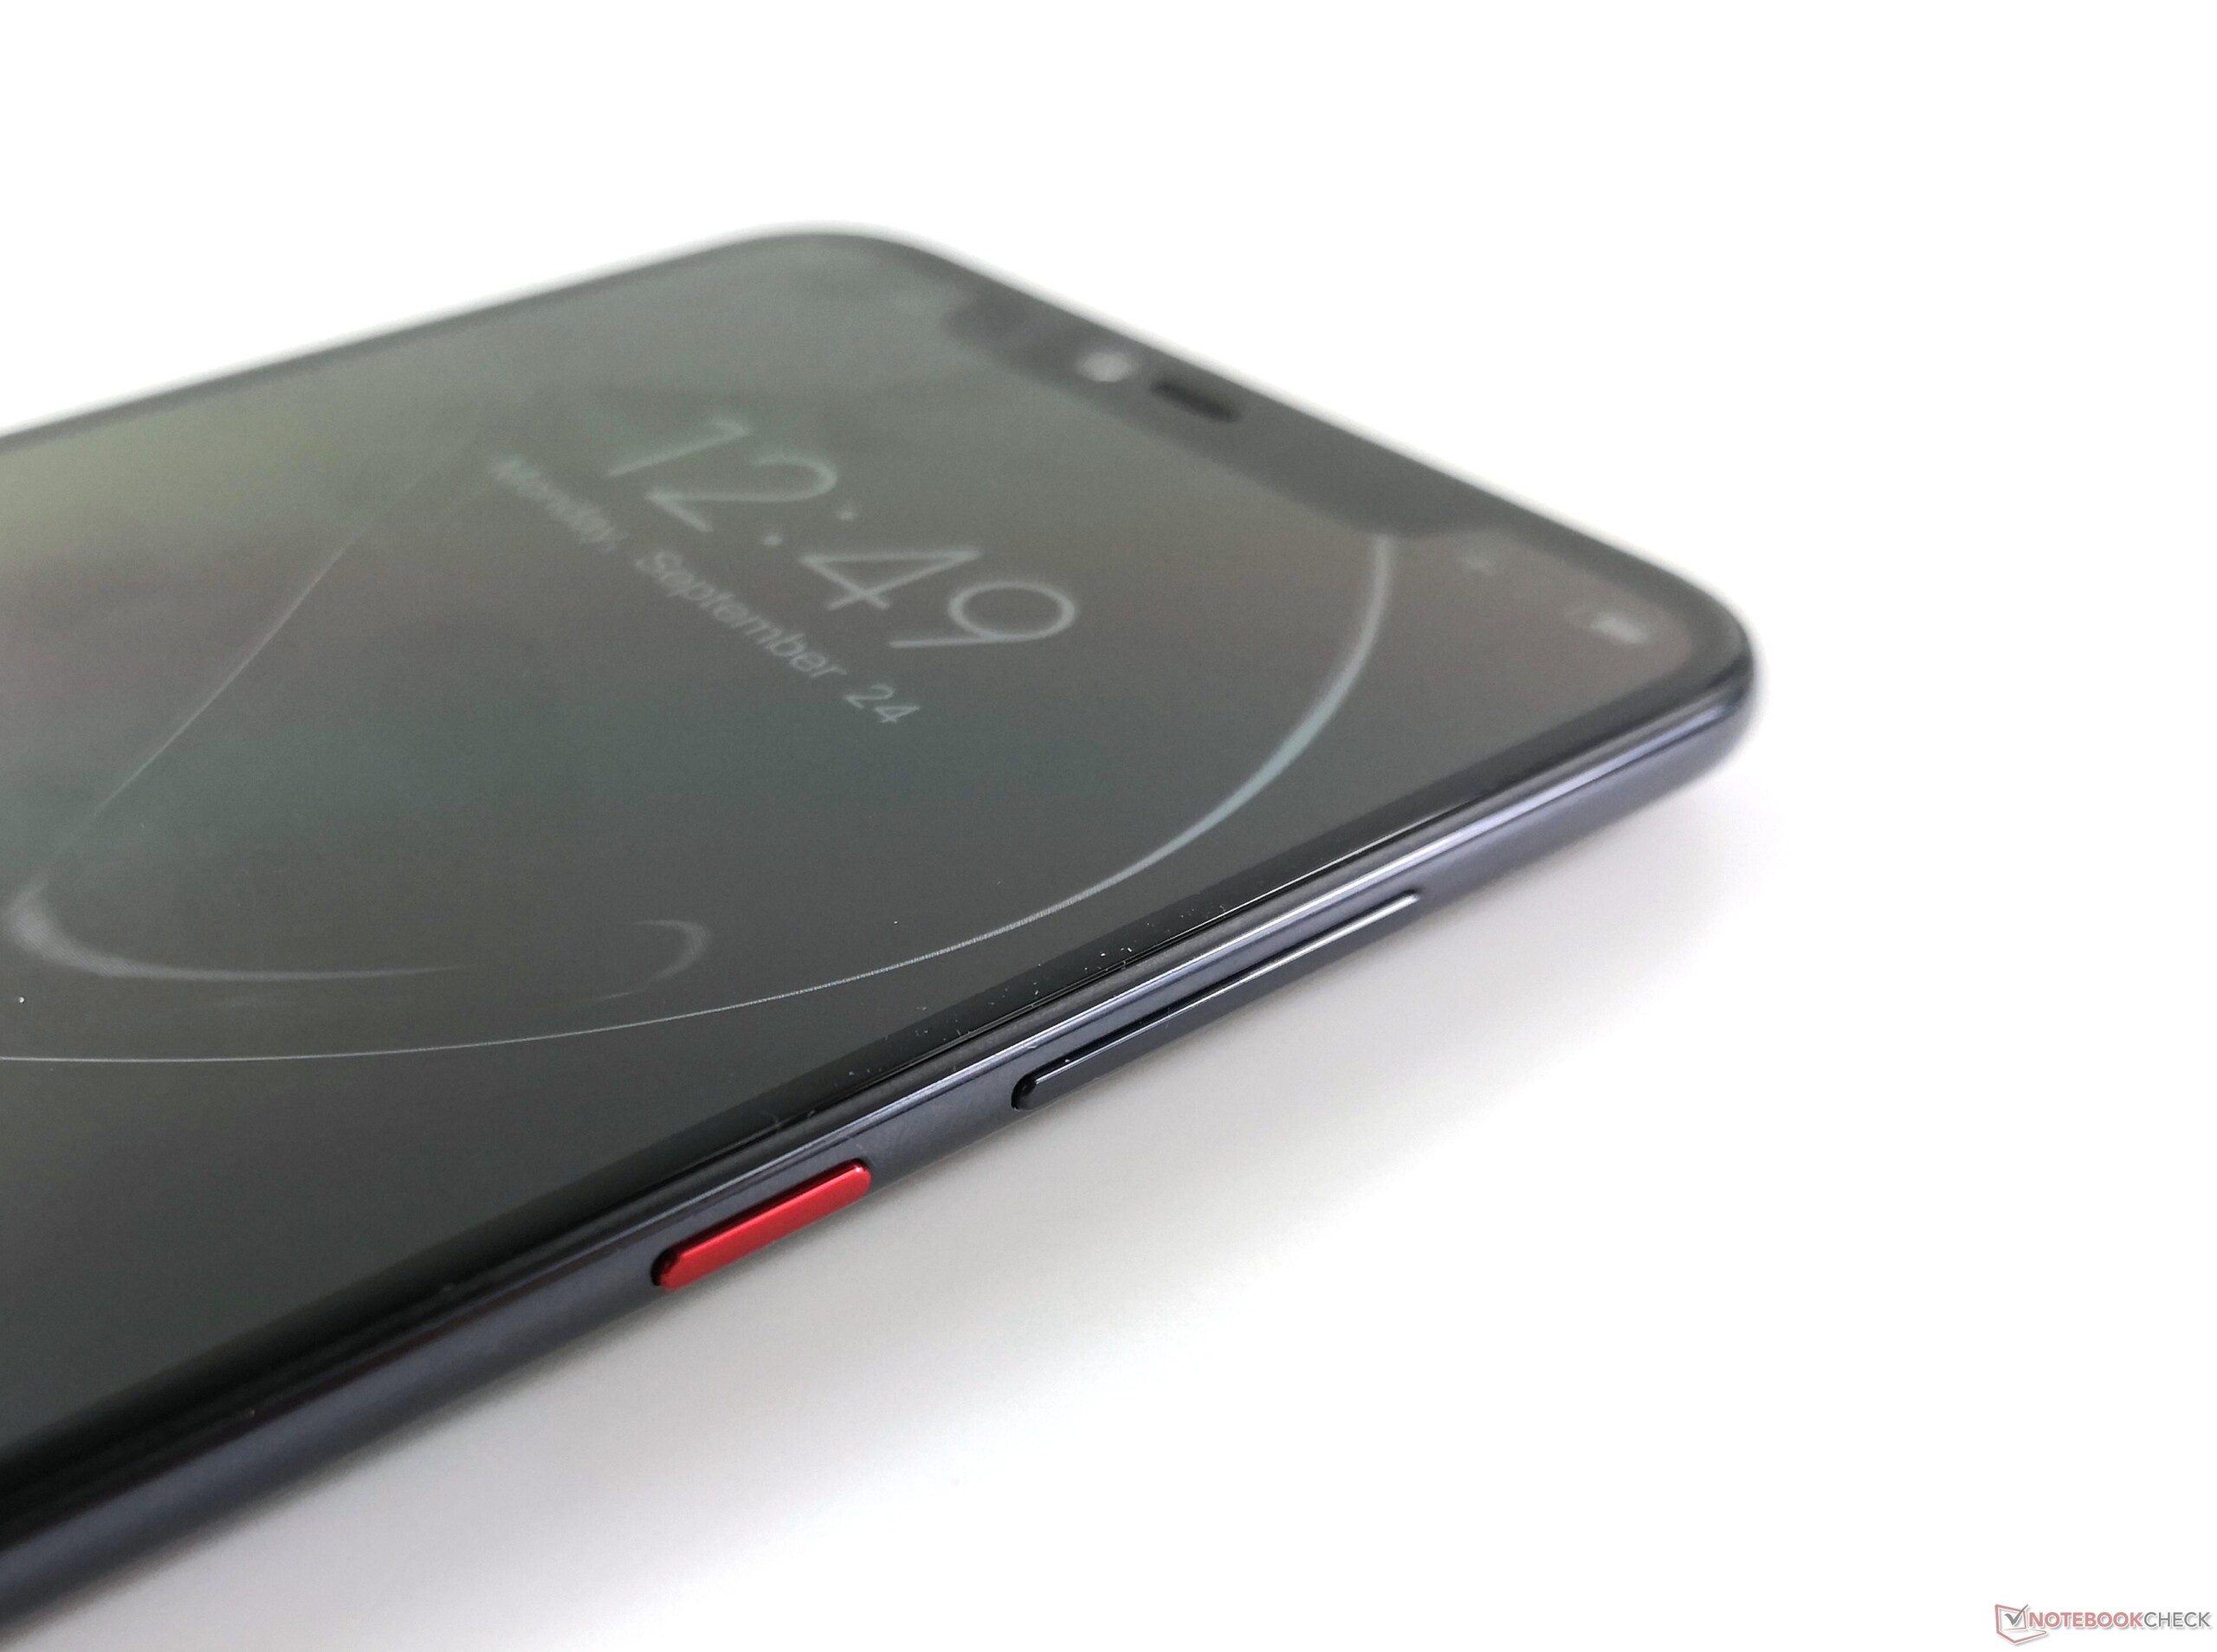
Both devices have two hardware buttons: a power button and a volume rocker. The buttons have well-defined pressure points and are beautifully crafted. The buttons are placed next to each other, but they are easy to tell apart when using the device in one hand.
Moreover, our test device is sturdy and would not creak or twist irrespective of the degree of force that we applied.
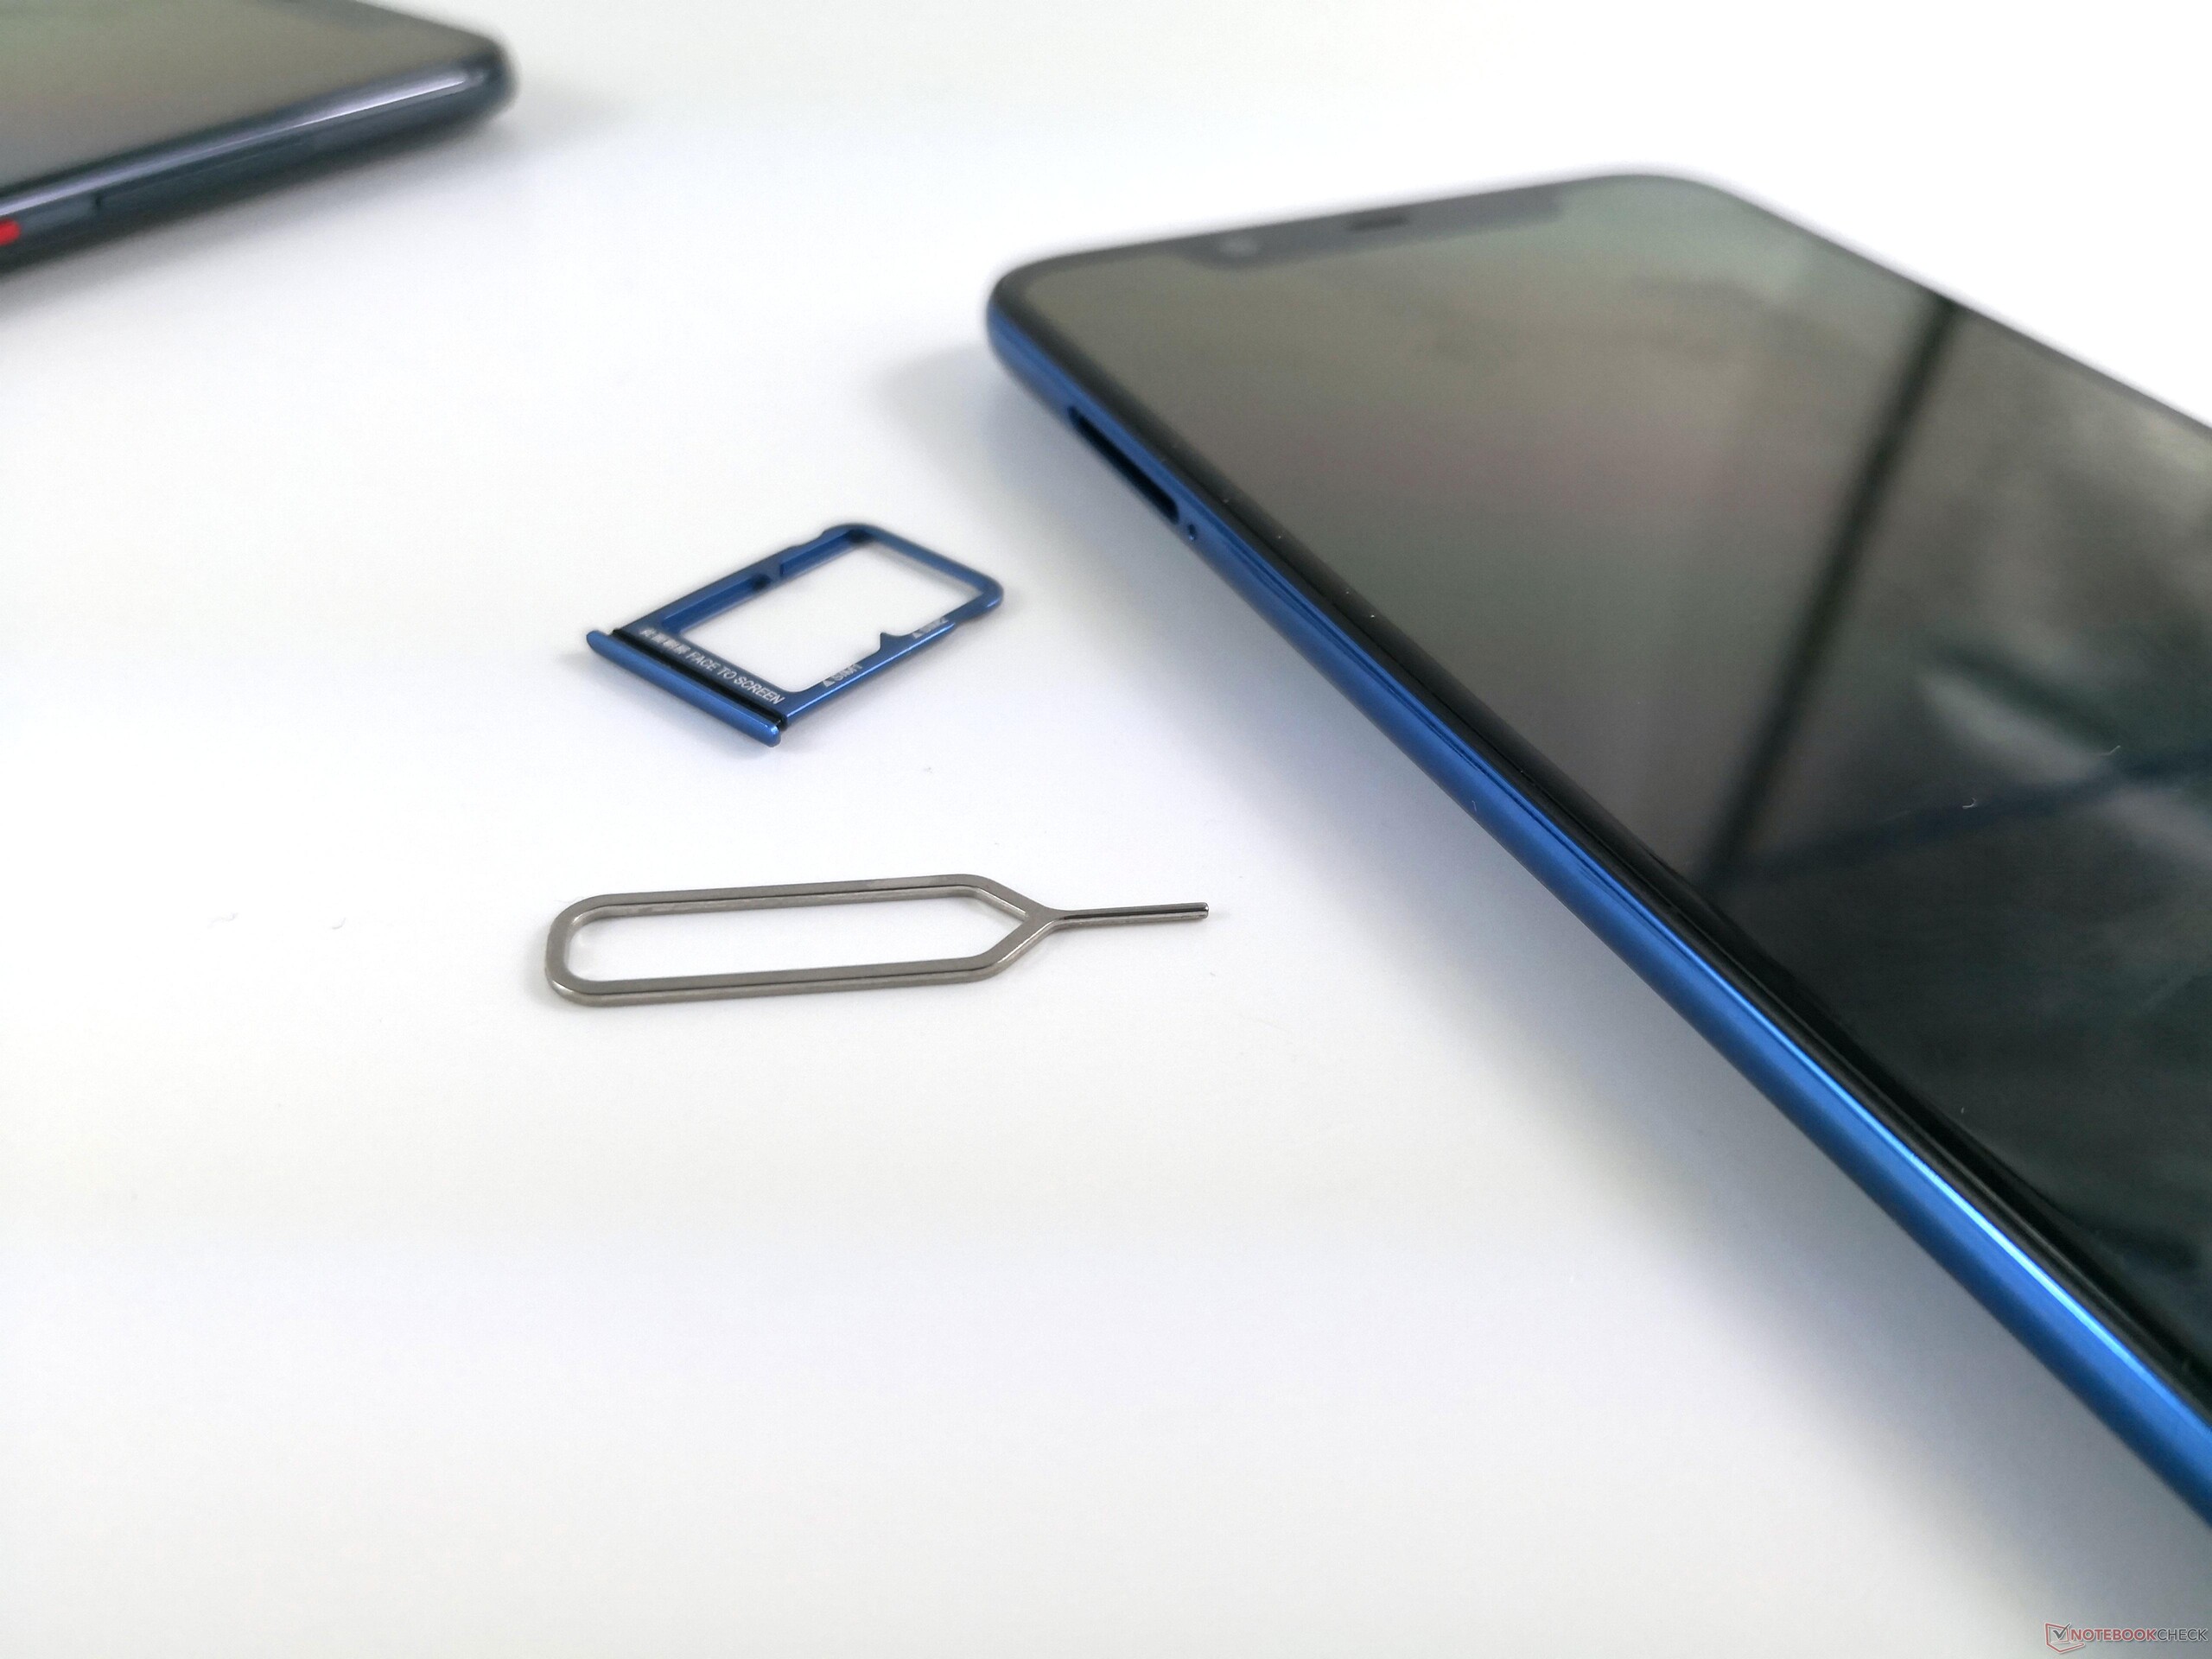
Our only gripe with the case is the SIM-card slot, which does not fit flush with the case on our test devices.

Connectivity
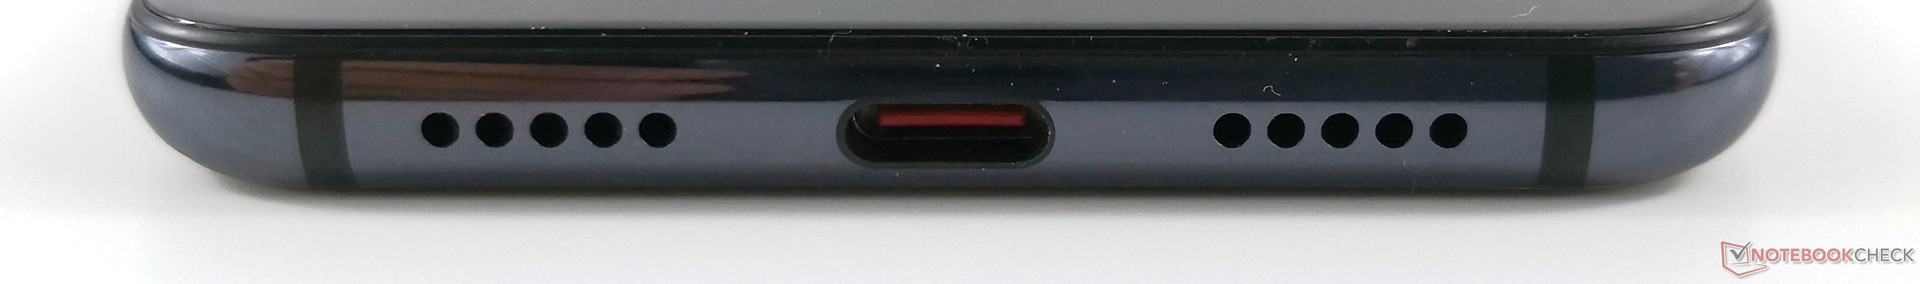
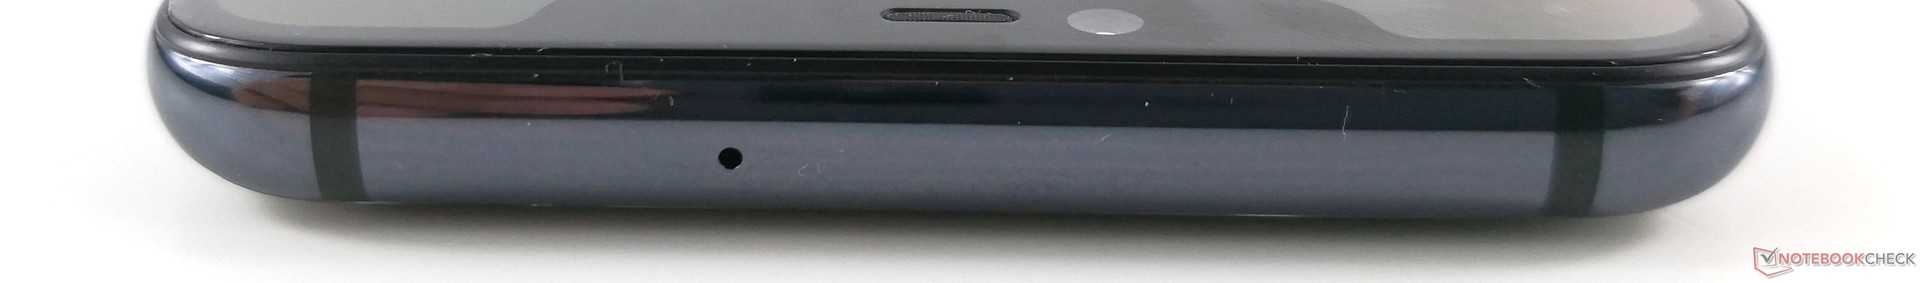
The Mi 8 has a USB 2.0 Type-C port that supports QC 4+, a compass, VoLTE support and a notification LED. The device also supports Miracast for wirelessly casting your display to an external monitor; this worked well in testing with our Sony Android TV. Our test device has a mono speaker, which is a downgrade from the stereo speakers on the Xiaomi Mi 6. Incidentally, the Explorer Edition also lacks an infrared sensor too.
Our test devices have 64 GB and 128 GB of UFS 2.1 storage, of which 50 GB and 109 GB is available respectively, with the remainder reserved for the OS. Neither test device supports microSD card expansion, but you could connect a USB stick or other peripherals with the appropriate adapter thanks to USB OTG support.


Software
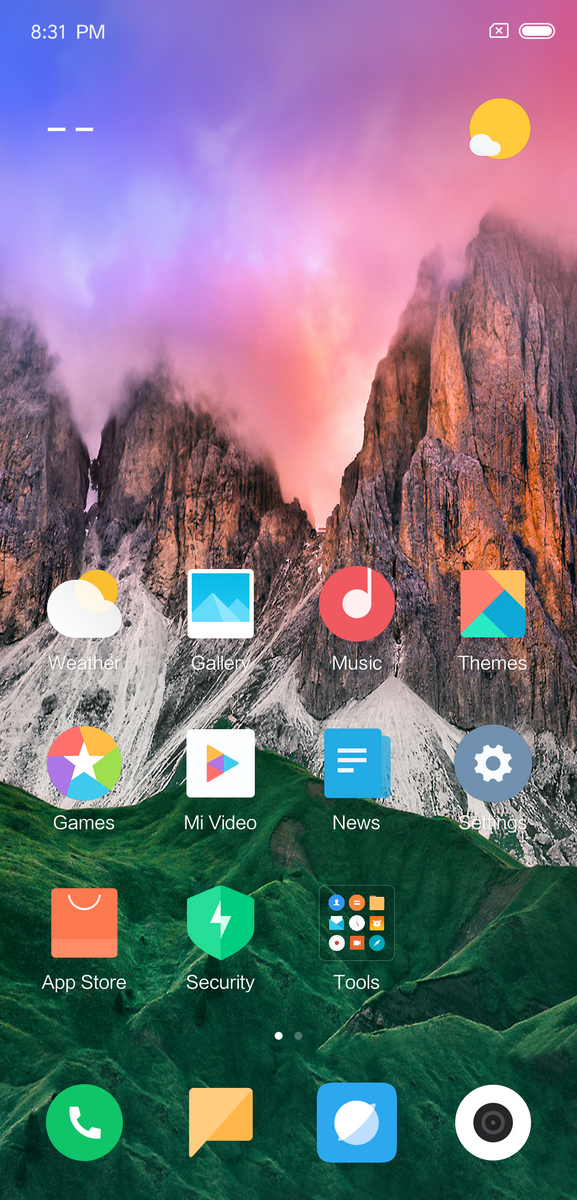
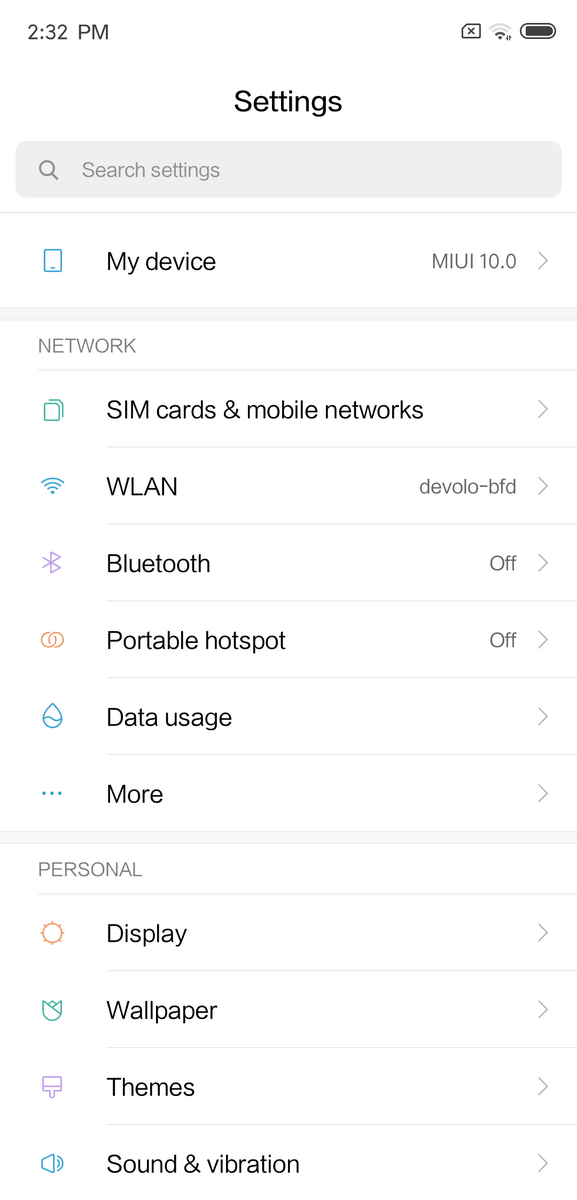
Our test devices both shipped with Android Oreo 8.1 and Android security patch level August 2018, albeit with different versions of MIUI. Our test Mi 8 has the Global version of MIUI 9.6 installed, while our test Explorer Edition has the Chinese version of MIUI 10 installed.
Xiaomi’s Chinese ROMs have the company's alternatives to Google Services preinstalled. Additionally, Chinese ROMs only support Chinese and English. Please see our how-to, which is in German, on how to install Google Services and the Google Play Store onto a device running a Chinese ROM. The Global version of MIUI has both Google Services and a wider choice of languages installed.
Frustratingly, the software on our test Mi 8 functions like a BETA version, even though it is on the Stable branch. The software has numerous UI issues like missing notifications in the status bar. Furthermore, some features like Face Unlock are region locked, while the Always-On-Display (AOD) cannot be personalized and is not supported by third-party apps. MIUI 10 runs smoother than MIUI 9.6, but we still had AOD issues, and we could not zoom in on 16:9 videos.
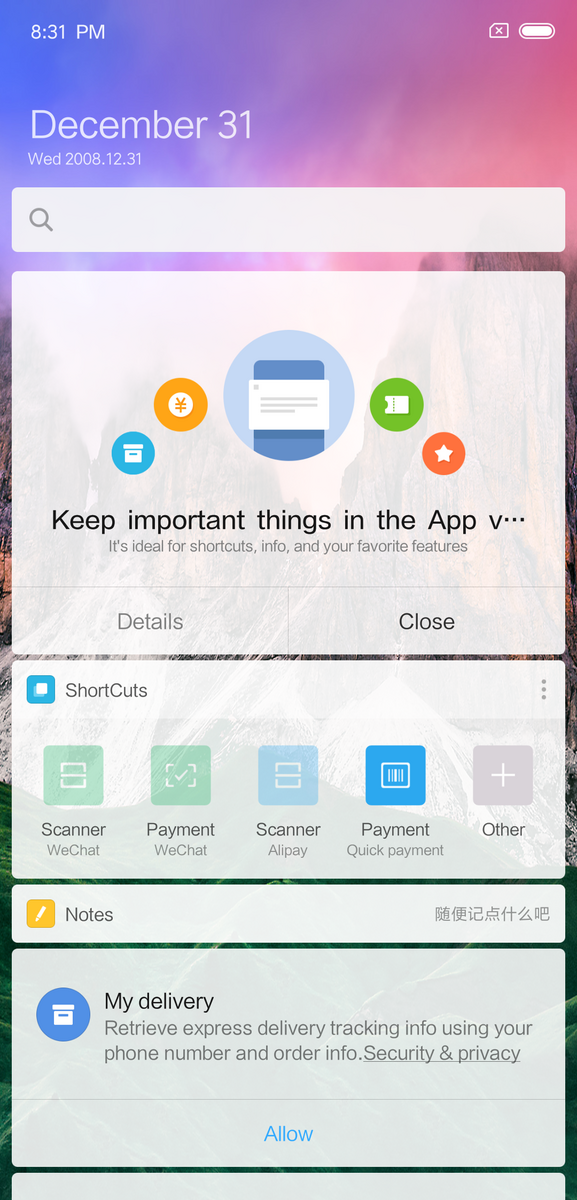
MIUI is a heavily customized version of Android that has many visual and functional changes over stock Oreo 8.1. MIUI has plenty of Xiaomi preinstalled apps and brings a quick access function, gesture control and a feature called Second Space to Android. The latter of these allows you to hide apps, data and photos, which can only be viewed having opened Second Space.
Communication & GPS
The Mi 8 supports Bluetooth 5.0 for connecting Bluetooth headphones and smartwatches among other peripherals. There is also an NFC chip on board for NFC services like Google Pay, should you have Google Services installed.
The Mi 8 supports IEEE 802.11 a/b/g/n/ac Wi-Fi and can connect to either 2.4 or 5 GHz networks. The Explorer Edition also has a 2x2 MIMO antenna that allows for faster Wi-Fi transfer speeds than the Mi 8. Our test Explorer Edition averaged over 600 Mb/s in both iperf3 Client Wi-Fi tests when tested with our Linksys EA 8500 reference router.
The Explorer Edition has solid Wi-Fi performance in daily use too. Our test device constantly maintained Wi-Fi reception throughout testing and achieved a relatively low -37 dBm signal attenuation when tested next to a Telekom Speedport W921V router.
The Explorer Edition is a dual-SIM device with LTE Cat. 16 support for up to 1 Gb/s download speeds over LTE. Both nano-SIM slots support Gigabit LTE. Moreover, the LTE modem has a 4x4 MIMO antenna that is almost twice the speed of 2x2 MIMO antennas.
There is also plenty of European LTE coverage too, despite being a smartphone designed for the Chinese market. Our test Explorer Edition supports LTE Band 20, the first Xiaomi Mi device to do so, which is often needed for LTE coverage in rural Germany. LTE Band 20 operates at 800 MHz. The Explorer Edition supports just 14 LTE bands though, which is considerably less than more expensive flagship devices like the iPhone XS. There is room for improvement in this regard then.
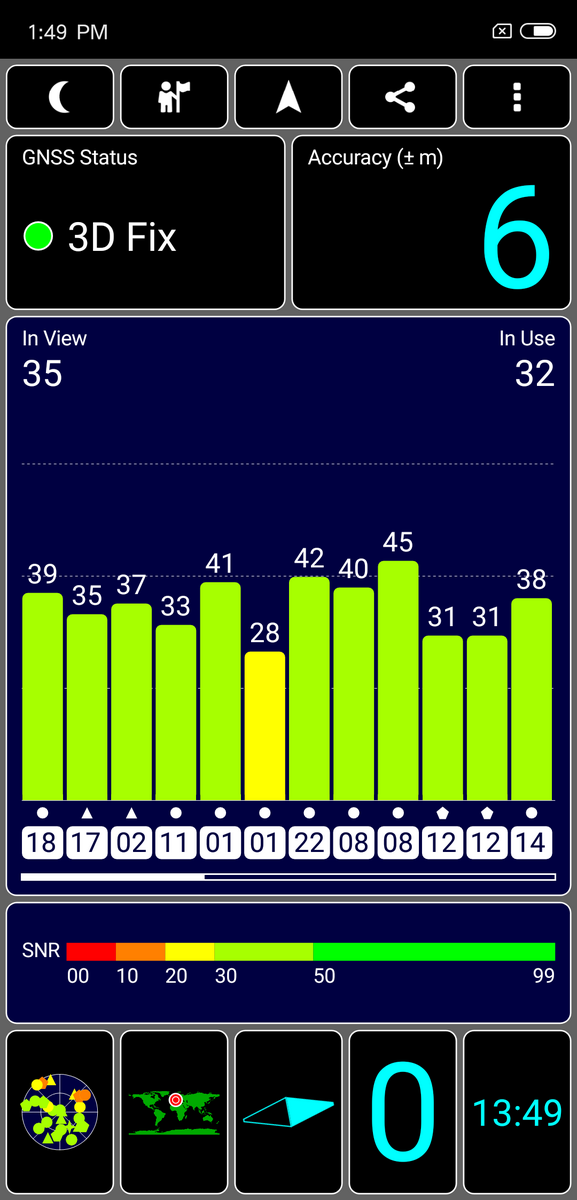
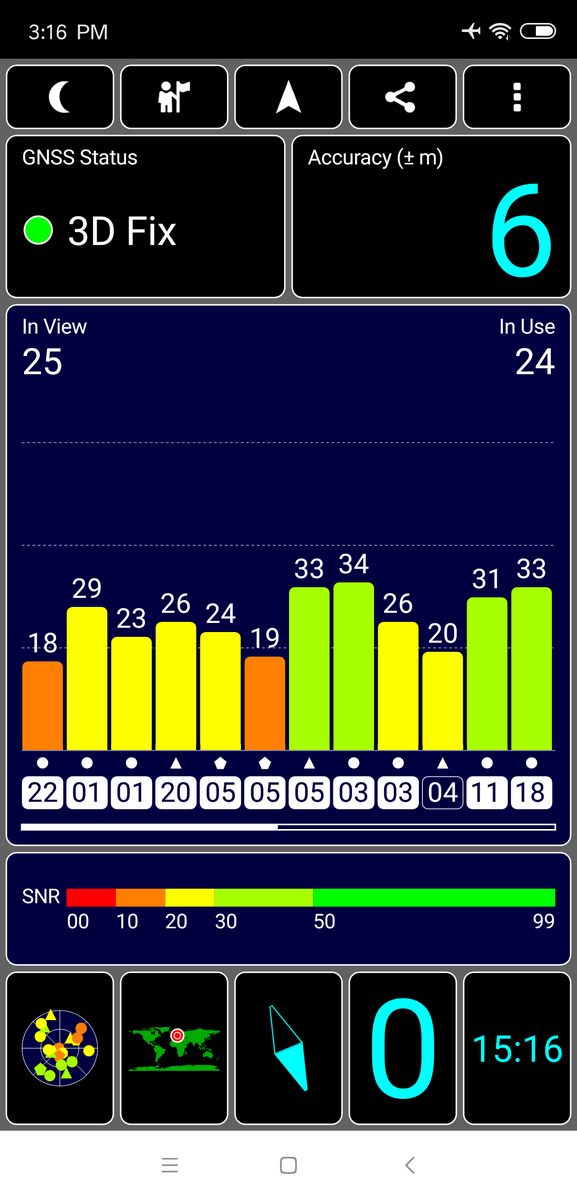
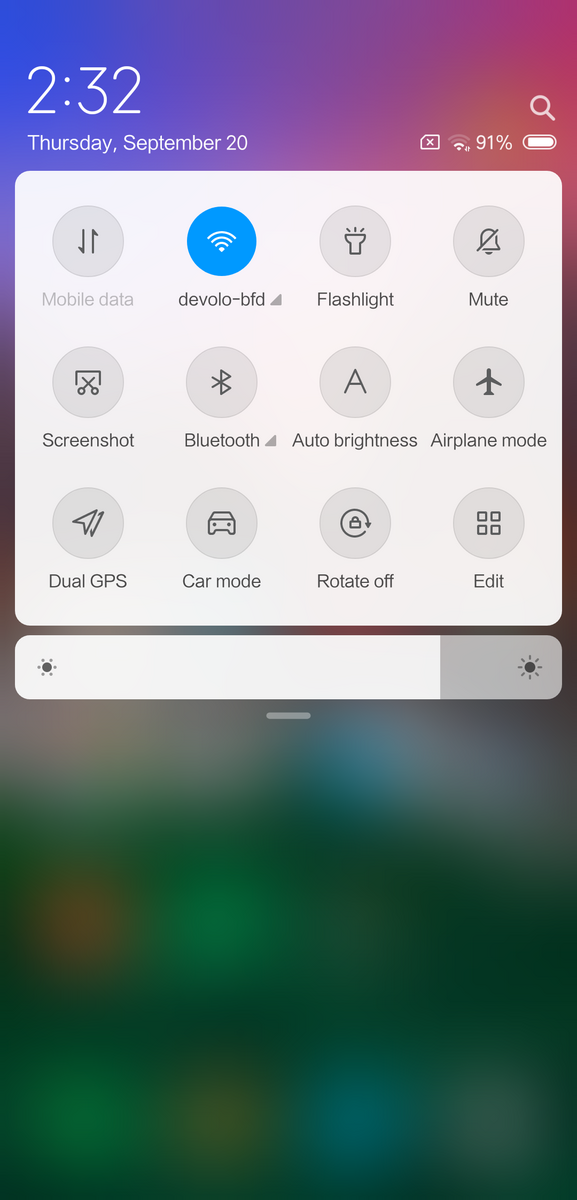
The Mi 8 Explorer Edition uses BeiDou, GALILEO, GLONASS, GPS, and QZSS for location services. The Explorer Edition supports dual GPS too. Dual GPS uses two frequency bands, the regular L1 band and the professional L5 band in the Explorer Edition’s case, for faster and more accurate location than single GPS devices.
Our test device achieves a satellite fix with up to six meters accuracy both indoors and outdoors. Our test device has a stronger signal in the latter scenario rather than the former though.
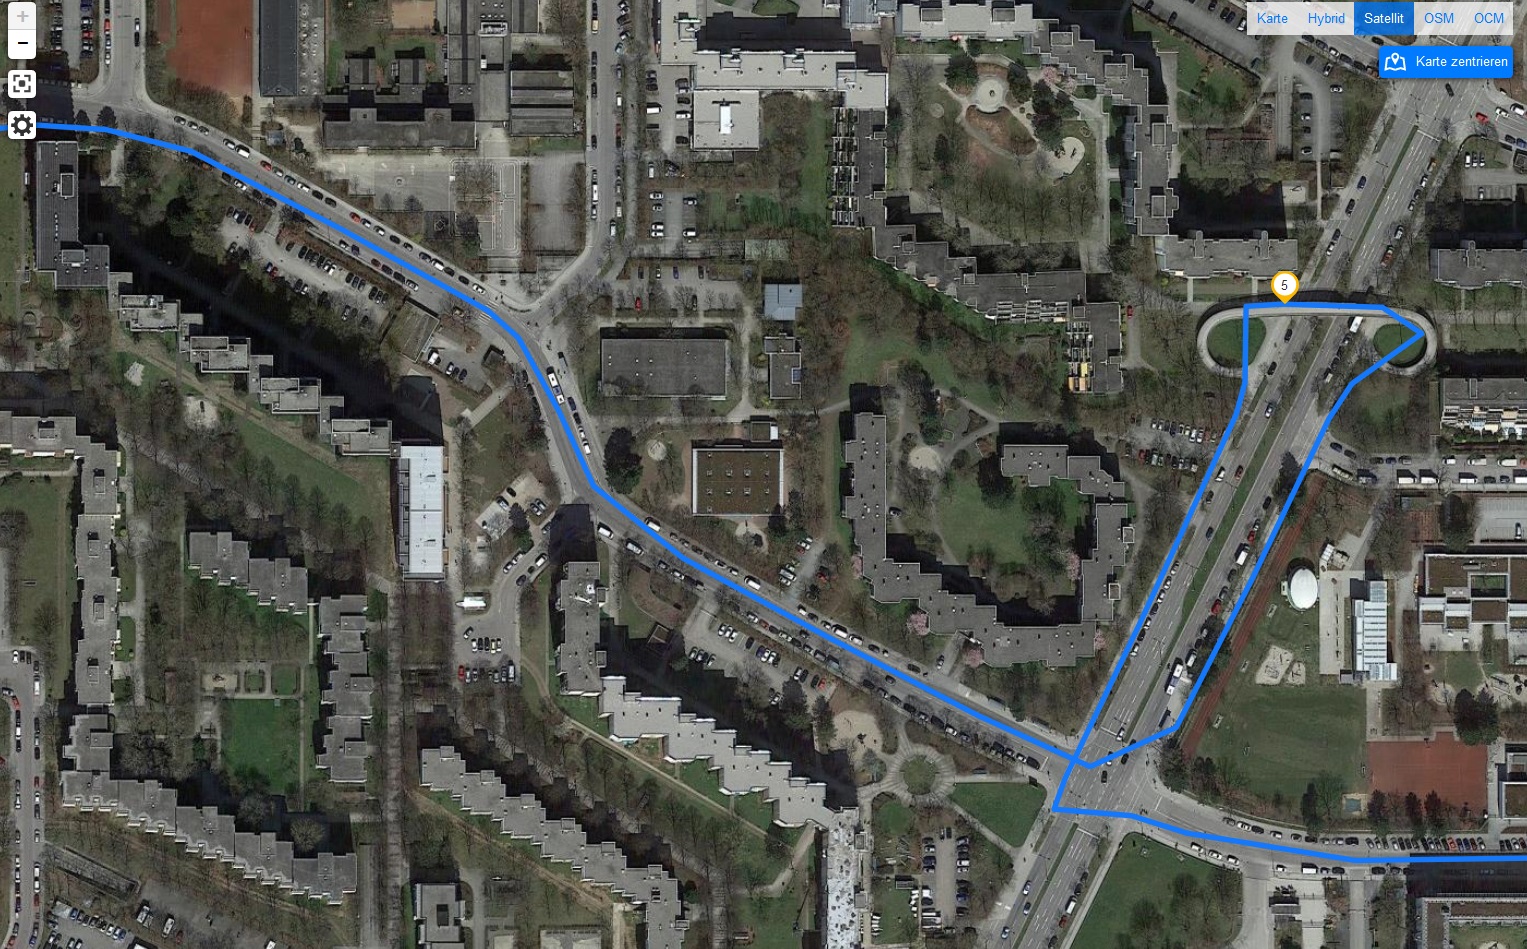
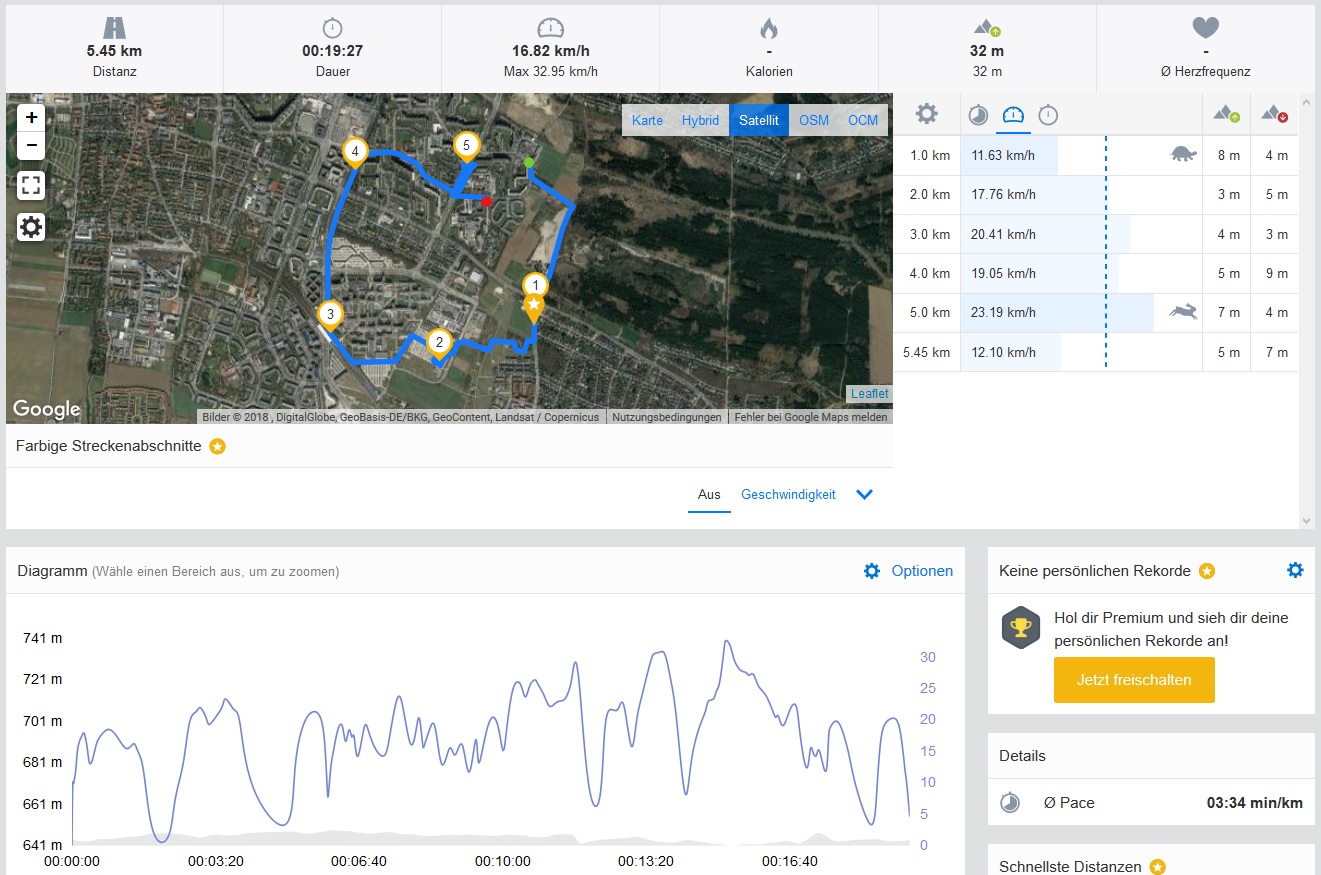
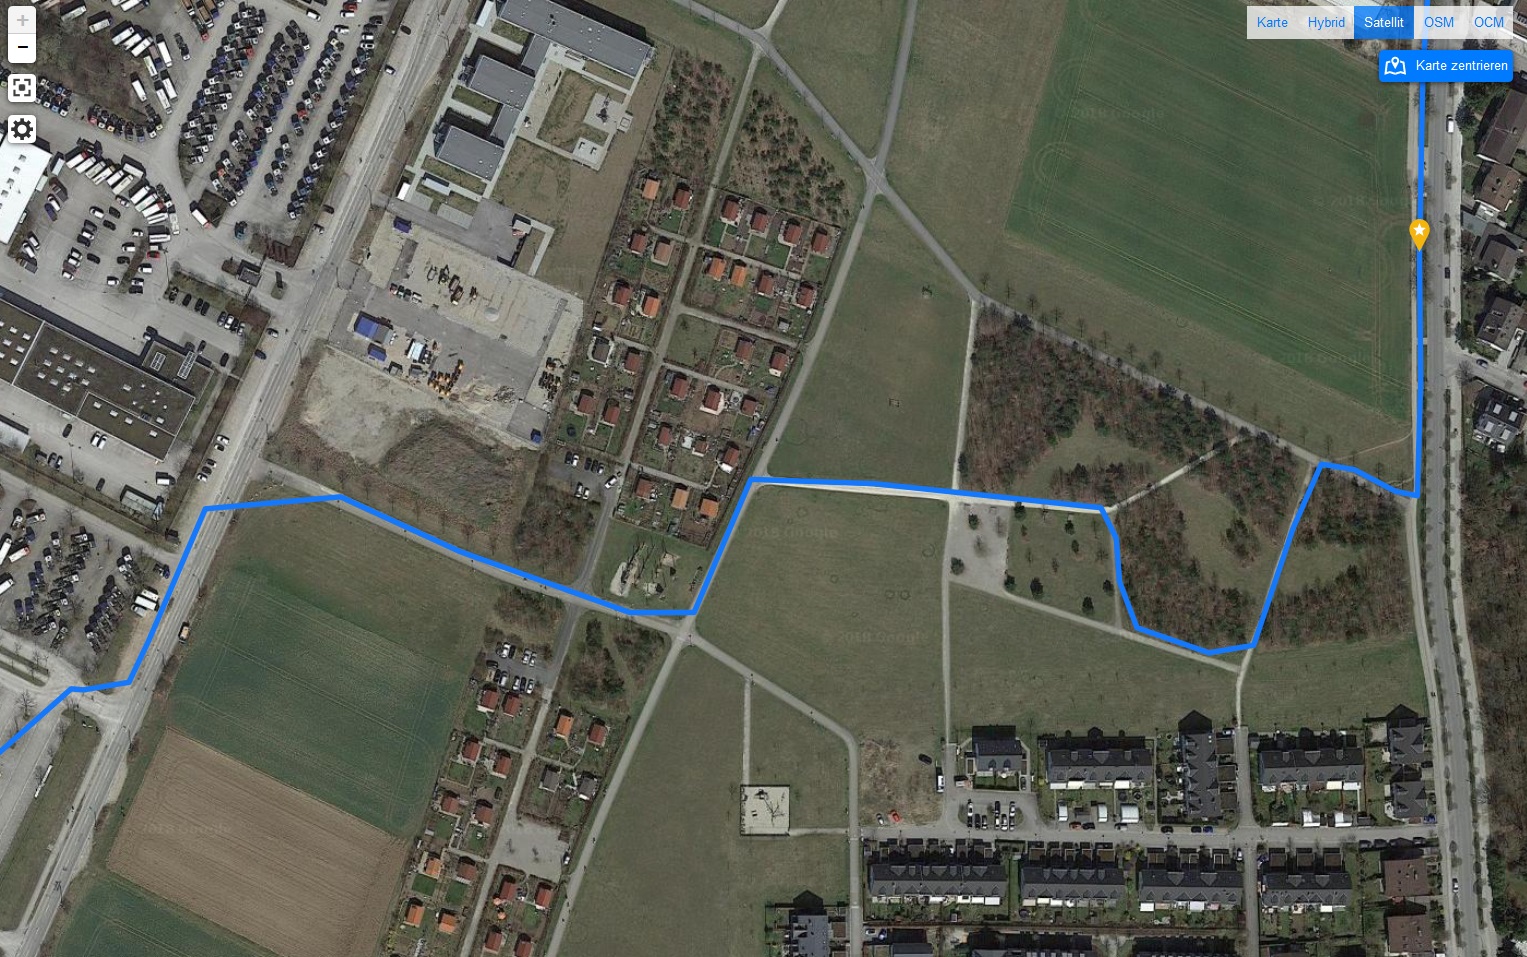
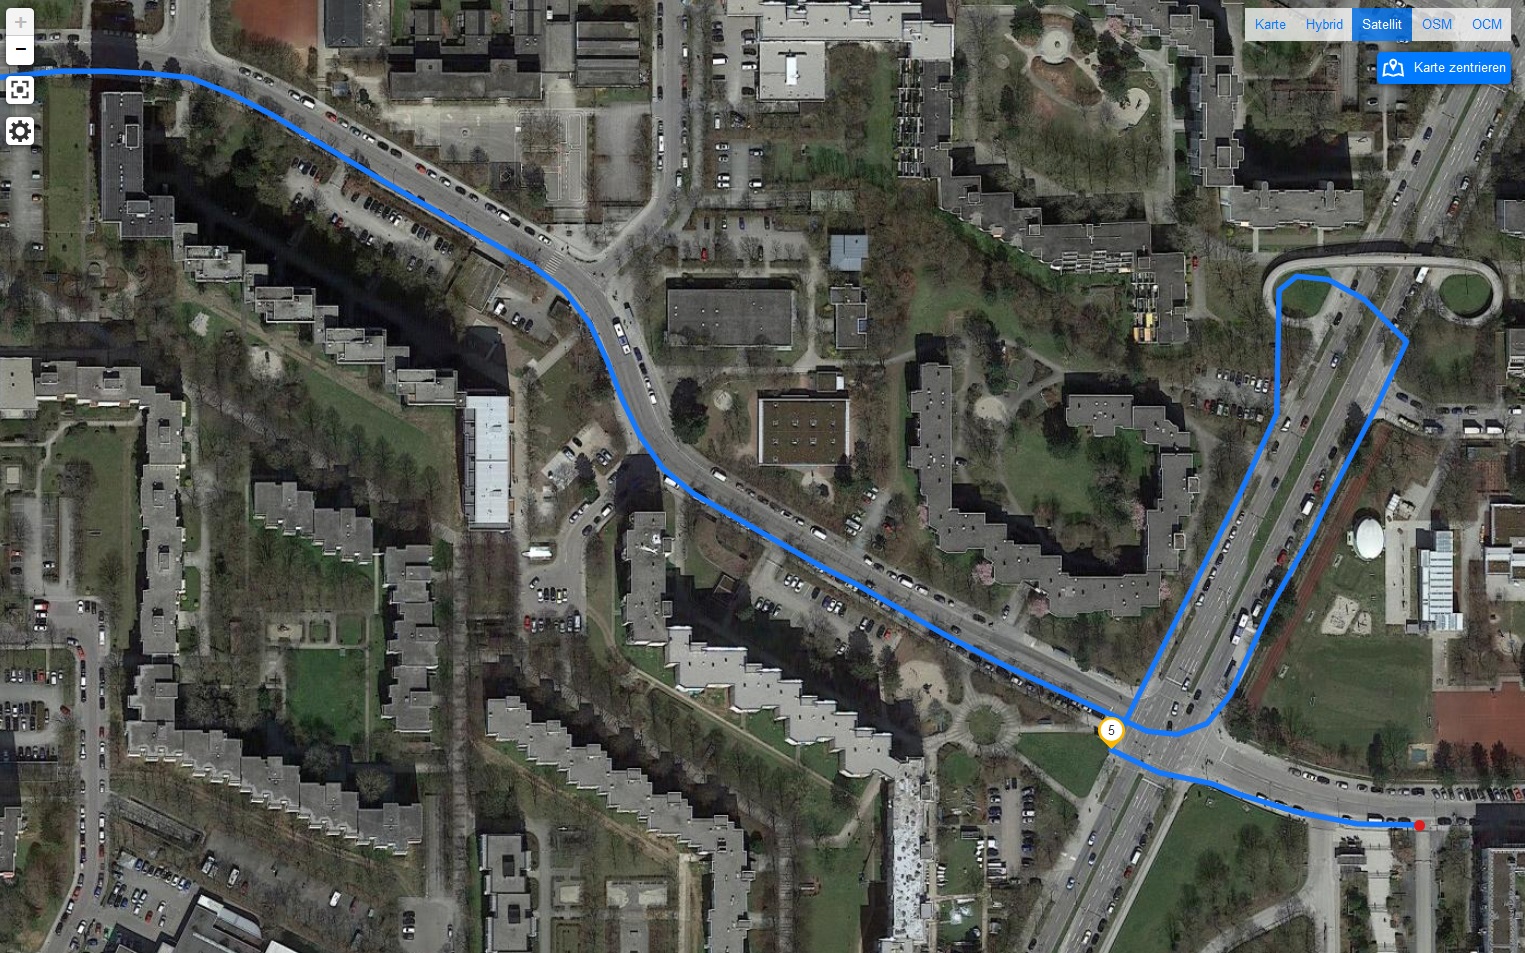
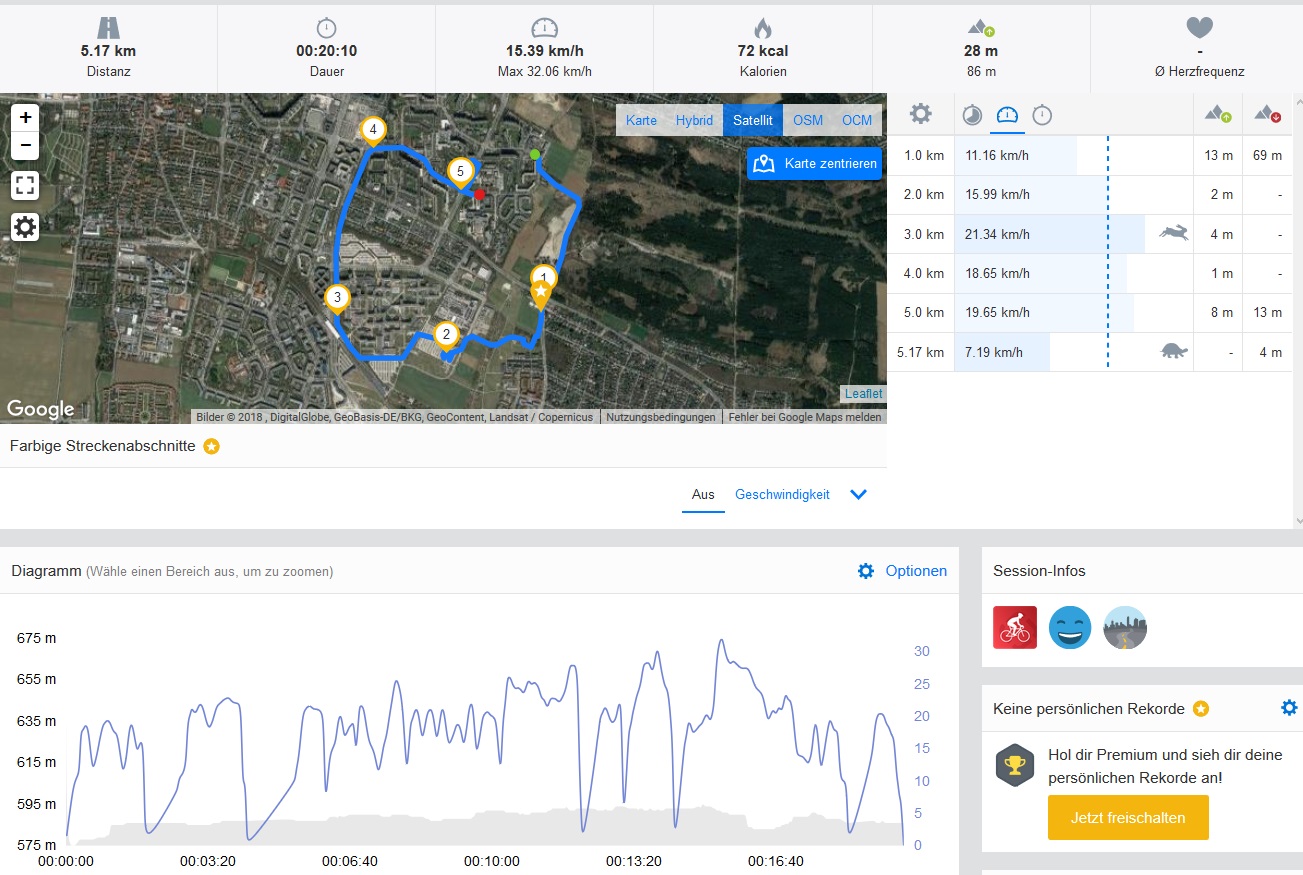
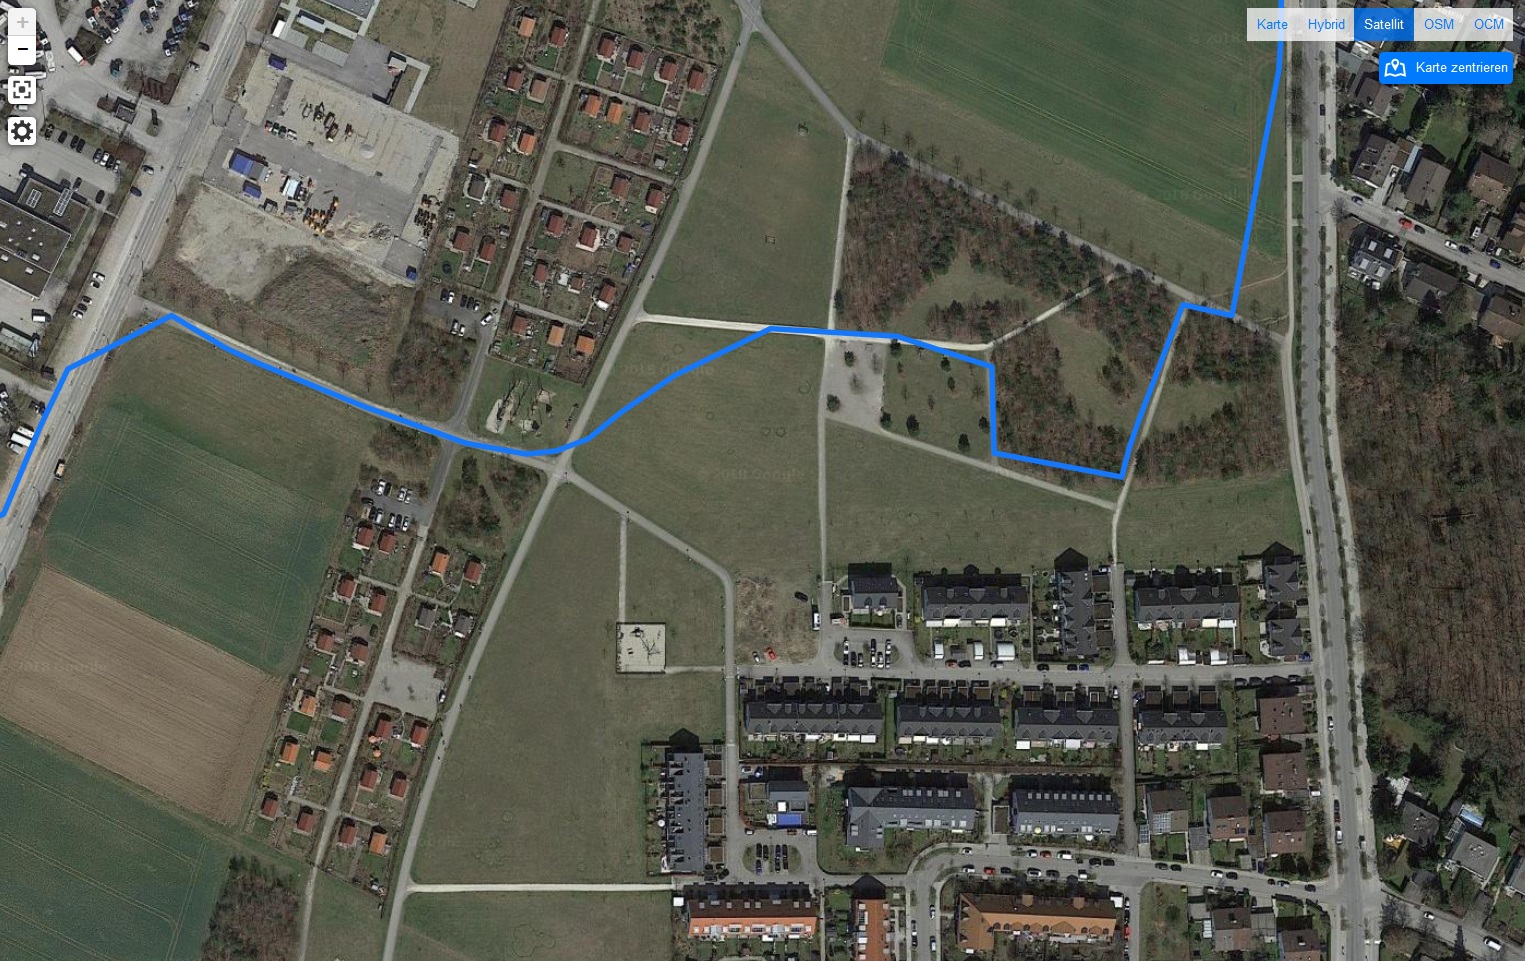
We took the Explorer Edition on a bike ride to test its location accuracy against a professional navigation device, the Garmin Edge 520. Our test device recorded the course well but deviated by 280 meters over a 5.45 km ride. The Explorer Edition struggles to accurately track our route, as the included pictures below demonstrate. This degree of deviation from our professional navigation system is acceptable for a device at this price, but we expected more from a dual-GPS device. Maybe future updates will bring greater GPS accuracy.
Telephone Function & Call Quality
Our test Explorer Edition maintained good call quality on Vodafone’s D1 network in Germany. Voices sounded clear when making calls with either the earpiece or over speakerphone. Likewise, the Explorer Edition gets loud enough to make calls in most environments too.
Cameras


The Explorer Edition has dual 12 MP rear-facing cameras. The main camera is a Sony IMX363 sensor that has an f/1.8 aperture, 1.4 μm pixel and OIS support. The secondary camera, a telephoto Samsung S5K3M3 sensor, has a narrower f/2.4 aperture and smaller 1 μm pixels.
The rear-facing cameras take excellent photos, particularly in bright ambient lighting. Photos taken in such conditions are rich in detail and are impressively sharp. The main camera has good dynamic range and accurate color reproduction too. However, the cameras are not on the same level as those in the Galaxy S9, the iPhone XS or the P20 Pro. The Explorer Edition especially struggled when taking a quick snapshot as the dual-pixel autofocus often lacked the accuracy we have come to expect from other flagships. Likewise, the exposure levels and white balance are sometimes somewhat inaccurate too.
The Explorer Edition also struggles in low light when compared to other flagships. Photos look relatively good, and objects are sharp enough, but our test device falls short of other more expensive flagships.
The Explorer Edition has a 20 MP front-facing camera with an f/2.0 aperture. Photos look good in enough light, but image noise and blurriness increases dramatically in low-light conditions.
The front-facing sensor can record videos in up to 1080p at 30 FPS. By contrast, the rear-facing cameras record up to 4K at 30 FPS and can record in up to 120 FPS at 1080p. In short, our test Explorer Edition takes good videos with clean audio recordings.


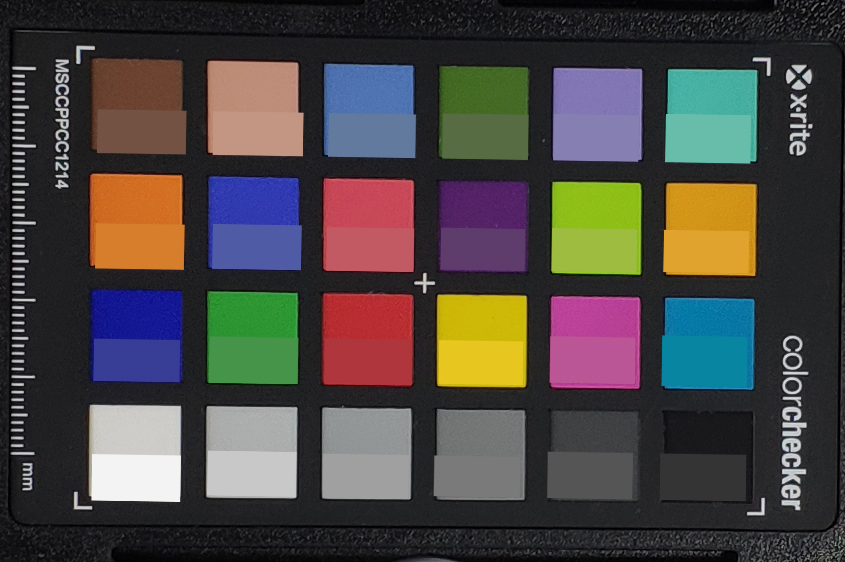
We also subjected the dual rear-facing cameras to further tests under controlled lighting conditions and analyzed color accuracy using ColorChecker Passport.
Our test Explorer Edition generally accurately reproduces colors, albeit rather darkly compared to reference colors. However, black and white tones miss the mark.
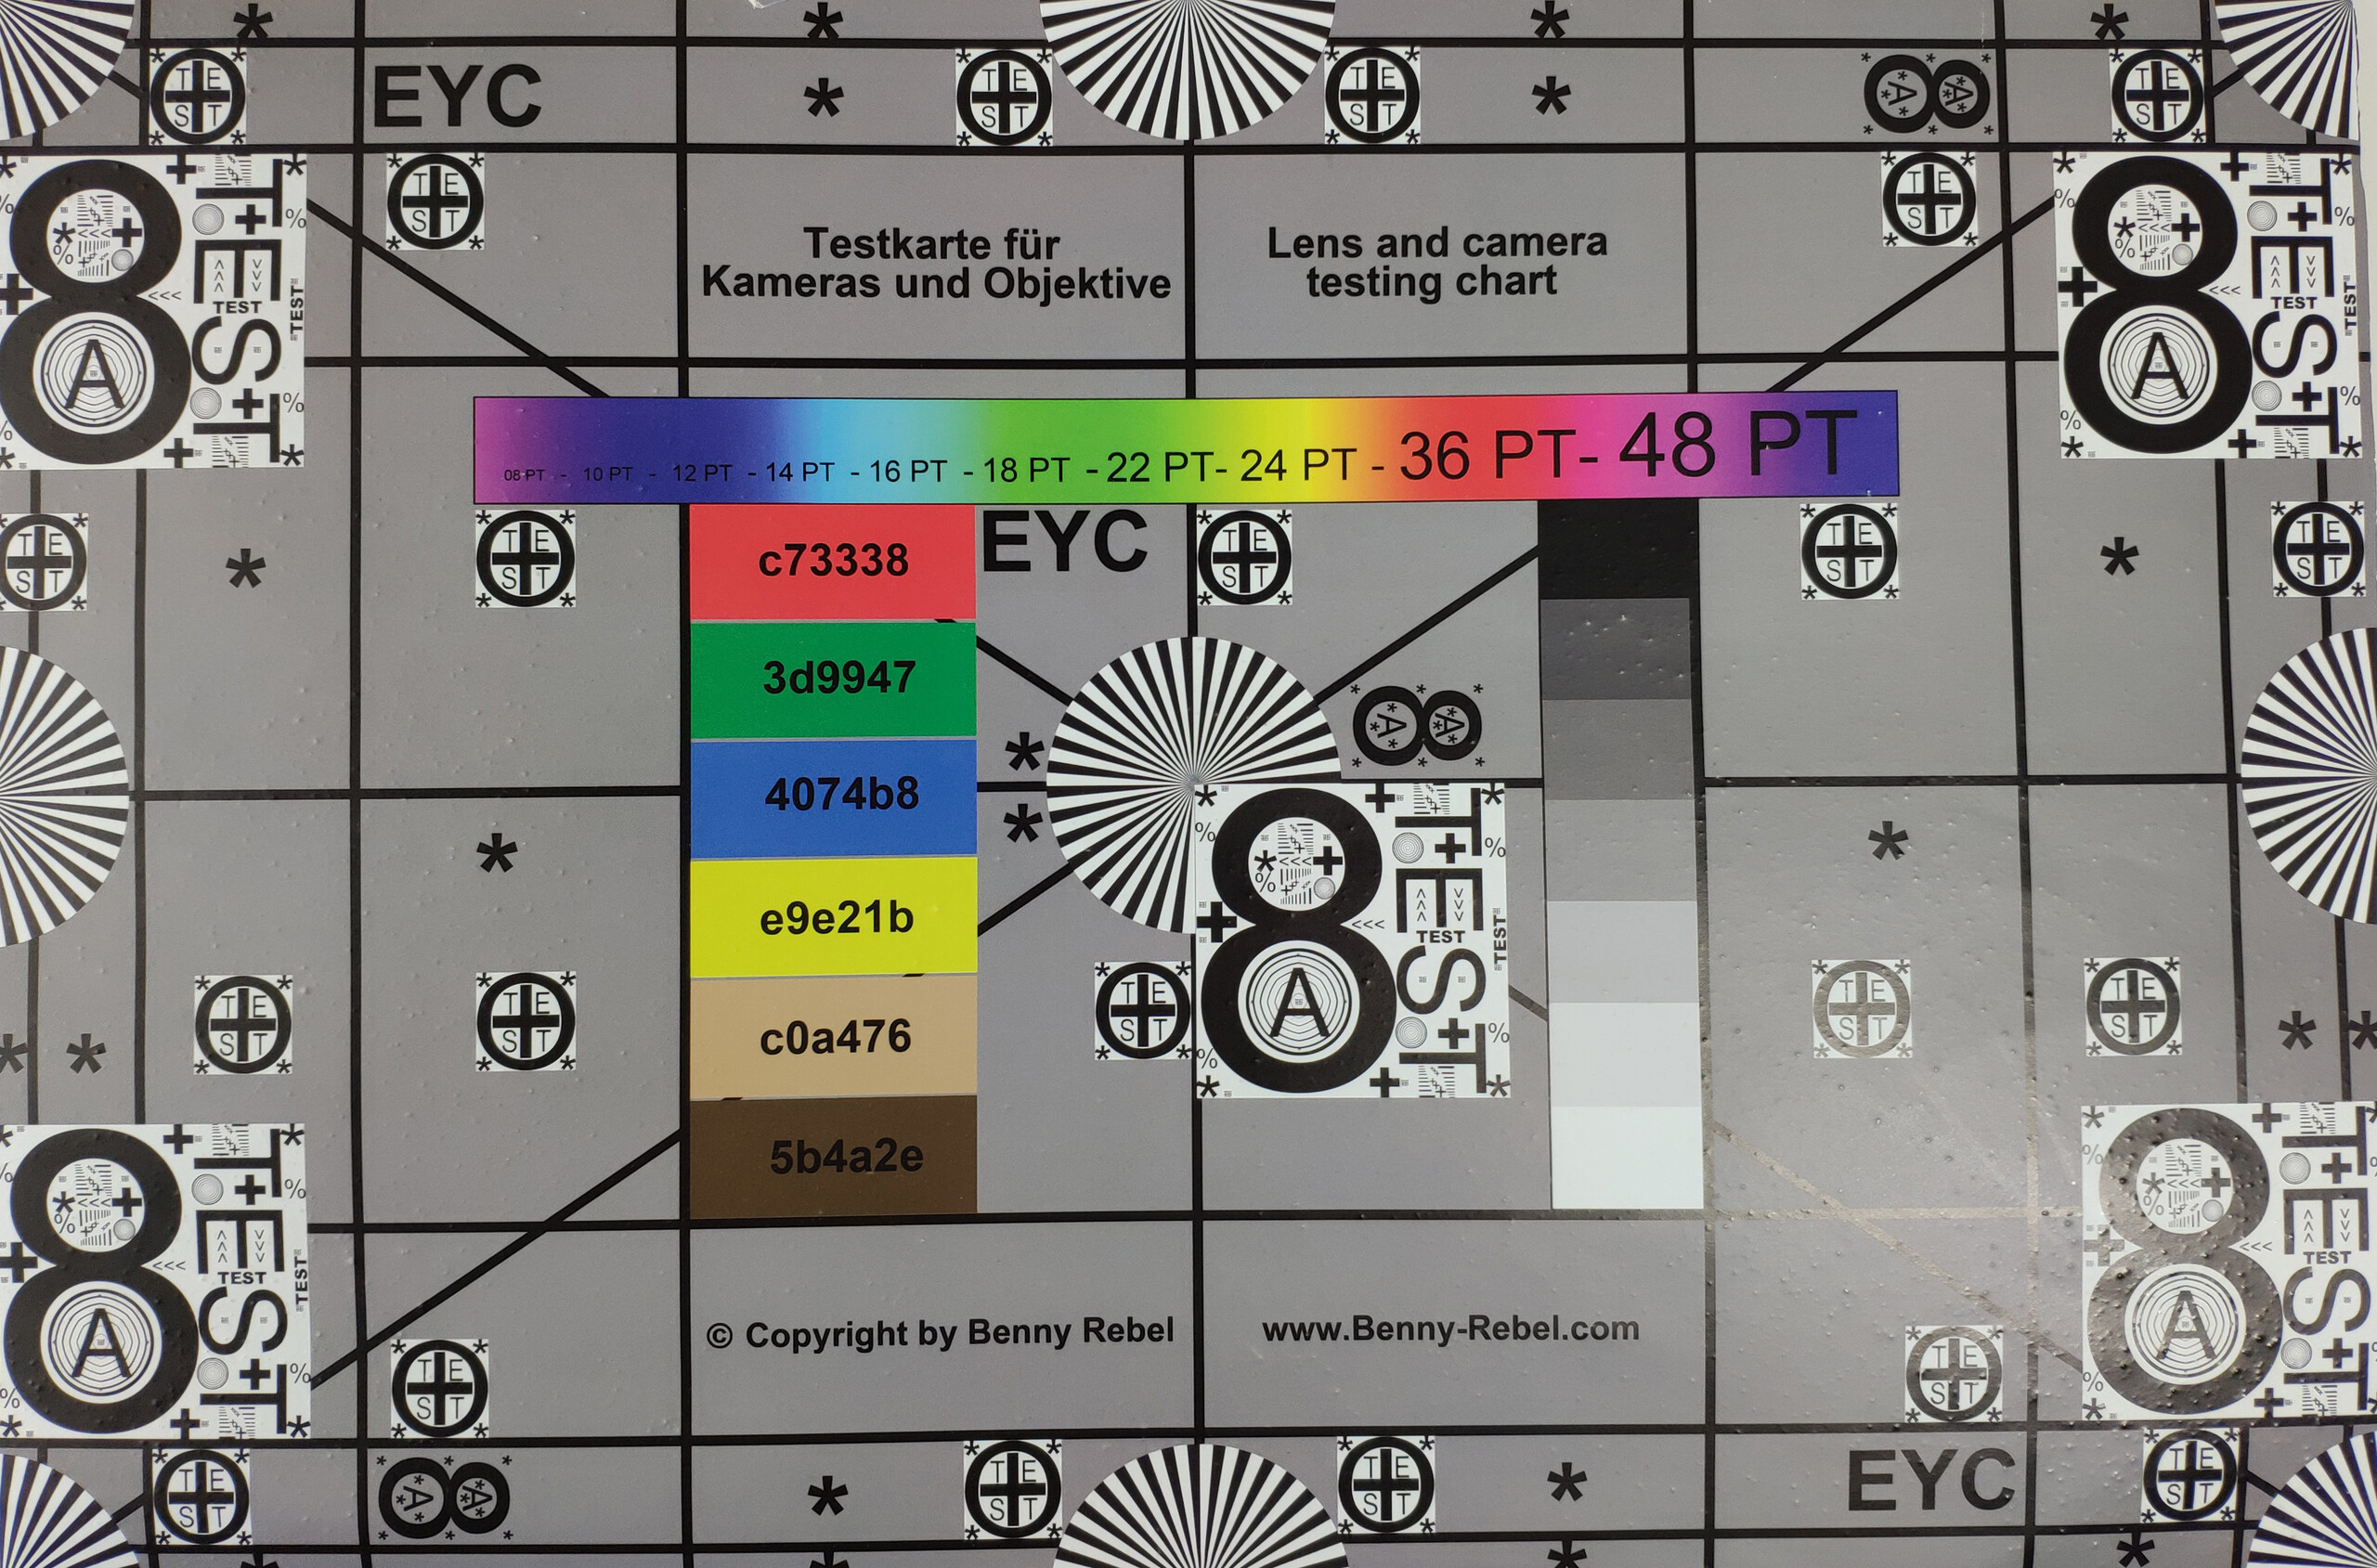
The Explorer Edition captures our test chart sharply and with good color accuracy. There is hardly any noise to text on dark backgrounds too.

Accessories & Warranty
The Explorer Edition comes with a USB Type-A to Type-C cable, a silicone case, a USB Type-C to 3.5 mm adapter and a modular Chinese charger that is rated at 1.5 A and 12 V. The charger supports QC 3.0, although the Explorer Edition supports QC 4+.
Our test device also came with a Chinese to EU adapter, courtesy of Trading Shenzhen who supplied our test device. The EU adapter is therefore not an accessory that is included with all Explorer Editions.
All Mi 8 devices come with 12 months manufacturer’s warranty. Please see our article here for information about the factors that you should consider when importing a smartphone. Please note, this article is in German.
Trading Shenzhen provides an additional warranty that allows buyers to send their devices to a German shipping address when making a warranty claim instead of sending the device back to China. This should significantly shorten the processing time for making a warranty claim. Please see our Guarantees, Return policies and Warranties FAQ for country-specific information.
Input Devices & Operation
You can use the standard Android three-button array within the navigation bar or “Full-Screen Gestures” to operate the Mi 8, the latter of which we first saw on the Mi 6X and the Mi Pad 4. Our test device responds quickly and precisely to inputs even at the corners of the display.
The Mi 8’s rear-mounted fingerprint sensor works reliably and unlocks the device promptly; it is one of the best sensors on any current smartphone.
By contrast, the Explorer Edition has a pressure sensitive in-screen fingerprint sensor. Disappointingly, the “classic” rear-mounted sensor is considerably faster and more accurate than its in-screen counterpart.
Both the Mi 8 and the Explorer Edition support the usual pattern, password and PIN security methods. However, the devices use different technologies for facial recognition. The regular Mi 8 uses infrared to recognize faces, while the Explorer Edition uses infrared and a separate sensor that stores up to 33,000 pieces of data to create a depth profile of your face. This is then combined with the infrared photo to generate a mathematical profile that must correspond with the stored facial data for the Explorer Edition to unlock. Both systems work well even in absolute darkness, but we found the Mi 8 to be generally more reliable at recognizing a face than the Explorer Edition.
The Explorer Edition comes with an MIUI Baidu keyboard preinstalled. You could download another keyboard from the Google Play Store if you do not like the Chinese characters. By contrast, the Mi 8 with its Global MIUI ROM has Gboard installed.

Display
The Mi 8 and Explorer Edition have 6.21-inch AMOLED displays that run at a native 2248x1080 resolution in an 18.7:9 aspect ratio. These values result in a pixel density of around 400 PPI, which should be sharp enough for daily use. QHD displays will look considerably sharper though when viewed next to the Mi 8 and the Explorer Edition.
According to X-Rite i1Pro 2, our test Explorer Edition achieves a maximum brightness of 460 cd/m² at the centre of the display. We achieved this value with the ambient light sensor activated and the display set to automatic mode. The more realistic APL50 test, which measures brightness by evenly distributing light and dark areas across the display, states that our test device achieves a maximum luminosity of 456 cd/m² at the centre of the display.
By contrast, our Explorer Edition test device achieved an average maximum brightness of 431.7 cd/m² in X-Rite i1Pro 2, which corresponds to an 88% brightness uniformity. Overall, the Explorer Edition has a darker display than all but the HTC U12 Plus out of our comparison devices.
Organic LEDs never radiate at their theoretical brightness, thereby reducing the peak luminosity of the display. Manufacturers tend to use pulse-width modulation (PWM) to regulate brightness with OLED displays, which Xiaomi has done with all Mi 8 models. We measured PWM on our Explorer Edition at 100 Hz, which could cause problems like dizziness and headaches for those who are PWM sensitive. We did not notice any display flickering during testing but this is merely subjective.
| |||||||||||||||||||||||||
Brightness Distribution: 88 %
Center on Battery: 429 cd/m²
Contrast: ∞:1 (Black: 0 cd/m²)
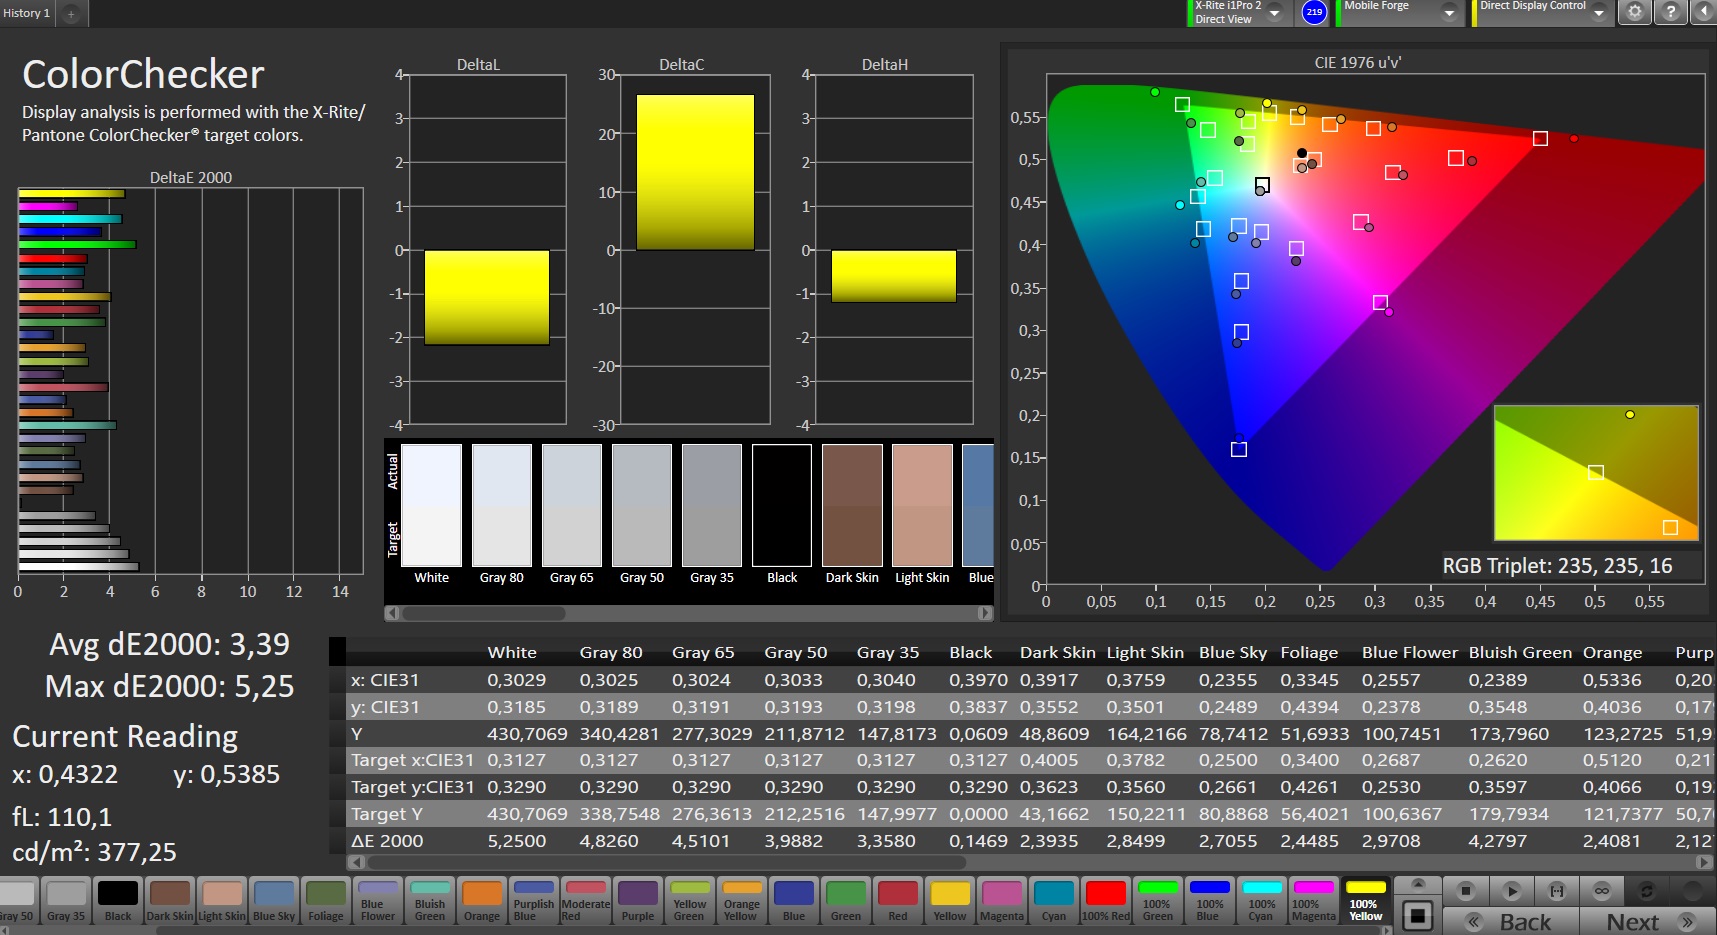
ΔE Color 3.39 | 0.5-29.43 Ø5
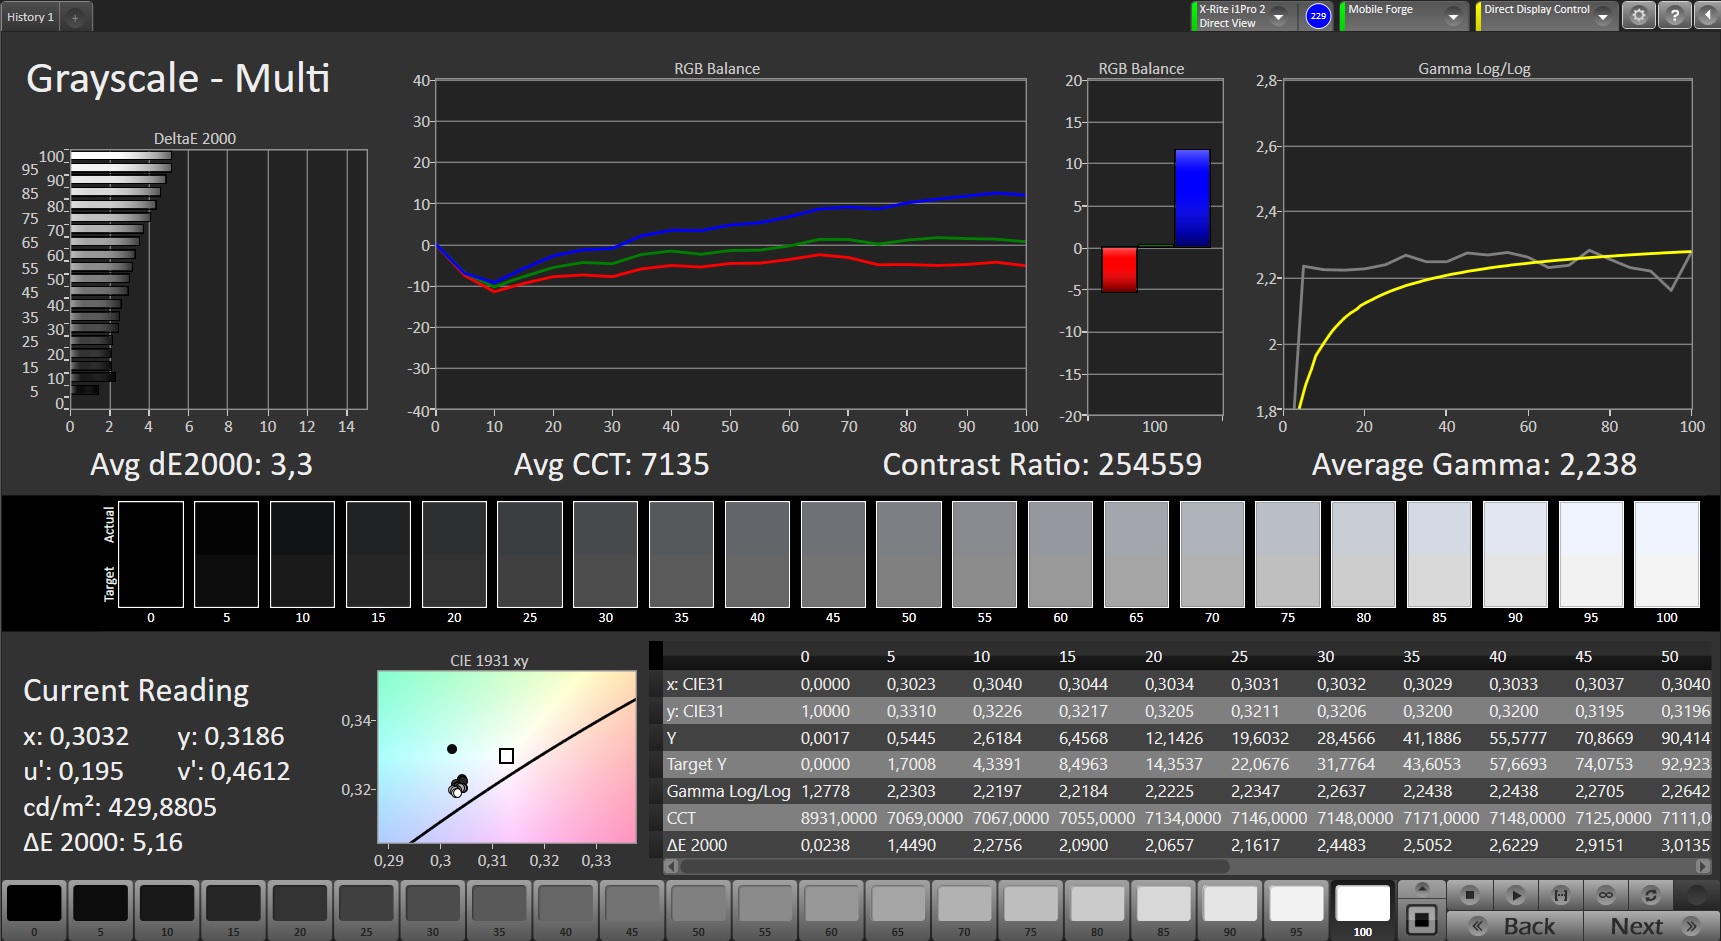
ΔE Greyscale 3.3 | 0.57-98 Ø5.3
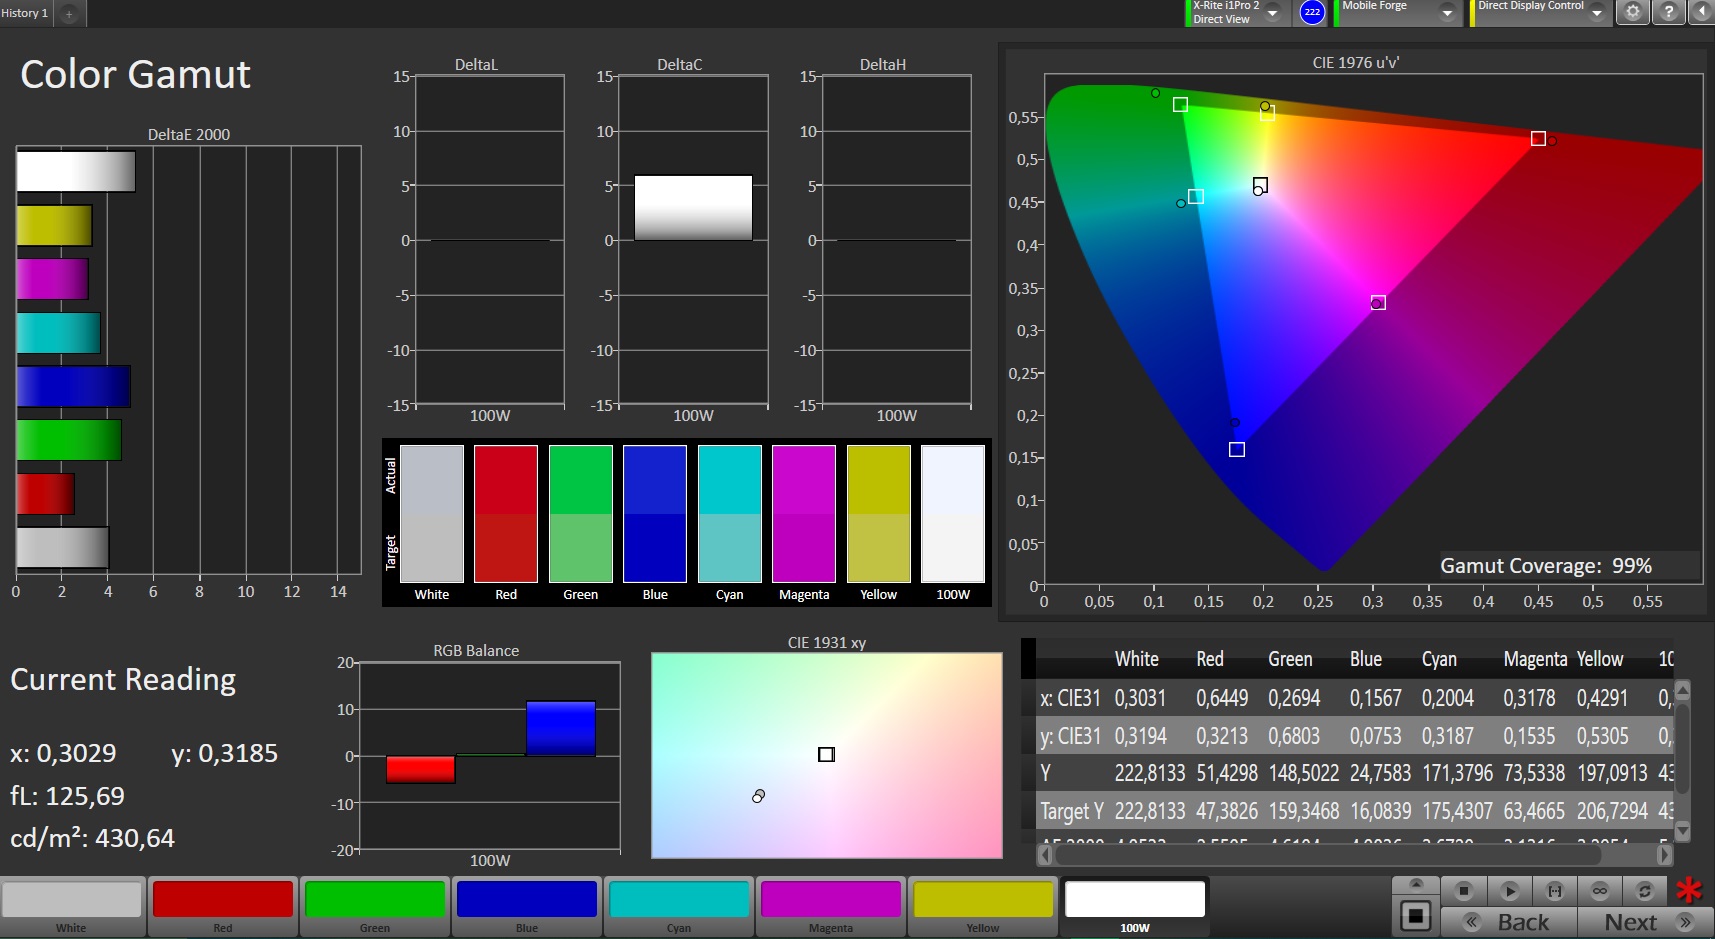
99% sRGB (Calman 2D)
Gamma: 2.238
| Xiaomi Mi 8 Explorer Edition Super AMOLED, 2248x1080, 6.20 | Xiaomi Mi 6 IPS, 1920x1080, 5.15 | Xiaomi Black Shark IPS, 2160x1080, 5.99 | Xiaomi Mi Mix 2S IPS, 2160x1080, 5.99 | Huawei P20 LTPS, 2240x1080, 5.80 | OnePlus 6 Optic AMOLED, 2280x1080, 6.28 | HTC U12 Plus Super LCD 6, 2880x1440, 6.00 | Samsung Galaxy S9 Super AMOLED, 2960x1440, 5.80 | |
|---|---|---|---|---|---|---|---|---|
| Screen | -15% | -37% | -0% | 54% | 12% | 24% | 32% | |
| Brightness middle | 429 | 620 45% | 549 28% | 492 15% | 753 76% | 430 0% | 395 -8% | 529 23% |
| Brightness | 432 | 586 36% | 541 25% | 463 7% | 748 73% | 437 1% | 402 -7% | 527 22% |
| Brightness Distribution | 88 | 89 1% | 95 8% | 90 2% | 96 9% | 87 -1% | 90 2% | 96 9% |
| Black Level * | 0.28 | 0.42 | 0.59 | 0.37 | 0.37 | |||
| Colorchecker dE 2000 * | 3.39 | 4.8 -42% | 6.08 -79% | 2.4 29% | 1.3 62% | 2.3 32% | 1.6 53% | 1.4 59% |
| Colorchecker dE 2000 max. * | 5.25 | 8.8 -68% | 10.69 -104% | 6.2 -18% | 2.3 56% | 4.6 12% | 3.4 35% | 4 24% |
| Greyscale dE 2000 * | 3.3 | 5.3 -61% | 6.6 -100% | 4.5 -36% | 1.7 48% | 2.4 27% | 1.1 67% | 1.6 52% |
| Gamma | 2.238 98% | 2.25 98% | 2.305 95% | 2.25 98% | 2.18 101% | 2.28 96% | 2.14 103% | 2.16 102% |
| CCT | 7135 91% | 7473 87% | 8399 77% | 6395 102% | 66.76 9736% | 6160 106% | 6536 99% | 6358 102% |
| Contrast | 2214 | 1307 | 834 | 2035 | 1068 |
* ... smaller is better
Screen Flickering / PWM (Pulse-Width Modulation)
| Screen flickering / PWM detected | 100 Hz | 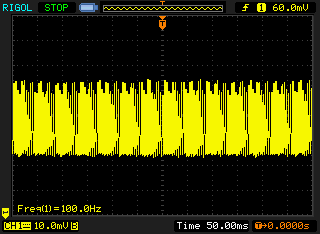 | |
The display backlight flickers at 100 Hz (worst case, e.g., utilizing PWM) . The frequency of 100 Hz is very low, so the flickering may cause eyestrain and headaches after extended use. In comparison: 53 % of all tested devices do not use PWM to dim the display. If PWM was detected, an average of 17924 (minimum: 5 - maximum: 3846000) Hz was measured. | |||
OLED displays tend to display richer black tones than their IPS counterparts for two reasons. Firstly, black areas on IPS displays radiate at half-a-thousandth less luminosity of the LED backlight. By contrast, OLED displays can individually turn off pixels to create absolute black tones and in theory, an infinitely high contrast ratio.
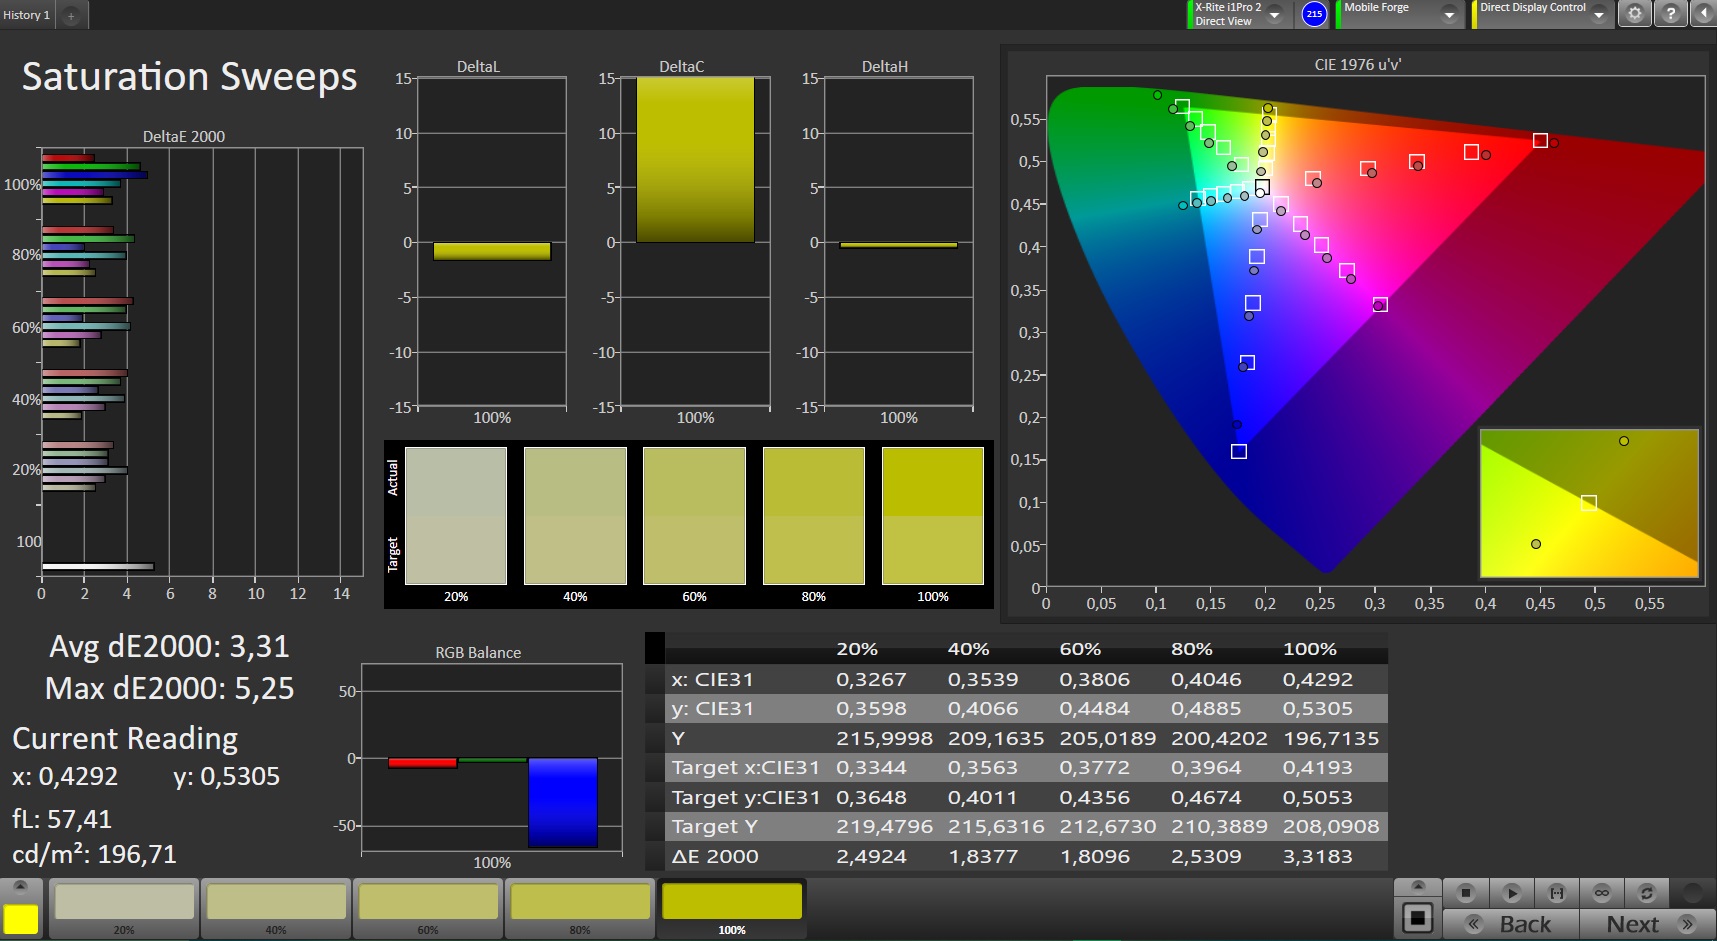
We also used a photo spectrometer and CalMAN analysis software on our Explorer Edition test device to determine its display’s color accuracy. Our test device achieved relatively low Delta E divergences from sRGB at 5.3 for colors and 3.3 for gray tones. Many of our more expensive comparison devices achieve values much closer to zero, but reportedly the human eye cannot see the difference in values below three. Hence, the Explorer Edition has impressive color accuracy in this regard.
We measure the color temperature of our test device’s display at 7,000 K, which is somewhat higher than the ideal value of 6,500 K. However, our test device is almost 100% sRGB accurate, and the display has no noticeable color cast to it.
In short, the Explorer Edition has an impressive display for the price.
Display Response Times
| ↔ Response Time Black to White | ||
|---|---|---|
| 8 ms ... rise ↗ and fall ↘ combined | ↗ 5 ms rise | 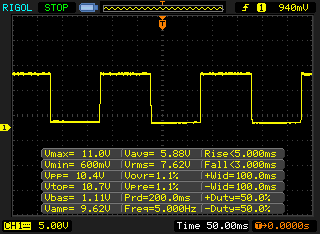 |
| ↘ 3 ms fall | ||
| The screen shows fast response rates in our tests and should be suited for gaming. In comparison, all tested devices range from 0.1 (minimum) to 240 (maximum) ms. » 17 % of all devices are better. This means that the measured response time is better than the average of all tested devices (21.5 ms). | ||
| ↔ Response Time 50% Grey to 80% Grey | ||
| 10 ms ... rise ↗ and fall ↘ combined | ↗ 5 ms rise | 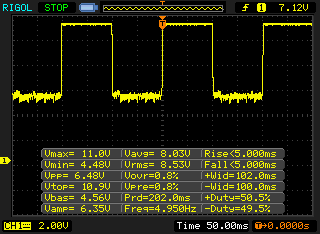 |
| ↘ 5 ms fall | ||
| The screen shows good response rates in our tests, but may be too slow for competitive gamers. In comparison, all tested devices range from 0.2 (minimum) to 636 (maximum) ms. » 18 % of all devices are better. This means that the measured response time is better than the average of all tested devices (33.7 ms). | ||
Our Explorer Edition test device is readable outdoors. However, we wish that the display got slightly brighter for using the device outside on sunny days. The degree of usability outdoors is acceptable for the regular Mi 8’s pricing, but not at the Explorer Edition’s price point.
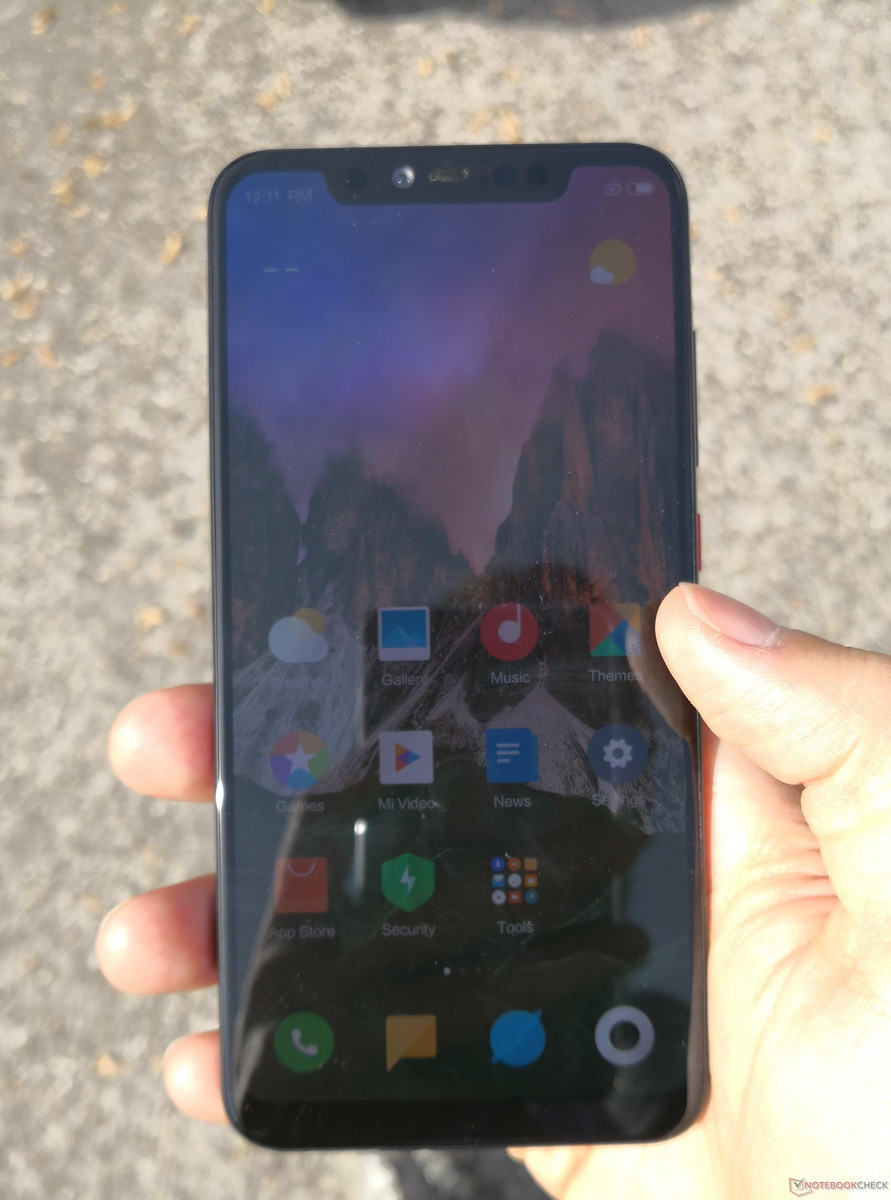
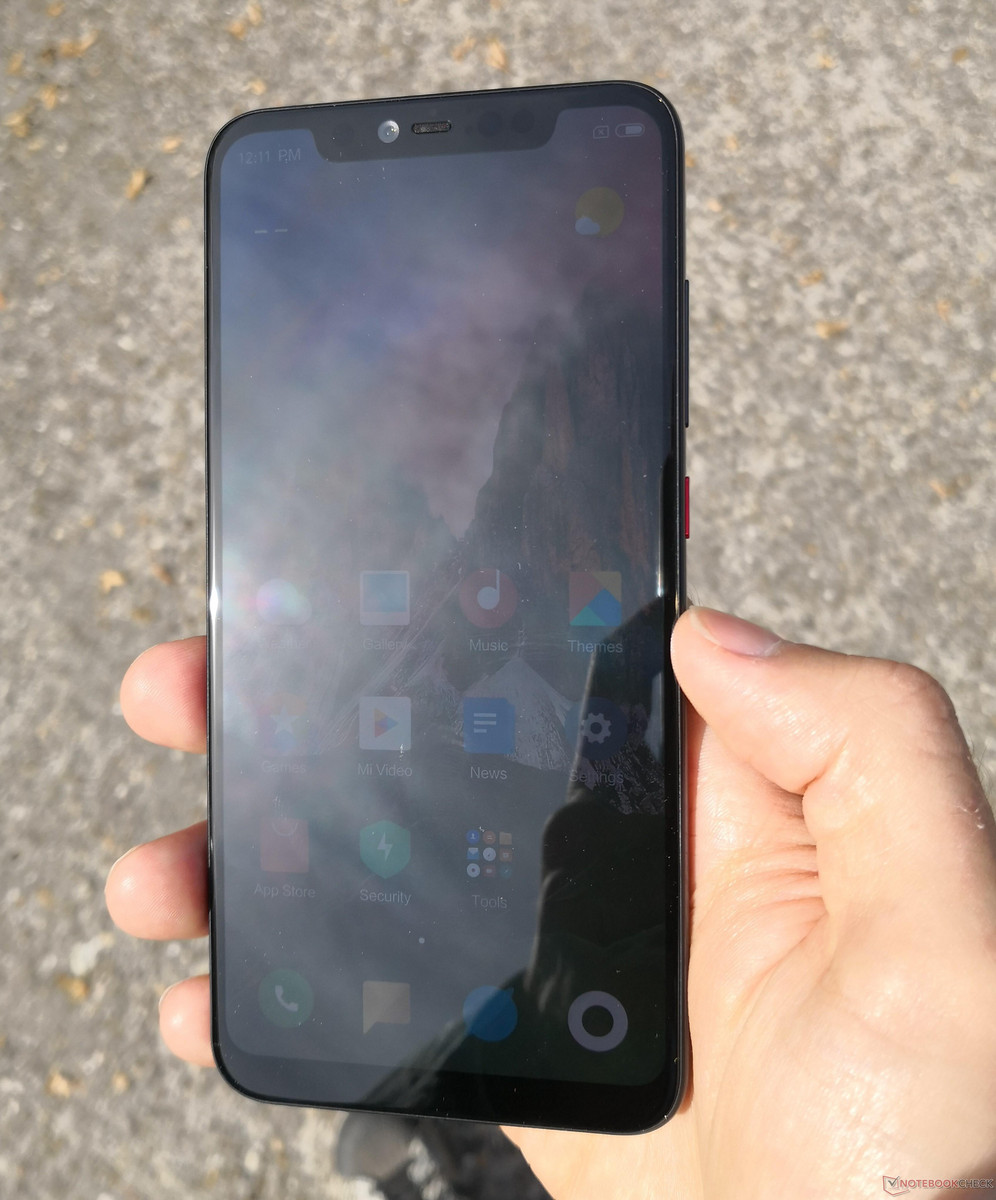
The Explorer Edition has strong viewing angles, albeit with a visible reduction in luminosity at acute viewing angles. However, colors remain vivid regardless of the angle from which we look at the display.

Performance
All Mi 8 models are powered by a Qualcomm Snapdragon 845 SoC, a chip that powers many 2018 Android flagship devices. The Snapdragon 845 integrates four ARM Cortex A75 performance cores that clock up to 2.8 GHz and four ARM Cortex A55 power-saving cores that clock up to 1.8 GHz. The CPU is also supported by a powerful Adreno 630 GPU.
Subjectively, system performance feels snappy with a Snapdragon 845 and either 6 GB or 8 GB of LPDD4 RAM. Application loading times are short, but we did notice some micro stuttering on our Explorer Edition test device, which particularly affected animations.
Our Explorer Edition test device performs exceptionally well in CPU benchmarks, especially in AnTuTu v6 and v7. The Explorer Edition beats all our comparison devices in the former and is 1% behind the Xiaomi Black Shark in the latter.
Moreover, the Explorer Edition scores highly in PCMark for Android benchmarks too, but our test device finishes in the middle of our comparison table in this regard.
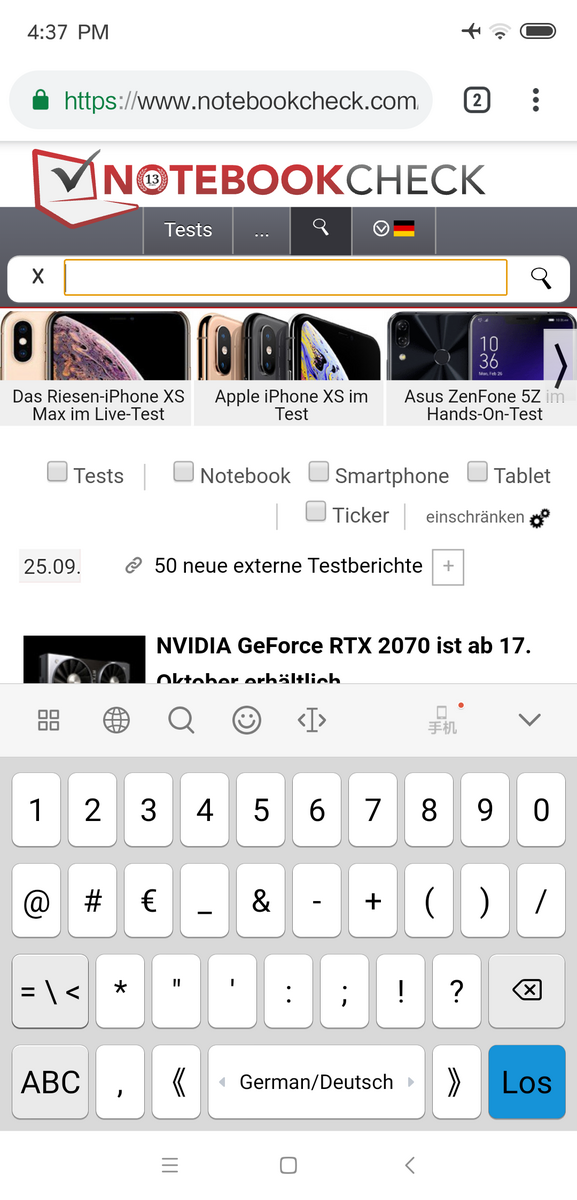
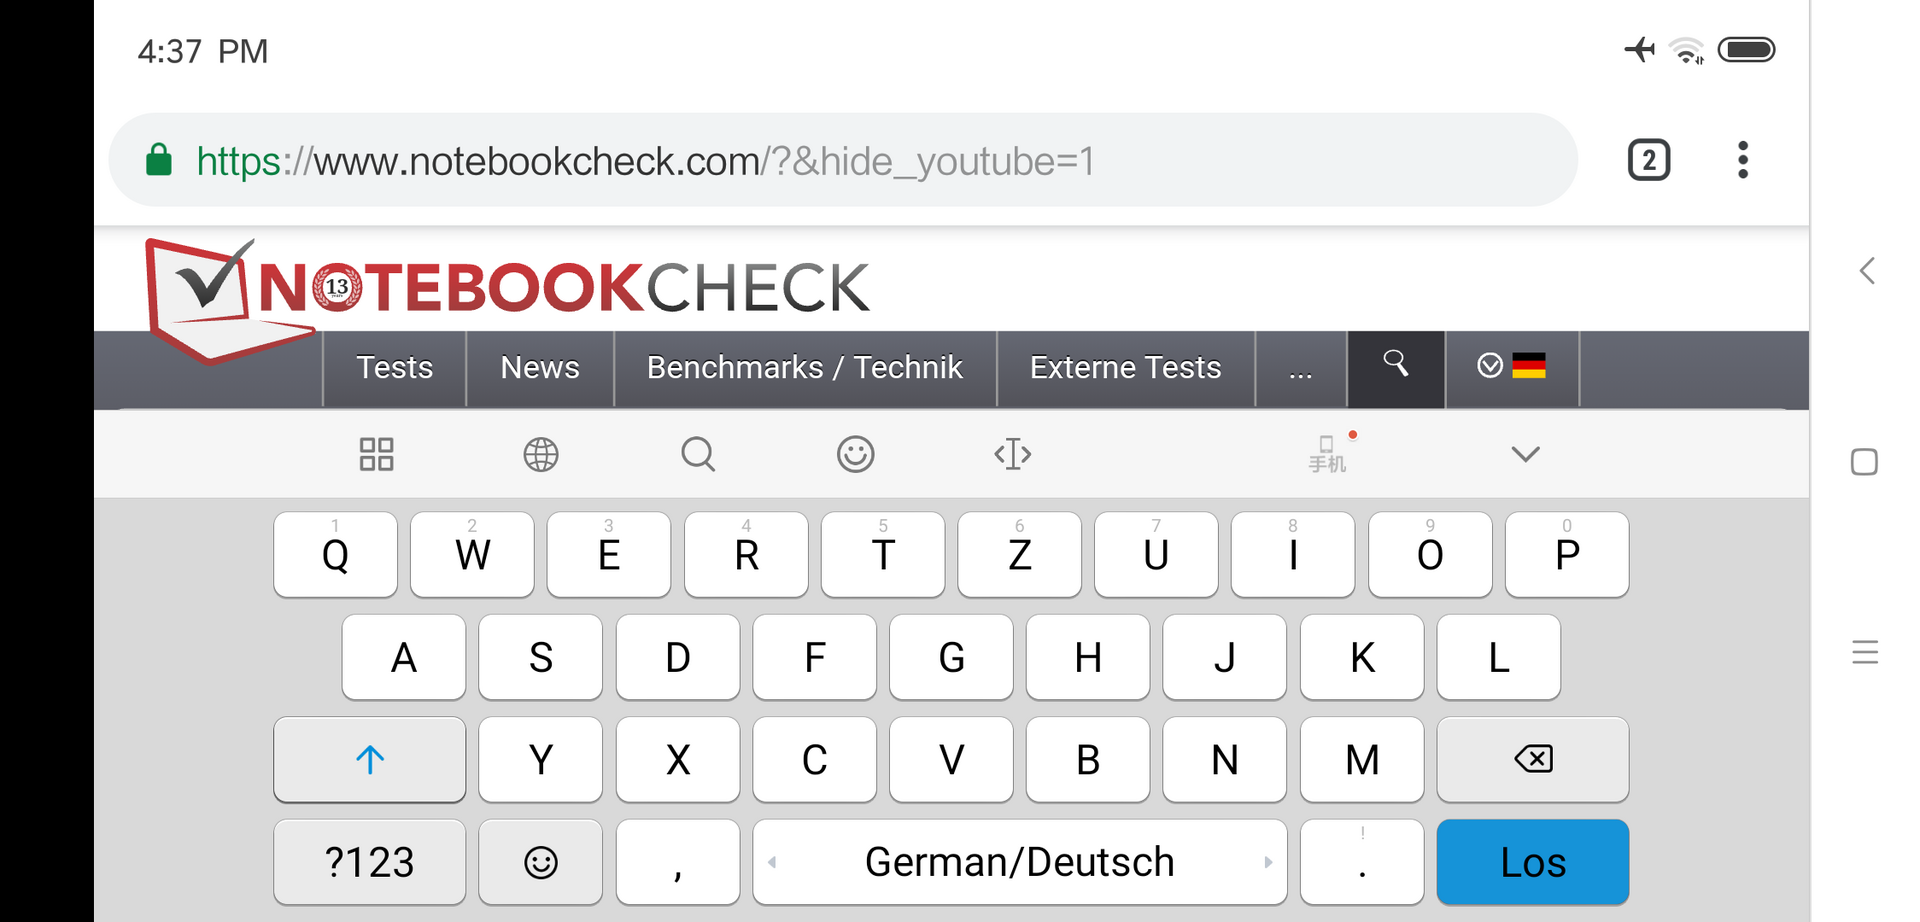
Browser performance is good too, as tested with Chrome 69. Websites load quickly, without errors and scrolling remained smooth throughout testing. The Explorer Edition also holds its own in browser benchmarks.
| JetStream 1.1 - Total Score | |
| Average of class Smartphone (last 2 years) | |
| OnePlus 6 (Chrome 66) | |
| HTC U12 Plus (Chrome 66) | |
| Xiaomi Mi 8 Explorer Edition (Chrome 69) | |
| Average Qualcomm Snapdragon 845 (22.5 - 90.9, n=25) | |
| Xiaomi Mi 6 (Chrome Version 58) | |
| Xiaomi Mi Mix 2S (Chrome 66.0.3359.158) | |
| Samsung Galaxy S9 (Samsung Browser 7.0) | |
| Huawei P20 (Chrome 66.0.3359.126) | |
| Xiaomi Black Shark | |
| Octane V2 - Total Score | |
| Average of class Smartphone (4633 - 89112, n=210, last 2 years) | |
| OnePlus 6 (Chrome 66) | |
| HTC U12 Plus (Chrome 66) | |
| Samsung Galaxy S9 (Samsung Browser 7.0) | |
| Average Qualcomm Snapdragon 845 (3991 - 18275, n=28) | |
| Xiaomi Mi 8 Explorer Edition (Chrome 69) | |
| Xiaomi Mi Mix 2S (Chrome 66.0.3359.158) | |
| Xiaomi Black Shark (Firefox 61) | |
| Xiaomi Mi 6 (Chrome Version 58) | |
| Huawei P20 (Chrome 66.0.3359.126) | |
| Mozilla Kraken 1.1 - Total | |
| Huawei P20 (Chrome 66.0.3359.126) | |
| Average Qualcomm Snapdragon 845 (2154 - 11204, n=28) | |
| Xiaomi Mi Mix 2S (Chrome 66.0.3359.158) | |
| Xiaomi Mi 6 (Chrome Version 58) | |
| OnePlus 6 (Chrome 66) | |
| HTC U12 Plus (Chrome 66) | |
| Xiaomi Mi 8 Explorer Edition (Chrome 69) | |
| Xiaomi Black Shark (Firefox 61) | |
| Samsung Galaxy S9 (Samsung Browser 7.0) | |
| Average of class Smartphone (388 - 9999, n=172, last 2 years) | |
| WebXPRT 2015 - Overall | |
| HTC U12 Plus (Chrome 66) | |
| OnePlus 6 (Chrome 66) | |
| Xiaomi Mi 8 Explorer Edition (Chrome 69) | |
| Xiaomi Black Shark (Firefox 61) | |
| Average Qualcomm Snapdragon 845 (96 - 291, n=23) | |
| Xiaomi Mi Mix 2S (Chrome 66.0.3359.158) | |
| Huawei P20 (Chrome 66.0.3359.126) | |
| Samsung Galaxy S9 (Samsung Browser 7.0) | |
* ... smaller is better
Our Mi 8 test devices score well in AndroBench 3-5, particularly in 256 KB sequential read and 4 KB random read tests. The regular Mi 8 scores around 4% higher than the Explorer Edition in these tests. Moreover, the Explorer Edition finishes joint bottom of our comparison table overall.
| Xiaomi Mi 8 Explorer Edition | Xiaomi Mi 6 | Xiaomi Black Shark | Xiaomi Mi Mix 2S | Huawei P20 | OnePlus 6 | HTC U12 Plus | Samsung Galaxy S9 | Average 128 GB UFS 2.1 Flash | Average of class Smartphone | |
|---|---|---|---|---|---|---|---|---|---|---|
| AndroBench 3-5 | 5% | 101% | 119% | 159% | 0% | 86% | 5% | 137% | 435% | |
| Sequential Read 256KB | 692 | 728 5% | 742 7% | 756 9% | 827 20% | 726 5% | 709 2% | 815 18% | 760 ? 10% | 1505 ? 117% |
| Sequential Write 256KB | 205.2 | 196.7 -4% | 199.6 -3% | 208.1 1% | 193.6 -6% | 201.4 -2% | 195.8 -5% | 206.9 1% | 297 ? 45% | 1112 ? 442% |
| Random Read 4KB | 135.2 | 143.5 6% | 127.2 -6% | 135.1 0% | 147 9% | 137 1% | 118.1 -13% | 131 -3% | 152.9 ? 13% | 247 ? 83% |
| Random Write 4KB | 22.65 | 25.19 11% | 114.1 404% | 128.4 467% | 161.5 613% | 21.8 -4% | 104.2 360% | 23.07 2% | 131.6 ? 481% | 271 ? 1096% |
| Sequential Read 256KB SDCard | 84.3 ? | 79.2 ? | 76 ? | |||||||
| Sequential Write 256KB SDCard | 63.6 ? | 67.2 ? | 59.6 ? |
Games
All Mi 8 devices are powered by a Qualcomm Adreno 630 GPU, which supports all modern APIs like OpenGL ES 3.2, OpenCL 2.0 and DirectX 12. The GPU is powerful enough to play even the most complex 3D games smoothly.
Our Explorer Edition can play current games like Asphalt 9: Legends and PUBG Mobile at a relatively constant 30 FPS at high graphics. It is worth noting that while Asphalt 9 did not drop below 26 FPS during testing, PUBG dropped to 19 FPS when played in HD. We determined frame rates with GameBench.
The touchscreen and positional sensors responded quickly and accurately throughout testing.


| Asphalt 9: Legends | |||
| Settings | Value | ||
| High Quality | 30 fps | ||
| PUBG Mobile | |||
| Settings | Value | ||
| HD | 30 fps | ||
Emissions
Temperature
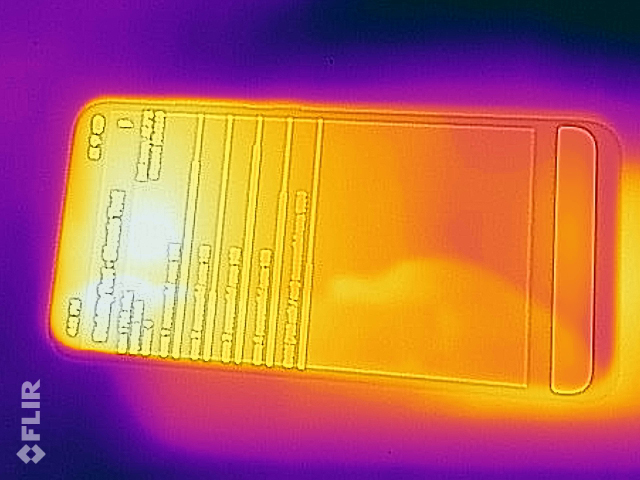
The Explorer Edition has relatively low surface temperatures at idle, but these increase significantly under sustained load. Our test device averages 30.85 °C and reaches a maximum of 31.25 °C at idle, neither of which are particularly hot.
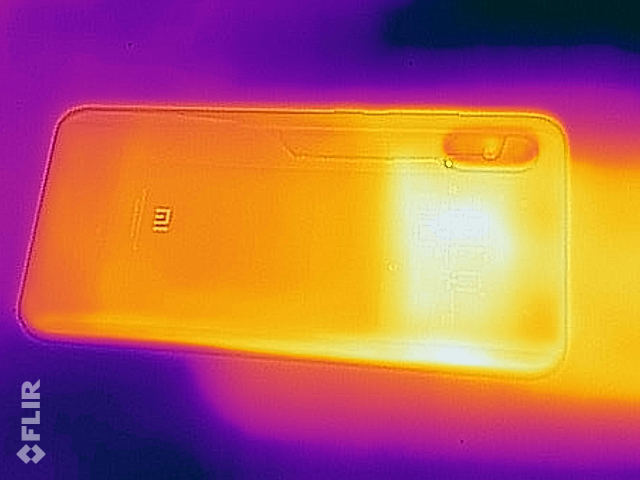
However, surface temperatures rise significantly under load to a maximum of 44.1 °C around the notch and 42.8 °C on the back of the device. The device averages 40.15 °C under sustained load, which is comparatively hot.
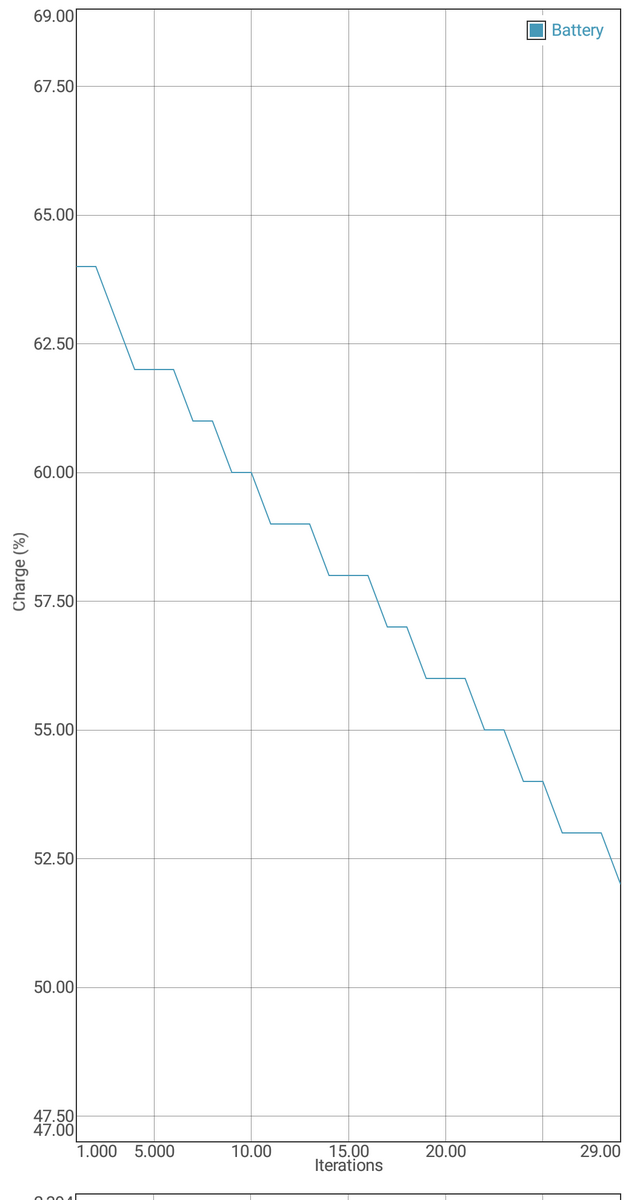
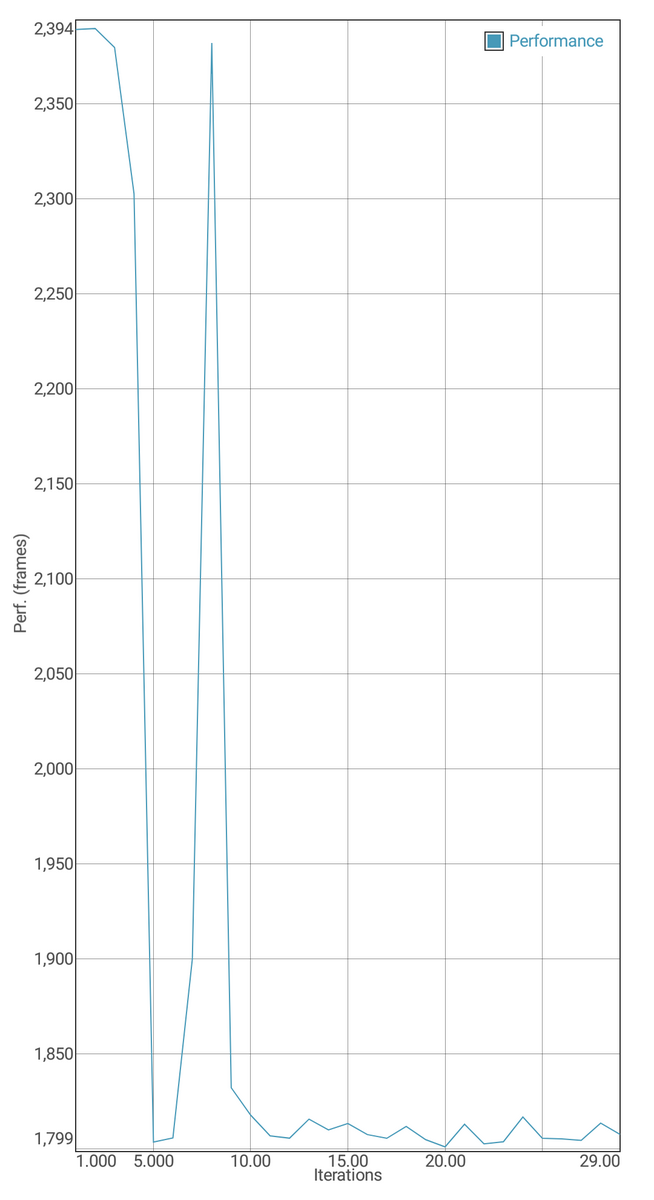
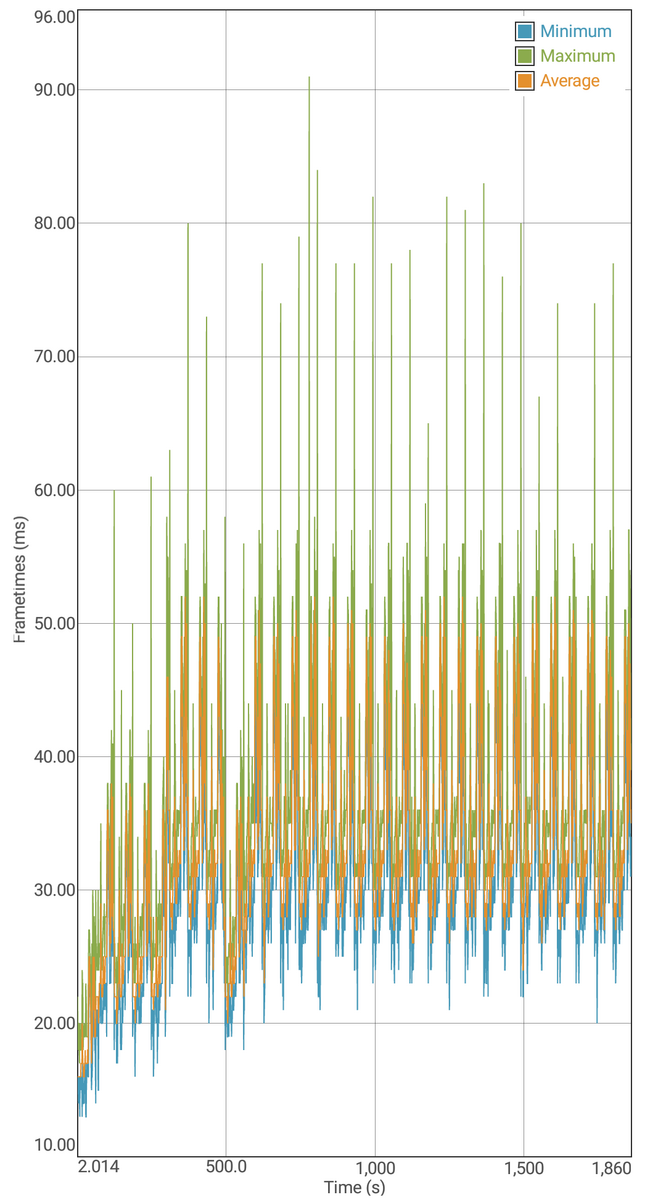
We also subjected our Explorer Edition test device to GFXBench battery benchmarks to see whether its SoC throttles under load. We ran the complex Manhattan benchmark, which is rendered with OpenGL ES 3.1, for 30 times on a loop.
The results demonstrate a fluctuating frame rate, but these are within 20%. Hence, the Explorer Edition will experience slight thermal throttling under sustained load.
(±) The maximum temperature on the upper side is 44.1 °C / 111 F, compared to the average of 35 °C / 95 F, ranging from 21.9 to 56 °C for the class Smartphone.
(±) The bottom heats up to a maximum of 42.8 °C / 109 F, compared to the average of 33.8 °C / 93 F
(+) In idle usage, the average temperature for the upper side is 31.3 °C / 88 F, compared to the device average of 32.7 °C / 91 F.
Speakers
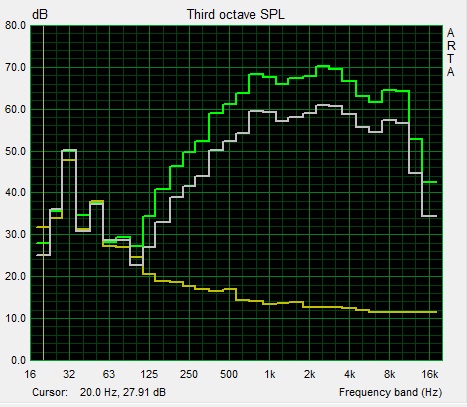
The Explorer Edition has a mono speaker that is located on the underside of the device. The speaker has comparatively linear mid tones but an absence of bass and high tones. The speaker on our test device reaches 78.7 dB(A), which is louder than the competition. Overall, the sound quality is good enough for occasionally watching short videos.
All Mi 8 devices support audio output video USB Type-C and Bluetooth. Audio output over USB Type-C is at Xiaomi’s typically high standards. The device has an equalizer and offers MI sound enhancements should you wish to customize the audio experience.
Xiaomi Mi 8 Explorer Edition audio analysis
(±) | speaker loudness is average but good (78.7 dB)
Bass 100 - 315 Hz
(-) | nearly no bass - on average 21.2% lower than median
(±) | linearity of bass is average (9% delta to prev. frequency)
Mids 400 - 2000 Hz
(+) | balanced mids - only 3.6% away from median
(+) | mids are linear (5.1% delta to prev. frequency)
Highs 2 - 16 kHz
(+) | balanced highs - only 3% away from median
(+) | highs are linear (4% delta to prev. frequency)
Overall 100 - 16.000 Hz
(±) | linearity of overall sound is average (20.4% difference to median)
Compared to same class
» 27% of all tested devices in this class were better, 10% similar, 63% worse
» The best had a delta of 12%, average was 38%, worst was 134%
Compared to all devices tested
» 48% of all tested devices were better, 8% similar, 44% worse
» The best had a delta of 4%, average was 25%, worst was 134%
OnePlus 6 audio analysis
(±) | speaker loudness is average but good (81.6 dB)
Bass 100 - 315 Hz
(-) | nearly no bass - on average 62.6% lower than median
(+) | bass is linear (0% delta to prev. frequency)
Mids 400 - 2000 Hz
(-) | nearly no mids - on average 62.6% lower than median
(+) | mids are linear (0% delta to prev. frequency)
Highs 2 - 16 kHz
(-) | nearly no highs - on average 62.6% lower than median
(+) | highs are linear (0% delta to prev. frequency)
Overall 100 - 16.000 Hz
(-) | overall sound is not linear (108.7% difference to median)
Compared to same class
» 85% of all tested devices in this class were better, 0% similar, 15% worse
» The best had a delta of 12%, average was 38%, worst was 134%
Compared to all devices tested
» 95% of all tested devices were better, 0% similar, 5% worse
» The best had a delta of 4%, average was 25%, worst was 134%
Battery Life
Power Consumption
The Explorer Edition is a comparatively power-inefficient device. Xiaomi has failed to optimize the device’s software properly, particularly at idle. The Explorer Edition finishes bottom of our power consumption comparison table and is 29% less efficient than the average of Snapdragon 845-powered devices that we have currently tested.
Xiaomi has equipped the Explorer Edition with a 3,000 mAh battery and the cheaper regular Mi 8 with a 3,400 mAh battery.
| Off / Standby | |
| Idle | |
| Load |
|
| Xiaomi Mi 8 Explorer Edition 3000 mAh | Xiaomi Mi 6 3350 mAh | Xiaomi Black Shark 4000 mAh | Xiaomi Mi Mix 2S 3400 mAh | Huawei P20 3400 mAh | OnePlus 6 3300 mAh | HTC U12 Plus 3500 mAh | Samsung Galaxy S9 3000 mAh | Average Qualcomm Snapdragon 845 | Average of class Smartphone | |
|---|---|---|---|---|---|---|---|---|---|---|
| Power Consumption | 42% | 30% | 25% | 26% | 44% | 20% | 53% | 30% | 33% | |
| Idle Minimum * | 1.8 | 0.45 75% | 0.8 56% | 0.75 58% | 0.67 63% | 0.6 67% | 0.77 57% | 0.65 64% | 0.862 ? 52% | 0.897 ? 50% |
| Idle Average * | 2.9 | 1.67 42% | 1.5 48% | 2.25 22% | 2.05 29% | 1 66% | 2.18 25% | 0.81 72% | 1.728 ? 40% | 1.452 ? 50% |
| Idle Maximum * | 3.5 | 1.69 52% | 2.3 34% | 2.26 35% | 2.11 40% | 1.6 54% | 2.21 37% | 0.92 74% | 2.07 ? 41% | 1.629 ? 53% |
| Load Average * | 4.8 | 4.07 15% | 4.8 -0% | 4.89 -2% | 6.15 -28% | 4.3 10% | 6.25 -30% | 4.76 1% | 4.87 ? -1% | 5.55 ? -16% |
| Load Maximum * | 11.2 | 8.54 24% | 10.1 10% | 9.6 14% | 8.09 28% | 8.6 23% | 10.16 9% | 5.16 54% | 9.27 ? 17% | 8.31 ? 26% |
* ... smaller is better
Battery Life
The Explorer Edition’s battery life reflects its relatively inefficient power consumption. Our test device lasts for 3 h 11 m under sustained load, which is considerably lower than all our comparison devices except for the Galaxy S9.
Our test device fared better in our Wi-Fi battery life test, which we run on all devices with their displays set to 150 cd/m². The Explorer Edition lasted 11 h 34 m in this test, which is rather good given the device’s 3,000 mAh battery. By contrast, most of our comparison devices last between 2-18% longer, but they all have larger batteries. The regular Mi 8 also lasts longer too thanks to its 400-mAh larger battery.
The included 18 W charger recharges our test device fully in 90 minutes.
| Xiaomi Mi 8 Explorer Edition 3000 mAh | Xiaomi Mi 6 3350 mAh | Xiaomi Black Shark 4000 mAh | Xiaomi Mi Mix 2S 3400 mAh | Huawei P20 3400 mAh | OnePlus 6 3300 mAh | HTC U12 Plus 3500 mAh | Samsung Galaxy S9 3000 mAh | |
|---|---|---|---|---|---|---|---|---|
| Battery Runtime | 6% | 10% | 7% | 24% | 14% | -13% | -24% | |
| Reader / Idle | 1401 | 1753 25% | 1678 20% | 1888 35% | 1806 29% | 1452 4% | 1182 -16% | |
| H.264 | 921 | 747 -19% | 718 -22% | 810 -12% | 791 -14% | 464 -50% | 609 -34% | |
| WiFi v1.3 | 694 | 739 6% | 711 2% | 716 3% | 818 18% | 762 10% | 507 -27% | 474 -32% |
| Load | 191 | 253 32% | 239 25% | 295 54% | 246 29% | 230 20% | 164 -14% |
Pros
Cons
Verdict
Xiaomi has created one of this year’s best value for money smartphones, something that we had not expected given previous Mi devices. We would even recommend upgrading from the Mi 6, so great are the Mi 8’s improvements and refinements.
If you are faced with the question about which version of the Mi 8 you should choose, then our answer is clear: Choose the regular Mi 8, particularly when it is currently 200 Euros (~$231) cheaper. Ignoring the difference in price, the regular Mi 8 is the better smartphone with its superior battery life and its more reliable fingerprint sensor. The Xiaomi Mi 8 Explorer Edition will turn heads with its striking back, its additional 2 GB of RAM and innovative biometric technologies. The latter is no faster than the more conventional ones that the regular Mi 8 uses though.
You will not go wrong with the Xiaomi Mi 8, but it is not the best smartphone of the year.
Irrespective of the Explorer Edition, the Mi 8 is an impressive, premium smartphone. However, the device is missing a great deal from being a top smartphone in 2018. The cameras, the speaker, the software, the GPS and the lack of both IP certification and wireless charging distinguish the Mi 8 Explorer Edition from more expensive flagships. This is acceptable given the Explorer Edition’s price, particularly considering that Xiaomi has got plenty of things right with the device.
Xiaomi Mi 8 Explorer Edition
-
09/24/2018 v6(old)
Marcus Herbrich


Pricecompare

