 Deutsch
 English
 Español
 Français
 Italiano
 Nederlands
 Polski
 Português
 Русский
 Türkçe
 Svenska
 Chinese
 Magyar
XMG Fusion 15 (Early 24) review: A compact RTX 4070 laptop for gamers and creators

The XMG Fusion 15 (Early 24)—a 15.3-inch laptop for gamers and creators—is based on a barebone (GM5IX7A) from the manufacturer Tongfang. Raptor Lake, Ada Lovelace and 32 GB RAM equip the laptop for streaming, rendering and gaming. The present variant can be purchased for around US$2,500. Competitors include devices such as the Aorus 16X (2024), Alienware m16 R2, HP Omen Transcend 16 and the Lenovo Legion Pro 5 16IRX9.
Possible competitors compared
Rating | Date | Model | Weight | Height | Size | Resolution | Best Price |
|---|---|---|---|---|---|---|---|
| 88.9 % | 05/2024 | SCHENKER XMG Fusion 15 (Early 24) i9-14900HX, NVIDIA GeForce RTX 4070 Laptop GPU | 2.1 kg | 21.9 mm | 15.30" | 2560x1600 | |
| 87.4 % | 04/2024 | Aorus 16X 2024 i9-14900HX, NVIDIA GeForce RTX 4070 Laptop GPU | 2.3 kg | 20 mm | 16.00" | 2560x1600 | |
| 90.2 % | 03/2024 | Alienware m16 R2 Ultra 7 155H, NVIDIA GeForce RTX 4070 Laptop GPU | 2.5 kg | 23.5 mm | 16.00" | 2560x1600 | |
| 88.4 % | 02/2024 | HP Omen Transcend 16-u1095ng i9-14900HX, NVIDIA GeForce RTX 4070 Laptop GPU | 2.3 kg | 20 mm | 16.00" | 2560x1600 | |
| 89.3 % | 03/2024 | Lenovo Legion Pro 5 16IRX9 i9-14900HX, NVIDIA GeForce RTX 4070 Laptop GPU | 2.5 kg | 26.95 mm | 16.00" | 2560x1600 |
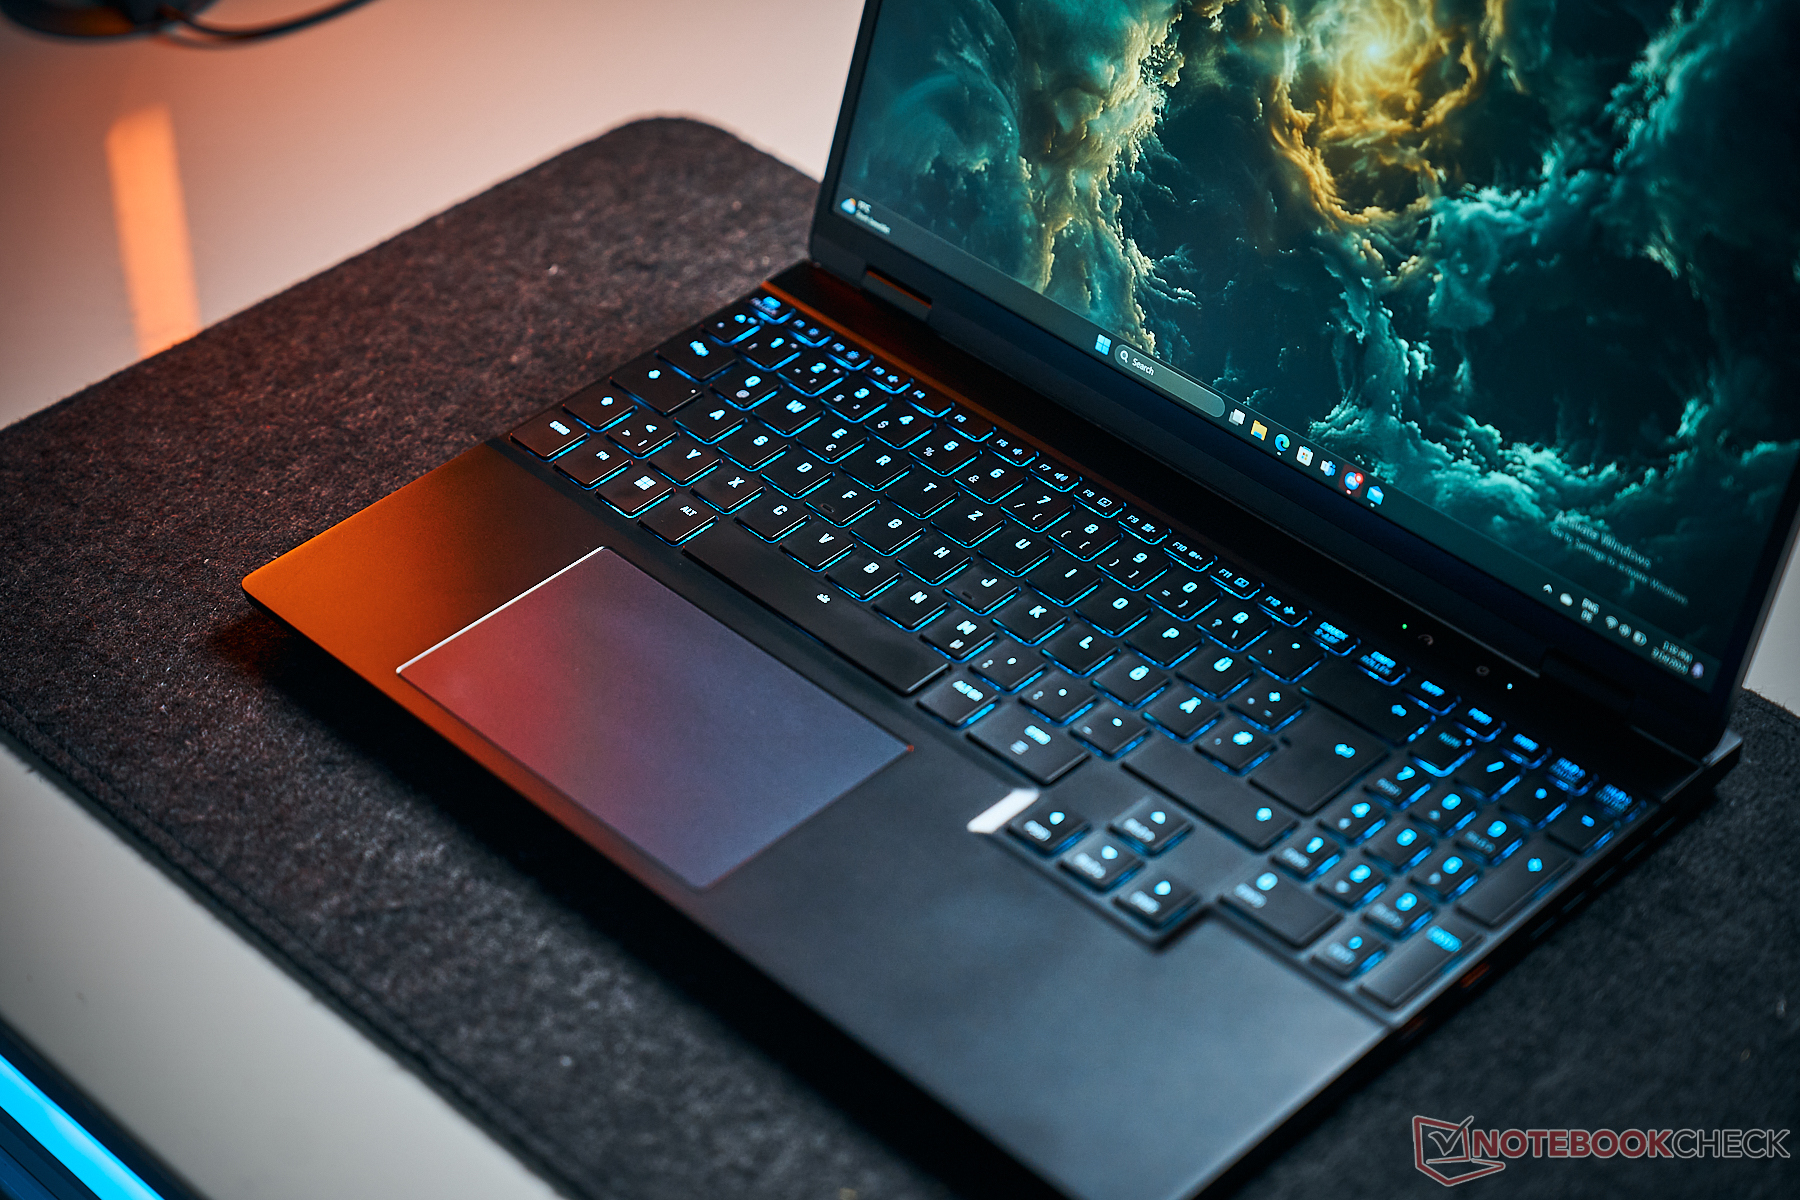
Case - The XMG laptop with an aluminum case
Schenker has gone for a sleek, matte black aluminium case with smooth surfaces. The laptop doesn't feature any eye-catching design elements or LED strips—only its keyboard backlighting (RGB) gives the device a bit of color. The laptop would barely stick out in professional environments.
We noted no material protrusions and all the gaps line up perfectly. The base unit and lid can be twisted ever so slightly, but this is nothing out of the ordinary. Pressing onto the back of the lid doesn't result in any picture changes. The stiff hinges allow a maximum opening angle of 180 degrees. It is possible to open it with one hand.


No surprise: Within the comparison field, the Fusion is the most compact device—it features the smallest display. At the same time, it is also the most lightweight of them all.
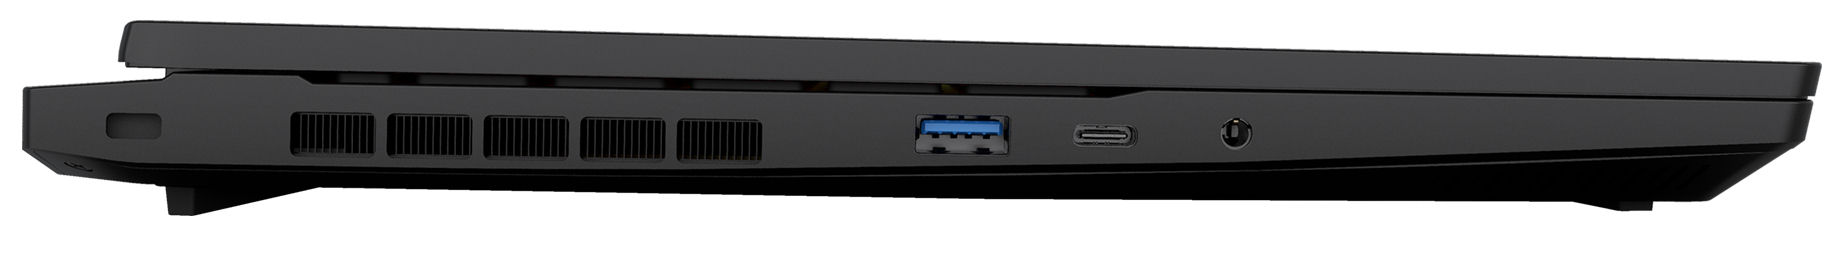
Connectivity - The Fusion 15 with Thunderbolt 4
The Fusion features three USB-A ports (USB 3.2 Gen 1) and two USB-C ports (1x USB 3.2 Gen 1, 1x Thunderbolt 4). The TB4 port supports Power Delivery and can output a DisplayPort signal. In total, the laptop has two video outputs (1x HDMI, 1x DP). An audio jack and a Gigabit Ethernet port round out its connectivity options. Its video outputs and power connection are located on the back of the device. Corresponding cables would run out the back, so they would not get in your way.


SD card reader
With transfer rates of 81 MB/s (transferring 250 jpg images, each 5 MB in size) and 82 MB/s (copying large data blocks), the SD card reader (reference card: AV PRO microSD 128 GB V60) is of average speed. The competition largely offers faster readers.
| SD Card Reader | |
| average JPG Copy Test (av. of 3 runs) | |
| Aorus 16X 2024 (AV PRO microSD 128 GB V60) | |
| Average of class Gaming (19 - 202, n=97, last 2 years) | |
| SCHENKER XMG Fusion 15 (Early 24) (AV PRO microSD 128 GB V60) | |
| Alienware m16 R2 (AV PRO microSD 128 GB V60) | |
| maximum AS SSD Seq Read Test (1GB) | |
| Alienware m16 R2 (AV PRO microSD 128 GB V60) | |
| Aorus 16X 2024 (AV PRO microSD 128 GB V60) | |
| Average of class Gaming (25.8 - 269, n=92, last 2 years) | |
| SCHENKER XMG Fusion 15 (Early 24) (AV PRO microSD 128 GB V60) | |
Communication
The Fusion uses a WiFi 6E chip (Intel AX211) which, in the best-case scenario (no WiFi devices in close vicinity, short distance between laptop and server), reaches very good data rates. Wired connections are taken care of by a Gigabit Ethernet controller (YT6801) from Motorcomm—a manufacturer which we have not encountered before.
Webcam
Its webcam (2.1 MP) is of average quality. It fails when it comes to color accuracy: With a deviation of about 9, the target value (DeltaE<3) has been missed. It does, however, support Windows Hello. Furthermore, it is fitted with a mechanical cover.

 NVIDIA GeForce RTX 4070 Laptop GPU, i9-14900HX, Samsung 990 Pro 1 TB")
 NVIDIA GeForce RTX 4070 Laptop GPU, i9-14900HX, Samsung 990 Pro 1 TB")
Accessories
The laptop comes delivered with a USB stick (driver, manuals), stickers and a mousepad.
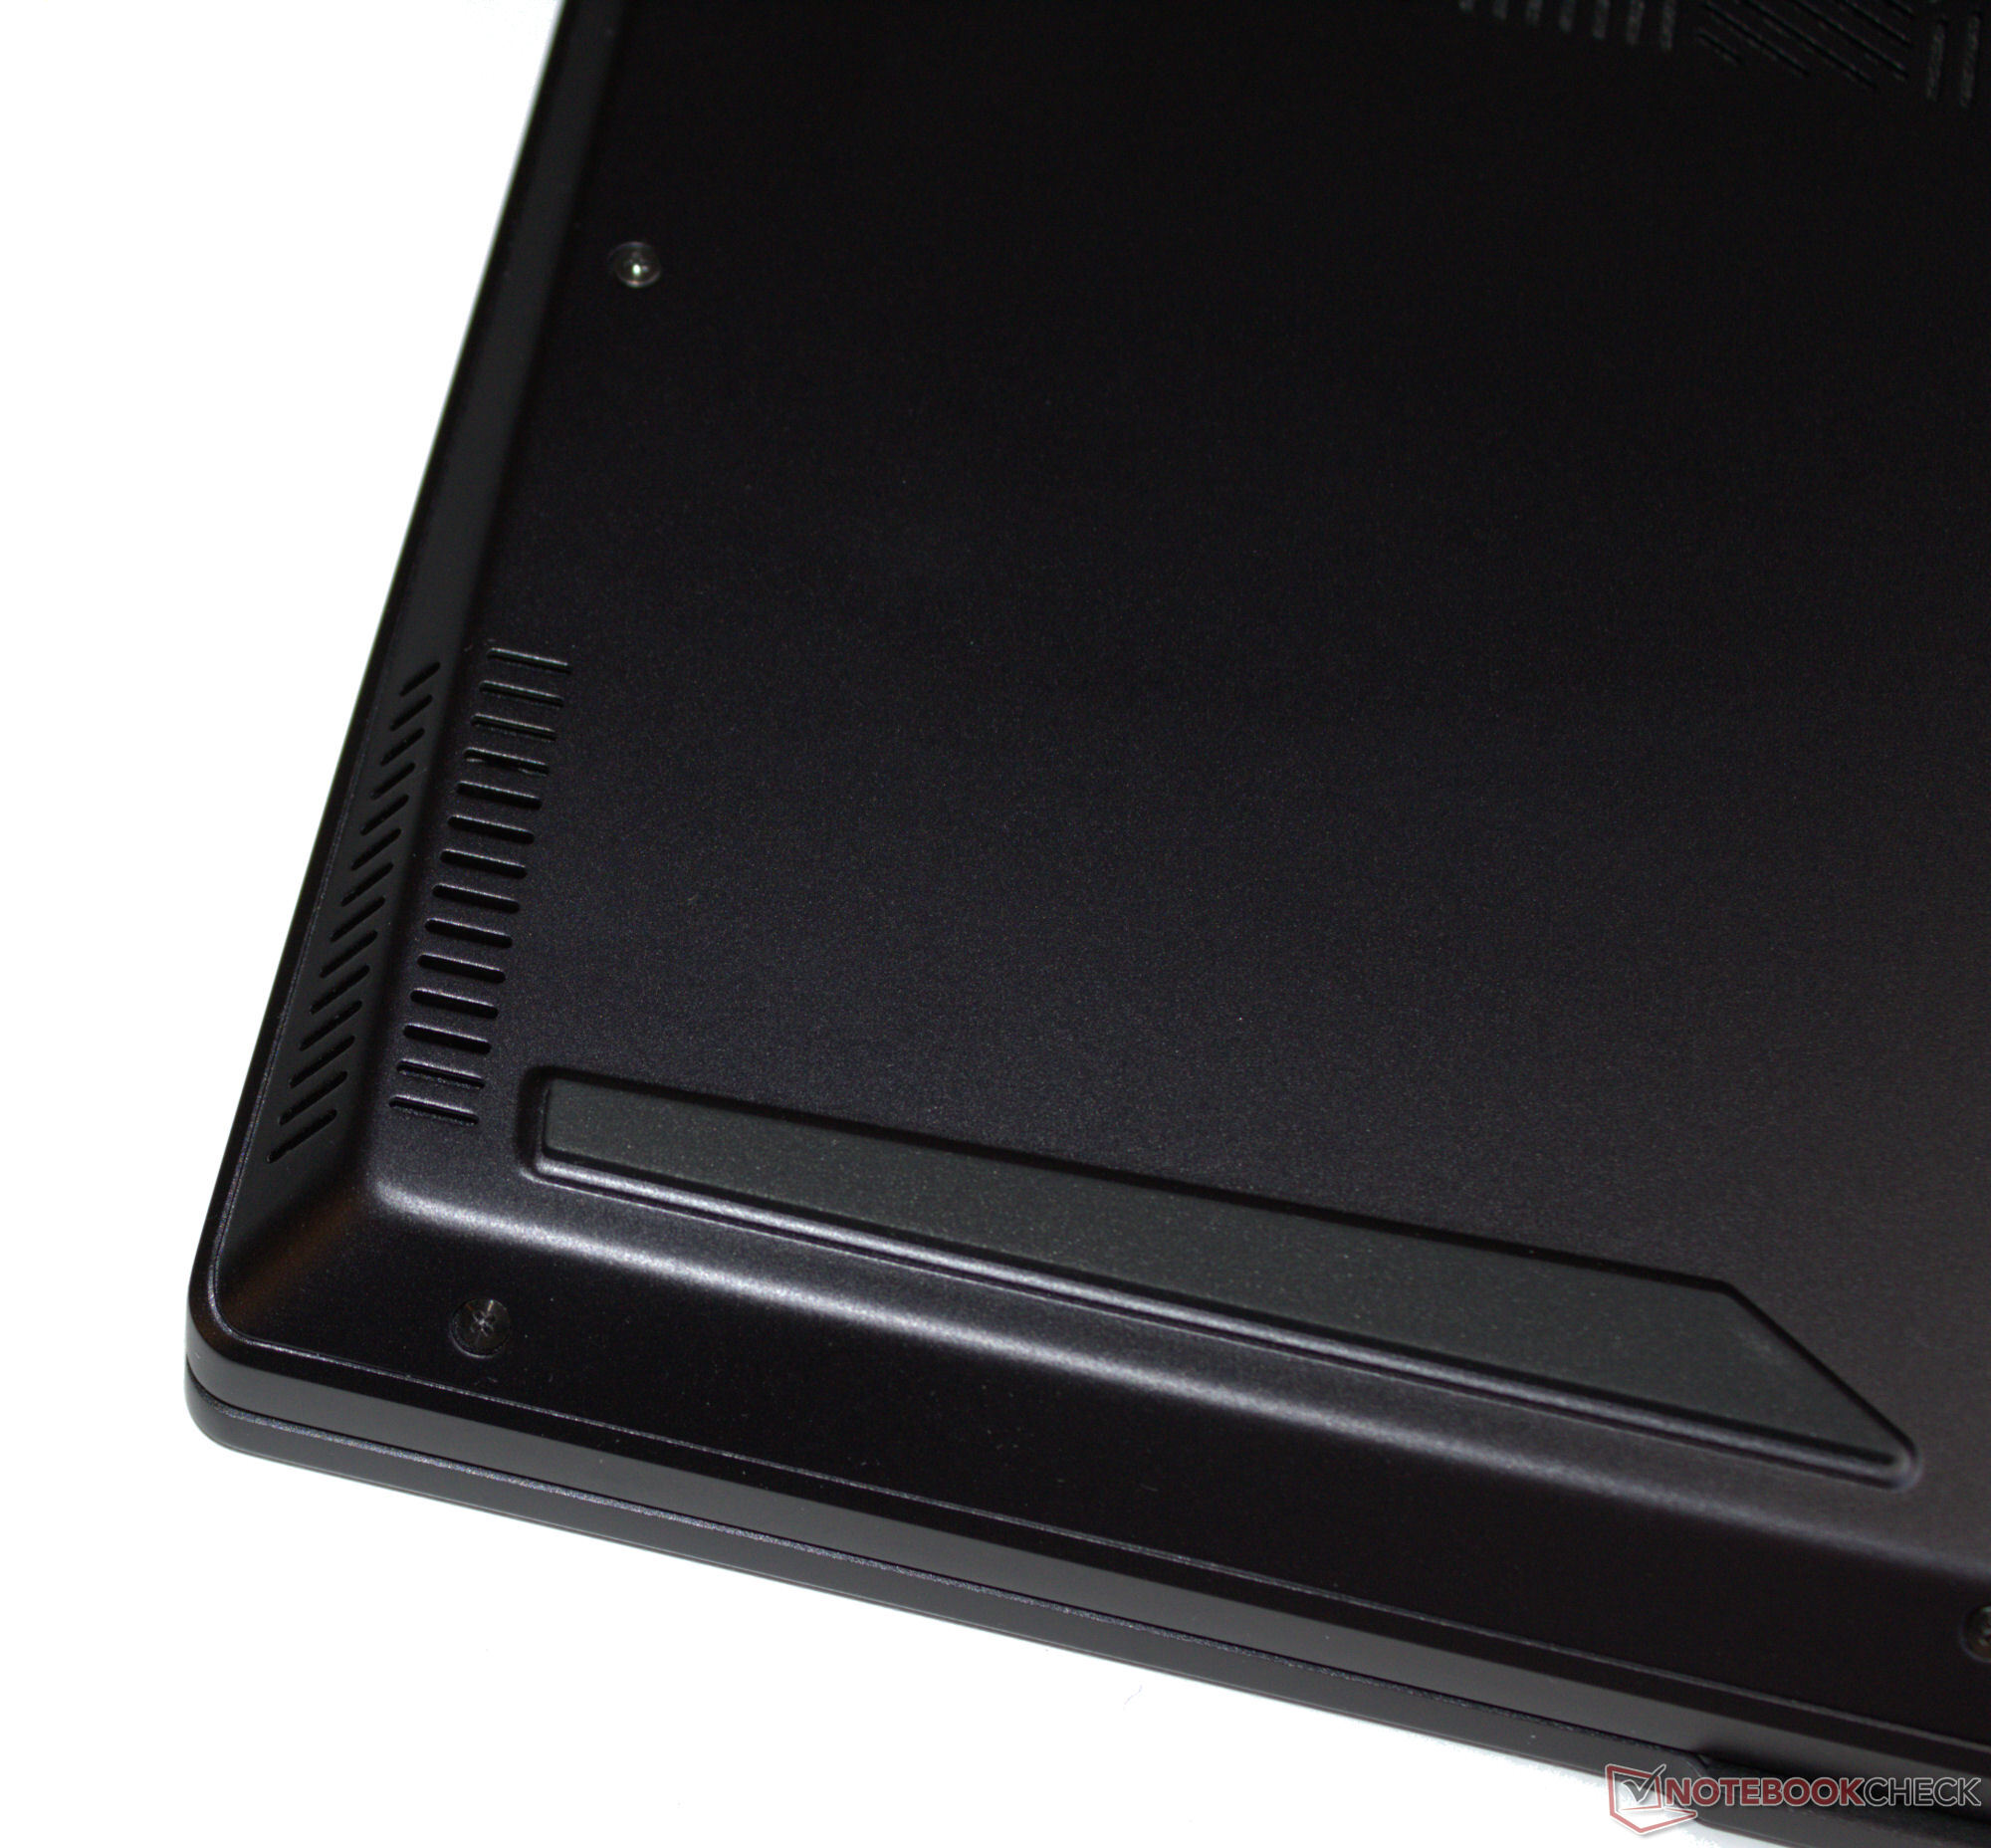
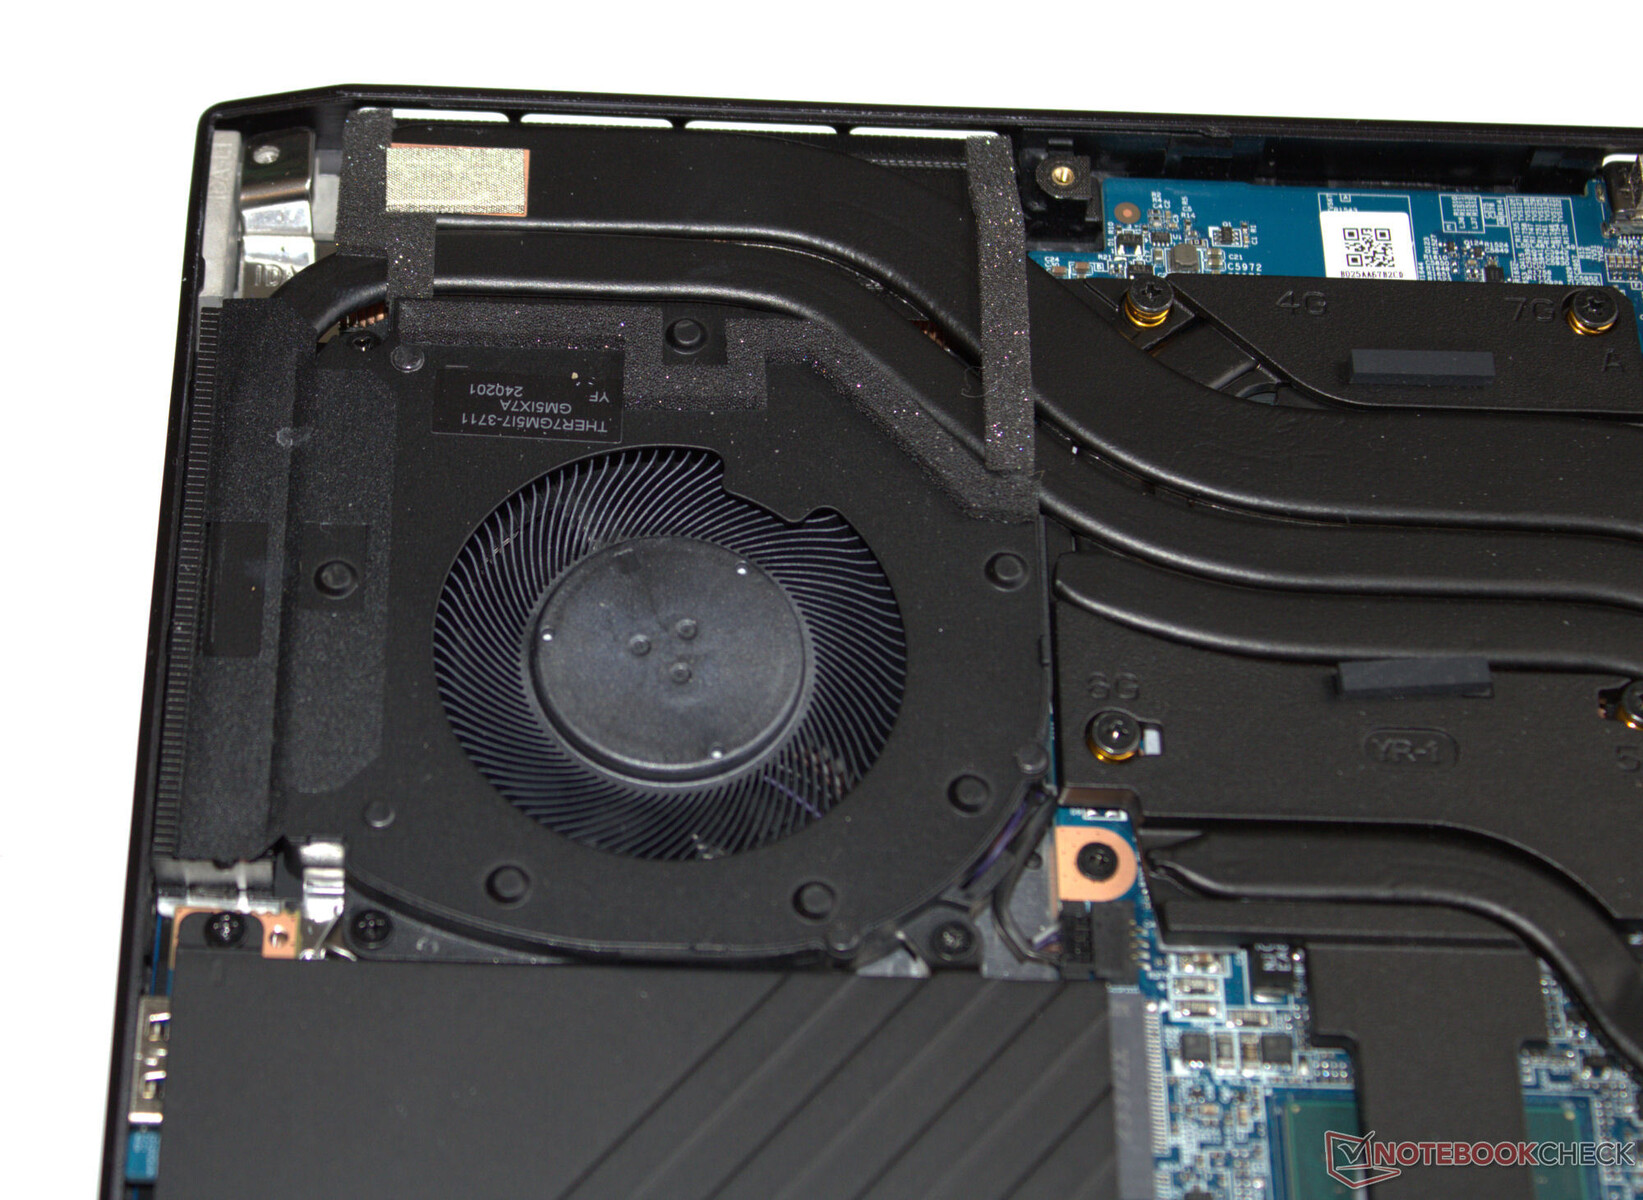
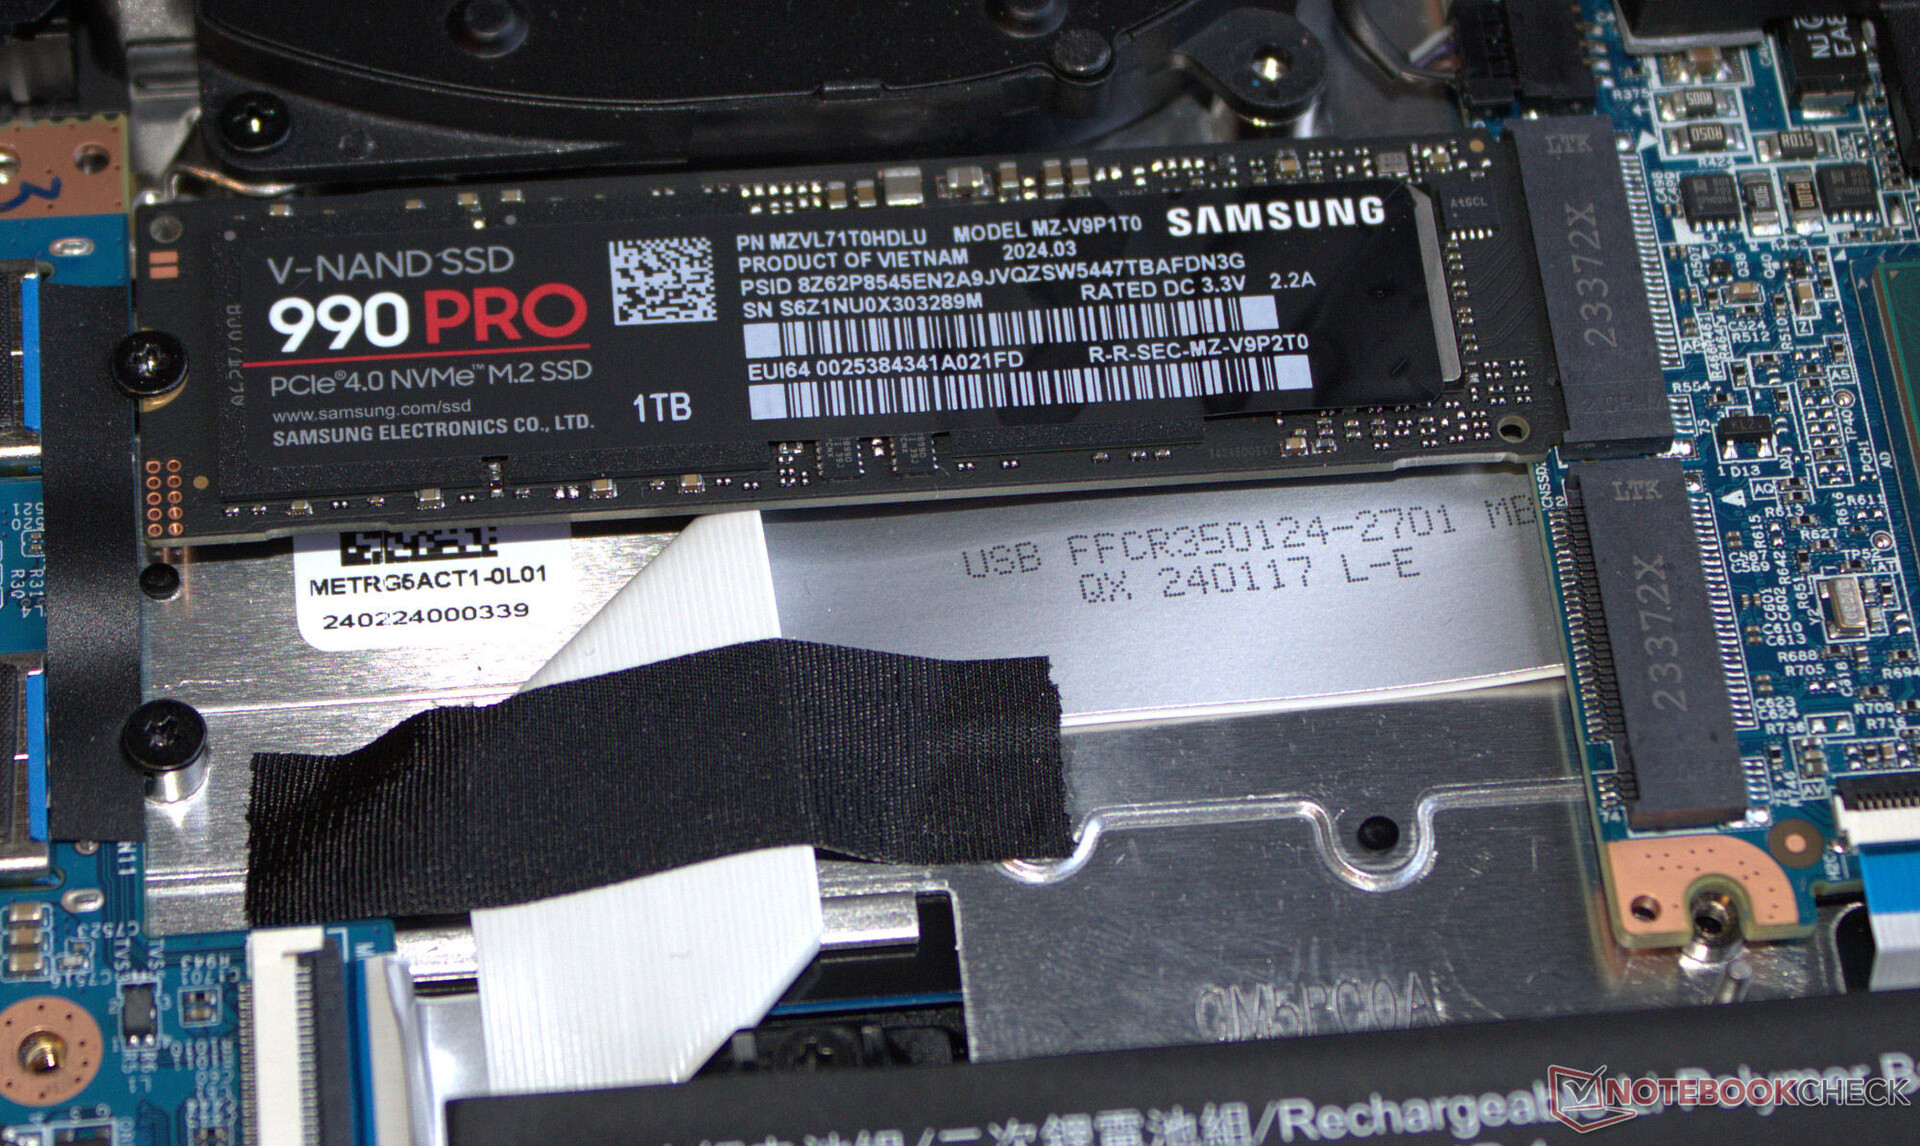
Maintenance
After removing all of the screws on the bottom of the device, the bottom case part can be taken off quite easily—you may just need a plectrum or a flat spatula to assist in this. Subsequently, you can access the RAM banks (both occupied), SSD (PCIe 4, M.2-2280), second SSD slot (PCIe 4, M.2-2280), WLAN module, fans, BIOS battery and the laptop's battery.


Warranty
The device is covered by a base warranty lasting for two years—this includes pickup service and a 6-month quick repair service (repair within 48 hours). You can extend this warranty to 36 months for a fee.
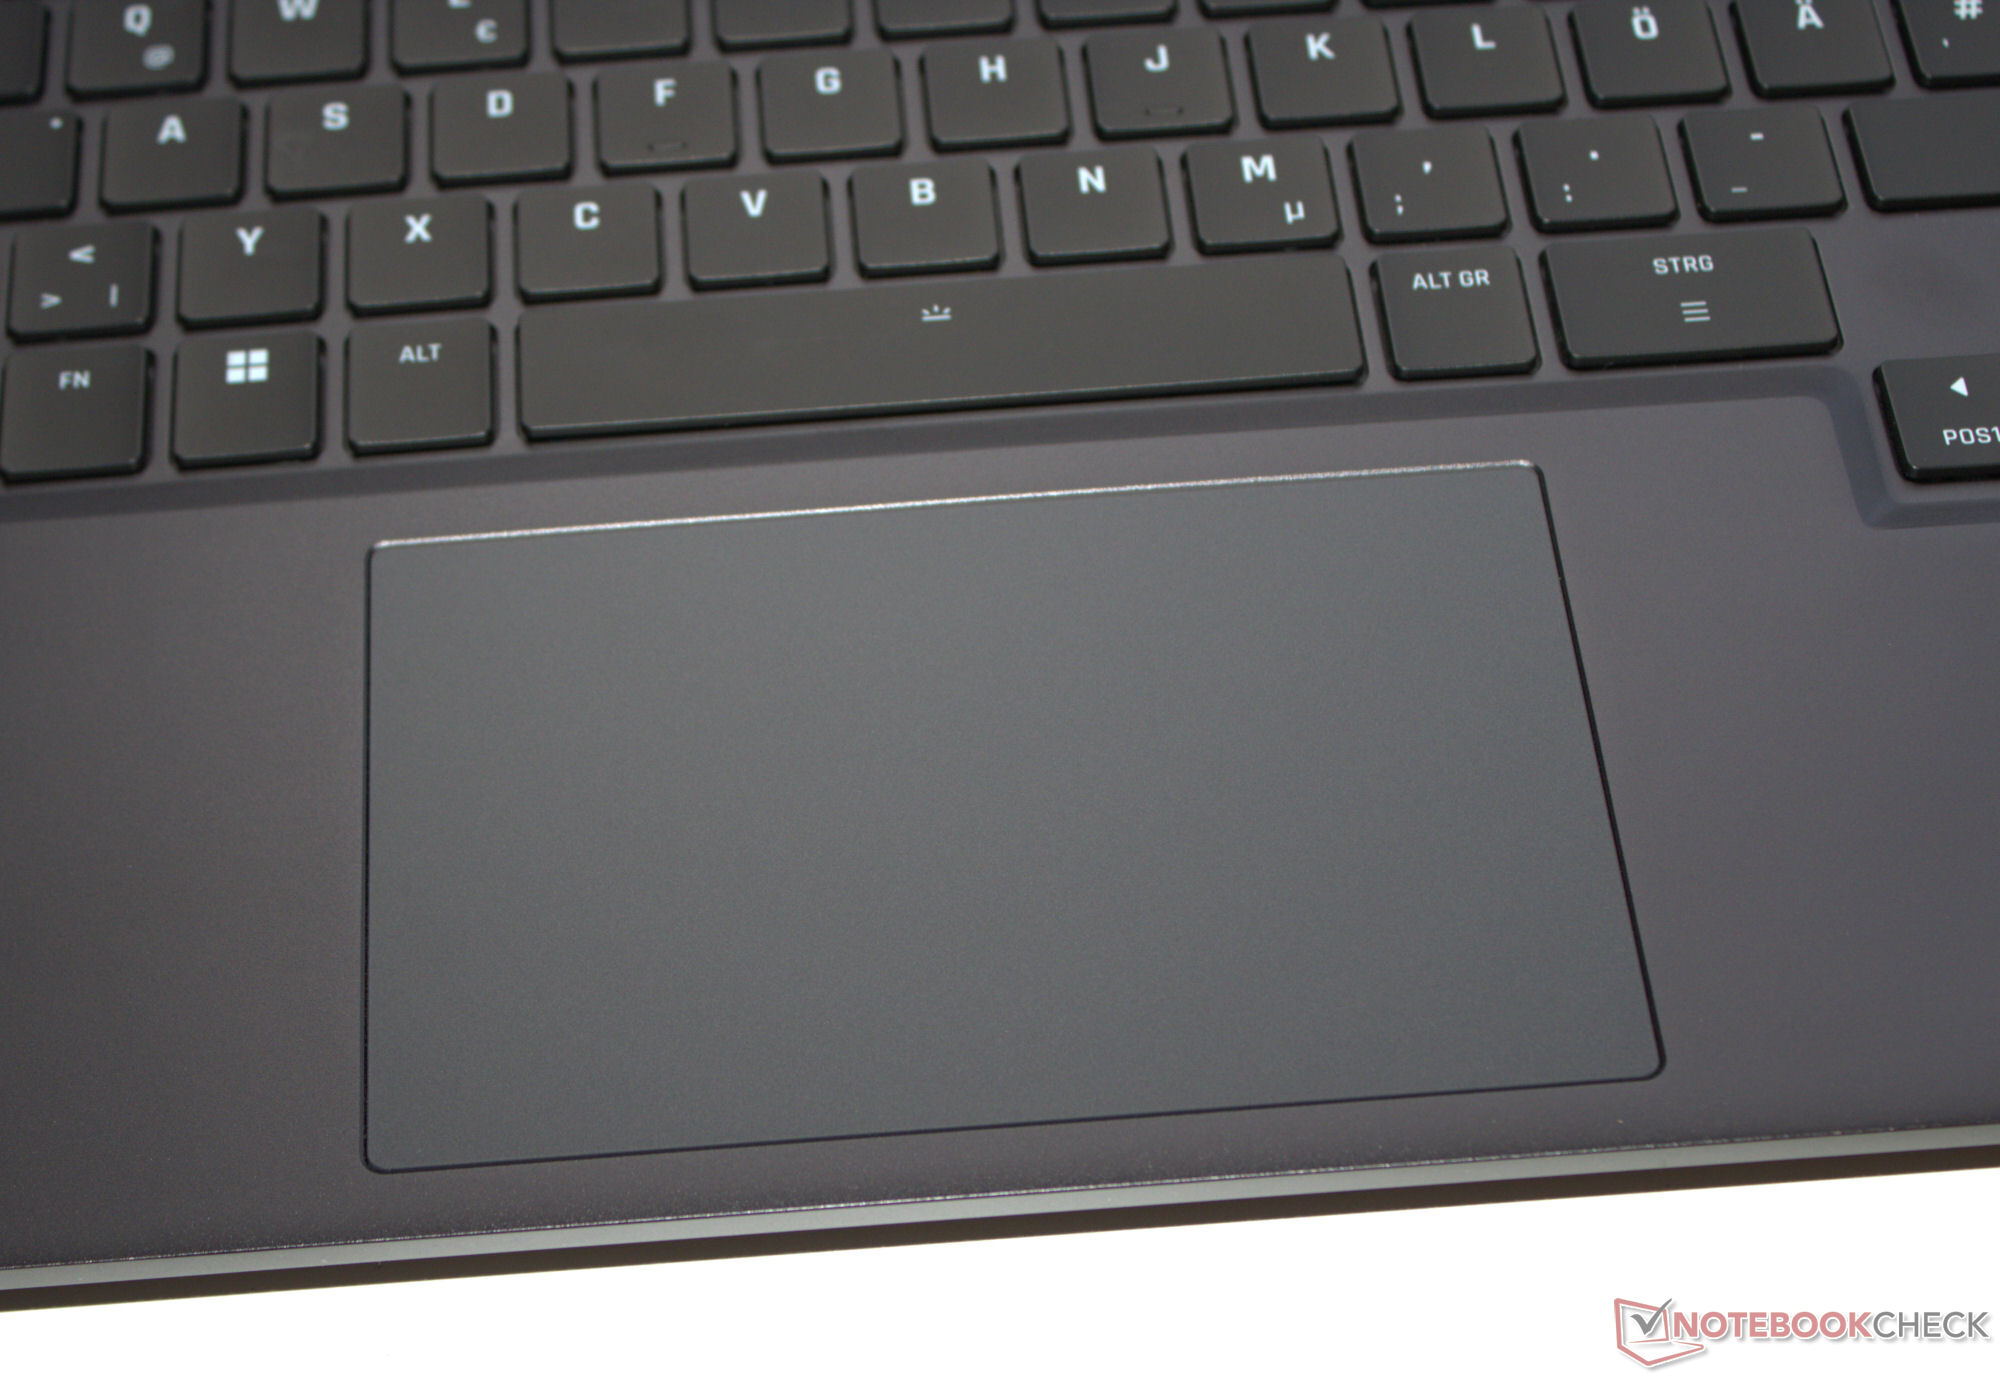
Input devices - Single-key RGB backlighting
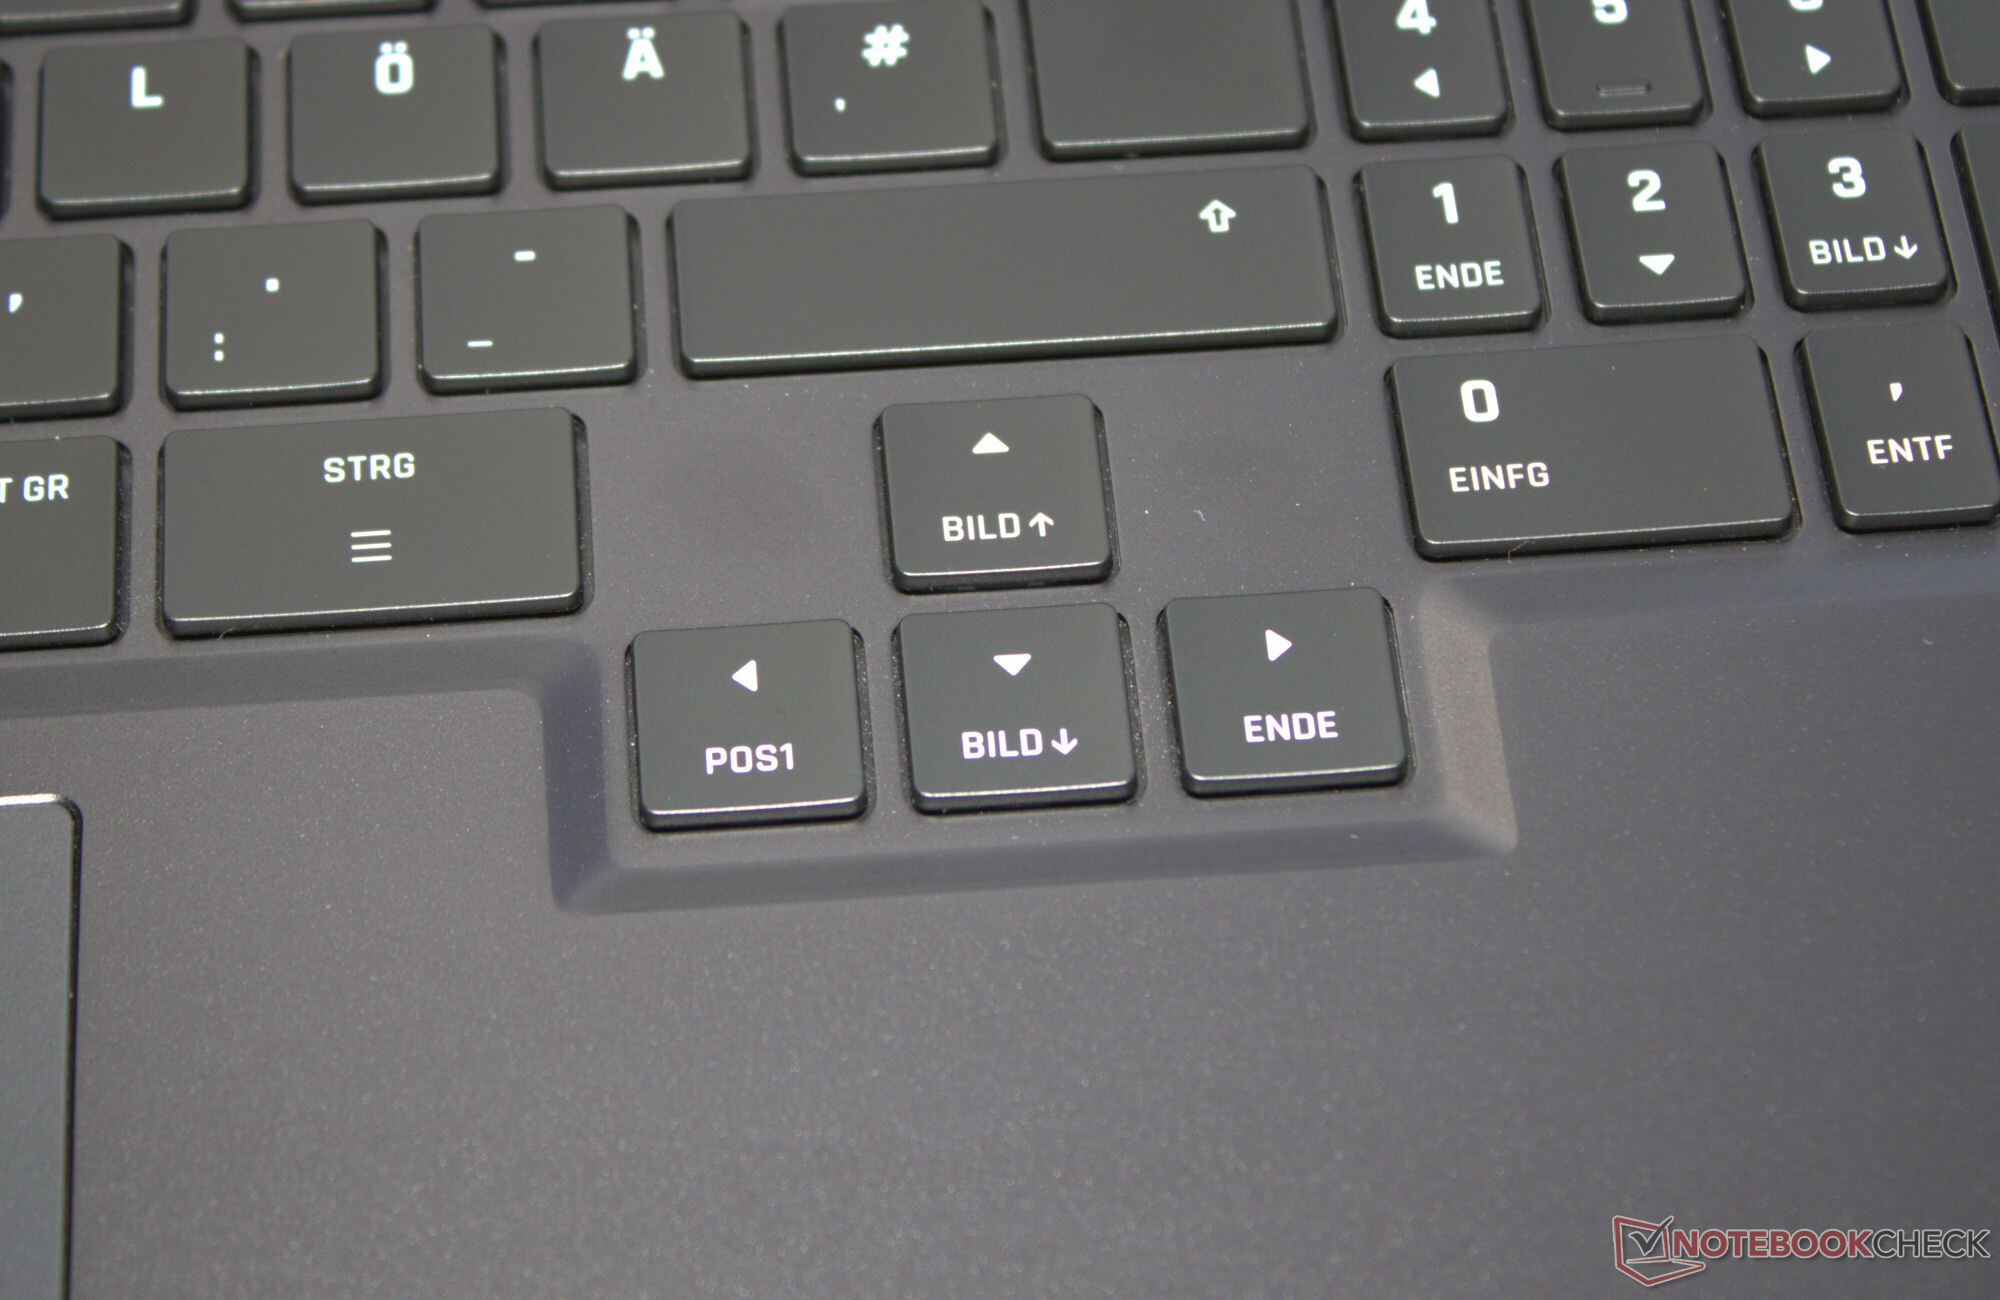
Keyboard
The chiclet keyboard's keys (four-level RGB backlighting) feature a medium lift and a clear pressure point. Their resistance could be a little more crisp—but this is a matter of taste. The keyboard yields minimally when typing, but didn't prove to be annoying during our test. Positive: The four arrow keys are not only fully sized but they are also separated from the other keys.
Touchpad
A multi-touch clickpad (approx. 12.3 x 7.8 cm) replaces the need for a mouse and its smooth surface makes it easy for fingers to glide over. It features a short lift and a clear pressure point.

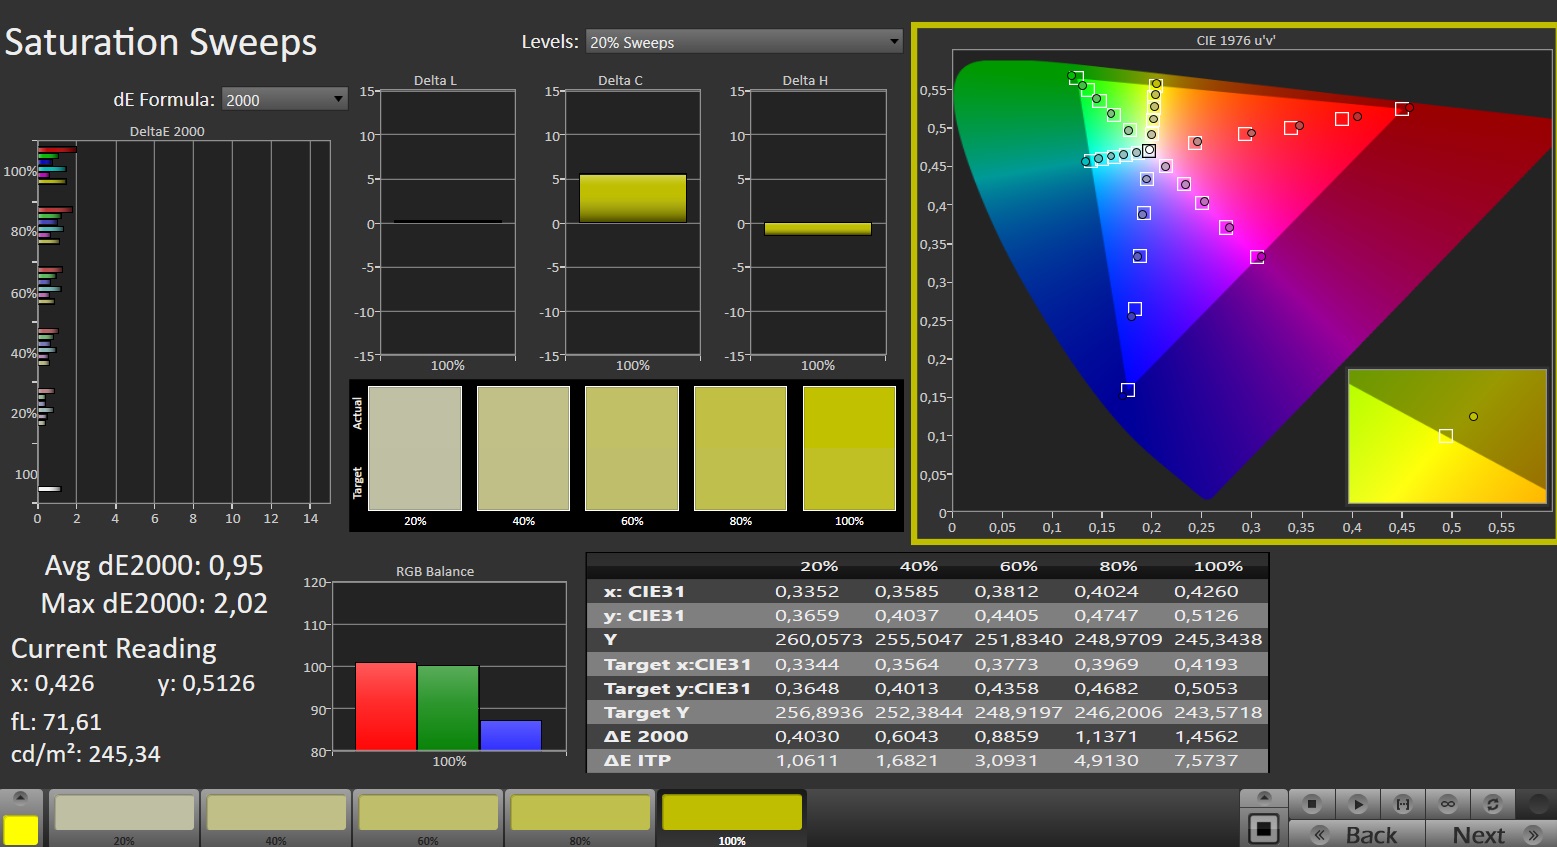
Display - Bright panel with sRGB coverage
Schenker has equipped the Fusion with a 15.3-inch screen (2,560 x 1,600 pixels) with an aspect ratio of 16:10. The matte 240-Hz panel boasts Adaptive Sync, no PWM flickering, short response times and great brightness. Alternative displays are not available.

| |||||||||||||||||||||||||
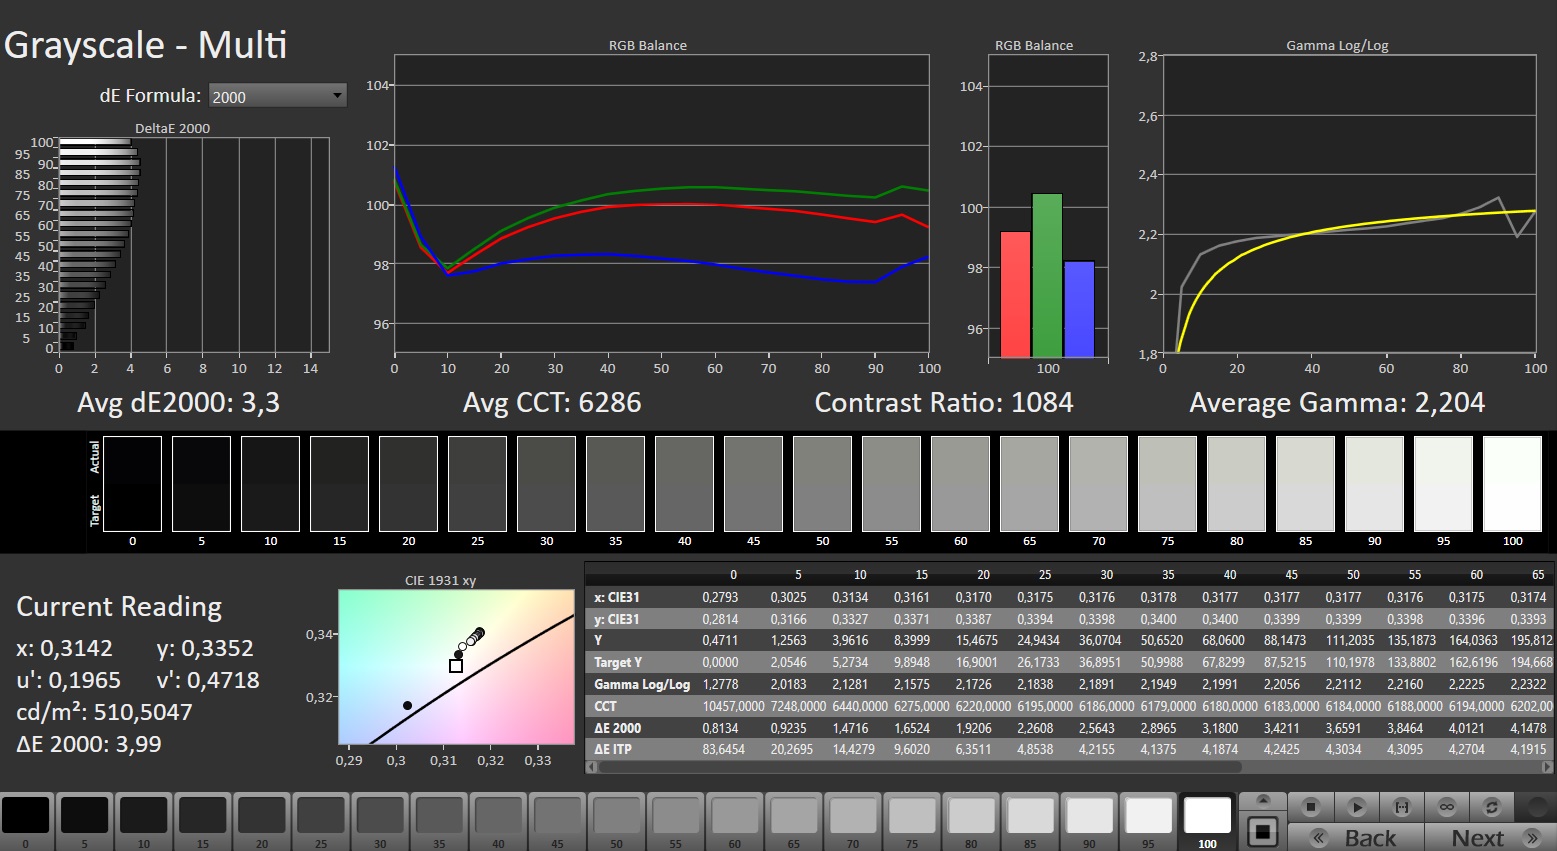
Brightness Distribution: 89 %
Center on Battery: 491 cd/m²
Contrast: 1045:1 (Black: 0.47 cd/m²)
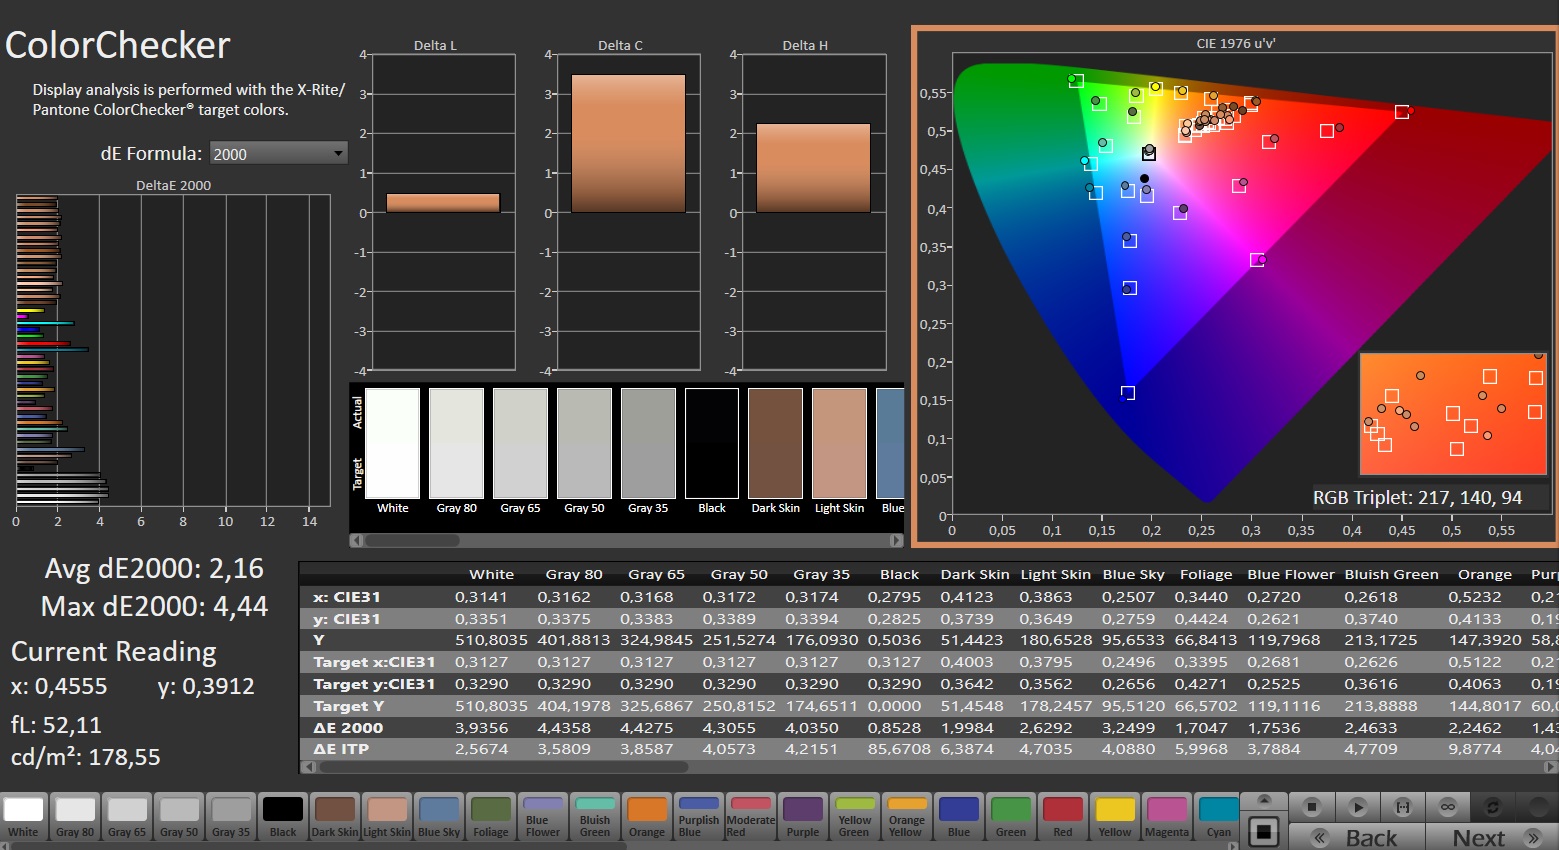
ΔE Color 2.16 | 0.5-29.43 Ø5, calibrated: 1.14
ΔE Greyscale 3.3 | 0.57-98 Ø5.3
75% AdobeRGB 1998 (Argyll 2.2.0 3D)
100% sRGB (Argyll 2.2.0 3D)
73.5% Display P3 (Argyll 2.2.0 3D)
Gamma: 2.204
| SCHENKER XMG Fusion 15 (Early 24) BOE NJ NE153QDM-NZ1, IPS, 2560x1600, 15.30 | Aorus 16X 2024 BOE CQ NE160QDM-NY1, IPS, 2560x1600, 16.00 | Alienware m16 R2 BOE NE16NYH, IPS, 2560x1600, 16.00 | HP Omen Transcend 16-u1095ng ATNA60DL02-0 (SDC41A4), OLED, 2560x1600, 16.00 | Lenovo Legion Pro 5 16IRX9 BOE NE160QDM-NYC, IPS, 2560x1600, 16.00 | |
|---|---|---|---|---|---|
| Display | -7% | -3% | 22% | -5% | |
| Display P3 Coverage | 73.5 | 67.2 -9% | 71 -3% | 99.8 36% | 69.3 -6% |
| sRGB Coverage | 100 | 96.7 -3% | 100 0% | 100 0% | 99.4 -1% |
| AdobeRGB 1998 Coverage | 75 | 69.3 -8% | 71.4 -5% | 97 29% | 70.1 -7% |
| Response Times | -27% | -41% | 96% | -105% | |
| Response Time Grey 50% / Grey 80% * | 5 ? | 7.5 ? -50% | 5.7 ? -14% | 0.2 ? 96% | 11.9 ? -138% |
| Response Time Black / White * | 5.2 ? | 5.4 ? -4% | 8.7 ? -67% | 0.2 ? 96% | 8.9 ? -71% |
| PWM Frequency | 120 ? | ||||
| Screen | -1% | 11% | 182% | 17% | |
| Brightness middle | 491 | 542 10% | 345.8 -30% | 390 -21% | 384 -22% |
| Brightness | 460 | 504 10% | 337 -27% | 392 -15% | 366 -20% |
| Brightness Distribution | 89 | 86 -3% | 87 -2% | 98 10% | 91 2% |
| Black Level * | 0.47 | 0.45 4% | 0.3 36% | 0.02 96% | 0.35 26% |
| Contrast | 1045 | 1204 15% | 1153 10% | 19500 1766% | 1097 5% |
| Colorchecker dE 2000 * | 2.16 | 2.73 -26% | 1.99 8% | 1.94 10% | 0.97 55% |
| Colorchecker dE 2000 max. * | 4.44 | 5.29 -19% | 3.52 21% | 4.26 4% | 3.57 20% |
| Colorchecker dE 2000 calibrated * | 1.14 | 1.32 -16% | 0.62 46% | 4.21 -269% | 0.77 32% |
| Greyscale dE 2000 * | 3.3 | 2.9 12% | 2.1 36% | 1.5 55% | 1.5 55% |
| Gamma | 2.204 100% | 2.192 100% | 2.32 95% | 2.221 99% | 2.24 98% |
| CCT | 6286 103% | 6173 105% | 6369 102% | 6395 102% | 6709 97% |
| Total Average (Program / Settings) | -12% /
-6% | -11% /
1% | 100% /
135% | -31% /
-5% |
* ... smaller is better
The display already showed good color depiction straight out of the box: With a deviation of around 2.2, the target value (DeltaE < 3) has been reached. Calibrating the display lowers its deviation to 1.14 and results in more balanced gray tones. The panel is able to cover the sRGB color space completely but not the color spaces AdobeRGB or DCI P3. This isn't any different on most of its competitors' screens.


Display Response Times
| ↔ Response Time Black to White | ||
|---|---|---|
| 5.2 ms ... rise ↗ and fall ↘ combined | ↗ 1.5 ms rise | 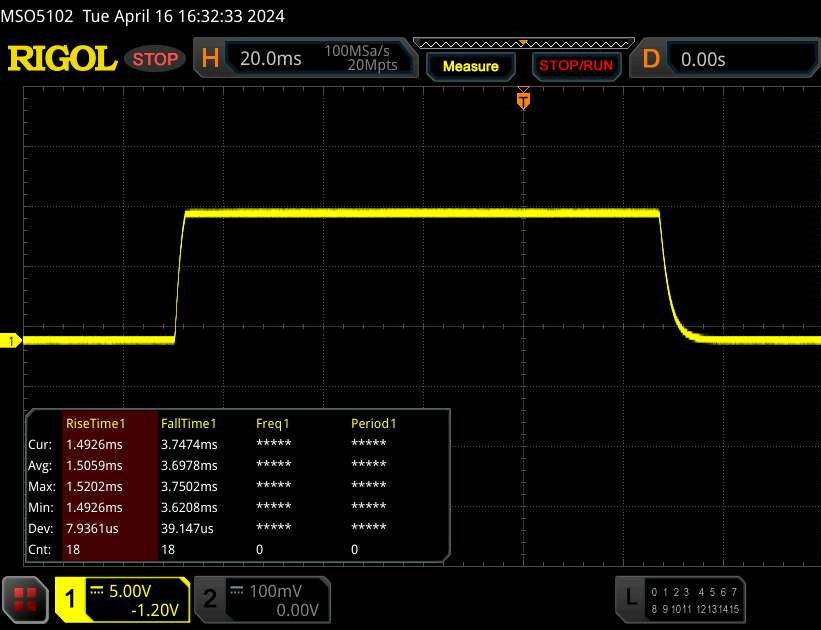 |
| ↘ 3.7 ms fall | ||
| The screen shows very fast response rates in our tests and should be very well suited for fast-paced gaming. In comparison, all tested devices range from 0.1 (minimum) to 240 (maximum) ms. » 12 % of all devices are better. This means that the measured response time is better than the average of all tested devices (21.4 ms). | ||
| ↔ Response Time 50% Grey to 80% Grey | ||
| 5 ms ... rise ↗ and fall ↘ combined | ↗ 2.3 ms rise |  |
| ↘ 2.7 ms fall | ||
| The screen shows very fast response rates in our tests and should be very well suited for fast-paced gaming. In comparison, all tested devices range from 0.2 (minimum) to 636 (maximum) ms. » 12 % of all devices are better. This means that the measured response time is better than the average of all tested devices (33.7 ms). | ||
Screen Flickering / PWM (Pulse-Width Modulation)
| Screen flickering / PWM not detected |  | ||
In comparison: 53 % of all tested devices do not use PWM to dim the display. If PWM was detected, an average of 17803 (minimum: 5 - maximum: 3846000) Hz was measured. | |||
The device's viewing-angle stable IPS panel remains legible from every angle. Outside, you can read from the display as long as the sun isn't shining too brightly.


Performance - Raptor Lake and Ada Lovelace power the laptop
The powerful, compact XMG Fusion 15 (Early 24) is directed toward gamers and creators. Raptor Lake and Ada Lovelace deliver the necessary performance. The laptop can be individually configured via the Schenker online shop. The present variant costs about US$2,500. Cheaper models start from approx. US$1,700.


Testing conditions
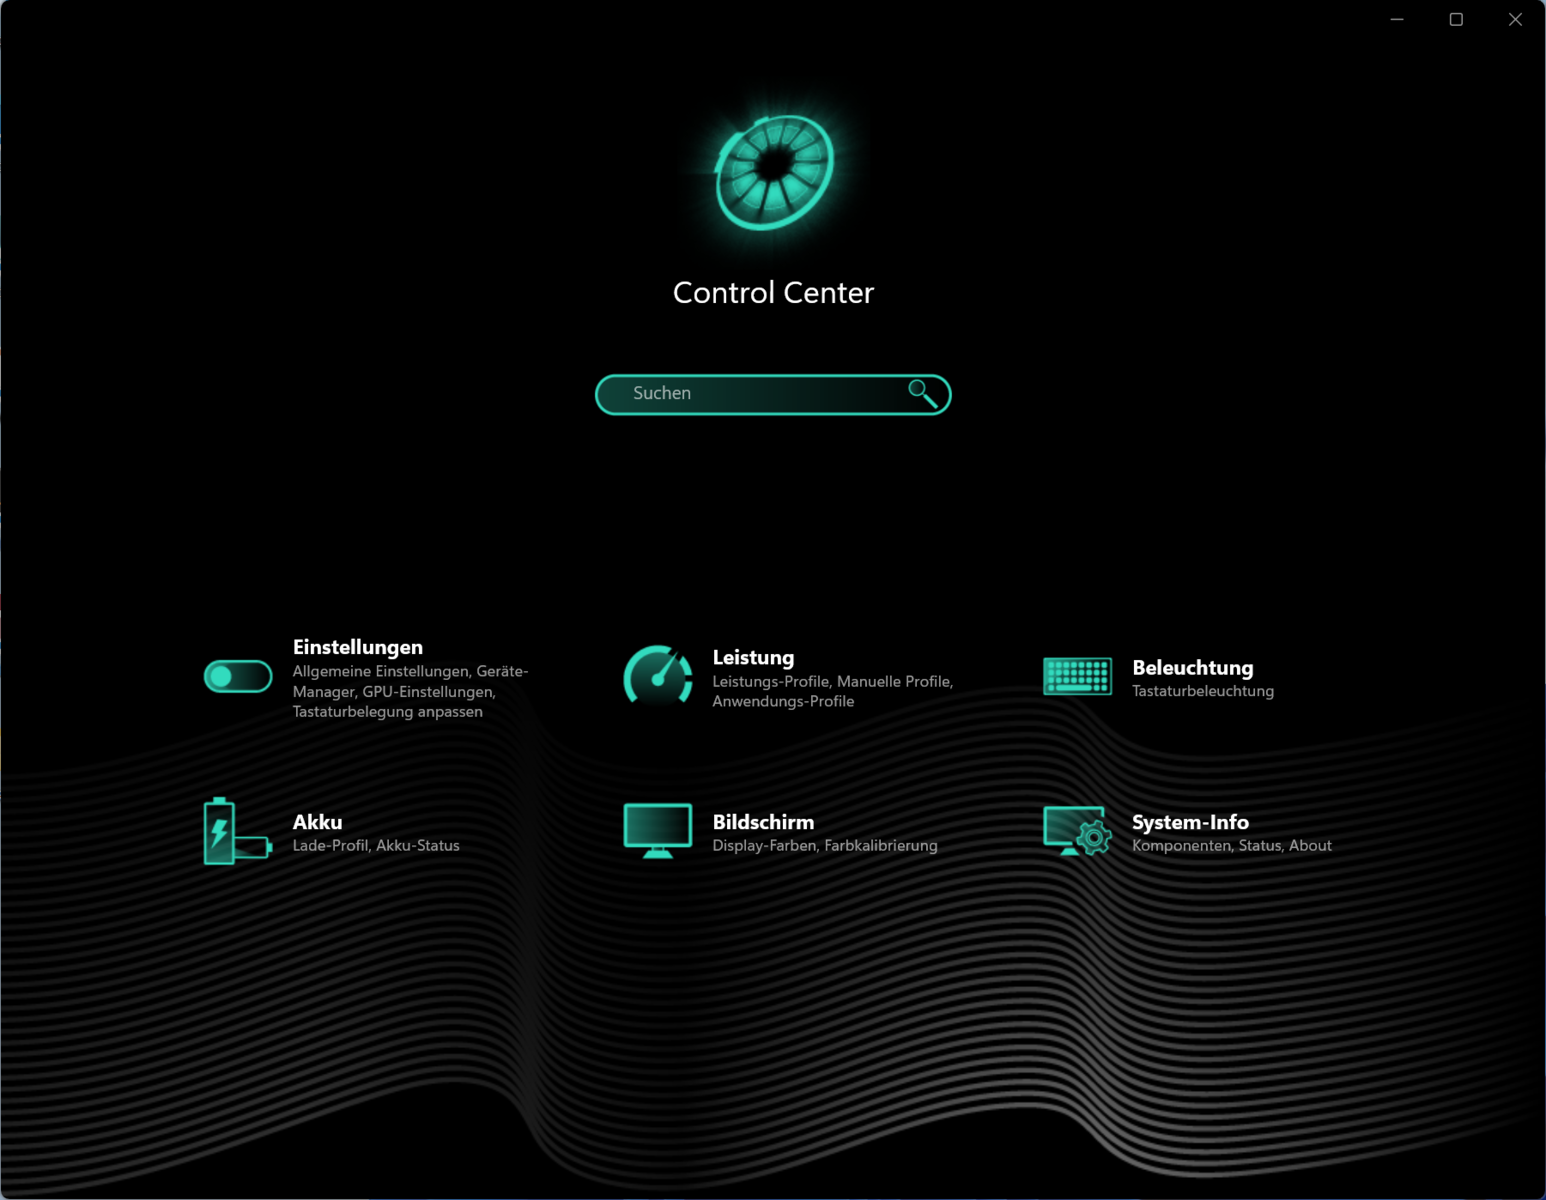
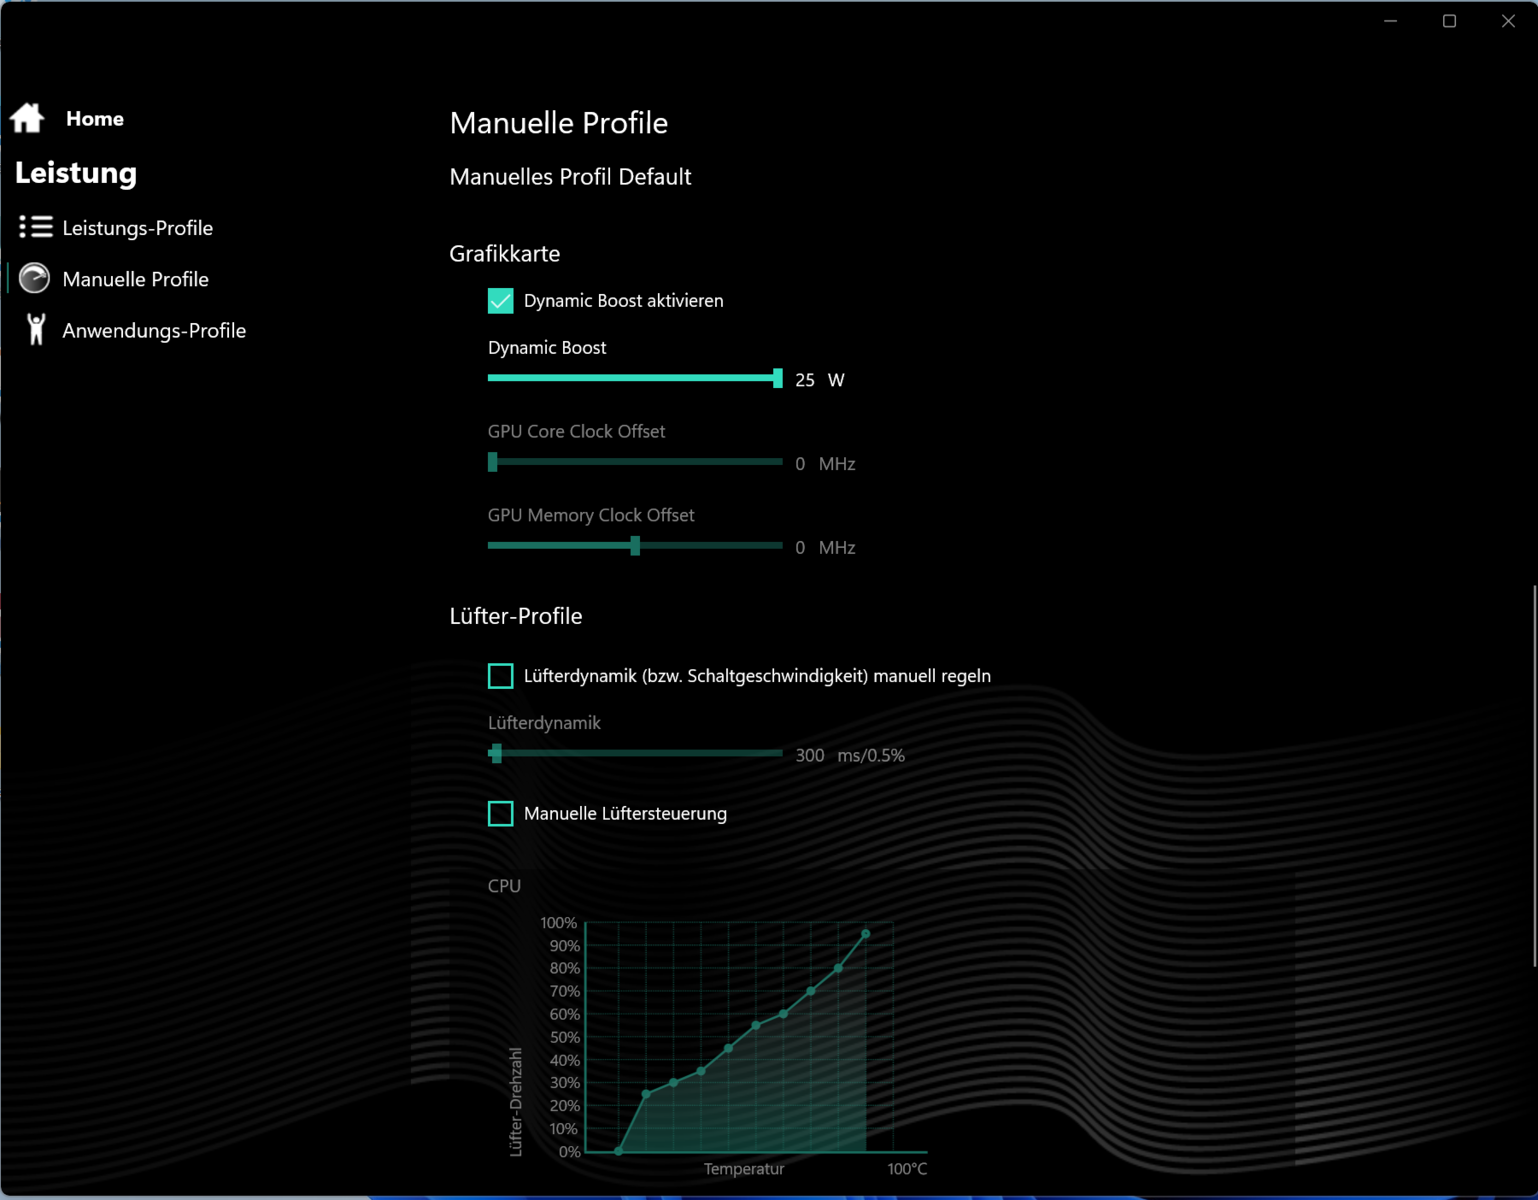
The laptop offers three manufacturer-specific performance modes (see table), which can be quickly switched between using a separate button (next to the power button). Individual profiles can be created using the pre-installed Control Center software. For example, the power limits of the CPU, the TGP of the GPU and/or the device's upper temperature limits can be adjusted.
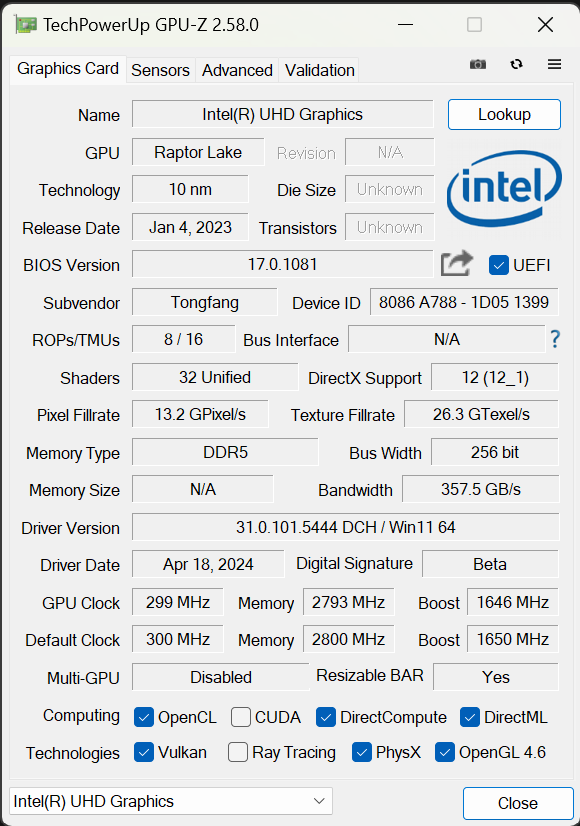
The modes Enthusiast (benchmarks) and Balanced (battery tests) were used during our test. The GPU mode was set to Hybrid (= Optimus).
| Enthusiast | Overboost | Balanced | |
|---|---|---|---|
| Power Limit 1 (HWInfo) | 160 watts | 160 watts | 160 watts |
| Power Limit 2 (HWInfo) | 170 watts | 170 watts | 170 watts |
| Noise (Witcher 3) | 51 dB(A) | 53 dB(A) | 39 dB(A) |
| Performance (Witcher 3) | 128 fps | 130 fps | 14-128 fps |


Undervolting
The processor can be operated with lower voltages than intended by the manufacturer (undervolting). As a result, the device's power consumption and heat emissions are reduced. But be careful: Lowering the voltage too much can lead to an unstable or faulty system. In this case, the changes must be reversed—undervolting must be undertaken at your own risk.


Processor
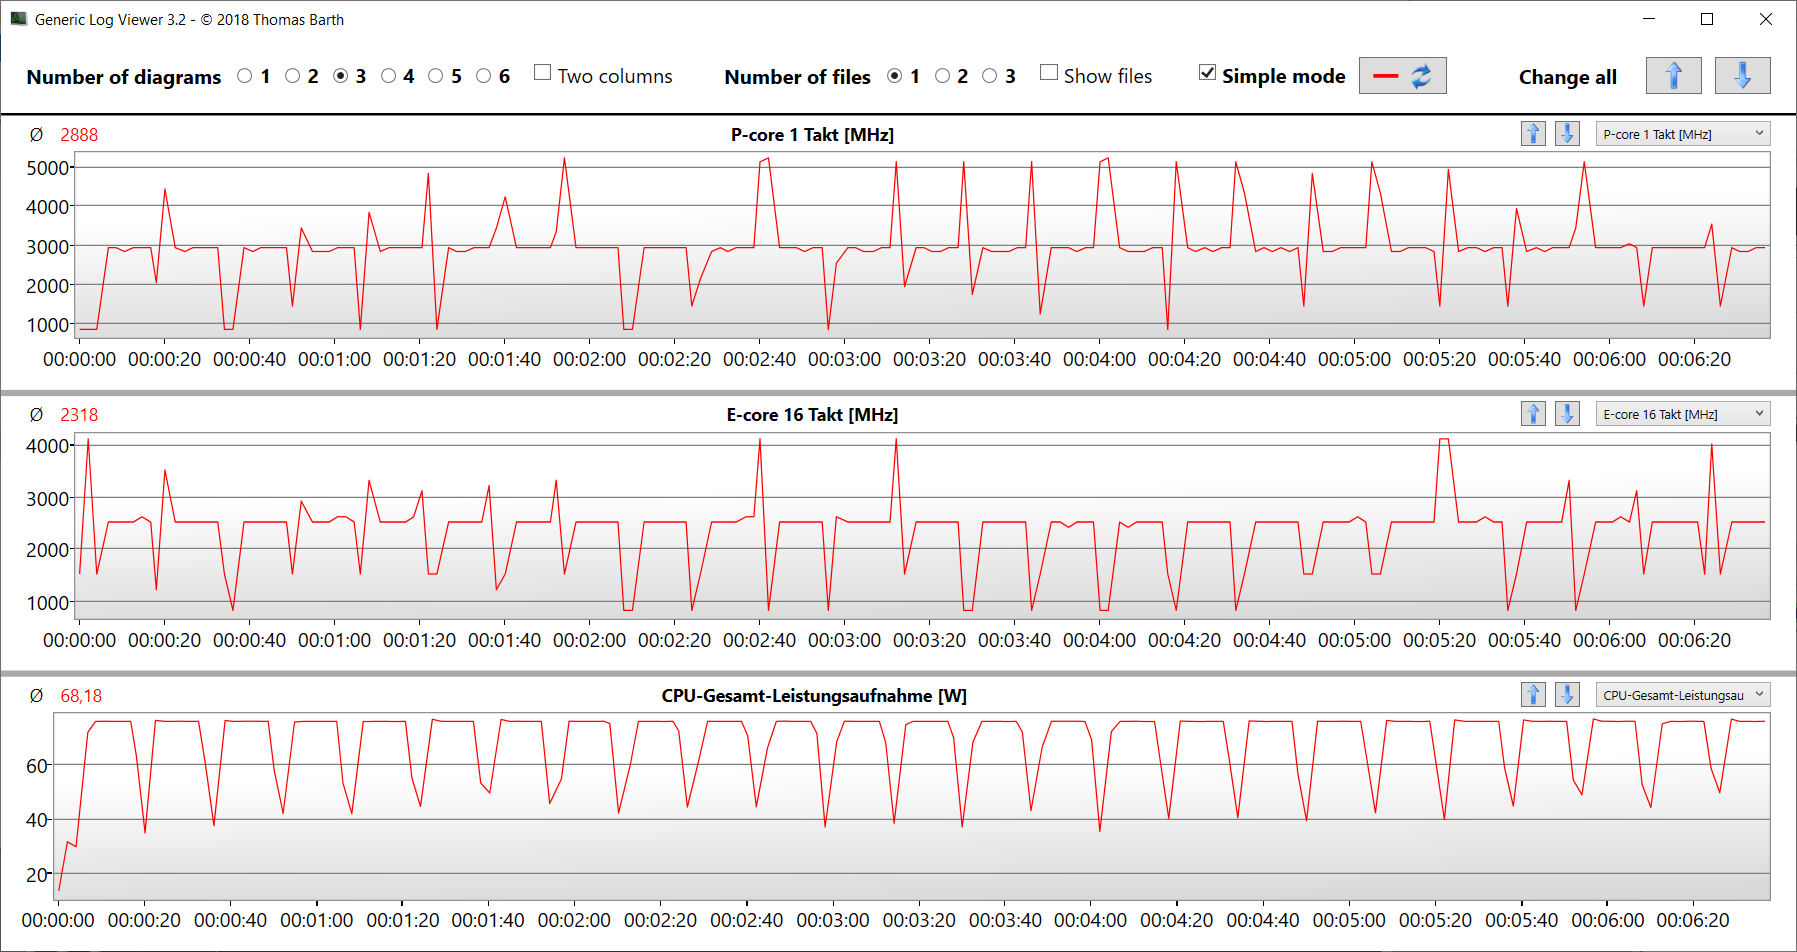
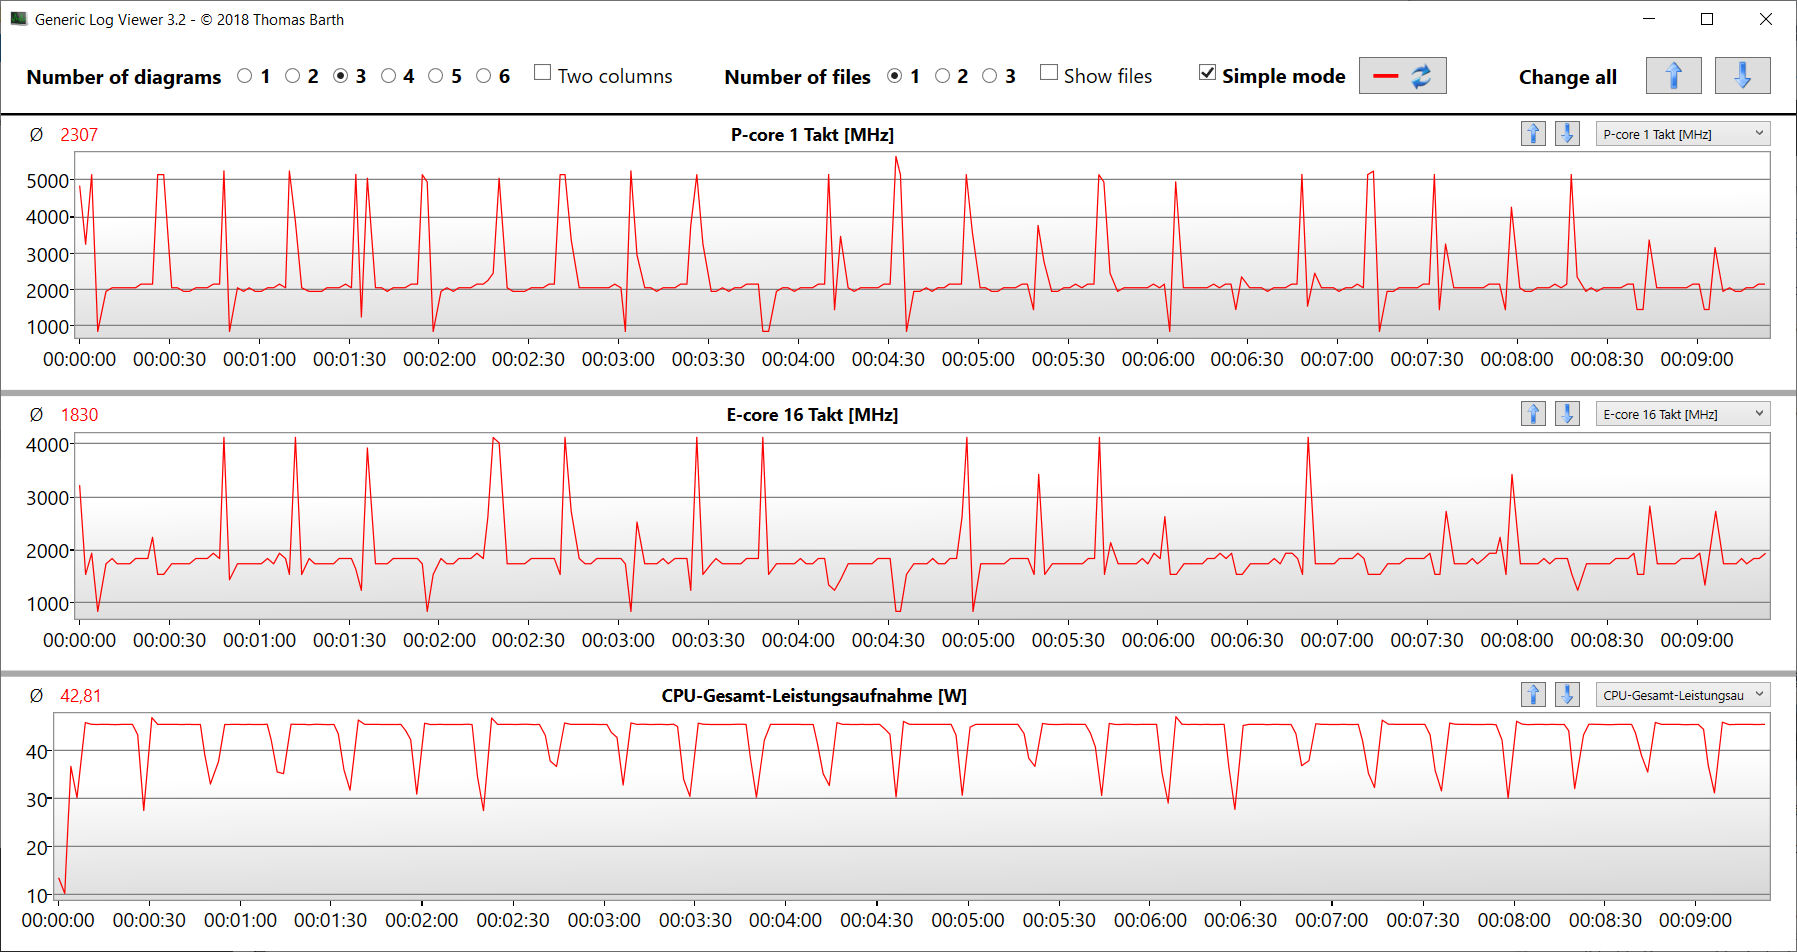
The Core i9-14900HX (Raptor Lake)'s 24 CPU cores (8P + 16E = 32 threads) achieve maximum clock rates of 5.8 GHz (P) and 4.1 GHz (E). Permanent multi-thread load (CB15 Loop) results in stable clock rates—the level depends on the selected power mode.
Enthusiast delivers benchmark values below the CPU average, whereas Overboost raises them significantly above the average—this primarily applies to the laptop's multi-thread performance. Its single-thread performance ranges on a high and very similar level when using all three profiles.
More information about the Core i9 can be found in our analysis article.


Cinebench R15 Multi continuous test

| CPU Performance Rating - Percent | |
| SCHENKER XMG Fusion 15 (Early 24) | |
| Lenovo Legion Pro 5 16IRX9 | |
| Average Intel Core i9-14900HX | |
| Aorus 16X 2024 | |
| SCHENKER XMG Fusion 15 (Early 24) | |
| HP Omen Transcend 16-u1095ng | |
| Average of class Gaming | |
| Alienware m16 R2 -1! | |
| Cinebench R23 | |
| Multi Core | |
| SCHENKER XMG Fusion 15 (Early 24) (Overboost) | |
| Lenovo Legion Pro 5 16IRX9 | |
| Average Intel Core i9-14900HX (20702 - 32996, n=23) | |
| Aorus 16X 2024 | |
| SCHENKER XMG Fusion 15 (Early 24) | |
| HP Omen Transcend 16-u1095ng | |
| Average of class Gaming (2435 - 34613, n=223, last 2 years) | |
| Alienware m16 R2 | |
| Single Core | |
| SCHENKER XMG Fusion 15 (Early 24) (Overboost) | |
| Aorus 16X 2024 | |
| HP Omen Transcend 16-u1095ng | |
| Average Intel Core i9-14900HX (2043 - 2235, n=23) | |
| Lenovo Legion Pro 5 16IRX9 | |
| SCHENKER XMG Fusion 15 (Early 24) | |
| Average of class Gaming (527 - 2235, n=221, last 2 years) | |
| Alienware m16 R2 | |
| Cinebench R20 | |
| CPU (Multi Core) | |
| SCHENKER XMG Fusion 15 (Early 24) (Overboost) | |
| Lenovo Legion Pro 5 16IRX9 | |
| Average Intel Core i9-14900HX (8427 - 12419, n=23) | |
| Aorus 16X 2024 | |
| SCHENKER XMG Fusion 15 (Early 24) | |
| HP Omen Transcend 16-u1095ng | |
| Average of class Gaming (930 - 13769, n=221, last 2 years) | |
| Alienware m16 R2 | |
| CPU (Single Core) | |
| SCHENKER XMG Fusion 15 (Early 24) (Overboost) | |
| Aorus 16X 2024 | |
| HP Omen Transcend 16-u1095ng | |
| Average Intel Core i9-14900HX (779 - 859, n=23) | |
| Lenovo Legion Pro 5 16IRX9 | |
| SCHENKER XMG Fusion 15 (Early 24) | |
| Average of class Gaming (169 - 855, n=221, last 2 years) | |
| Alienware m16 R2 | |
| Cinebench R15 | |
| CPU Multi 64Bit | |
| Lenovo Legion Pro 5 16IRX9 | |
| SCHENKER XMG Fusion 15 (Early 24) (Overboost) | |
| Average Intel Core i9-14900HX (3263 - 4875, n=23) | |
| Aorus 16X 2024 | |
| HP Omen Transcend 16-u1095ng | |
| SCHENKER XMG Fusion 15 (Early 24) | |
| Average of class Gaming (400 - 5663, n=226, last 2 years) | |
| Alienware m16 R2 | |
| CPU Single 64Bit | |
| Aorus 16X 2024 | |
| SCHENKER XMG Fusion 15 (Early 24) (Overboost) | |
| Average Intel Core i9-14900HX (287 - 320, n=23) | |
| Lenovo Legion Pro 5 16IRX9 | |
| HP Omen Transcend 16-u1095ng | |
| SCHENKER XMG Fusion 15 (Early 24) | |
| Average of class Gaming (79.2 - 318, n=225, last 2 years) | |
| Alienware m16 R2 | |
| Blender - v2.79 BMW27 CPU | |
| Average of class Gaming (87 - 1259, n=218, last 2 years) | |
| HP Omen Transcend 16-u1095ng | |
| SCHENKER XMG Fusion 15 (Early 24) | |
| Aorus 16X 2024 | |
| Average Intel Core i9-14900HX (102 - 164, n=23) | |
| Lenovo Legion Pro 5 16IRX9 | |
| SCHENKER XMG Fusion 15 (Early 24) (Overboost) | |
| 7-Zip 18.03 | |
| 7z b 4 | |
| SCHENKER XMG Fusion 15 (Early 24) (Overboost) | |
| Lenovo Legion Pro 5 16IRX9 | |
| Average Intel Core i9-14900HX (87555 - 127108, n=23) | |
| Aorus 16X 2024 | |
| SCHENKER XMG Fusion 15 (Early 24) | |
| HP Omen Transcend 16-u1095ng | |
| Average of class Gaming (11386 - 140932, n=220, last 2 years) | |
| Alienware m16 R2 | |
| 7z b 4 -mmt1 | |
| SCHENKER XMG Fusion 15 (Early 24) | |
| SCHENKER XMG Fusion 15 (Early 24) (Overboost) | |
| Aorus 16X 2024 | |
| HP Omen Transcend 16-u1095ng | |
| Average Intel Core i9-14900HX (6206 - 7508, n=23) | |
| Lenovo Legion Pro 5 16IRX9 | |
| Average of class Gaming (2685 - 7581, n=220, last 2 years) | |
| Alienware m16 R2 | |
| Geekbench 6.2 | |
| Multi-Core | |
| Lenovo Legion Pro 5 16IRX9 (6.2.1) | |
| SCHENKER XMG Fusion 15 (Early 24) (6.2.1, Overboost) | |
| Average Intel Core i9-14900HX (15849 - 18643, n=23) | |
| Aorus 16X 2024 (6.2.1) | |
| SCHENKER XMG Fusion 15 (Early 24) (6.2.1) | |
| HP Omen Transcend 16-u1095ng (6.2.1) | |
| Average of class Gaming (5340 - 18590, n=80, last 2 years) | |
| Alienware m16 R2 (6.2.1) | |
| Single-Core | |
| SCHENKER XMG Fusion 15 (Early 24) (6.2.1) | |
| Aorus 16X 2024 (6.2.1) | |
| SCHENKER XMG Fusion 15 (Early 24) (6.2.1, Overboost) | |
| Average Intel Core i9-14900HX (2800 - 3095, n=23) | |
| Lenovo Legion Pro 5 16IRX9 (6.2.1) | |
| HP Omen Transcend 16-u1095ng (6.2.1) | |
| Average of class Gaming (1599 - 3095, n=80, last 2 years) | |
| Alienware m16 R2 (6.2.1) | |
| Geekbench 5.5 | |
| Multi-Core | |
| Lenovo Legion Pro 5 16IRX9 | |
| SCHENKER XMG Fusion 15 (Early 24) (Overboost) | |
| Aorus 16X 2024 | |
| Average Intel Core i9-14900HX (8618 - 21606, n=23) | |
| HP Omen Transcend 16-u1095ng | |
| SCHENKER XMG Fusion 15 (Early 24) | |
| Average of class Gaming (1946 - 22200, n=225, last 2 years) | |
| Alienware m16 R2 | |
| Single-Core | |
| Aorus 16X 2024 | |
| SCHENKER XMG Fusion 15 (Early 24) (Overboost) | |
| SCHENKER XMG Fusion 15 (Early 24) | |
| Average Intel Core i9-14900HX (1669 - 2210, n=23) | |
| HP Omen Transcend 16-u1095ng | |
| Lenovo Legion Pro 5 16IRX9 | |
| Average of class Gaming (158 - 2210, n=225, last 2 years) | |
| Alienware m16 R2 | |
| HWBOT x265 Benchmark v2.2 - 4k Preset | |
| SCHENKER XMG Fusion 15 (Early 24) (Overboost) | |
| Lenovo Legion Pro 5 16IRX9 | |
| Average Intel Core i9-14900HX (22.7 - 34.4, n=23) | |
| Aorus 16X 2024 | |
| SCHENKER XMG Fusion 15 (Early 24) | |
| HP Omen Transcend 16-u1095ng | |
| Average of class Gaming (3 - 37.6, n=221, last 2 years) | |
| Alienware m16 R2 | |
| LibreOffice - 20 Documents To PDF | |
| HP Omen Transcend 16-u1095ng (6.3.4.2) | |
| Alienware m16 R2 (6.3.4.2) | |
| Average of class Gaming (32.8 - 332, n=217, last 2 years) | |
| Average Intel Core i9-14900HX (33.9 - 85.1, n=23) | |
| Lenovo Legion Pro 5 16IRX9 (6.3.4.2) | |
| SCHENKER XMG Fusion 15 (Early 24) (6.3.4.2) | |
| Aorus 16X 2024 (6.3.4.2) | |
| SCHENKER XMG Fusion 15 (Early 24) (6.3.4.2, Overboost) | |
| R Benchmark 2.5 - Overall mean | |
| Alienware m16 R2 | |
| Average of class Gaming (0.3609 - 4.47, n=220, last 2 years) | |
| HP Omen Transcend 16-u1095ng | |
| Lenovo Legion Pro 5 16IRX9 | |
| Average Intel Core i9-14900HX (0.3609 - 0.4225, n=23) | |
| Aorus 16X 2024 | |
| SCHENKER XMG Fusion 15 (Early 24) (Overboost) | |
| SCHENKER XMG Fusion 15 (Early 24) | |
* ... smaller is better
AIDA64: FP32 Ray-Trace | FPU Julia | CPU SHA3 | CPU Queen | FPU SinJulia | FPU Mandel | CPU AES | CPU ZLib | FP64 Ray-Trace | CPU PhotoWorxx
| Performance Rating | |
| SCHENKER XMG Fusion 15 (Early 24) | |
| Lenovo Legion Pro 5 16IRX9 | |
| Average Intel Core i9-14900HX | |
| Aorus 16X 2024 | |
| SCHENKER XMG Fusion 15 (Early 24) | |
| Average of class Gaming | |
| HP Omen Transcend 16-u1095ng | |
| Alienware m16 R2 | |
| AIDA64 / FP32 Ray-Trace | |
| SCHENKER XMG Fusion 15 (Early 24) (v6.92.6600, Overboost) | |
| Average Intel Core i9-14900HX (17244 - 29351, n=22) | |
| Lenovo Legion Pro 5 16IRX9 (v6.92.6600) | |
| Aorus 16X 2024 (v6.92.6600) | |
| SCHENKER XMG Fusion 15 (Early 24) (v6.92.6600) | |
| Average of class Gaming (3069 - 60169, n=216, last 2 years) | |
| Alienware m16 R2 (v6.92.6600) | |
| HP Omen Transcend 16-u1095ng (v6.92.6600) | |
| AIDA64 / FPU Julia | |
| SCHENKER XMG Fusion 15 (Early 24) (v6.92.6600, Overboost) | |
| Lenovo Legion Pro 5 16IRX9 (v6.92.6600) | |
| Average Intel Core i9-14900HX (88537 - 148888, n=22) | |
| Aorus 16X 2024 (v6.92.6600) | |
| SCHENKER XMG Fusion 15 (Early 24) (v6.92.6600) | |
| Average of class Gaming (18567 - 252486, n=216, last 2 years) | |
| Alienware m16 R2 (v6.92.6600) | |
| HP Omen Transcend 16-u1095ng (v6.92.6600) | |
| AIDA64 / CPU SHA3 | |
| SCHENKER XMG Fusion 15 (Early 24) (v6.92.6600, Overboost) | |
| Lenovo Legion Pro 5 16IRX9 (v6.92.6600) | |
| Average Intel Core i9-14900HX (4267 - 7229, n=22) | |
| Aorus 16X 2024 (v6.92.6600) | |
| SCHENKER XMG Fusion 15 (Early 24) (v6.92.6600) | |
| Average of class Gaming (629 - 10389, n=216, last 2 years) | |
| HP Omen Transcend 16-u1095ng (v6.92.6600) | |
| Alienware m16 R2 (v6.92.6600) | |
| AIDA64 / CPU Queen | |
| Lenovo Legion Pro 5 16IRX9 (v6.92.6600) | |
| SCHENKER XMG Fusion 15 (Early 24) (v6.92.6600, Overboost) | |
| Aorus 16X 2024 (v6.92.6600) | |
| Average Intel Core i9-14900HX (118405 - 148773, n=22) | |
| SCHENKER XMG Fusion 15 (Early 24) (v6.92.6600) | |
| HP Omen Transcend 16-u1095ng (v6.92.6600) | |
| Average of class Gaming (15371 - 200651, n=216, last 2 years) | |
| Alienware m16 R2 (v6.92.6600) | |
| AIDA64 / FPU SinJulia | |
| SCHENKER XMG Fusion 15 (Early 24) (v6.92.6600, Overboost) | |
| Lenovo Legion Pro 5 16IRX9 (v6.92.6600) | |
| Average Intel Core i9-14900HX (12217 - 18256, n=22) | |
| Aorus 16X 2024 (v6.92.6600) | |
| SCHENKER XMG Fusion 15 (Early 24) (v6.92.6600) | |
| Average of class Gaming (2137 - 32988, n=216, last 2 years) | |
| HP Omen Transcend 16-u1095ng (v6.92.6600) | |
| Alienware m16 R2 (v6.92.6600) | |
| AIDA64 / FPU Mandel | |
| SCHENKER XMG Fusion 15 (Early 24) (v6.92.6600, Overboost) | |
| Lenovo Legion Pro 5 16IRX9 (v6.92.6600) | |
| Average Intel Core i9-14900HX (43302 - 72594, n=22) | |
| Aorus 16X 2024 (v6.92.6600) | |
| SCHENKER XMG Fusion 15 (Early 24) (v6.92.6600) | |
| Average of class Gaming (10291 - 134044, n=216, last 2 years) | |
| Alienware m16 R2 (v6.92.6600) | |
| HP Omen Transcend 16-u1095ng (v6.92.6600) | |
| AIDA64 / CPU AES | |
| SCHENKER XMG Fusion 15 (Early 24) (v6.92.6600, Overboost) | |
| SCHENKER XMG Fusion 15 (Early 24) (v6.92.6600) | |
| Average Intel Core i9-14900HX (86964 - 241777, n=22) | |
| Lenovo Legion Pro 5 16IRX9 (v6.92.6600) | |
| Aorus 16X 2024 (v6.92.6600) | |
| Average of class Gaming (19065 - 328679, n=216, last 2 years) | |
| HP Omen Transcend 16-u1095ng (v6.92.6600) | |
| Alienware m16 R2 (v6.92.6600) | |
| AIDA64 / CPU ZLib | |
| SCHENKER XMG Fusion 15 (Early 24) (v6.92.6600, Overboost) | |
| Lenovo Legion Pro 5 16IRX9 (v6.92.6600) | |
| Average Intel Core i9-14900HX (1265 - 2149, n=22) | |
| Aorus 16X 2024 (v6.92.6600) | |
| SCHENKER XMG Fusion 15 (Early 24) (v6.92.6600) | |
| HP Omen Transcend 16-u1095ng (v6.92.6600) | |
| Average of class Gaming (150.9 - 2409, n=216, last 2 years) | |
| Alienware m16 R2 (v6.92.6600) | |
| AIDA64 / FP64 Ray-Trace | |
| SCHENKER XMG Fusion 15 (Early 24) (v6.92.6600, Overboost) | |
| Lenovo Legion Pro 5 16IRX9 (v6.92.6600) | |
| Average Intel Core i9-14900HX (9170 - 16128, n=22) | |
| Aorus 16X 2024 (v6.92.6600) | |
| SCHENKER XMG Fusion 15 (Early 24) (v6.92.6600) | |
| Average of class Gaming (1518 - 31796, n=216, last 2 years) | |
| Alienware m16 R2 (v6.92.6600) | |
| HP Omen Transcend 16-u1095ng (v6.92.6600) | |
| AIDA64 / CPU PhotoWorxx | |
| Lenovo Legion Pro 5 16IRX9 (v6.92.6600) | |
| HP Omen Transcend 16-u1095ng (v6.92.6600) | |
| Aorus 16X 2024 (v6.92.6600) | |
| Average Intel Core i9-14900HX (33960 - 51118, n=22) | |
| SCHENKER XMG Fusion 15 (Early 24) (v6.92.6600, Overboost) | |
| SCHENKER XMG Fusion 15 (Early 24) (v6.92.6600) | |
| Alienware m16 R2 (v6.92.6600) | |
| Average of class Gaming (10805 - 60161, n=217, last 2 years) | |
System performance
The smooth-running system is not lacking in computing power. Gaming, streaming and rendering do not pose any major challenges for the laptop. The RAM's transfer rates range within a normal level for DDR5-5600 RAM. Its PCMark results were also good.

CrossMark: Overall | Productivity | Creativity | Responsiveness
WebXPRT 3: Overall
WebXPRT 4: Overall
Mozilla Kraken 1.1: Total
| PCMark 10 / Score | |
| Lenovo Legion Pro 5 16IRX9 | |
| SCHENKER XMG Fusion 15 (Early 24) | |
| Aorus 16X 2024 | |
| Average Intel Core i9-14900HX, NVIDIA GeForce RTX 4070 Laptop GPU (7866 - 8550, n=5) | |
| HP Omen Transcend 16-u1095ng | |
| Alienware m16 R2 | |
| Average of class Gaming (5235 - 9852, n=192, last 2 years) | |
| PCMark 10 / Essentials | |
| SCHENKER XMG Fusion 15 (Early 24) | |
| Lenovo Legion Pro 5 16IRX9 | |
| Average Intel Core i9-14900HX, NVIDIA GeForce RTX 4070 Laptop GPU (10621 - 11815, n=5) | |
| Aorus 16X 2024 | |
| Average of class Gaming (8300 - 12334, n=191, last 2 years) | |
| HP Omen Transcend 16-u1095ng | |
| Alienware m16 R2 | |
| PCMark 10 / Productivity | |
| Aorus 16X 2024 | |
| SCHENKER XMG Fusion 15 (Early 24) | |
| Average Intel Core i9-14900HX, NVIDIA GeForce RTX 4070 Laptop GPU (9701 - 11103, n=5) | |
| HP Omen Transcend 16-u1095ng | |
| Lenovo Legion Pro 5 16IRX9 | |
| Average of class Gaming (6662 - 11833, n=191, last 2 years) | |
| Alienware m16 R2 | |
| PCMark 10 / Digital Content Creation | |
| Lenovo Legion Pro 5 16IRX9 | |
| Average Intel Core i9-14900HX, NVIDIA GeForce RTX 4070 Laptop GPU (12114 - 14827, n=5) | |
| SCHENKER XMG Fusion 15 (Early 24) | |
| Aorus 16X 2024 | |
| Alienware m16 R2 | |
| HP Omen Transcend 16-u1095ng | |
| Average of class Gaming (6462 - 18475, n=191, last 2 years) | |
| CrossMark / Overall | |
| Aorus 16X 2024 | |
| Average Intel Core i9-14900HX, NVIDIA GeForce RTX 4070 Laptop GPU (2002 - 2312, n=4) | |
| SCHENKER XMG Fusion 15 (Early 24) | |
| Lenovo Legion Pro 5 16IRX9 | |
| Average of class Gaming (1247 - 2334, n=165, last 2 years) | |
| Alienware m16 R2 | |
| CrossMark / Productivity | |
| Aorus 16X 2024 | |
| SCHENKER XMG Fusion 15 (Early 24) | |
| Average Intel Core i9-14900HX, NVIDIA GeForce RTX 4070 Laptop GPU (1827 - 2191, n=4) | |
| Lenovo Legion Pro 5 16IRX9 | |
| Average of class Gaming (1299 - 2204, n=165, last 2 years) | |
| Alienware m16 R2 | |
| CrossMark / Creativity | |
| Aorus 16X 2024 | |
| Average Intel Core i9-14900HX, NVIDIA GeForce RTX 4070 Laptop GPU (2287 - 2458, n=4) | |
| SCHENKER XMG Fusion 15 (Early 24) | |
| Lenovo Legion Pro 5 16IRX9 | |
| Average of class Gaming (1275 - 2514, n=165, last 2 years) | |
| Alienware m16 R2 | |
| CrossMark / Responsiveness | |
| Aorus 16X 2024 | |
| Average Intel Core i9-14900HX, NVIDIA GeForce RTX 4070 Laptop GPU (1769 - 2330, n=4) | |
| SCHENKER XMG Fusion 15 (Early 24) | |
| Lenovo Legion Pro 5 16IRX9 | |
| Average of class Gaming (1030 - 2330, n=165, last 2 years) | |
| Alienware m16 R2 | |
| WebXPRT 3 / Overall | |
| HP Omen Transcend 16-u1095ng | |
| SCHENKER XMG Fusion 15 (Early 24) | |
| Average Intel Core i9-14900HX, NVIDIA GeForce RTX 4070 Laptop GPU (322 - 342, n=5) | |
| Aorus 16X 2024 | |
| Lenovo Legion Pro 5 16IRX9 | |
| Average of class Gaming (215 - 480, n=190, last 2 years) | |
| Alienware m16 R2 | |
| WebXPRT 4 / Overall | |
| SCHENKER XMG Fusion 15 (Early 24) | |
| Average Intel Core i9-14900HX, NVIDIA GeForce RTX 4070 Laptop GPU (291 - 301, n=3) | |
| Lenovo Legion Pro 5 16IRX9 | |
| Average of class Gaming (157.9 - 328, n=165, last 2 years) | |
| Alienware m16 R2 | |
| Mozilla Kraken 1.1 / Total | |
| Alienware m16 R2 | |
| Average of class Gaming (421 - 824, n=203, last 2 years) | |
| Lenovo Legion Pro 5 16IRX9 | |
| Average Intel Core i9-14900HX, NVIDIA GeForce RTX 4070 Laptop GPU (431 - 449, n=5) | |
| HP Omen Transcend 16-u1095ng | |
| Aorus 16X 2024 | |
| SCHENKER XMG Fusion 15 (Early 24) | |
* ... smaller is better
| PCMark 10 Score | 8522 points | |
Help | ||
| AIDA64 / Memory Copy | |
| Lenovo Legion Pro 5 16IRX9 | |
| Aorus 16X 2024 | |
| HP Omen Transcend 16-u1095ng | |
| SCHENKER XMG Fusion 15 (Early 24) | |
| Average Intel Core i9-14900HX (56992 - 83392, n=22) | |
| Alienware m16 R2 | |
| Average of class Gaming (21842 - 92565, n=216, last 2 years) | |
| AIDA64 / Memory Read | |
| Aorus 16X 2024 | |
| Lenovo Legion Pro 5 16IRX9 | |
| SCHENKER XMG Fusion 15 (Early 24) | |
| HP Omen Transcend 16-u1095ng | |
| Average Intel Core i9-14900HX (54443 - 87507, n=22) | |
| Alienware m16 R2 | |
| Average of class Gaming (23681 - 90647, n=216, last 2 years) | |
| AIDA64 / Memory Write | |
| HP Omen Transcend 16-u1095ng | |
| Aorus 16X 2024 | |
| Lenovo Legion Pro 5 16IRX9 | |
| Average Intel Core i9-14900HX (51387 - 78199, n=22) | |
| SCHENKER XMG Fusion 15 (Early 24) | |
| Alienware m16 R2 | |
| Average of class Gaming (21619 - 103259, n=216, last 2 years) | |
| AIDA64 / Memory Latency | |
| Alienware m16 R2 | |
| Average of class Gaming (59.5 - 152.5, n=212, last 2 years) | |
| HP Omen Transcend 16-u1095ng | |
| Average Intel Core i9-14900HX (79.7 - 105, n=22) | |
| Lenovo Legion Pro 5 16IRX9 | |
| SCHENKER XMG Fusion 15 (Early 24) | |
| Aorus 16X 2024 | |
* ... smaller is better
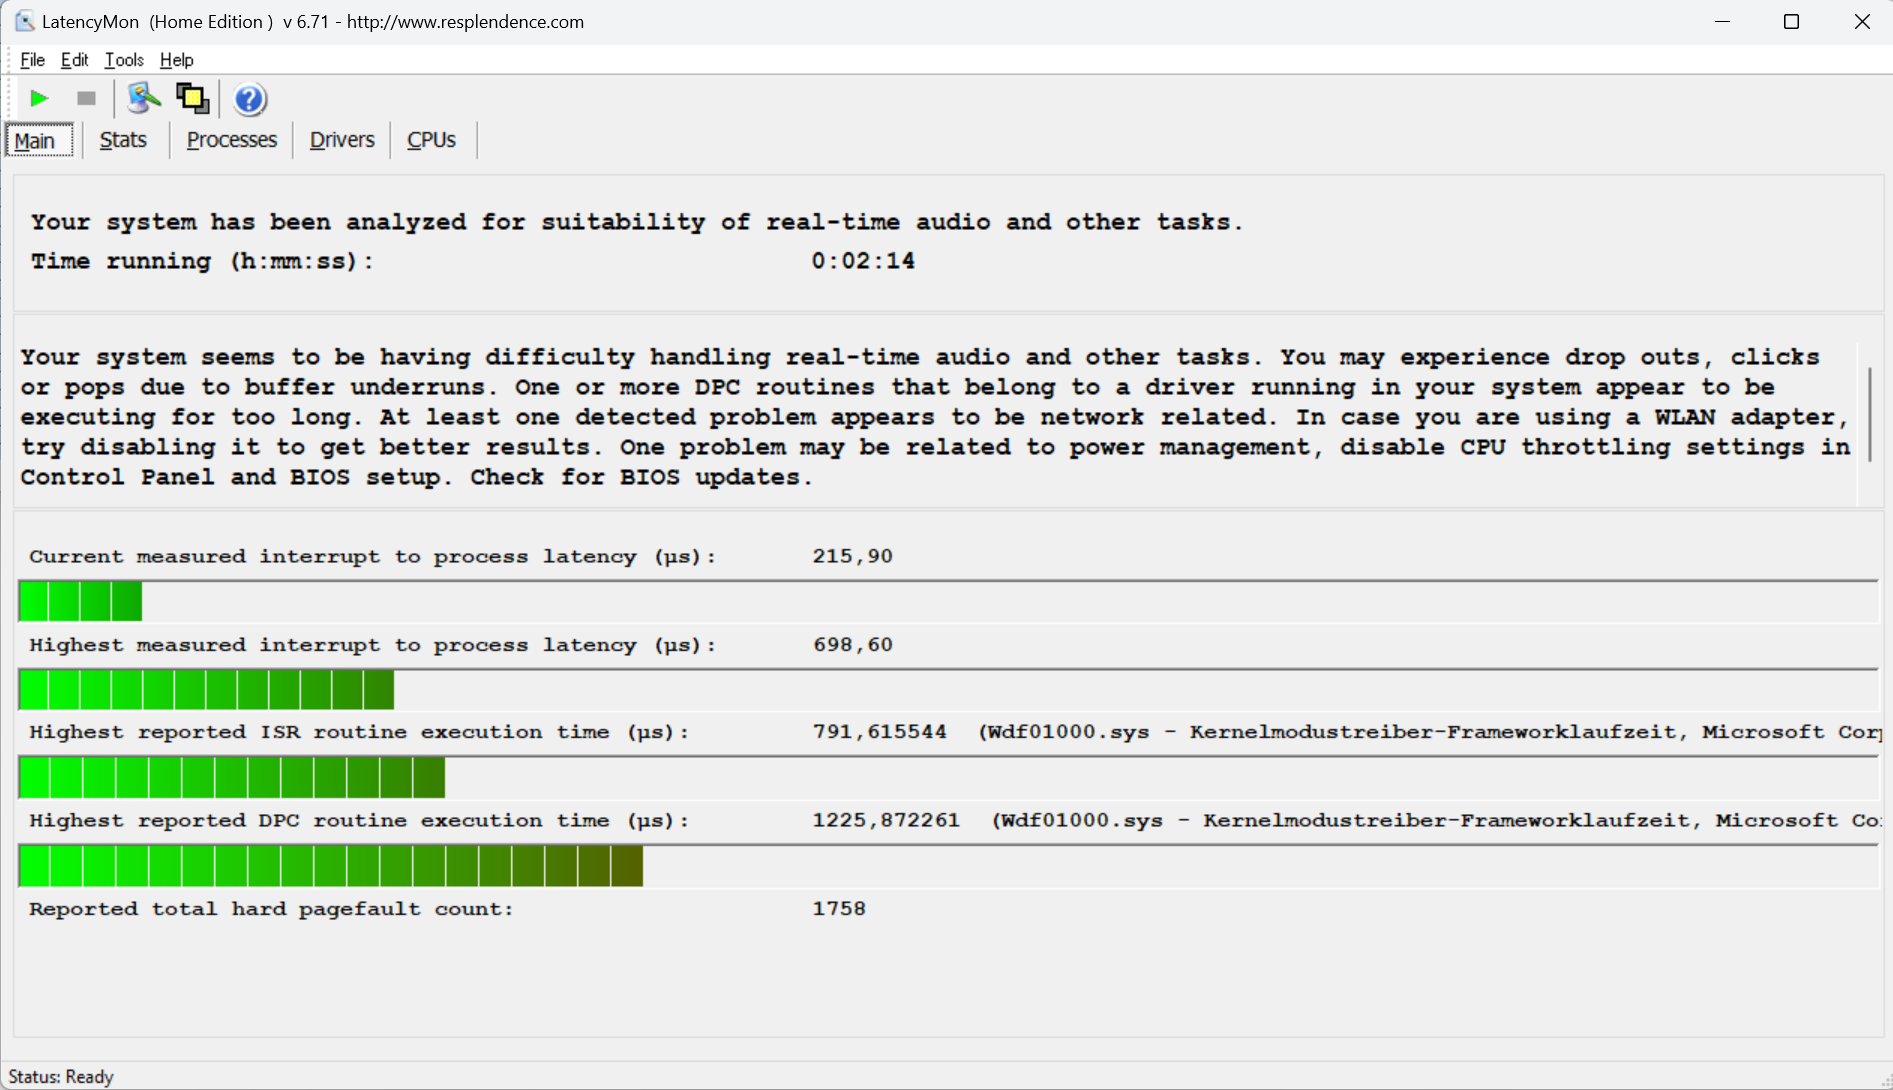
DPC latencies
The standardized latency monitor test (surfing the web, 4k video playback, Prime95 high load) revealed some anomalies. The system does not appear to be suitable for video and audio editing in real-time. Future software updates could lead to improvements or even deteriorations.

| DPC Latencies / LatencyMon - interrupt to process latency (max), Web, Youtube, Prime95 | |
| Alienware m16 R2 | |
| HP Omen Transcend 16-u1095ng | |
| Aorus 16X 2024 | |
| Lenovo Legion Pro 5 16IRX9 | |
| SCHENKER XMG Fusion 15 (Early 24) | |
* ... smaller is better
Storage devices
The Fusion can accommodate a total of two M.2-2280-format PCIe-4 SSDs. RAID-0/1 is supported. Our test device's Samsung SSD (1TB) delivered excellent data rates. Positive: We didn't note any thermal throttling.

* ... smaller is better
Reading continuous performance: DiskSpd Read Loop, Queue Depth 8
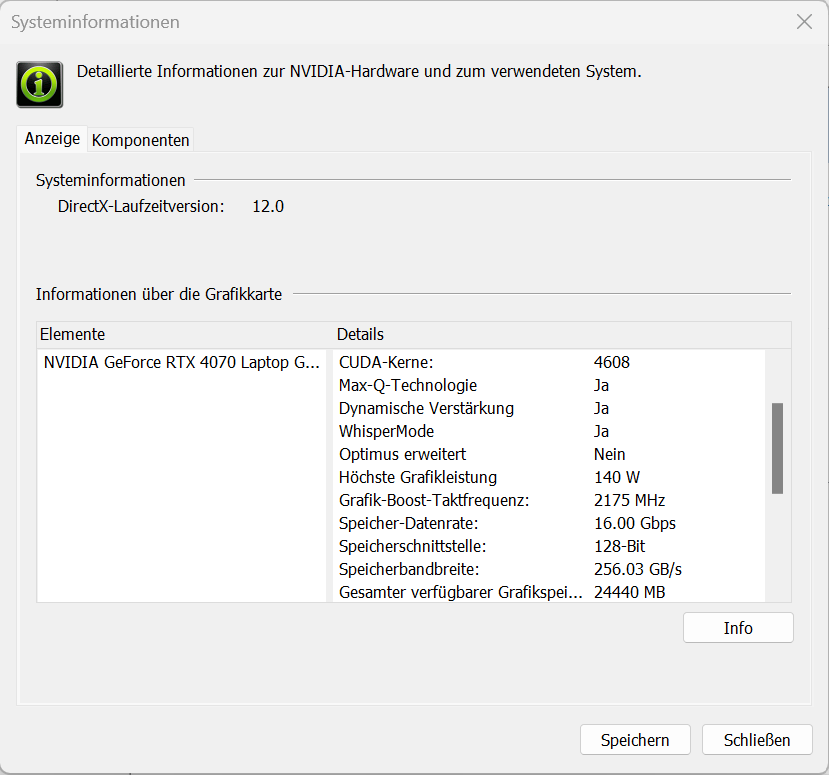
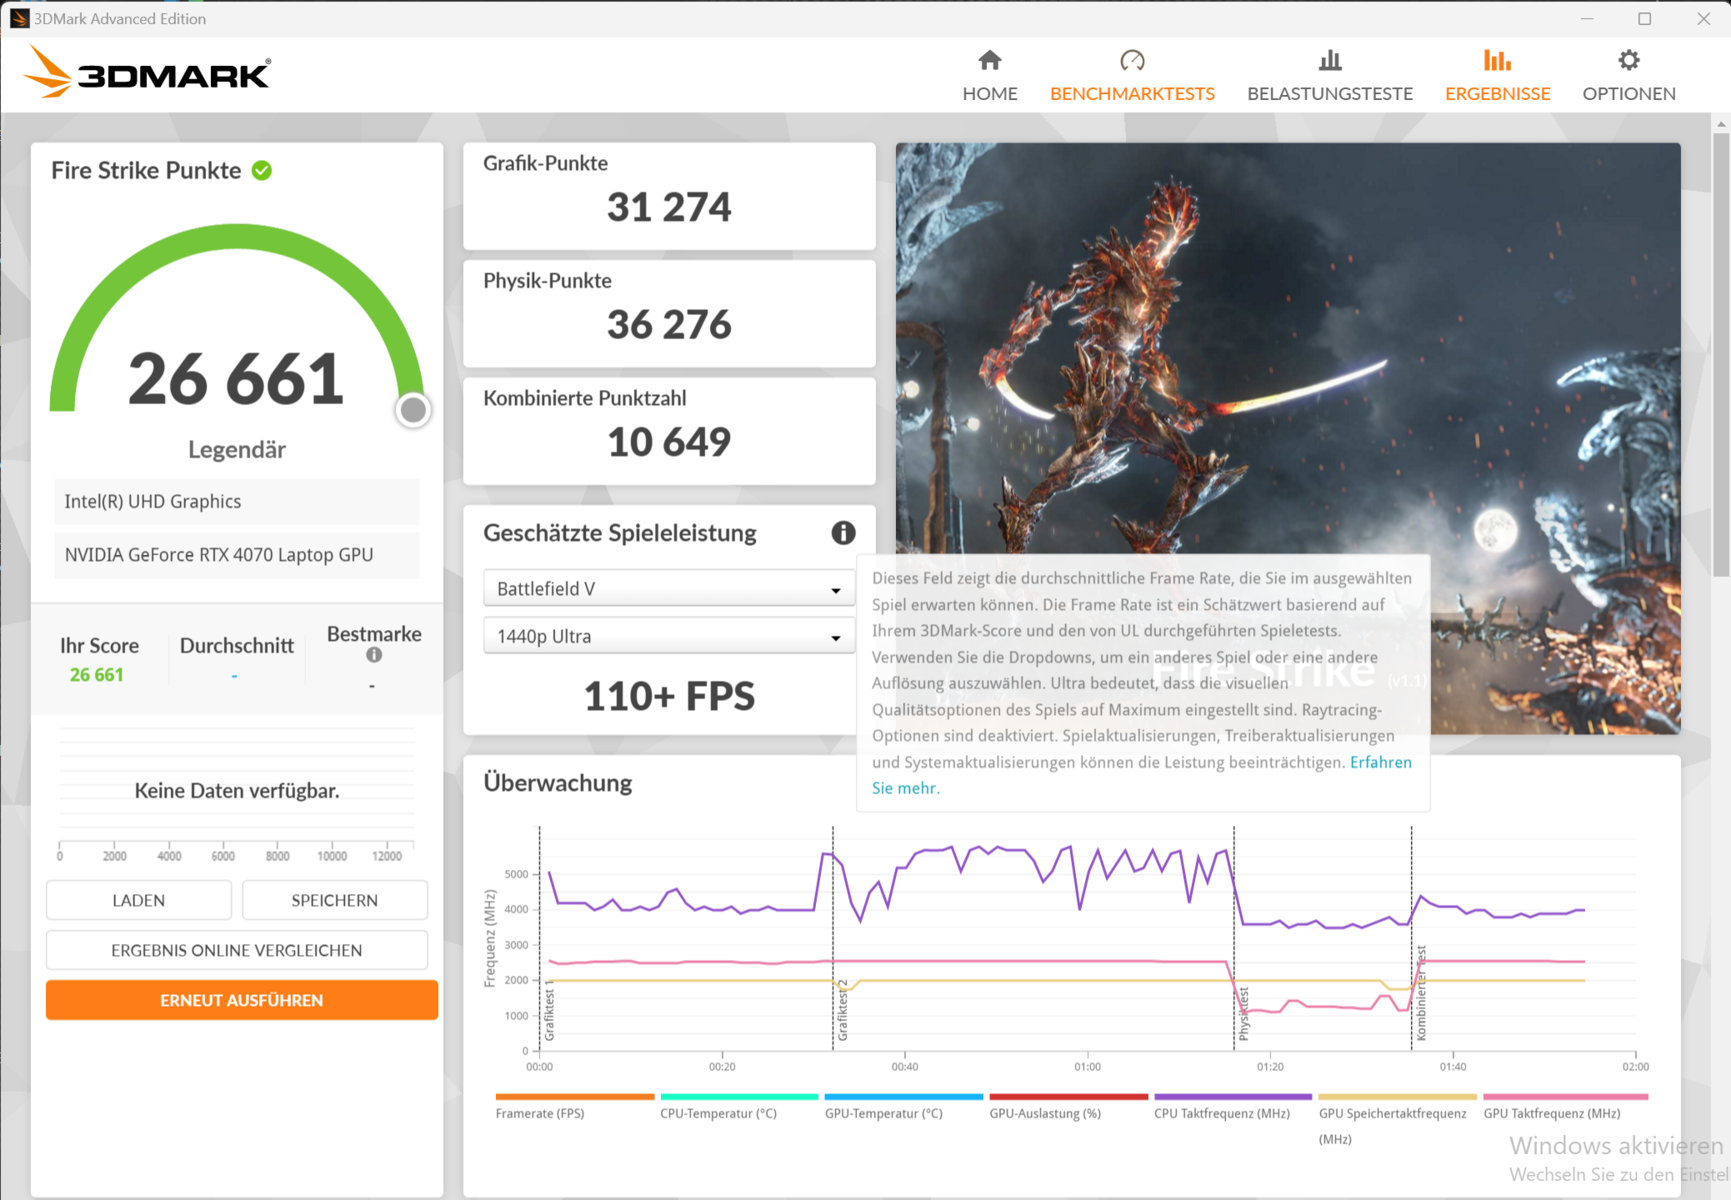
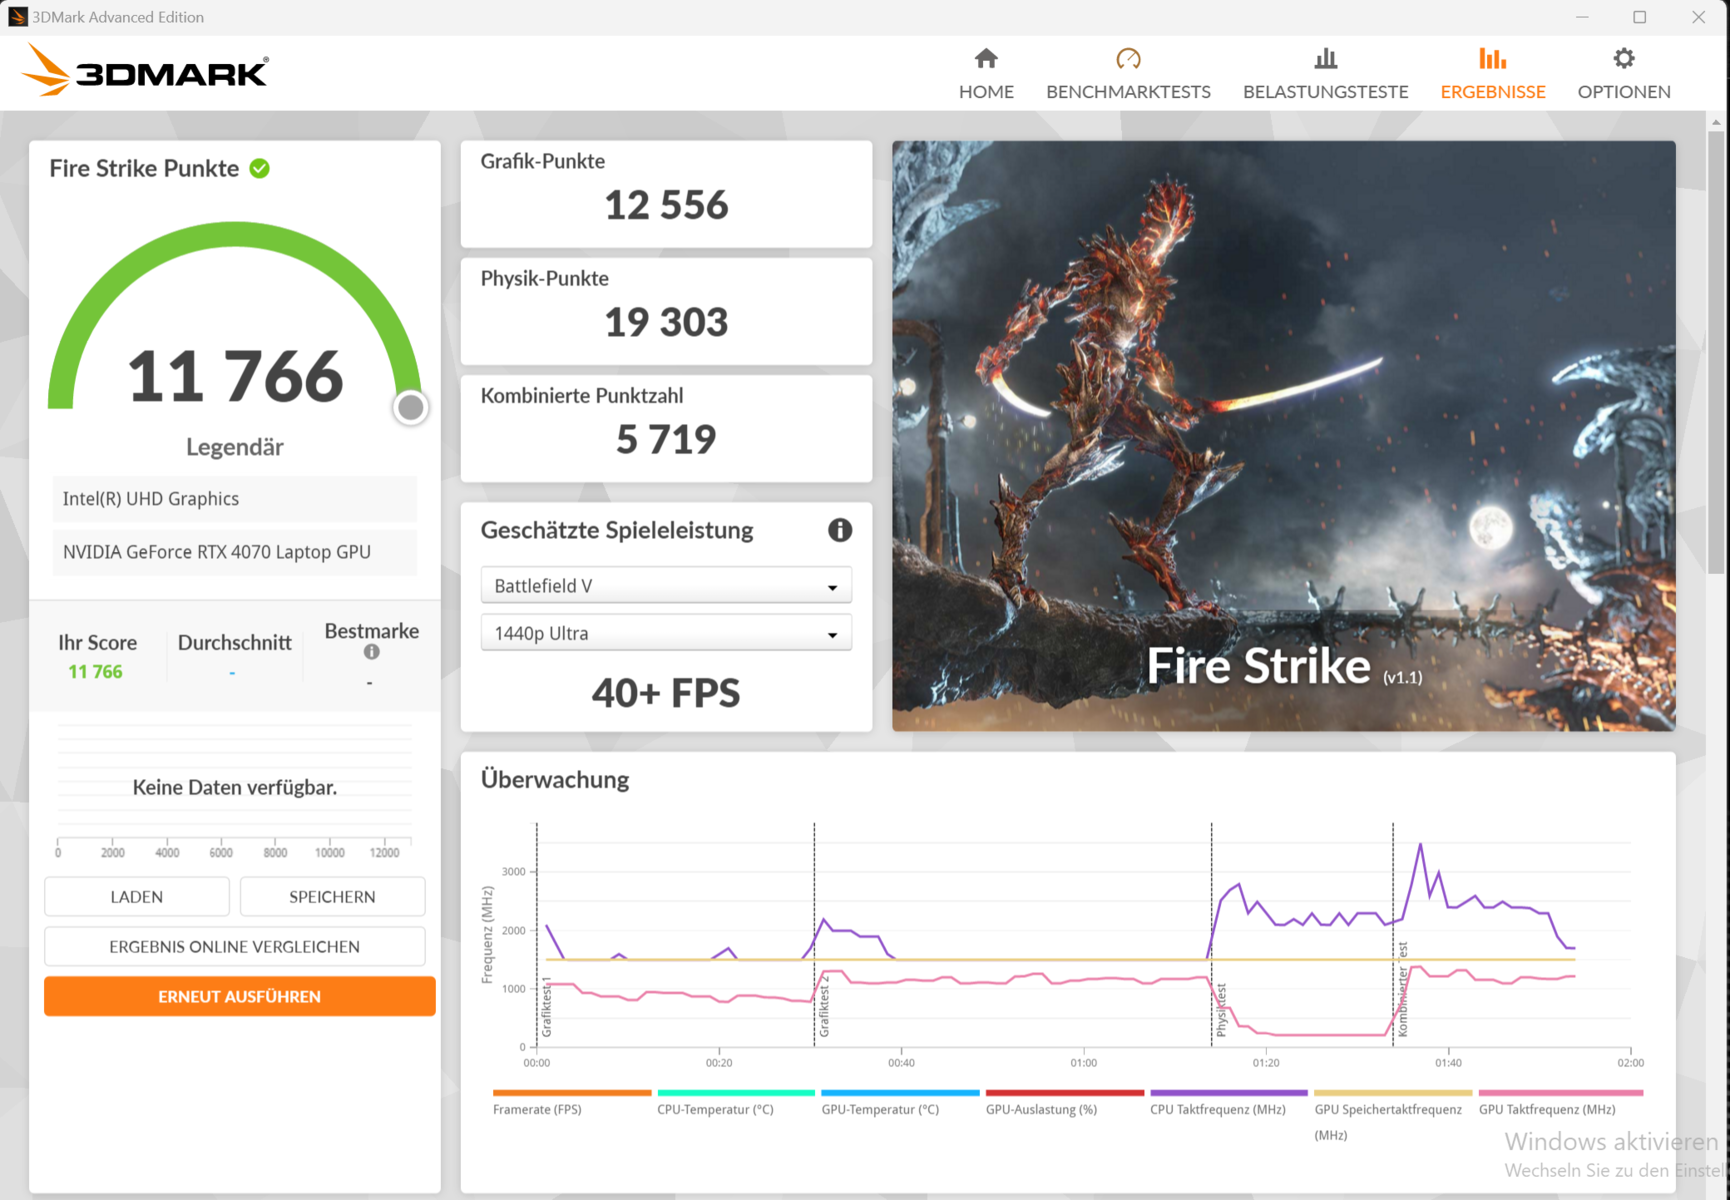
Graphics card
Schenker has allowed the laptop's GeForce RTX 4070 a maximum TGP of 140 watts (115 watts + 25 watts Dynamic Boost)—more isn't recommended by Nvidia. The GPU has access to 8 GB VRAM (GDDR6)—a little on the low side for today's demands. The benchmarks delivered results above the RTX-4070 average (Enthusiast) and Overboost only resulted in a small advantage. Switching between the dGPU and Optimus requires a restart.


| 3DMark Performance Rating - Percent | |
| SCHENKER XMG Fusion 15 (Early 24) | |
| Lenovo Legion Pro 5 16IRX9 | |
| SCHENKER XMG Fusion 15 (Early 24) | |
| Alienware m16 R2 | |
| Average of class Gaming | |
| Aorus 16X 2024 | |
| Average NVIDIA GeForce RTX 4070 Laptop GPU | |
| HP Omen Transcend 16-u1095ng | |
| 3DMark 11 - 1280x720 Performance GPU | |
| SCHENKER XMG Fusion 15 (Early 24) (Overboost) | |
| SCHENKER XMG Fusion 15 (Early 24) | |
| Lenovo Legion Pro 5 16IRX9 | |
| Alienware m16 R2 | |
| Aorus 16X 2024 | |
| Average of class Gaming (1029 - 72070, n=220, last 2 years) | |
| Average NVIDIA GeForce RTX 4070 Laptop GPU (24229 - 46434, n=50) | |
| HP Omen Transcend 16-u1095ng | |
| 3DMark | |
| 1920x1080 Fire Strike Graphics | |
| SCHENKER XMG Fusion 15 (Early 24) (Overboost) | |
| SCHENKER XMG Fusion 15 (Early 24) | |
| Lenovo Legion Pro 5 16IRX9 | |
| Alienware m16 R2 | |
| Average of class Gaming (781 - 53059, n=225, last 2 years) | |
| Average NVIDIA GeForce RTX 4070 Laptop GPU (16212 - 33451, n=50) | |
| Aorus 16X 2024 | |
| HP Omen Transcend 16-u1095ng | |
| 2560x1440 Time Spy Graphics | |
| SCHENKER XMG Fusion 15 (Early 24) (Overboost) | |
| Lenovo Legion Pro 5 16IRX9 | |
| Alienware m16 R2 | |
| SCHENKER XMG Fusion 15 (Early 24) | |
| Average of class Gaming (224 - 22547, n=222, last 2 years) | |
| Aorus 16X 2024 | |
| Average NVIDIA GeForce RTX 4070 Laptop GPU (6241 - 13391, n=49) | |
| HP Omen Transcend 16-u1095ng | |
| 3DMark 06 Standard Score | 63892 points | |
| 3DMark 11 Performance | 36008 points | |
| 3DMark Fire Strike Score | 26661 points | |
| 3DMark Time Spy Score | 13067 points | |
Help | ||
| Geekbench 5.5 | |
| OpenCL Score | |
| SCHENKER XMG Fusion 15 (Early 24) | |
| SCHENKER XMG Fusion 15 (Early 24) (Overboost) | |
| Aorus 16X 2024 | |
| Average of class Gaming (5039 - 226512, n=224, last 2 years) | |
| HP Omen Transcend 16-u1095ng | |
| Lenovo Legion Pro 5 16IRX9 | |
| Average NVIDIA GeForce RTX 4070 Laptop GPU (17391 - 129366, n=49) | |
| Alienware m16 R2 | |
| Vulkan Score | |
| SCHENKER XMG Fusion 15 (Early 24) (Overboost) | |
| Aorus 16X 2024 | |
| SCHENKER XMG Fusion 15 (Early 24) | |
| Alienware m16 R2 | |
| Lenovo Legion Pro 5 16IRX9 | |
| Average of class Gaming (1952 - 160279, n=220, last 2 years) | |
| Average NVIDIA GeForce RTX 4070 Laptop GPU (4898 - 93339, n=48) | |
| Geekbench 6.2 | |
| GPU OpenCL | |
| SCHENKER XMG Fusion 15 (Early 24) (6.2.1) | |
| SCHENKER XMG Fusion 15 (Early 24) (6.2.1, Overboost) | |
| HP Omen Transcend 16-u1095ng (6.2.1) | |
| Aorus 16X 2024 (6.2.1) | |
| Average NVIDIA GeForce RTX 4070 Laptop GPU (101474 - 129836, n=26) | |
| Average of class Gaming (4321 - 207373, n=80, last 2 years) | |
| Lenovo Legion Pro 5 16IRX9 (6.2.1) | |
| Alienware m16 R2 (6.2.1) | |
| GPU Vulkan | |
| SCHENKER XMG Fusion 15 (Early 24) (6.2.1, Overboost) | |
| Alienware m16 R2 (6.2.1) | |
| Lenovo Legion Pro 5 16IRX9 (6.2.1) | |
| SCHENKER XMG Fusion 15 (Early 24) (6.2.1) | |
| Aorus 16X 2024 (6.2.1) | |
| Average of class Gaming (4286 - 196201, n=77, last 2 years) | |
| Average NVIDIA GeForce RTX 4070 Laptop GPU (9035 - 120033, n=24) | |
| V-Ray 5 Benchmark | |
| GPU RTX | |
| Average of class Gaming (171 - 3824, n=122, last 2 years) | |
| Lenovo Legion Pro 5 16IRX9 (5.0.1) | |
| SCHENKER XMG Fusion 15 (Early 24) (5.0.1, Overboost) | |
| SCHENKER XMG Fusion 15 (Early 24) (5.0.1) | |
| Alienware m16 R2 (5.0.1) | |
| Aorus 16X 2024 (5.0.1) | |
| Average NVIDIA GeForce RTX 4070 Laptop GPU (171 - 1872, n=28) | |
| GPU CUDA | |
| Average of class Gaming (120 - 2797, n=126, last 2 years) | |
| Lenovo Legion Pro 5 16IRX9 (5.0.1) | |
| SCHENKER XMG Fusion 15 (Early 24) (5.0.1, Overboost) | |
| SCHENKER XMG Fusion 15 (Early 24) (5.0.1) | |
| Alienware m16 R2 (5.0.1) | |
| Aorus 16X 2024 (5.0.1) | |
| Average NVIDIA GeForce RTX 4070 Laptop GPU (120 - 1333, n=28) | |
| CPU | |
| SCHENKER XMG Fusion 15 (Early 24) (5.0.1, Overboost) | |
| Lenovo Legion Pro 5 16IRX9 (5.0.1) | |
| Aorus 16X 2024 (5.0.1) | |
| SCHENKER XMG Fusion 15 (Early 24) (5.0.1) | |
| Average NVIDIA GeForce RTX 4070 Laptop GPU (10005 - 20388, n=27) | |
| Average of class Gaming (1690 - 26944, n=136, last 2 years) | |
| Alienware m16 R2 (5.0.1) | |
| V-Ray Benchmark Next 4.10 | |
| GPU | |
| Lenovo Legion Pro 5 16IRX9 (v4.10.07 ) | |
| SCHENKER XMG Fusion 15 (Early 24) (v4.10.07, Overboost) | |
| Average of class Gaming (54 - 1334, n=178, last 2 years) | |
| Average NVIDIA GeForce RTX 4070 Laptop GPU (500 - 686, n=35) | |
| SCHENKER XMG Fusion 15 (Early 24) (v4.10.07 ) | |
| HP Omen Transcend 16-u1095ng (v4.10.07 ) | |
| Aorus 16X 2024 (v4.10.07 ) | |
| CPU | |
| SCHENKER XMG Fusion 15 (Early 24) (v4.10.07, Overboost) | |
| Lenovo Legion Pro 5 16IRX9 (v4.10.07 ) | |
| Aorus 16X 2024 (v4.10.07 ) | |
| SCHENKER XMG Fusion 15 (Early 24) (v4.10.07 ) | |
| HP Omen Transcend 16-u1095ng (v4.10.07 ) | |
| Average NVIDIA GeForce RTX 4070 Laptop GPU (12638 - 35173, n=35) | |
| Average of class Gaming (2741 - 37629, n=178, last 2 years) | |
* ... smaller is better
Gaming performance
The hardware is intended for QHD gaming at high to maximum settings. By using DLSS 3 and Frame Generation, you could play games at higher resolutions and maximum settings including ray tracing—but only with games which support these functions. We noted frame rates above the RTX-4070 average (Enthusiast) and Overboost resulted in a small advantage.
| Performance Rating - Percent | |
| SCHENKER XMG Fusion 15 (Early 24) | |
| Lenovo Legion Pro 5 16IRX9 | |
| SCHENKER XMG Fusion 15 (Early 24) | |
| Aorus 16X 2024 | |
| Alienware m16 R2 -1! | |
| HP Omen Transcend 16-u1095ng | |
| Average NVIDIA GeForce RTX 4070 Laptop GPU | |
| Average of class Gaming | |
| The Witcher 3 - 1920x1080 Ultra Graphics & Postprocessing (HBAO+) | |
| Lenovo Legion Pro 5 16IRX9 | |
| SCHENKER XMG Fusion 15 (Early 24) (Overboost) | |
| SCHENKER XMG Fusion 15 (Early 24) | |
| Aorus 16X 2024 | |
| Alienware m16 R2 | |
| Average of class Gaming (8.61 - 216, n=216, last 2 years) | |
| HP Omen Transcend 16-u1095ng | |
| Average NVIDIA GeForce RTX 4070 Laptop GPU (69.8 - 133.7, n=52) | |
| GTA V - 1920x1080 Highest Settings possible AA:4xMSAA + FX AF:16x | |
| SCHENKER XMG Fusion 15 (Early 24) (Overboost) | |
| SCHENKER XMG Fusion 15 (Early 24) | |
| Lenovo Legion Pro 5 16IRX9 | |
| HP Omen Transcend 16-u1095ng | |
| Average NVIDIA GeForce RTX 4070 Laptop GPU (63.5 - 140.5, n=44) | |
| Average of class Gaming (6.38 - 167.7, n=208, last 2 years) | |
| Aorus 16X 2024 | |
| Final Fantasy XV Benchmark - 1920x1080 High Quality | |
| SCHENKER XMG Fusion 15 (Early 24) (1.3, Overboost) | |
| Lenovo Legion Pro 5 16IRX9 (1.3) | |
| SCHENKER XMG Fusion 15 (Early 24) (1.3) | |
| Alienware m16 R2 (1.3) | |
| Average NVIDIA GeForce RTX 4070 Laptop GPU (66 - 131.9, n=47) | |
| Average of class Gaming (9.13 - 194.9, n=218, last 2 years) | |
| Aorus 16X 2024 (1.3) | |
| HP Omen Transcend 16-u1095ng (1.3) | |
| Strange Brigade - 1920x1080 ultra AA:ultra AF:16 | |
| Lenovo Legion Pro 5 16IRX9 (1.47.22.14 D3D12) | |
| SCHENKER XMG Fusion 15 (Early 24) (1.47.22.14 D3D12, Overboost) | |
| Alienware m16 R2 (1.47.22.14 D3D12) | |
| SCHENKER XMG Fusion 15 (Early 24) (1.47.22.14 D3D12) | |
| Average of class Gaming (14.6 - 421, n=215, last 2 years) | |
| Aorus 16X 2024 (1.47.22.14 D3D12) | |
| Average NVIDIA GeForce RTX 4070 Laptop GPU (117.7 - 234, n=47) | |
| HP Omen Transcend 16-u1095ng (1.47.22.14 D3D12) | |
| Dota 2 Reborn - 1920x1080 ultra (3/3) best looking | |
| SCHENKER XMG Fusion 15 (Early 24) (Overboost) | |
| Lenovo Legion Pro 5 16IRX9 | |
| SCHENKER XMG Fusion 15 (Early 24) | |
| Aorus 16X 2024 | |
| HP Omen Transcend 16-u1095ng | |
| Average NVIDIA GeForce RTX 4070 Laptop GPU (89.7 - 187.5, n=48) | |
| Average of class Gaming (26.9 - 220, n=227, last 2 years) | |
| Alienware m16 R2 | |
| X-Plane 11.11 - 1920x1080 high (fps_test=3) | |
| SCHENKER XMG Fusion 15 (Early 24) (Overboost) | |
| Lenovo Legion Pro 5 16IRX9 | |
| SCHENKER XMG Fusion 15 (Early 24) | |
| Aorus 16X 2024 | |
| HP Omen Transcend 16-u1095ng | |
| Average NVIDIA GeForce RTX 4070 Laptop GPU (72.2 - 144.4, n=50) | |
| Average of class Gaming (12.4 - 166.2, n=233, last 2 years) | |
| Alienware m16 R2 | |
| Alone in the Dark | |
| 1920x1080 Cinematic Preset | |
| SCHENKER XMG Fusion 15 (Early 24) | |
| Aorus 16X 2024 | |
| Average NVIDIA GeForce RTX 4070 Laptop GPU (114 - 126, n=3) | |
| Average of class Gaming (13.6 - 176.4, n=4, last 2 years) | |
| 2560x1440 Cinematic Preset | |
| Average of class Gaming (64.7 - 91.6, n=3, last 2 years) | |
| SCHENKER XMG Fusion 15 (Early 24) | |
| Average NVIDIA GeForce RTX 4070 Laptop GPU (64.7 - 76.6, n=3) | |
| Aorus 16X 2024 | |
| The Witcher 3 v4.00 | |
| 1920x1080 Ultra Preset / On AA:FX | |
| Average of class Gaming (25.7 - 150, n=17, last 2 years) | |
| SCHENKER XMG Fusion 15 (Early 24) | |
| Average NVIDIA GeForce RTX 4070 Laptop GPU (85 - 86.5, n=2) | |
| 1920x1080 RT Ultra Preset / On AA:FX | |
| Average of class Gaming (12.9 - 66, n=11, last 2 years) | |
| SCHENKER XMG Fusion 15 (Early 24) | |
| Average NVIDIA GeForce RTX 4070 Laptop GPU (36 - 40.4, n=2) | |
In order to test whether its frame rates remain stable over a longer period of time, we let the game The Witcher 3 run for around 60 minutes in Full HD and with the settings set to the maximum. We didn't move the game character. We didn't note a collapse in frame rate, however, they sank by a few per cent after about 50 minutes (Enthusiast). With the profile Overboost activated, this behavior did not occur.
Witcher 3 FPS diagram


| low | med. | high | ultra | QHD | |
| GTA V (2015) | 187.8 | 187 | 186.4 | 137.6 | 98.2 |
| The Witcher 3 (2015) | 603.3 | 418.4 | 246.2 | 128 | 92.2 |
| Dota 2 Reborn (2015) | 234 | 207 | 196.5 | 182.1 | |
| Final Fantasy XV Benchmark (2018) | 226 | 175.5 | 124.6 | 90.5 | |
| X-Plane 11.11 (2018) | 205 | 173.3 | 136.9 | ||
| Far Cry 5 (2018) | 204 | 176 | 166 | 157 | 124 |
| Strange Brigade (2018) | 558 | 313 | 245 | 214 | 139.2 |
| The Witcher 3 v4.00 (2023) | 271 | 215 | 176.2 | 86.5 | |
| Baldur's Gate 3 (2023) | 157.2 | 121.2 | 106.1 | 105 | 82.1 |
| Cyberpunk 2077 2.0 Phantom Liberty (2023) | 156.6 | 124.5 | 103.6 | 87 | 52.6 |
| Alan Wake 2 (2023) | 74.3 | 71.4 | 70.1 | 42.8 | |
| Alone in the Dark (2024) | 222 | 209 | 196.5 | 126 | 76.6 |
| Dragon's Dogma 2 (2024) | 83.9 | 80 | 61.3 |
Emissions - The Schenker laptop gets pretty hot
Noise emissions
In everyday use and when idling, the laptop runs very quietly. Although the fans are permanently activated (they can be deactivated via the BIOS), they can only be heard in very quiet surroundings. Under load, things quickly change: We noted nose emissions up to 53 dB(A) (Enthusiast). The mode Overboost resulted in even higher values. The device runs considerably quieter when using the mode Balanced—at the cost of some performance.
Noise Level
| Idle |
| 27 / 28 / 33 dB(A) |
| Load |
| 52 / 53 dB(A) |
 | ||
30 dB silent 40 dB(A) audible 50 dB(A) loud |
||
min: | ||
| SCHENKER XMG Fusion 15 (Early 24) i9-14900HX, NVIDIA GeForce RTX 4070 Laptop GPU | Aorus 16X 2024 i9-14900HX, NVIDIA GeForce RTX 4070 Laptop GPU | Alienware m16 R2 Ultra 7 155H, NVIDIA GeForce RTX 4070 Laptop GPU | HP Omen Transcend 16-u1095ng i9-14900HX, NVIDIA GeForce RTX 4070 Laptop GPU | Lenovo Legion Pro 5 16IRX9 i9-14900HX, NVIDIA GeForce RTX 4070 Laptop GPU | |
|---|---|---|---|---|---|
| Noise | -5% | 8% | 5% | 6% | |
| off / environment * | 25 | 26 -4% | 24.7 1% | 24 4% | 23.9 4% |
| Idle Minimum * | 27 | 26 4% | 25.3 6% | 29 -7% | 24.3 10% |
| Idle Average * | 28 | 32 -14% | 25.3 10% | 30 -7% | 24.3 13% |
| Idle Maximum * | 33 | 38 -15% | 25.3 23% | 31 6% | 28.9 12% |
| Load Average * | 52 | 54 -4% | 31.7 39% | 45 13% | 45.8 12% |
| Witcher 3 ultra * | 51 | 50 2% | 53.8 -5% | 44 14% | 51 -0% |
| Load Maximum * | 53 | 55 -4% | 62 -17% | 47 11% | 56.6 -7% |
* ... smaller is better
Temperature
The stress test and Witcher 3 test led the laptop to heat up considerably. At times, it hit values within the upper 50-degree-Celcius range. In everyday use (office, internet), the values generally remain within the green zone.
(-) The maximum temperature on the upper side is 48 °C / 118 F, compared to the average of 40.4 °C / 105 F, ranging from 21.2 to 68.8 °C for the class Gaming.
(-) The bottom heats up to a maximum of 56 °C / 133 F, compared to the average of 43.2 °C / 110 F
(+) In idle usage, the average temperature for the upper side is 26.6 °C / 80 F, compared to the device average of 33.8 °C / 93 F.
(-) Playing The Witcher 3, the average temperature for the upper side is 40.4 °C / 105 F, compared to the device average of 33.8 °C / 93 F.
(+) The palmrests and touchpad are reaching skin temperature as a maximum (34 °C / 93.2 F) and are therefore not hot.
(-) The average temperature of the palmrest area of similar devices was 28.9 °C / 84 F (-5.1 °C / -9.2 F).
| SCHENKER XMG Fusion 15 (Early 24) Intel Core i9-14900HX, NVIDIA GeForce RTX 4070 Laptop GPU | Aorus 16X 2024 Intel Core i9-14900HX, NVIDIA GeForce RTX 4070 Laptop GPU | Alienware m16 R2 Intel Core Ultra 7 155H, NVIDIA GeForce RTX 4070 Laptop GPU | HP Omen Transcend 16-u1095ng Intel Core i9-14900HX, NVIDIA GeForce RTX 4070 Laptop GPU | Lenovo Legion Pro 5 16IRX9 Intel Core i9-14900HX, NVIDIA GeForce RTX 4070 Laptop GPU | |
|---|---|---|---|---|---|
| Heat | -5% | -14% | -6% | -8% | |
| Maximum Upper Side * | 48 | 41 15% | 44.8 7% | 49 -2% | 43.8 9% |
| Maximum Bottom * | 56 | 41 27% | 48 14% | 63 -13% | 55.4 1% |
| Idle Upper Side * | 28 | 37 -32% | 37.2 -33% | 30 -7% | 32.8 -17% |
| Idle Bottom * | 29 | 38 -31% | 42 -45% | 29 -0% | 36 -24% |
* ... smaller is better
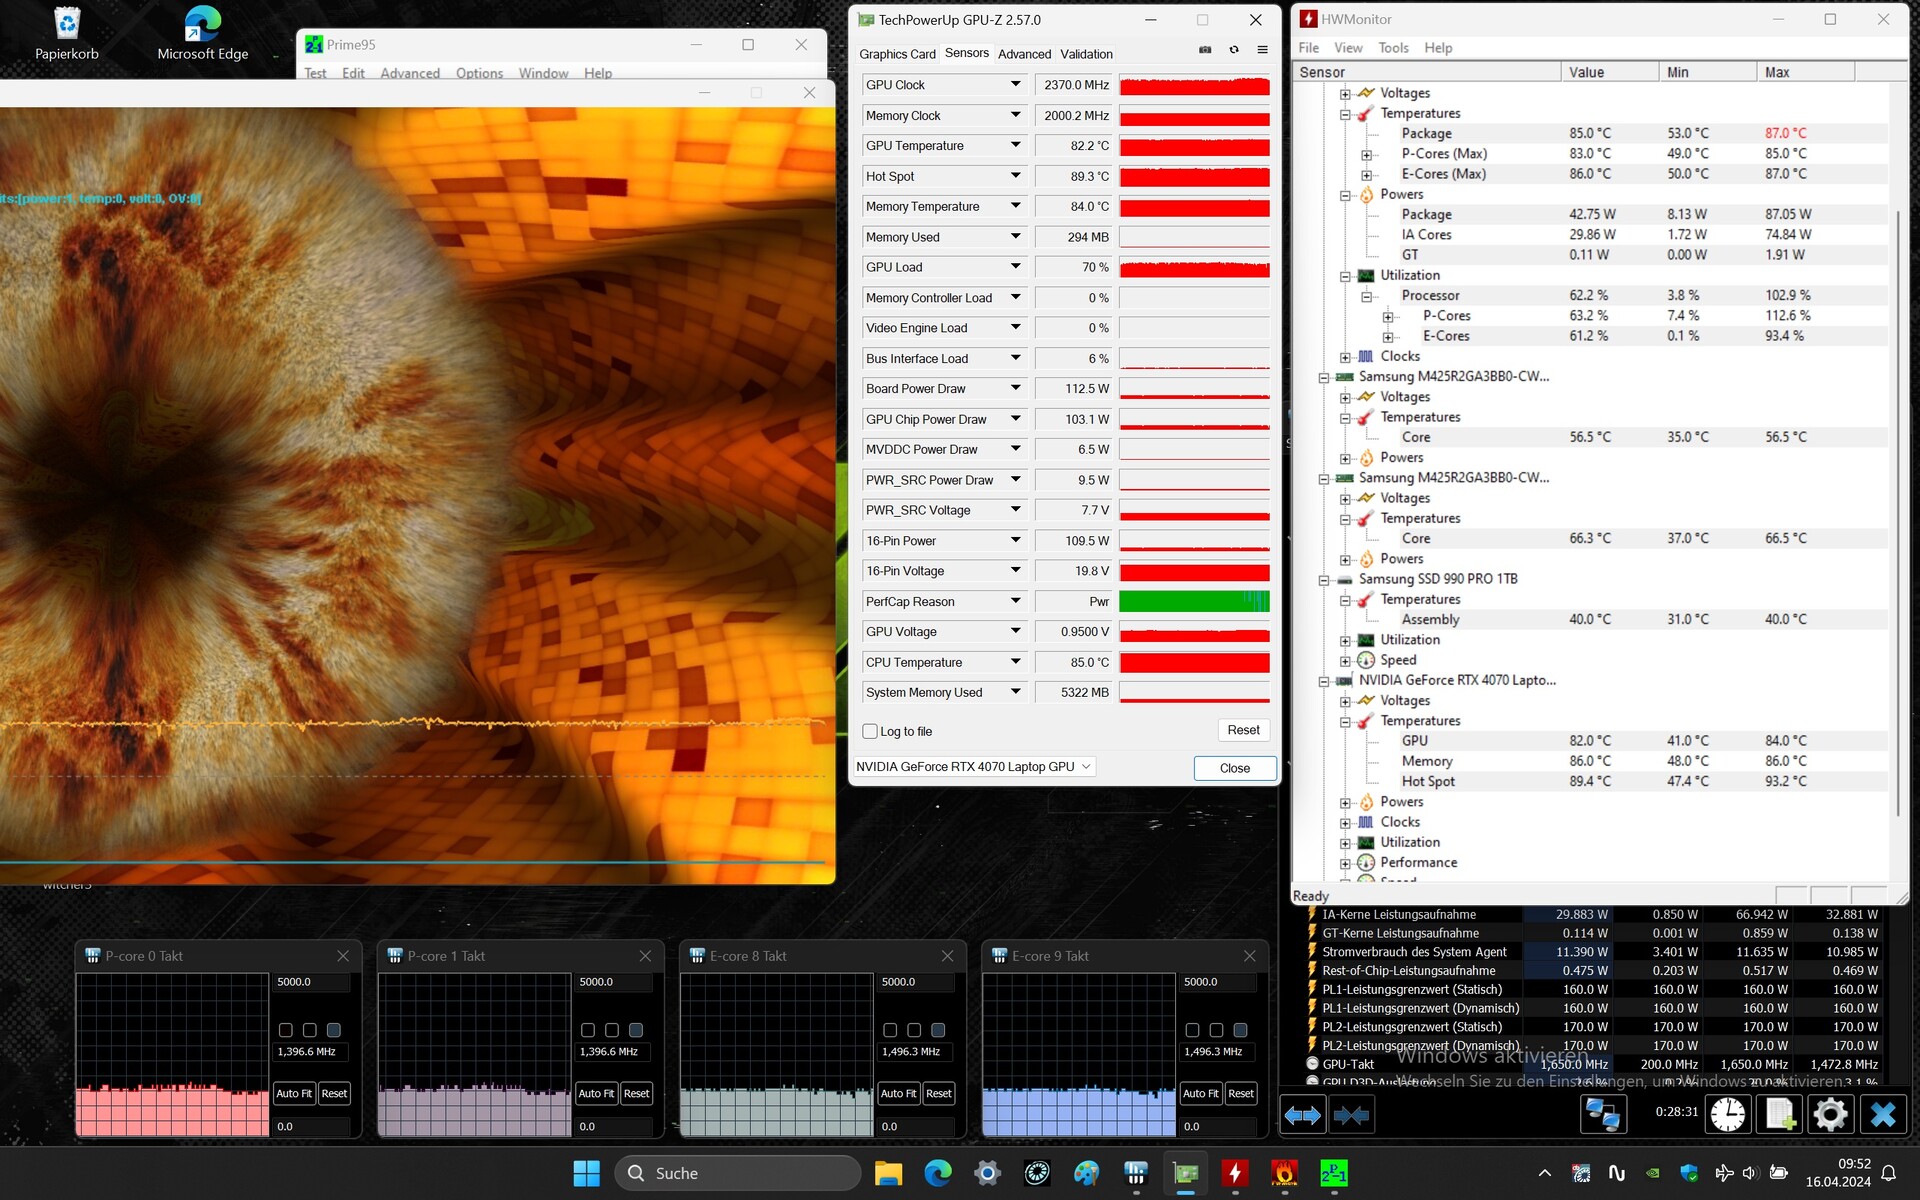
Stress test
The extreme scenario simulated by the stress test (Prime95 and Furmark in continuous operation) checks the system's stability under full load. The CPU clock sank slowly and continuously from values slightly above the base clock rate to values below it. The graphics core ran at high speeds throughout.


Speakers
The laptop's stereo speakers produce a decent sound, but they lack bass. A better sound experience could be achieved by connecting headphones or external speakers.
SCHENKER XMG Fusion 15 (Early 24) audio analysis
(+) | speakers can play relatively loud (85 dB)
Bass 100 - 315 Hz
(-) | nearly no bass - on average 15.8% lower than median
(±) | linearity of bass is average (12.5% delta to prev. frequency)
Mids 400 - 2000 Hz
(+) | balanced mids - only 4.4% away from median
(+) | mids are linear (5.9% delta to prev. frequency)
Highs 2 - 16 kHz
(+) | balanced highs - only 2% away from median
(+) | highs are linear (4.8% delta to prev. frequency)
Overall 100 - 16.000 Hz
(+) | overall sound is linear (11.5% difference to median)
Compared to same class
» 9% of all tested devices in this class were better, 2% similar, 89% worse
» The best had a delta of 6%, average was 18%, worst was 132%
Compared to all devices tested
» 6% of all tested devices were better, 2% similar, 93% worse
» The best had a delta of 4%, average was 25%, worst was 134%
Aorus 16X 2024 audio analysis
(+) | speakers can play relatively loud (85 dB)
Bass 100 - 315 Hz
(±) | reduced bass - on average 8.5% lower than median
(±) | linearity of bass is average (8.3% delta to prev. frequency)
Mids 400 - 2000 Hz
(+) | balanced mids - only 3.1% away from median
(+) | mids are linear (5.8% delta to prev. frequency)
Highs 2 - 16 kHz
(+) | balanced highs - only 2.5% away from median
(±) | linearity of highs is average (7% delta to prev. frequency)
Overall 100 - 16.000 Hz
(+) | overall sound is linear (8.4% difference to median)
Compared to same class
» 1% of all tested devices in this class were better, 1% similar, 98% worse
» The best had a delta of 6%, average was 18%, worst was 132%
Compared to all devices tested
» 1% of all tested devices were better, 0% similar, 98% worse
» The best had a delta of 4%, average was 25%, worst was 134%
Power management - The Fusion 15 delivers very good runtimes
Power consumption
Its power requirement is largely normal for the installed hardware. Exception: Despite a fully charged battery, we measured a power consumption value of about 20 watts with the laptop switched off. This is likely a bug. The Witcher 3 test and stress test ran with slightly sinking power consumption values. The power supply (280 watts) is sufficient in power.
| Idle | |
| Load |
|
| SCHENKER XMG Fusion 15 (Early 24) i9-14900HX, NVIDIA GeForce RTX 4070 Laptop GPU | Aorus 16X 2024 i9-14900HX, NVIDIA GeForce RTX 4070 Laptop GPU | Alienware m16 R2 Ultra 7 155H, NVIDIA GeForce RTX 4070 Laptop GPU | HP Omen Transcend 16-u1095ng i9-14900HX, NVIDIA GeForce RTX 4070 Laptop GPU | Average of class Gaming | |
|---|---|---|---|---|---|
| Power Consumption | -21% | -3% | -10% | -22% | |
| Idle Minimum * | 8 | 13 -63% | 8.1 -1% | 10 -25% | 13.9 ? -74% |
| Idle Average * | 14 | 18 -29% | 13 7% | 18 -29% | 19.2 ? -37% |
| Idle Maximum * | 26 | 35 -35% | 40.3 -55% | 32 -23% | 27.1 ? -4% |
| Load Average * | 118 | 138 -17% | 79 33% | 128 -8% | 110.4 ? 6% |
| Witcher 3 ultra * | 192.7 | 172.6 10% | 188.1 2% | 148.4 23% | |
| Load Maximum * | 244 | 222 9% | 254.9 -4% | 242 1% | 251 ? -3% |
* ... smaller is better
Power consumption Witcher 3 / stress test
Power consumption with external monitor
Runtimes
During our WiFi test (loading websites via a script) and video test (short film Big Buck Bunny (H.264 encoding, FHD) in a loop), we measured runtimes of 8:00 hours and 10:02 hours respectively. These are very good values.

| SCHENKER XMG Fusion 15 (Early 24) i9-14900HX, NVIDIA GeForce RTX 4070 Laptop GPU, 99.8 Wh | Aorus 16X 2024 i9-14900HX, NVIDIA GeForce RTX 4070 Laptop GPU, 99 Wh | Alienware m16 R2 Ultra 7 155H, NVIDIA GeForce RTX 4070 Laptop GPU, 90 Wh | HP Omen Transcend 16-u1095ng i9-14900HX, NVIDIA GeForce RTX 4070 Laptop GPU, 97 Wh | Lenovo Legion Pro 5 16IRX9 i9-14900HX, NVIDIA GeForce RTX 4070 Laptop GPU, 80 Wh | Average of class Gaming | |
|---|---|---|---|---|---|---|
| Battery Runtime | -17% | -26% | -39% | -52% | -36% | |
| Reader / Idle | 911 | 753 -17% | 758 -17% | 403 -56% | 545 ? -40% | |
| H.264 | 602 | 541 -10% | 397 ? -34% | |||
| WiFi v1.3 | 480 | 481 0% | 483 1% | 292 -39% | 290 -40% | 369 ? -23% |
| Load | 164 | 100 -39% | 60 -63% | 65 -60% | 84.8 ? -48% |
Pros
Cons
Verdict - Portable, powerful, persevering

Compact dimensions and low weight (approx. 2.1 kg) don't come at the cost of reduced hardware performance. The Core i9 processor and GeForce RTX 4070 are able to work with consistently high clock rates. The laptop's fusion of performance and portability can be classed as a success.
The XMG Fusion 15 (Early 24)—a powerful, portable laptop for gamers and creators.
The laptop gets quite hot under load and in doing so, it produces quite a bit of noise. More moderate emissions require sacrificing some computing power. Its 15.3-inch screen (2,560 x 1,600 pixels, IPS, 240 Hz, Adaptive Sync) featuring a 16:10 aspect ratio is impressive overall. Its high brightness is noteworthy.
One full charge (99.8 Wh) is enough for practical runtimes of about 8 - 10 hours—very good values. Positive: The battery can be charged via a USB-C power supply (min. 100 watts, 20 V)—the laptop's TB4 port supports Power Delivery. As a result, you don't necessarily have to carry the proprietary power supply (280 watts) with you all the time.
An alternative could be the Aorus 16X (2024). This laptop offers comparable computing power as well as similarly good runtimes.
Price and availability
The XMG Fusion 15 (Early 24) can be configured and ordered directly via Schenker's online shop. The present test device costs around US$2,500. Prices start from approx. US$1,700.
SCHENKER XMG Fusion 15 (Early 24)
-
05/01/2024 v7
Sascha Mölck
More articles related to this device
SCHENKER XMG Fusion 15 (Early 24) (XMG Fusion 15 Series)Related Articles


Transparency
The present review sample was made available to the author as a loan by the manufacturer or a shop for the purposes of review. The lender had no influence on this review, nor did the manufacturer receive a copy of this review before publication. There was no obligation to publish this review.
Pricecompare

