 Deutsch
 English
 Español
 Français
 Italiano
 Nederlands
 Polski
 Português
 Русский
 Türkçe
 Svenska
 Chinese
 Magyar
Schenker Work 14 Base review - The affordable office laptop with lots of ports and a bright IPS display

Schenker's Work 14 Base is a compact office laptop which, aside from a bright and matte IPS display, offers very good upgrade options and a wide variety of ports including Ethernet, which is no longer a given nowadays even on office or business laptops. The Work 14's prices start at US$750 and our test device with 16 GB RAM can currently be found for around US$770.
Possible competitors compared
Rating | Date | Model | Weight | Height | Size | Resolution | Best Price |
|---|---|---|---|---|---|---|---|
| 82 % | 05/2024 | SCHENKER Work 14 Base i5-1235U, Iris Xe G7 80EUs | 1.3 kg | 20.2 mm | 14.00" | 1920x1080 | |
| 85.6 % | 11/2023 | Acer Swift Go 14 SFG14-71 i5-1335U, Iris Xe G7 80EUs | 1.3 kg | 14.9 mm | 14.00" | 2880x1800 | |
| 84.6 % | 10/2023 | HP ProBook 445 G10 R5 7530U, Vega 7 | 1.3 kg | 20 mm | 14.00" | 1920x1080 | |
| 85.3 % | 06/2023 | Dell Latitude 3440 i5-1345U, Iris Xe G7 80EUs | 1.5 kg | 19.4 mm | 14.00" | 1920x1080 | |
| 88.6 % | 08/2023 | Lenovo ThinkPad L14 G4 21H6S00900 R5 7530U, Vega 7 | 1.5 kg | 19.83 mm | 14.00" | 1920x1080 |
Case & connectivity
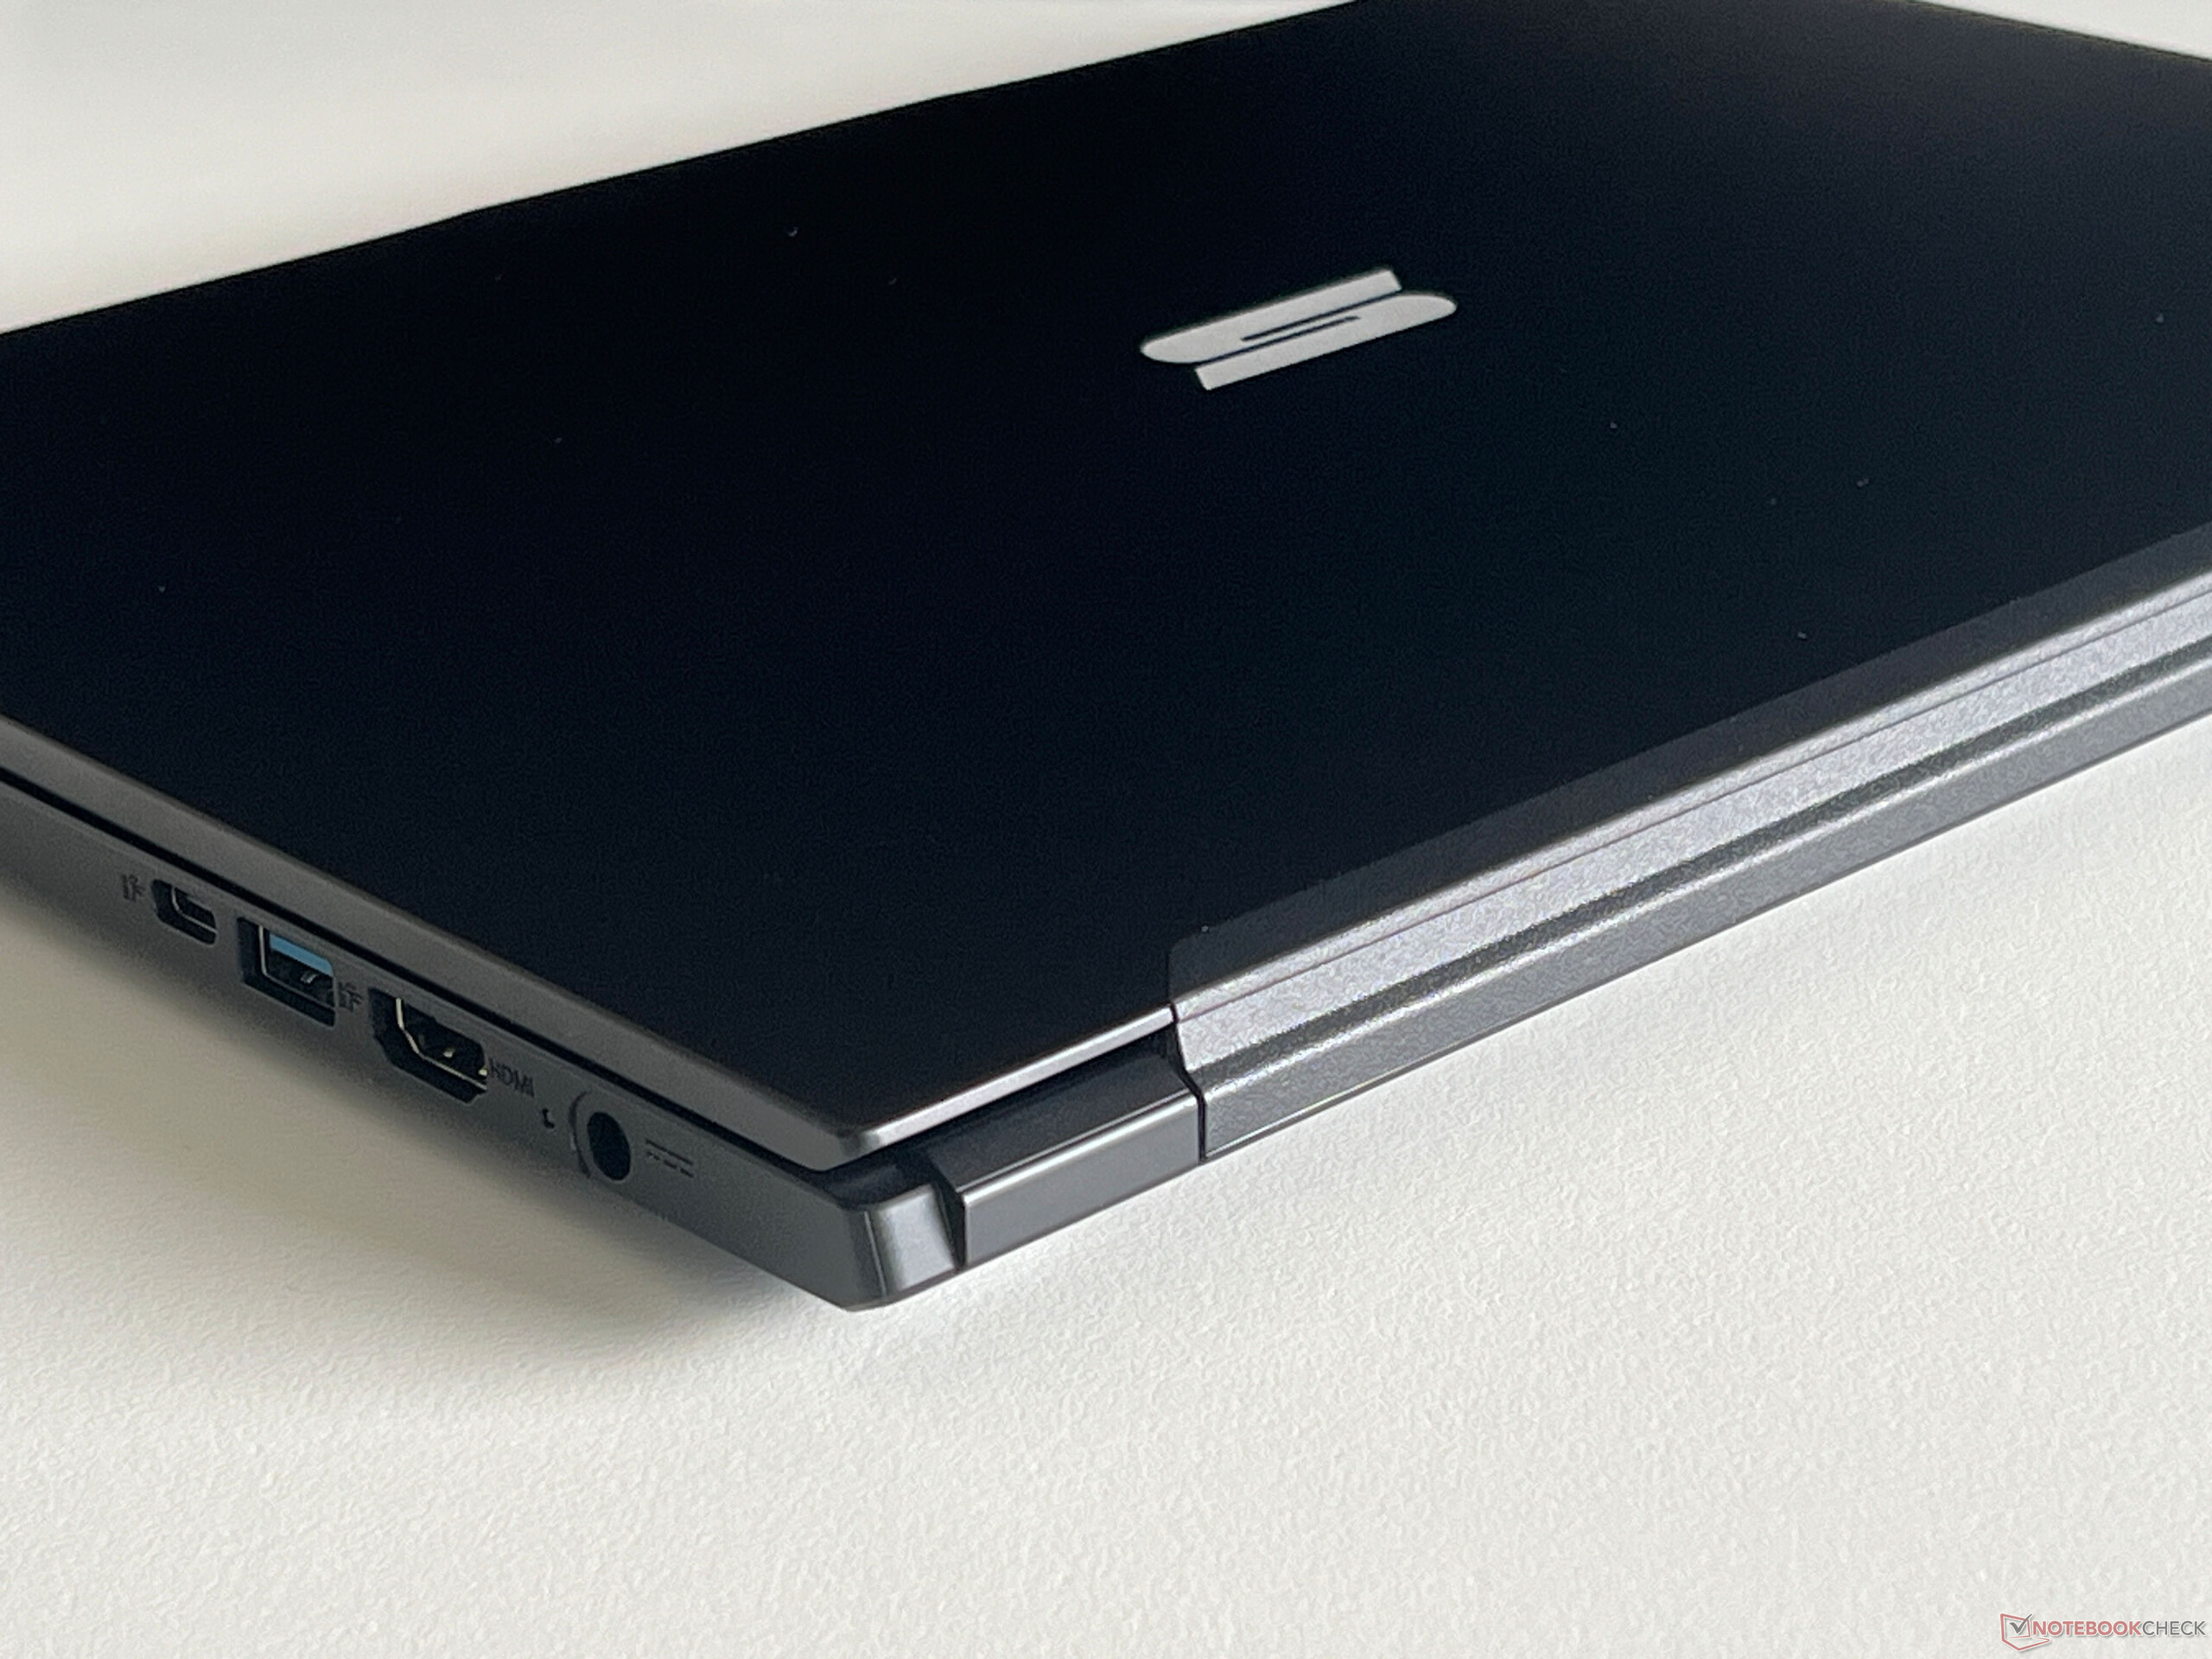
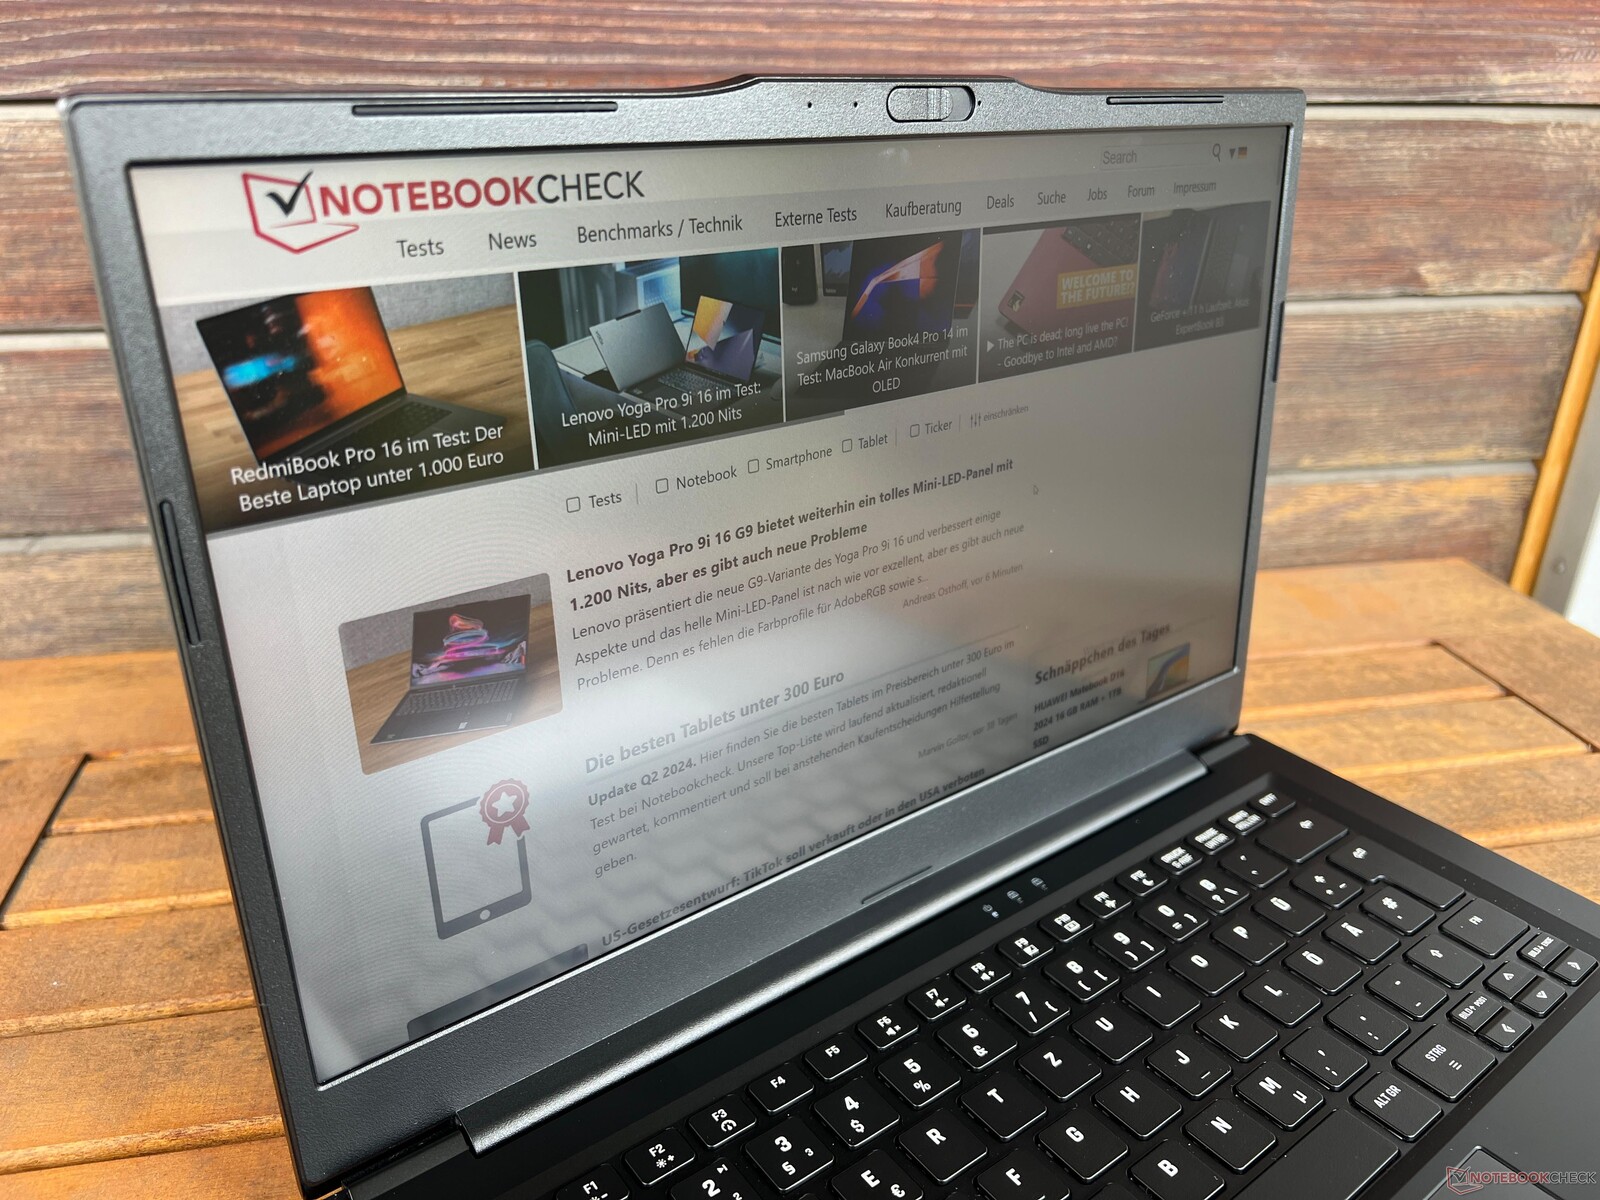
The Work 14 Base uses a black aluminum case and at first glance, it makes quite a high-quality impression. However, its smooth surfaces are extreme fingerprint magnets and require frequent cleaning. For a surcharge, you can get the laptop without the Schenker logo on the lid. As soon as you open the lid, which works very easily thanks to the not particularly attractive camera hump, you are greeted by a 16:9 panel with a wide frame along the bottom which is made from rough plastic. This doesn't look particularly modern anymore. Its stability is okay, however, we noted some slight creaking noises when twisting the laptop and, more notably, when opening the display (max. opening angle 180 degrees).
The bottom cover is secured by normal Philips screws and can be removed easily. The laptop's upgrade options are excellent, as there are two RAM slots available and, of course, the SSD and WLAN models can be upgraded as well. This device is actually already fitted with quite a modern WLAN module from Intel (AX211) and its transfer rates are great, too.
Connectivity options are another of the Work 14's strengths. Although you will have to go without USB 4.0 and Thunderbolt, it features enough USB connections and you can also make use of USB-C docking stations without any issues. In addition, it features a Gigabit Ethernet port. Its 1080p webcam including a mechanical cover takes average-looking photos.


| SD Card Reader | |
| average JPG Copy Test (av. of 3 runs) | |
| SCHENKER Work 14 Base (Angelbird AV Pro V60) | |
| Lenovo ThinkPad L14 G4 21H6S00900 | |
| Average of class Office (8 - 82.7, n=47, last 2 years) | |
| Acer Swift Go 14 SFG14-71 | |
| maximum AS SSD Seq Read Test (1GB) | |
| Lenovo ThinkPad L14 G4 21H6S00900 (AV Pro V60) | |
| SCHENKER Work 14 Base (Angelbird AV Pro V60) | |
| Average of class Office (25 - 90.5, n=41, last 2 years) | |
| Acer Swift Go 14 SFG14-71 (AV Pro SD microSD 128 GB V60) | |
| Networking | |
| SCHENKER Work 14 Base | |
| iperf3 transmit AXE11000 |
|
| iperf3 receive AXE11000 |
|
| Acer Swift Go 14 SFG14-71 | |
| iperf3 transmit AXE11000 |
|
| iperf3 receive AXE11000 |
|
| iperf3 transmit AXE11000 6GHz |
|
| iperf3 receive AXE11000 6GHz |
|
| HP ProBook 445 G10 | |
| iperf3 transmit AXE11000 |
|
| iperf3 receive AXE11000 |
|
| Dell Latitude 3440 | |
| iperf3 transmit AXE11000 |
|
| iperf3 receive AXE11000 |
|
| iperf3 transmit AXE11000 6GHz |
|
| iperf3 receive AXE11000 6GHz |
|
| Lenovo ThinkPad L14 G4 21H6S00900 | |
| iperf3 transmit AXE11000 |
|
| iperf3 receive AXE11000 |
|
| iperf3 transmit AXE11000 6GHz |
|
| iperf3 receive AXE11000 6GHz |
|

")
")
Input devices
The laptop's black chiclet keyboard is backlit and feels comfortable to type on, however, the keys are a little slimmer than usual and in general, they are quite small. The arrow keys are actually even smaller but there are at least dedicated picture up/picture down keys. The Microsoft Precision touchpad is big enough to be used comfortably (12.1 x 7.3 cm) and is fitted with a fingerprint scanner on the top left corner. On the other hand, it isn't totally smooth and you'll notice a bit of resistance during use. Furthermore, its click noises sound very loud and cheap, meaning we would recommend only tapping the pad for inputs instead of pressing down.


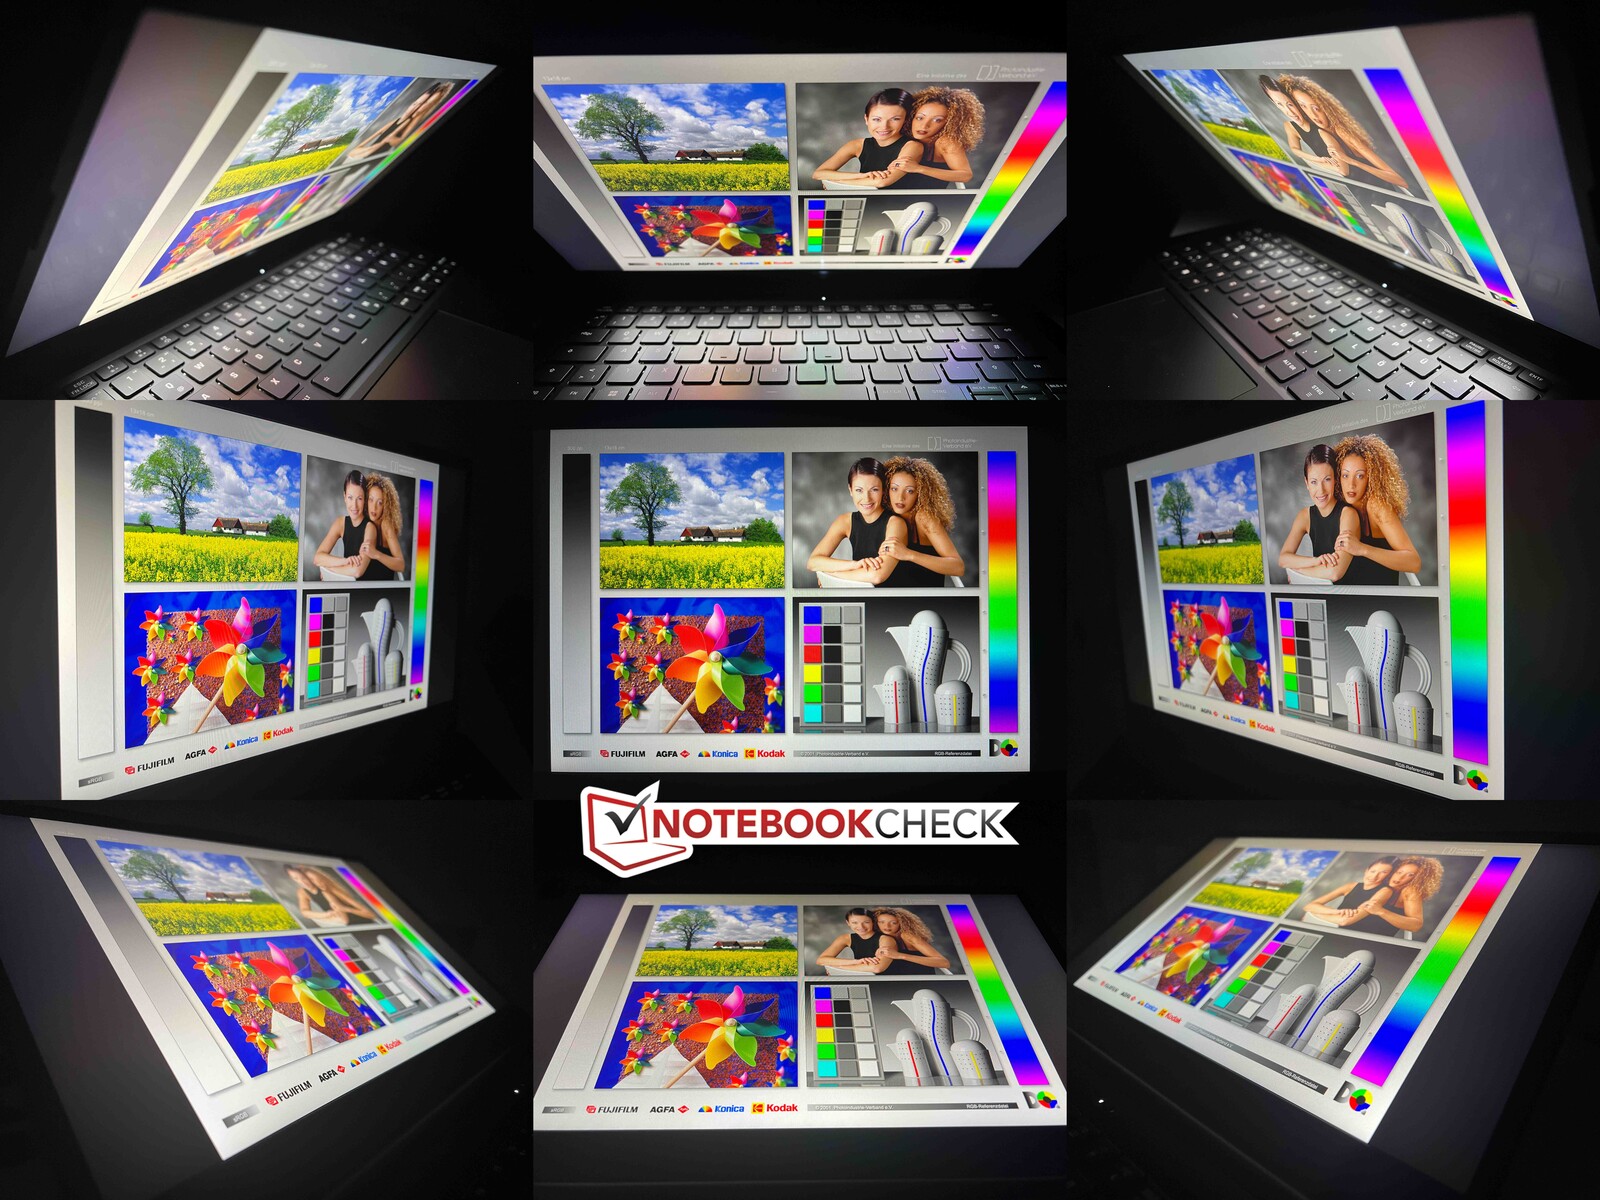
Display - Matte IPS panel
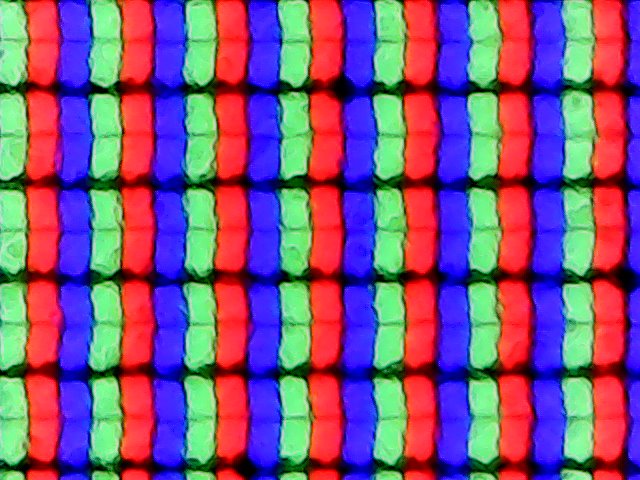

The Work 14 is equipped with a matte IPS panel (60 Hz) from AU Optronics which features a resolution of 1,920 x 1,080 pixels. This means it is still a 16:9 panel, but most of its competitors' screens have the same aspect ratio. Subjectively, the picture quality suffers slightly as a result of its grainy appearance, however, content is sharp enough and the screen doesn't make use of PWM. Backlight bleeding is not an issue, but its response times are very slow and we noted considerable amounts of ghosting. In direct comparison, the Acer Swift Go offers a much better subjective picture quality with its OLED panel but in turn, users have to deal with constant PWM flickering.
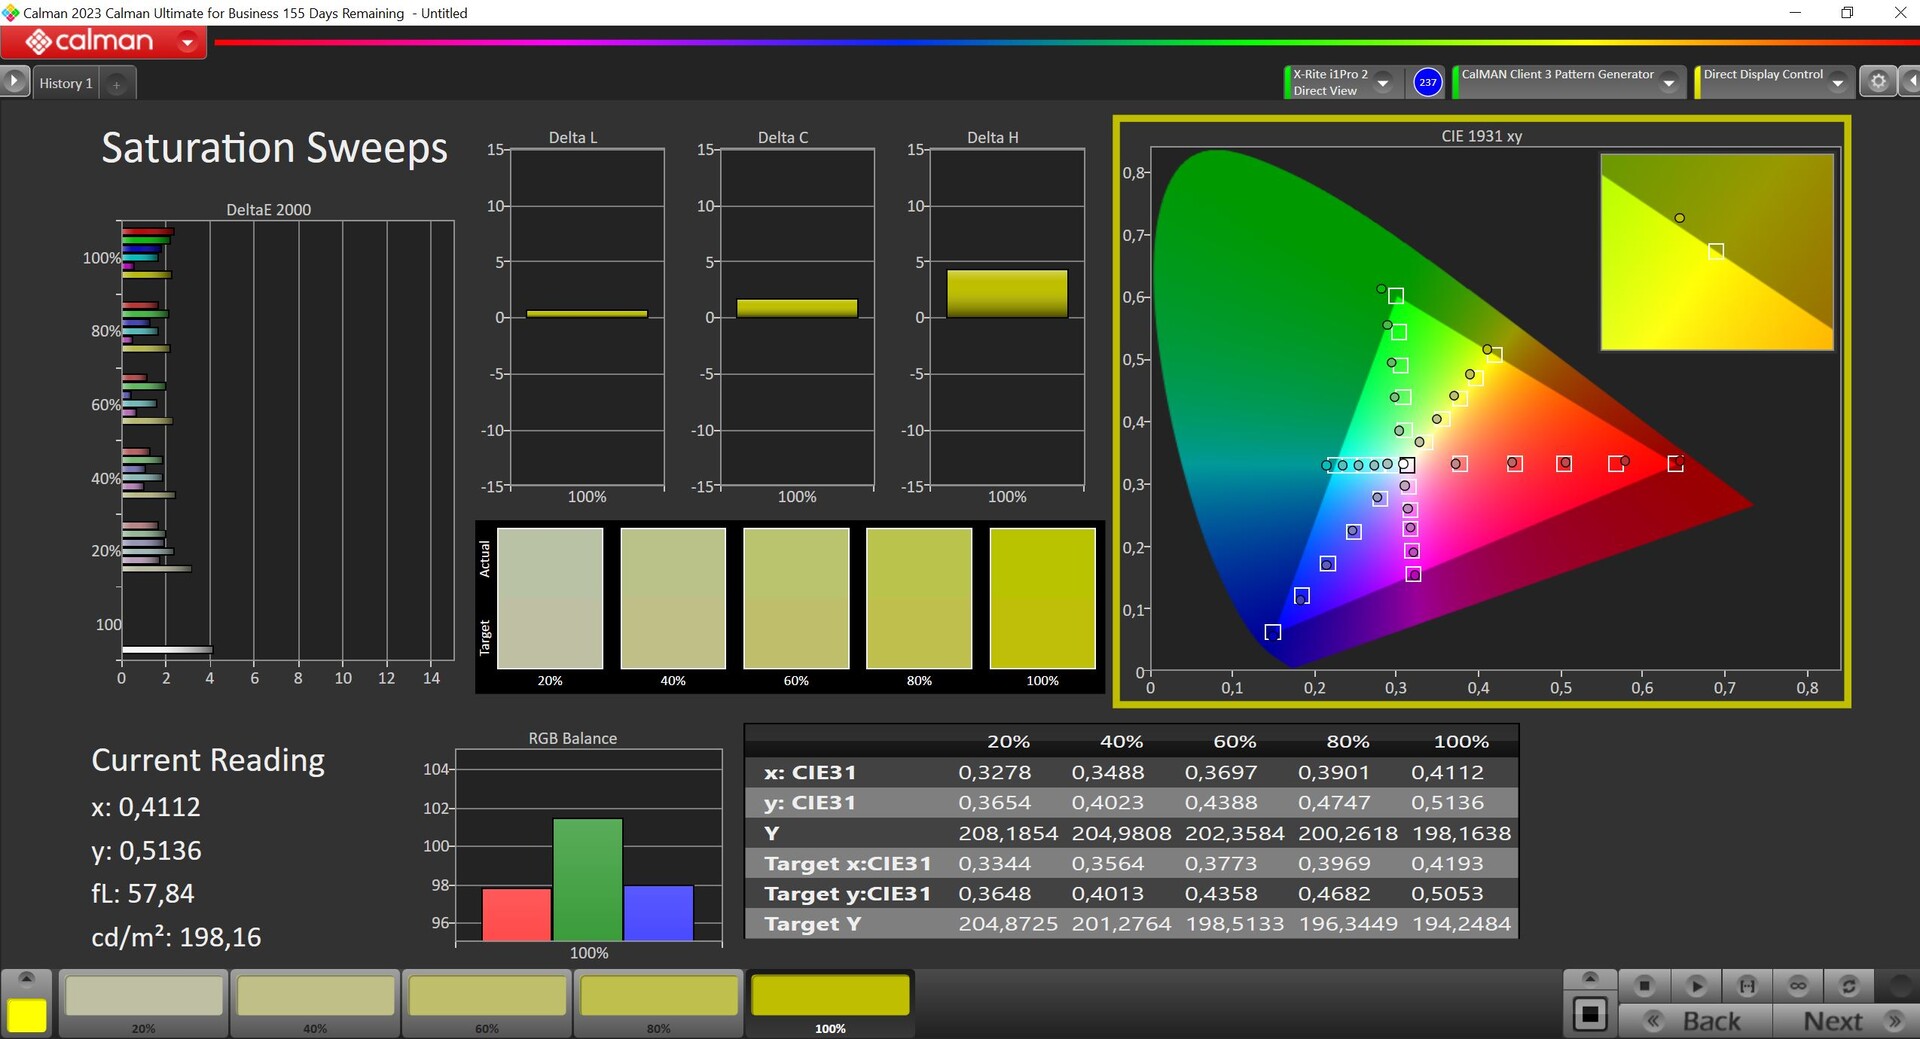
The manufacturer states a typical brightness of 300 cd/m² and our test device even showed much better results on average, namely over 400 cd/m². Moreover, its black value is very low at 0.16 cd/m², leading to a high maximum contrast ratio. Its calibration is decent straight out of the box and this shouldn't lead to any problems in everyday use. If you calibrate the screen yourself, you can improve its depiction ever so slightly but this comes at the cost of some brightness. It covers the smaller sRGB color space almost completely. Outside, the panel makes quite a good impression and its viewing-angle stability is fine.
| |||||||||||||||||||||||||
Brightness Distribution: 89 %
Center on Battery: 402 cd/m²
Contrast: 2513:1 (Black: 0.16 cd/m²)
ΔE Color 2.2 | 0.5-29.43 Ø5, calibrated: 1.3
ΔE Greyscale 3 | 0.57-98 Ø5.3
73.8% AdobeRGB 1998 (Argyll 2.2.0 3D)
99.8% sRGB (Argyll 2.2.0 3D)
72.4% Display P3 (Argyll 2.2.0 3D)
Gamma: 2.18
| SCHENKER Work 14 Base B140HAN06.8, IPS, 1920x1080, 14.00 | Acer Swift Go 14 SFG14-71 Samsung ATNA40YK11-0, OLED, 2880x1800, 14.00 | HP ProBook 445 G10 AUO2FA6, IPS, 1920x1080, 14.00 | Dell Latitude 3440 BOE NE140FH, IPS, 1920x1080, 14.00 | Lenovo ThinkPad L14 G4 21H6S00900 B140HAN06.9, IPS LED, 1920x1080, 14.00 | |
|---|---|---|---|---|---|
| Display | 22% | -5% | -42% | 0% | |
| Display P3 Coverage | 72.4 | 99.9 38% | 68.4 -6% | 40.4 -44% | 73.2 1% |
| sRGB Coverage | 99.8 | 100 0% | 95.2 -5% | 60.7 -39% | 98.9 -1% |
| AdobeRGB 1998 Coverage | 73.8 | 95.4 29% | 70.6 -4% | 41.8 -43% | 73.9 0% |
| Response Times | 96% | 24% | 28% | 5% | |
| Response Time Grey 50% / Grey 80% * | 60 ? | 1.85 ? 97% | 53.4 ? 11% | 35.3 ? 41% | 58.1 ? 3% |
| Response Time Black / White * | 34.7 ? | 2 ? 94% | 21.8 ? 37% | 29.8 ? 14% | 32.7 ? 6% |
| PWM Frequency | 357 ? | ||||
| Screen | -8% | -15% | -67% | -18% | |
| Brightness middle | 402 | 278 -31% | 501 25% | 292.6 -27% | 430 7% |
| Brightness | 404 | 279 -31% | 464 15% | 270 -33% | 409 1% |
| Brightness Distribution | 89 | 96 8% | 87 -2% | 88 -1% | 88 -1% |
| Black Level * | 0.16 | 0.04 75% | 0.26 -63% | 0.19 -19% | 0.31 -94% |
| Contrast | 2513 | 6950 177% | 1927 -23% | 1540 -39% | 1387 -45% |
| Colorchecker dE 2000 * | 2.2 | 3.01 -37% | 2.64 -20% | 4.63 -110% | 2.4 -9% |
| Colorchecker dE 2000 max. * | 4.2 | 4.43 -5% | 5.06 -20% | 17.1 -307% | 4.7 -12% |
| Colorchecker dE 2000 calibrated * | 1.3 | 4.14 -218% | 1.57 -21% | 2.13 -64% | 1.4 -8% |
| Greyscale dE 2000 * | 3 | 3.2 -7% | 3.8 -27% | 3.2 -7% | 3 -0% |
| Gamma | 2.18 101% | 2.194 100% | 2.103 105% | 2.34 94% | 2.3 96% |
| CCT | 6801 96% | 6126 106% | 6562 99% | 7184 90% | 6489 100% |
| Total Average (Program / Settings) | 37% /
14% | 1% /
-7% | -27% /
-48% | -4% /
-11% |
* ... smaller is better


Display Response Times
| ↔ Response Time Black to White | ||
|---|---|---|
| 34.7 ms ... rise ↗ and fall ↘ combined | ↗ 17 ms rise |  |
| ↘ 17.7 ms fall | ||
| The screen shows slow response rates in our tests and will be unsatisfactory for gamers. In comparison, all tested devices range from 0.1 (minimum) to 240 (maximum) ms. » 91 % of all devices are better. This means that the measured response time is worse than the average of all tested devices (21.4 ms). | ||
| ↔ Response Time 50% Grey to 80% Grey | ||
| 60 ms ... rise ↗ and fall ↘ combined | ↗ 27.5 ms rise |  |
| ↘ 32.5 ms fall | ||
| The screen shows slow response rates in our tests and will be unsatisfactory for gamers. In comparison, all tested devices range from 0.2 (minimum) to 636 (maximum) ms. » 95 % of all devices are better. This means that the measured response time is worse than the average of all tested devices (33.7 ms). | ||
Screen Flickering / PWM (Pulse-Width Modulation)
| Screen flickering / PWM not detected |  | ||
In comparison: 53 % of all tested devices do not use PWM to dim the display. If PWM was detected, an average of 17803 (minimum: 5 - maximum: 3846000) Hz was measured. | |||


Performance - The Work 14 with Alder Lake


Testing conditions
Schenker offers various performance profiles. We carried out the following benchmarks and measurements using entertainment mode, which is active by default.
Processor - Core i5-1235U
The Core i5-1235U is from Intel's Alder Lake generation, features 10 cores (2x performance, 8x efficiency) and is run at 25/20 watts within the Work 14. Of course, you shouldn't expect any performance miracles, however, its overall performance is comparable with the Core i5-1345U inside the Dell Latitude 14. The CPU performance is definitely good enough for simple everyday tasks when working from home or in the office and in addition, the laptop doesn't feel too slow. In turn, you'll have to make do without an NPU for AI applications. In battery use, the processor is allowed to consume a maximum of 15 watts, which is why its performance is then 20 % lower. Further CPU benchmarks can be found here.
Cinebench R15 Multi continuous test
Cinebench R23: Multi Core | Single Core
Cinebench R20: CPU (Multi Core) | CPU (Single Core)
Cinebench R15: CPU Multi 64Bit | CPU Single 64Bit
Blender: v2.79 BMW27 CPU
7-Zip 18.03: 7z b 4 | 7z b 4 -mmt1
Geekbench 6.2: Multi-Core | Single-Core
Geekbench 5.5: Multi-Core | Single-Core
HWBOT x265 Benchmark v2.2: 4k Preset
LibreOffice : 20 Documents To PDF
R Benchmark 2.5: Overall mean
| CPU Performance Rating | |
| Acer Swift Go 14 SFG14-71 | |
| Lenovo ThinkPad L14 G4 21H6S00900 -2! | |
| Dell Latitude 3440 -2! | |
| HP ProBook 445 G10 | |
| Average of class Office | |
| SCHENKER Work 14 Base | |
| Average Intel Core i5-1235U | |
| Cinebench R23 / Multi Core | |
| Lenovo ThinkPad L14 G4 21H6S00900 | |
| Average of class Office (1056 - 15743, n=120, last 2 years) | |
| HP ProBook 445 G10 | |
| Acer Swift Go 14 SFG14-71 | |
| Dell Latitude 3440 | |
| SCHENKER Work 14 Base | |
| Average Intel Core i5-1235U (2485 - 9208, n=8) | |
| Cinebench R23 / Single Core | |
| Dell Latitude 3440 | |
| Average Intel Core i5-1235U (1444 - 1698, n=8) | |
| SCHENKER Work 14 Base | |
| Acer Swift Go 14 SFG14-71 | |
| Average of class Office (529 - 1995, n=120, last 2 years) | |
| HP ProBook 445 G10 | |
| Lenovo ThinkPad L14 G4 21H6S00900 | |
| Cinebench R20 / CPU (Multi Core) | |
| Lenovo ThinkPad L14 G4 21H6S00900 | |
| Average of class Office (356 - 5904, n=118, last 2 years) | |
| HP ProBook 445 G10 | |
| Acer Swift Go 14 SFG14-71 | |
| Dell Latitude 3440 | |
| SCHENKER Work 14 Base | |
| Average Intel Core i5-1235U (1783 - 3537, n=8) | |
| Cinebench R20 / CPU (Single Core) | |
| Dell Latitude 3440 | |
| SCHENKER Work 14 Base | |
| Average Intel Core i5-1235U (566 - 651, n=8) | |
| Acer Swift Go 14 SFG14-71 | |
| HP ProBook 445 G10 | |
| Lenovo ThinkPad L14 G4 21H6S00900 | |
| Average of class Office (181.3 - 764, n=118, last 2 years) | |
| Cinebench R15 / CPU Multi 64Bit | |
| Lenovo ThinkPad L14 G4 21H6S00900 | |
| Average of class Office (160.8 - 2642, n=118, last 2 years) | |
| Acer Swift Go 14 SFG14-71 | |
| HP ProBook 445 G10 | |
| Dell Latitude 3440 | |
| Average Intel Core i5-1235U (785 - 1587, n=8) | |
| SCHENKER Work 14 Base | |
| Cinebench R15 / CPU Single 64Bit | |
| Dell Latitude 3440 | |
| Acer Swift Go 14 SFG14-71 | |
| HP ProBook 445 G10 | |
| Lenovo ThinkPad L14 G4 21H6S00900 | |
| SCHENKER Work 14 Base | |
| Average of class Office (82.6 - 284, n=116, last 2 years) | |
| Average Intel Core i5-1235U (151.5 - 242, n=8) | |
| Blender / v2.79 BMW27 CPU | |
| Average of class Office (214 - 2844, n=119, last 2 years) | |
| SCHENKER Work 14 Base | |
| Average Intel Core i5-1235U (366 - 662, n=8) | |
| Dell Latitude 3440 | |
| Acer Swift Go 14 SFG14-71 | |
| Lenovo ThinkPad L14 G4 21H6S00900 | |
| HP ProBook 445 G10 | |
| 7-Zip 18.03 / 7z b 4 | |
| HP ProBook 445 G10 | |
| Lenovo ThinkPad L14 G4 21H6S00900 | |
| Dell Latitude 3440 | |
| Average of class Office (4226 - 62349, n=119, last 2 years) | |
| Acer Swift Go 14 SFG14-71 | |
| Average Intel Core i5-1235U (20166 - 38643, n=8) | |
| SCHENKER Work 14 Base | |
| 7-Zip 18.03 / 7z b 4 -mmt1 | |
| Dell Latitude 3440 | |
| HP ProBook 445 G10 | |
| Lenovo ThinkPad L14 G4 21H6S00900 | |
| SCHENKER Work 14 Base | |
| Acer Swift Go 14 SFG14-71 | |
| Average of class Office (2233 - 6687, n=119, last 2 years) | |
| Average Intel Core i5-1235U (4371 - 5233, n=8) | |
| Geekbench 6.2 / Multi-Core | |
| Acer Swift Go 14 SFG14-71 | |
| Average of class Office (662 - 12171, n=42, last 2 years) | |
| Average Intel Core i5-1235U (6703 - 7046, n=2) | |
| SCHENKER Work 14 Base | |
| HP ProBook 445 G10 | |
| Geekbench 6.2 / Single-Core | |
| Acer Swift Go 14 SFG14-71 | |
| Average of class Office (457 - 2646, n=41, last 2 years) | |
| Average Intel Core i5-1235U (1981 - 2208, n=2) | |
| SCHENKER Work 14 Base | |
| HP ProBook 445 G10 | |
| Geekbench 5.5 / Multi-Core | |
| Acer Swift Go 14 SFG14-71 | |
| Average Intel Core i5-1235U (5528 - 8571, n=10) | |
| Average of class Office (1018 - 11980, n=120, last 2 years) | |
| Dell Latitude 3440 | |
| SCHENKER Work 14 Base | |
| HP ProBook 445 G10 | |
| Lenovo ThinkPad L14 G4 21H6S00900 | |
| Geekbench 5.5 / Single-Core | |
| Dell Latitude 3440 | |
| Acer Swift Go 14 SFG14-71 | |
| SCHENKER Work 14 Base | |
| Average Intel Core i5-1235U (1426 - 1643, n=10) | |
| Average of class Office (510 - 1974, n=120, last 2 years) | |
| HP ProBook 445 G10 | |
| Lenovo ThinkPad L14 G4 21H6S00900 | |
| HWBOT x265 Benchmark v2.2 / 4k Preset | |
| Lenovo ThinkPad L14 G4 21H6S00900 | |
| HP ProBook 445 G10 | |
| Average of class Office (1.55 - 17.4, n=118, last 2 years) | |
| Acer Swift Go 14 SFG14-71 | |
| Dell Latitude 3440 | |
| SCHENKER Work 14 Base | |
| Average Intel Core i5-1235U (4.99 - 9.43, n=8) | |
| LibreOffice / 20 Documents To PDF | |
| Acer Swift Go 14 SFG14-71 | |
| Average of class Office (31.3 - 117.5, n=118, last 2 years) | |
| HP ProBook 445 G10 | |
| Average Intel Core i5-1235U (42.4 - 65.5, n=8) | |
| Dell Latitude 3440 | |
| SCHENKER Work 14 Base | |
| Lenovo ThinkPad L14 G4 21H6S00900 | |
| R Benchmark 2.5 / Overall mean | |
| Average of class Office (0.4244 - 1.397, n=117, last 2 years) | |
| Lenovo ThinkPad L14 G4 21H6S00900 | |
| HP ProBook 445 G10 | |
| Average Intel Core i5-1235U (0.4986 - 0.603, n=8) | |
| Acer Swift Go 14 SFG14-71 | |
| SCHENKER Work 14 Base | |
| Dell Latitude 3440 | |
* ... smaller is better
AIDA64: FP32 Ray-Trace | FPU Julia | CPU SHA3 | CPU Queen | FPU SinJulia | FPU Mandel | CPU AES | CPU ZLib | FP64 Ray-Trace | CPU PhotoWorxx
| Performance Rating | |
| Lenovo ThinkPad L14 G4 21H6S00900 | |
| HP ProBook 445 G10 | |
| Average of class Office | |
| Dell Latitude 3440 | |
| Acer Swift Go 14 SFG14-71 | |
| Average Intel Core i5-1235U | |
| SCHENKER Work 14 Base | |
| AIDA64 / FP32 Ray-Trace | |
| HP ProBook 445 G10 | |
| Lenovo ThinkPad L14 G4 21H6S00900 | |
| Average of class Office (763 - 24250, n=118, last 2 years) | |
| Dell Latitude 3440 | |
| Acer Swift Go 14 SFG14-71 | |
| SCHENKER Work 14 Base | |
| Average Intel Core i5-1235U (3078 - 7457, n=8) | |
| AIDA64 / FPU Julia | |
| Lenovo ThinkPad L14 G4 21H6S00900 | |
| HP ProBook 445 G10 | |
| Average of class Office (4027 - 102228, n=118, last 2 years) | |
| Dell Latitude 3440 | |
| Acer Swift Go 14 SFG14-71 | |
| SCHENKER Work 14 Base | |
| Average Intel Core i5-1235U (15838 - 37760, n=8) | |
| AIDA64 / CPU SHA3 | |
| Lenovo ThinkPad L14 G4 21H6S00900 | |
| Average of class Office (279 - 4442, n=117, last 2 years) | |
| HP ProBook 445 G10 | |
| Dell Latitude 3440 | |
| SCHENKER Work 14 Base | |
| Acer Swift Go 14 SFG14-71 | |
| Average Intel Core i5-1235U (978 - 2072, n=8) | |
| AIDA64 / CPU Queen | |
| Lenovo ThinkPad L14 G4 21H6S00900 | |
| HP ProBook 445 G10 | |
| Average of class Office (8031 - 113016, n=118, last 2 years) | |
| Dell Latitude 3440 | |
| Average Intel Core i5-1235U (45680 - 62404, n=8) | |
| Acer Swift Go 14 SFG14-71 | |
| SCHENKER Work 14 Base | |
| AIDA64 / FPU SinJulia | |
| HP ProBook 445 G10 | |
| Lenovo ThinkPad L14 G4 21H6S00900 | |
| Average of class Office (404 - 14288, n=118, last 2 years) | |
| Dell Latitude 3440 | |
| Average Intel Core i5-1235U (3099 - 4644, n=8) | |
| Acer Swift Go 14 SFG14-71 | |
| SCHENKER Work 14 Base | |
| AIDA64 / FPU Mandel | |
| Lenovo ThinkPad L14 G4 21H6S00900 | |
| HP ProBook 445 G10 | |
| Average of class Office (2054 - 54365, n=118, last 2 years) | |
| Dell Latitude 3440 | |
| Acer Swift Go 14 SFG14-71 | |
| SCHENKER Work 14 Base | |
| Average Intel Core i5-1235U (8046 - 18819, n=8) | |
| AIDA64 / CPU AES | |
| Lenovo ThinkPad L14 G4 21H6S00900 | |
| Average of class Office (5226 - 147611, n=118, last 2 years) | |
| Dell Latitude 3440 | |
| Average Intel Core i5-1235U (23386 - 67140, n=8) | |
| Acer Swift Go 14 SFG14-71 | |
| HP ProBook 445 G10 | |
| SCHENKER Work 14 Base | |
| AIDA64 / CPU ZLib | |
| Dell Latitude 3440 | |
| Average of class Office (67.6 - 1018, n=118, last 2 years) | |
| HP ProBook 445 G10 | |
| Lenovo ThinkPad L14 G4 21H6S00900 | |
| SCHENKER Work 14 Base | |
| Average Intel Core i5-1235U (329 - 633, n=8) | |
| Acer Swift Go 14 SFG14-71 | |
| AIDA64 / FP64 Ray-Trace | |
| HP ProBook 445 G10 | |
| Lenovo ThinkPad L14 G4 21H6S00900 | |
| Average of class Office (432 - 12755, n=118, last 2 years) | |
| Dell Latitude 3440 | |
| SCHENKER Work 14 Base | |
| Acer Swift Go 14 SFG14-71 | |
| Average Intel Core i5-1235U (1670 - 3928, n=8) | |
| AIDA64 / CPU PhotoWorxx | |
| Acer Swift Go 14 SFG14-71 | |
| Average Intel Core i5-1235U (15933 - 41909, n=8) | |
| SCHENKER Work 14 Base | |
| Average of class Office (4814 - 48177, n=118, last 2 years) | |
| Dell Latitude 3440 | |
| HP ProBook 445 G10 | |
| Lenovo ThinkPad L14 G4 21H6S00900 | |
System performance
In everyday use, the laptop's performance is decent, although its PCIe SSD also plays a role in this. During our test, we at no point noted any problems with its system stability and if required, the device's RAM can be expanded to up to 64 GB.
CrossMark: Overall | Productivity | Creativity | Responsiveness
WebXPRT 3: Overall
WebXPRT 4: Overall
Mozilla Kraken 1.1: Total
| PCMark 10 / Score | |
| Lenovo ThinkPad L14 G4 21H6S00900 | |
| HP ProBook 445 G10 | |
| Average of class Office (2325 - 7157, n=103, last 2 years) | |
| Acer Swift Go 14 SFG14-71 | |
| Dell Latitude 3440 | |
| Average Intel Core i5-1235U, Intel Iris Xe Graphics G7 80EUs (4528 - 5543, n=8) | |
| SCHENKER Work 14 Base | |
| PCMark 10 / Essentials | |
| Lenovo ThinkPad L14 G4 21H6S00900 | |
| Dell Latitude 3440 | |
| HP ProBook 445 G10 | |
| Acer Swift Go 14 SFG14-71 | |
| Average Intel Core i5-1235U, Intel Iris Xe Graphics G7 80EUs (9143 - 11273, n=8) | |
| Average of class Office (5095 - 20841, n=103, last 2 years) | |
| SCHENKER Work 14 Base | |
| PCMark 10 / Productivity | |
| HP ProBook 445 G10 | |
| Lenovo ThinkPad L14 G4 21H6S00900 | |
| Average of class Office (3041 - 10198, n=103, last 2 years) | |
| Acer Swift Go 14 SFG14-71 | |
| Dell Latitude 3440 | |
| Average Intel Core i5-1235U, Intel Iris Xe Graphics G7 80EUs (6440 - 7354, n=8) | |
| SCHENKER Work 14 Base | |
| PCMark 10 / Digital Content Creation | |
| Acer Swift Go 14 SFG14-71 | |
| Average of class Office (1912 - 9056, n=103, last 2 years) | |
| Dell Latitude 3440 | |
| SCHENKER Work 14 Base | |
| Lenovo ThinkPad L14 G4 21H6S00900 | |
| Average Intel Core i5-1235U, Intel Iris Xe Graphics G7 80EUs (4220 - 5839, n=8) | |
| HP ProBook 445 G10 | |
| CrossMark / Overall | |
| Acer Swift Go 14 SFG14-71 | |
| Dell Latitude 3440 | |
| Average Intel Core i5-1235U, Intel Iris Xe Graphics G7 80EUs (983 - 1644, n=8) | |
| Average of class Office (348 - 1891, n=104, last 2 years) | |
| SCHENKER Work 14 Base | |
| Lenovo ThinkPad L14 G4 21H6S00900 | |
| CrossMark / Productivity | |
| Acer Swift Go 14 SFG14-71 | |
| Dell Latitude 3440 | |
| Average Intel Core i5-1235U, Intel Iris Xe Graphics G7 80EUs (1026 - 1676, n=8) | |
| Average of class Office (393 - 1870, n=104, last 2 years) | |
| SCHENKER Work 14 Base | |
| Lenovo ThinkPad L14 G4 21H6S00900 | |
| CrossMark / Creativity | |
| Dell Latitude 3440 | |
| Acer Swift Go 14 SFG14-71 | |
| Average Intel Core i5-1235U, Intel Iris Xe Graphics G7 80EUs (1032 - 1618, n=8) | |
| Average of class Office (340 - 1982, n=104, last 2 years) | |
| SCHENKER Work 14 Base | |
| Lenovo ThinkPad L14 G4 21H6S00900 | |
| CrossMark / Responsiveness | |
| Acer Swift Go 14 SFG14-71 | |
| Average Intel Core i5-1235U, Intel Iris Xe Graphics G7 80EUs (746 - 1867, n=8) | |
| Dell Latitude 3440 | |
| Average of class Office (258 - 2017, n=104, last 2 years) | |
| SCHENKER Work 14 Base | |
| Lenovo ThinkPad L14 G4 21H6S00900 | |
| WebXPRT 3 / Overall | |
| Dell Latitude 3440 | |
| Average Intel Core i5-1235U, Intel Iris Xe Graphics G7 80EUs (233 - 305, n=11) | |
| Average of class Office (99.2 - 368, n=105, last 2 years) | |
| Lenovo ThinkPad L14 G4 21H6S00900 | |
| Acer Swift Go 14 SFG14-71 | |
| SCHENKER Work 14 Base | |
| WebXPRT 4 / Overall | |
| Dell Latitude 3440 | |
| Average Intel Core i5-1235U, Intel Iris Xe Graphics G7 80EUs (206 - 236, n=10) | |
| SCHENKER Work 14 Base | |
| Average of class Office (80 - 328, n=93, last 2 years) | |
| Lenovo ThinkPad L14 G4 21H6S00900 | |
| Mozilla Kraken 1.1 / Total | |
| Lenovo ThinkPad L14 G4 21H6S00900 | |
| Average of class Office (479 - 1966, n=110, last 2 years) | |
| SCHENKER Work 14 Base | |
| Average Intel Core i5-1235U, Intel Iris Xe Graphics G7 80EUs (486 - 634, n=11) | |
| Acer Swift Go 14 SFG14-71 | |
| Acer Swift Go 14 SFG14-71 | |
| Dell Latitude 3440 | |
* ... smaller is better
| PCMark 10 Score | 4873 points | |
Help | ||
| AIDA64 / Memory Copy | |
| Acer Swift Go 14 SFG14-71 | |
| Average Intel Core i5-1235U (24653 - 61921, n=8) | |
| SCHENKER Work 14 Base | |
| Average of class Office (7158 - 88119, n=119, last 2 years) | |
| Dell Latitude 3440 | |
| HP ProBook 445 G10 | |
| Lenovo ThinkPad L14 G4 21H6S00900 | |
| AIDA64 / Memory Read | |
| Average Intel Core i5-1235U (24441 - 66108, n=8) | |
| SCHENKER Work 14 Base | |
| Average of class Office (7325 - 87297, n=119, last 2 years) | |
| Acer Swift Go 14 SFG14-71 | |
| Dell Latitude 3440 | |
| HP ProBook 445 G10 | |
| Lenovo ThinkPad L14 G4 21H6S00900 | |
| AIDA64 / Memory Write | |
| Acer Swift Go 14 SFG14-71 | |
| Average Intel Core i5-1235U (25156 - 75808, n=8) | |
| Average of class Office (7579 - 94965, n=119, last 2 years) | |
| SCHENKER Work 14 Base | |
| Dell Latitude 3440 | |
| HP ProBook 445 G10 | |
| Lenovo ThinkPad L14 G4 21H6S00900 | |
| AIDA64 / Memory Latency | |
| Acer Swift Go 14 SFG14-71 | |
| Lenovo ThinkPad L14 G4 21H6S00900 | |
| Average of class Office (44.3 - 188.3, n=120, last 2 years) | |
| HP ProBook 445 G10 | |
| Average Intel Core i5-1235U (76.3 - 119, n=8) | |
| SCHENKER Work 14 Base | |
| Dell Latitude 3440 | |
* ... smaller is better
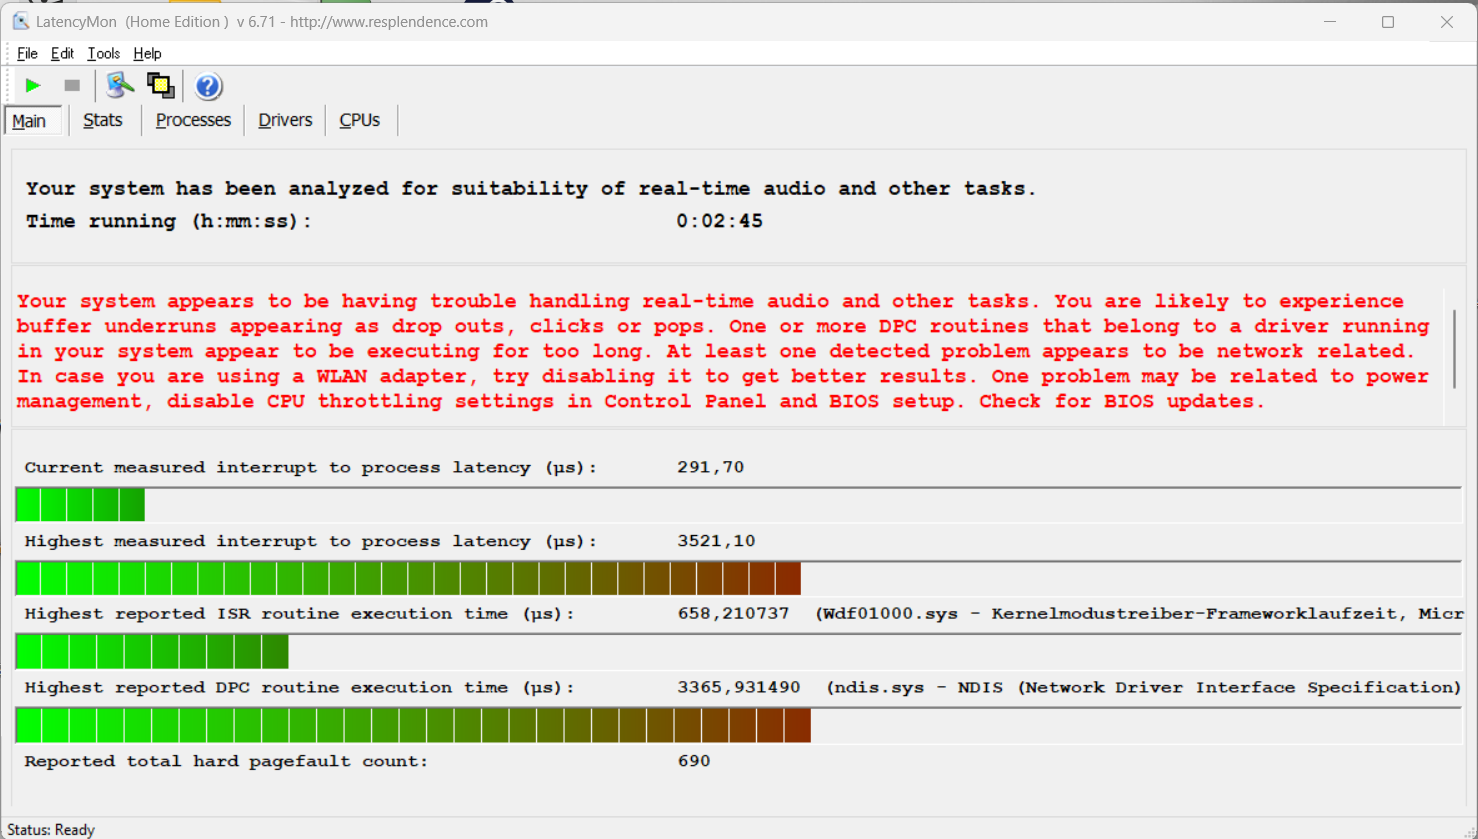
DPC latencies
During our standardized latency test, the test device with the current BIOS version showed limitations when using real-time audio applications.

| DPC Latencies / LatencyMon - interrupt to process latency (max), Web, Youtube, Prime95 | |
| SCHENKER Work 14 Base | |
| Dell Latitude 3440 | |
| Lenovo ThinkPad L14 G4 21H6S00900 | |
| HP ProBook 445 G10 | |
| Acer Swift Go 14 SFG14-71 | |
* ... smaller is better
Storage device
The Work 14 features a fast PCIe 4.0 slot for M.2-2280 SSDs. Our test device is fitted with the 500-GB version of the Samsung 980 which offers decent and stable transfer rates. After first booting up the laptop, users have 422 GB available to use. Further SSD benchmarks can be found here.

* ... smaller is better
Reading continuous performance: DiskSpd Read Loop, Queue Depth 8
Graphics card

Graphics calculations are taken care of by the integrated Iris Xe Graphics G7 (80 EUs). The iGPU handles everyday tasks well, including playing back high-resolution videos, but you shouldn't expect much more from it. However, the same can be said for its competitors that are also fitted with the Iris GPU or, in the case of the HP ProBook 445, the outdated AMD RX Vega 7.
Our gaming benchmarks very clearly showed that the Work 14 Base is barely suitable for playing games. Even when running older or less demanding games, you are generally limited to low detail levels.
Under permanent load, its graphics performance doesn't remain completely stable and falls by about 10 %. During battery use, we noted no further drop in performance. Further GPU benchmarks can be found here.
| 3DMark 11 Performance | 5431 points | |
| 3DMark Fire Strike Score | 3537 points | |
| 3DMark Time Spy Score | 1331 points | |
Help | ||
| Blender / v3.3 Classroom HIP/AMD | |
| Lenovo ThinkPad L14 G4 21H6S00900 | |
| HP ProBook 445 G10 | |
| Average of class Office (322 - 1215, n=18, last 2 years) | |
| Blender / v3.3 Classroom CPU | |
| SCHENKER Work 14 Base | |
| Average Intel Iris Xe Graphics G7 80EUs (463 - 3047, n=48) | |
| Average of class Office (343 - 3786, n=107, last 2 years) | |
| Dell Latitude 3440 | |
| Lenovo ThinkPad L14 G4 21H6S00900 | |
| Acer Swift Go 14 SFG14-71 | |
| HP ProBook 445 G10 | |
* ... smaller is better
| Performance Rating - Percent | |
| Average of class Office | |
| Acer Swift Go 14 SFG14-71 | |
| Dell Latitude 3440 | |
| SCHENKER Work 14 Base | |
| HP ProBook 445 G10 | |
| Lenovo ThinkPad L14 G4 21H6S00900 | |
| The Witcher 3 - 1920x1080 Ultra Graphics & Postprocessing (HBAO+) | |
| Average of class Office (2.66 - 34, n=108, last 2 years) | |
| Acer Swift Go 14 SFG14-71 | |
| HP ProBook 445 G10 | |
| Dell Latitude 3440 | |
| SCHENKER Work 14 Base | |
| Lenovo ThinkPad L14 G4 21H6S00900 | |
| GTA V - 1920x1080 Highest Settings possible AA:4xMSAA + FX AF:16x | |
| Average of class Office (3.35 - 47.8, n=89, last 2 years) | |
| Acer Swift Go 14 SFG14-71 | |
| Lenovo ThinkPad L14 G4 21H6S00900 | |
| SCHENKER Work 14 Base | |
| HP ProBook 445 G10 | |
| Dell Latitude 3440 | |
| Final Fantasy XV Benchmark - 1920x1080 High Quality | |
| Acer Swift Go 14 SFG14-71 | |
| Average of class Office (2.03 - 35.7, n=101, last 2 years) | |
| Dell Latitude 3440 | |
| SCHENKER Work 14 Base | |
| HP ProBook 445 G10 | |
| Lenovo ThinkPad L14 G4 21H6S00900 | |
| Strange Brigade - 1920x1080 ultra AA:ultra AF:16 | |
| Average of class Office (6.6 - 56.5, n=94, last 2 years) | |
| Acer Swift Go 14 SFG14-71 | |
| Dell Latitude 3440 | |
| SCHENKER Work 14 Base | |
| HP ProBook 445 G10 | |
| Lenovo ThinkPad L14 G4 21H6S00900 | |
| Dota 2 Reborn - 1920x1080 ultra (3/3) best looking | |
| Acer Swift Go 14 SFG14-71 | |
| Average of class Office (7.8 - 121.2, n=121, last 2 years) | |
| Dell Latitude 3440 | |
| SCHENKER Work 14 Base | |
| HP ProBook 445 G10 | |
| Lenovo ThinkPad L14 G4 21H6S00900 | |
| X-Plane 11.11 - 1920x1080 high (fps_test=3) | |
| Average of class Office (5.55 - 92.6, n=121, last 2 years) | |
| Dell Latitude 3440 | |
| HP ProBook 445 G10 | |
| Lenovo ThinkPad L14 G4 21H6S00900 | |
| SCHENKER Work 14 Base | |
| Acer Swift Go 14 SFG14-71 | |
Witcher 3 FPS diagram
| low | med. | high | ultra | |
| GTA V (2015) | 76.2 | 66.4 | 15.8 | 6.87 |
| The Witcher 3 (2015) | 66 | 43 | 23 | 9.6 |
| Dota 2 Reborn (2015) | 82.5 | 60 | 46.6 | 41.9 |
| Final Fantasy XV Benchmark (2018) | 30.2 | 17.4 | 12.1 | |
| X-Plane 11.11 (2018) | 30.2 | 23.7 | 21.8 | |
| Far Cry 5 (2018) | 36 | 20 | 19 | 17 |
| Strange Brigade (2018) | 64.6 | 28.3 | 22.4 | 17.6 |
| F1 23 (2023) | 29.3 | 26.7 | 18.3 |
Emissions & power
Noise emissions

One single fan is used to cool the laptop. When idling and under low load, it remains quite quiet but if more demand is placed on the system, the fan gets quite loud (35 dB(A)) and in addition, it emits a high-frequency noise. During the stress test, its 43 dB(A) is far too loud—in particular when you take into account the laptop's low performance. We didn't note any additional electronic noises coming from our test device.
Noise Level
| Idle |
| 23.6 / 23.6 / 24.8 dB(A) |
| Load |
| 34.2 / 42.9 dB(A) |
 | ||
30 dB silent 40 dB(A) audible 50 dB(A) loud |
||
min: | ||
| SCHENKER Work 14 Base Iris Xe G7 80EUs, i5-1235U, Samsung SSD 980 500GB (MZ-V8V500BW) | Acer Swift Go 14 SFG14-71 Iris Xe G7 80EUs, i5-1335U, WD PC SN740 SDDQNQD-512G-1014 | HP ProBook 445 G10 Vega 7, R5 7530U, Kioxia BG5 KBG50ZNS512G | Dell Latitude 3440 Iris Xe G7 80EUs, i5-1345U, Samsung PM9A1 MZVL2512HCJQ | Lenovo ThinkPad L14 G4 21H6S00900 Vega 7, R5 7530U, Kioxia BG5 KBG5AZNT512G | |
|---|---|---|---|---|---|
| Noise | -5% | -1% | -3% | -3% | |
| off / environment * | 23.6 | 24.9 -6% | 24 -2% | 23.9 -1% | 25.2 -7% |
| Idle Minimum * | 23.6 | 24.9 -6% | 24 -2% | 24.4 -3% | 25.2 -7% |
| Idle Average * | 23.6 | 24.9 -6% | 25 -6% | 24.4 -3% | 25.2 -7% |
| Idle Maximum * | 24.8 | 24.9 -0% | 28 -13% | 24.4 2% | 27.3 -10% |
| Load Average * | 34.2 | 31.9 7% | 33 4% | 37.1 -8% | 32.1 6% |
| Witcher 3 ultra * | 34.2 | 43.2 -26% | 36 -5% | 38.2 -12% | 35.7 -4% |
| Load Maximum * | 42.9 | 43.2 -1% | 36 16% | 40.2 6% | 38.3 11% |
* ... smaller is better
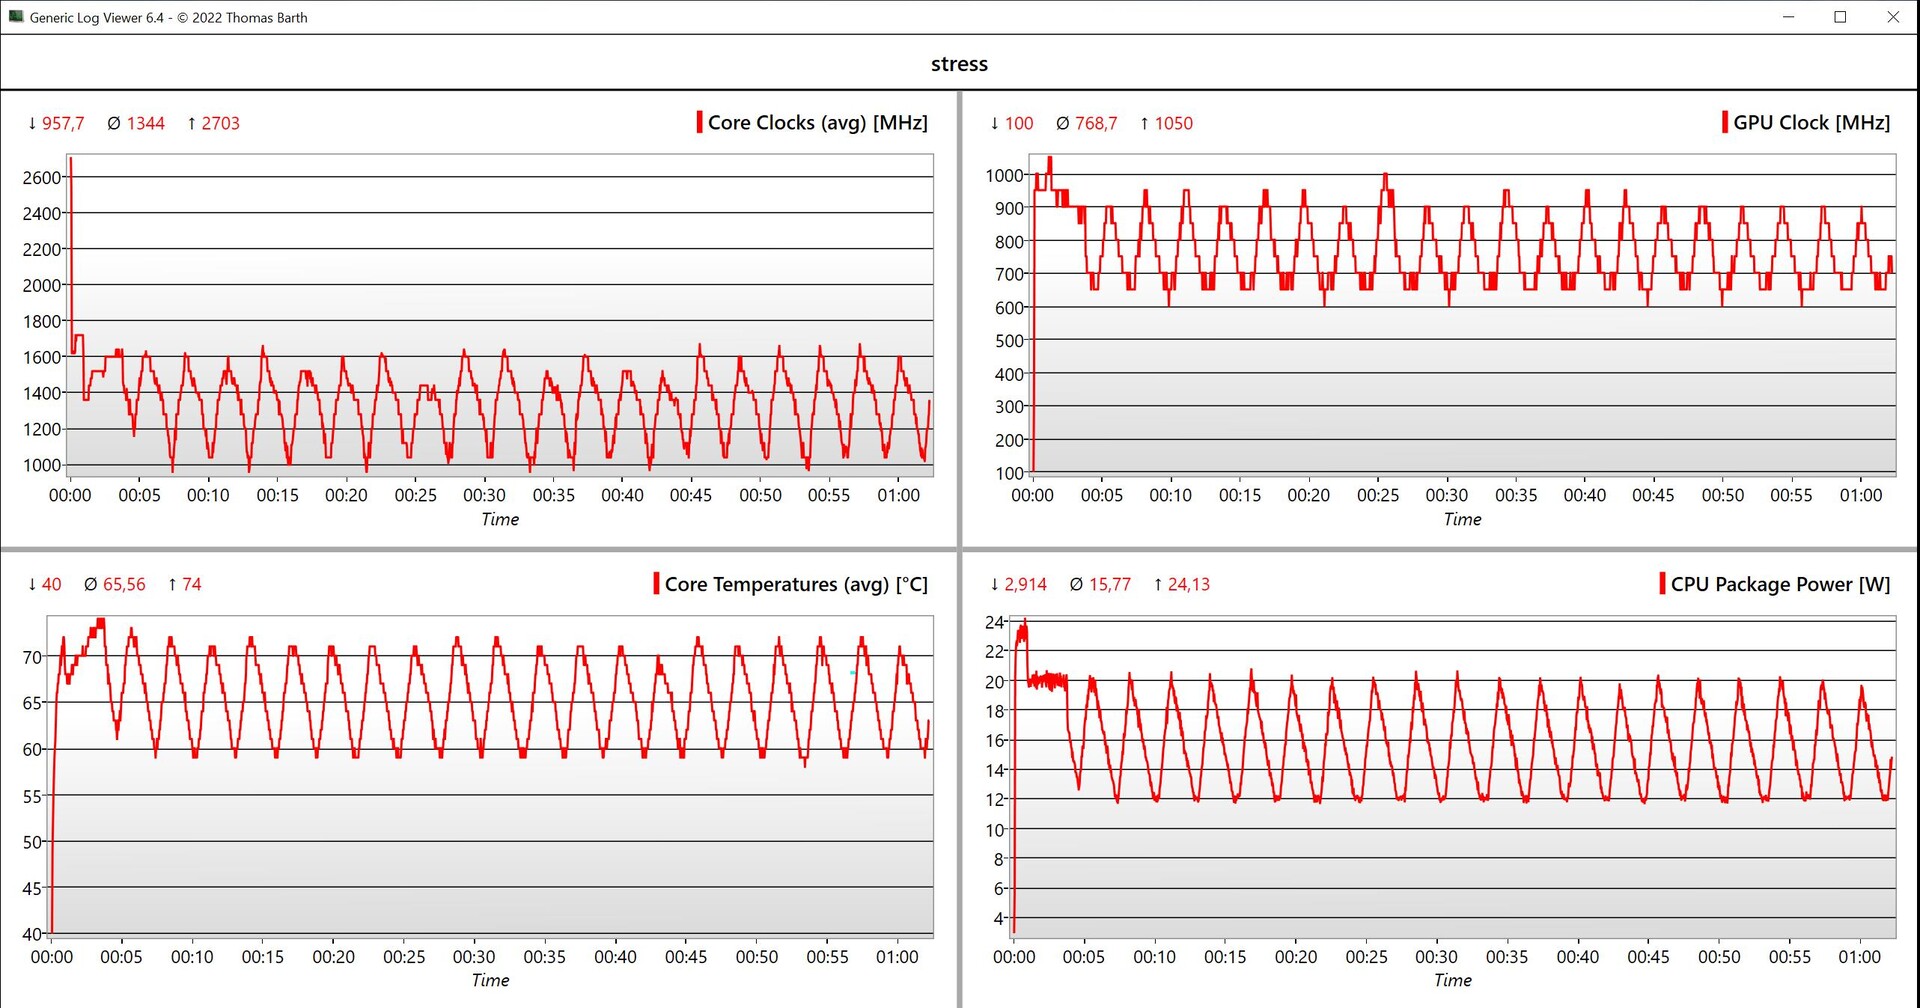
Temperature
Its surface temperatures remain uncritical and even under full load, you can place the Work 14 onto your thighs with no issues, plus, your fingers don't get hot when typing. During the stress test, the processor consumed 20 watts for a good few minutes and during the further course, it balanced out between 12 and 20 watts.
(+) The maximum temperature on the upper side is 39.2 °C / 103 F, compared to the average of 34.2 °C / 94 F, ranging from 21.2 to 62.5 °C for the class Office.
(±) The bottom heats up to a maximum of 40.4 °C / 105 F, compared to the average of 36.7 °C / 98 F
(+) In idle usage, the average temperature for the upper side is 24.4 °C / 76 F, compared to the device average of 29.5 °C / 85 F.
(±) Playing The Witcher 3, the average temperature for the upper side is 33.3 °C / 92 F, compared to the device average of 29.5 °C / 85 F.
(+) The palmrests and touchpad are cooler than skin temperature with a maximum of 27 °C / 80.6 F and are therefore cool to the touch.
(±) The average temperature of the palmrest area of similar devices was 27.7 °C / 81.9 F (+0.7 °C / 1.3 F).


| SCHENKER Work 14 Base Intel Core i5-1235U, Intel Iris Xe Graphics G7 80EUs | Acer Swift Go 14 SFG14-71 Intel Core i5-1335U, Intel Iris Xe Graphics G7 80EUs | HP ProBook 445 G10 AMD Ryzen 5 7530U, AMD Radeon RX Vega 7 | Dell Latitude 3440 Intel Core i5-1345U, Intel Iris Xe Graphics G7 80EUs | Lenovo ThinkPad L14 G4 21H6S00900 AMD Ryzen 5 7530U, AMD Radeon RX Vega 7 | |
|---|---|---|---|---|---|
| Heat | -12% | -15% | -8% | -16% | |
| Maximum Upper Side * | 39.2 | 44.8 -14% | 43 -10% | 35.2 10% | 39 1% |
| Maximum Bottom * | 40.4 | 34.8 14% | 51 -26% | 41 -1% | 46.3 -15% |
| Idle Upper Side * | 25.3 | 30.7 -21% | 27 -7% | 29.8 -18% | 26.3 -4% |
| Idle Bottom * | 25.8 | 32.5 -26% | 30 -16% | 32 -24% | 37.5 -45% |
* ... smaller is better
Speakers
The laptop's two stereo speakers may reach a high maximum volume, however, their overall quality is extremely weak and one of the Work 14's main weaknesses. Although inexpensive office laptops are never really famous for their impressive sound, Dell's Latitude 14 shows that more can be done. The rest of the competition also has as advantage in this aspect.
SCHENKER Work 14 Base audio analysis
(+) | speakers can play relatively loud (84.4 dB)
Bass 100 - 315 Hz
(-) | nearly no bass - on average 22.8% lower than median
(±) | linearity of bass is average (8.6% delta to prev. frequency)
Mids 400 - 2000 Hz
(±) | higher mids - on average 9.7% higher than median
(±) | linearity of mids is average (11.7% delta to prev. frequency)
Highs 2 - 16 kHz
(+) | balanced highs - only 4.6% away from median
(±) | linearity of highs is average (8.5% delta to prev. frequency)
Overall 100 - 16.000 Hz
(±) | linearity of overall sound is average (25.9% difference to median)
Compared to same class
» 77% of all tested devices in this class were better, 8% similar, 16% worse
» The best had a delta of 7%, average was 22%, worst was 53%
Compared to all devices tested
» 76% of all tested devices were better, 5% similar, 19% worse
» The best had a delta of 4%, average was 25%, worst was 134%
Dell Latitude 3440 audio analysis
(+) | speakers can play relatively loud (85.8 dB)
Bass 100 - 315 Hz
(±) | reduced bass - on average 14.6% lower than median
(±) | linearity of bass is average (9.8% delta to prev. frequency)
Mids 400 - 2000 Hz
(+) | balanced mids - only 3% away from median
(+) | mids are linear (3.5% delta to prev. frequency)
Highs 2 - 16 kHz
(+) | balanced highs - only 4.2% away from median
(+) | highs are linear (5.9% delta to prev. frequency)
Overall 100 - 16.000 Hz
(+) | overall sound is linear (11.6% difference to median)
Compared to same class
» 2% of all tested devices in this class were better, 1% similar, 97% worse
» The best had a delta of 7%, average was 22%, worst was 53%
Compared to all devices tested
» 6% of all tested devices were better, 2% similar, 92% worse
» The best had a delta of 4%, average was 25%, worst was 134%
Power consumption
We noted no surprises when it came to the device's power consumption values and the 45-watt power supply is more than powerful enough.
| Off / Standby | |
| Idle | |
| Load |
|
Power consumption Witcher 3 / stress test
Power consumption with external monitor
Runtimes
The Work 14 features a 49-Wh battery, resulting in practical runtimes of 7:38 hours at 150 cd/m² (38 % of our test device's maximum brightness) and 5:33 hours at maximum brightness during our WLAN test. As a result, this device came behind most of the competition and the Work 14 won't manage a full working day without needing its charger. Charging the device completely takes around 2.5 hours with it switched on.
| Battery Runtime | |
| WiFi Websurfing | |
| Lenovo ThinkPad L14 G4 21H6S00900 | |
| Average of class Office (300 - 1137, n=105, last 2 years) | |
| HP ProBook 445 G10 | |
| Dell Latitude 3440 | |
| SCHENKER Work 14 Base | |
| Acer Swift Go 14 SFG14-71 | |
| WiFi Websurfing max. Brightness | |
| Lenovo ThinkPad L14 G4 21H6S00900 | |
| Average of class Office (273 - 807, n=49, last 2 years) | |
| SCHENKER Work 14 Base | |
Pros
Cons
Verdict - An office laptop with good maintenance options

The Schenker Work 14 Base is an entry-level office laptop which, aside from an aluminum case, boats very good maintenance options and a wide selection of ports. Unfortunately, you'll have to go without modern standards such as USB4 and Thunderbolt but in turn, it has enough USB ports and a Gigabit Ethernet connection—which isn't always a given on office laptops nowadays. Its aluminum case looks more high-quality than its competitors' plastic ones, however, its surfaces attract a lot of fingerprint marks and we noted some slight creaking noises during our test.
The laptop is fitted with an outdated Core i5-1235U using low power limits, whereby its performance is completely sufficient for simple everyday tasks. In part, its PCIe SSD is also responsible for this good subjective impression. On the other hand, its small fan gets quite annoying under load as it emits a high-pitched noise and just gets too loud overall. The laptop's matte IPS display with a Full HD resolution is very bright at 400 cd/m².
The Schenker Work 14 Base is a simple office laptop with an aluminum case, good maintenance options and a matte IPS display. However, you'll have to live with a grainy picture and a generally low performance standard.
The Work 14 Base also doesn't have an easy job competing with its competitors which generally offer slightly better performance, longer runtiness and better speakers. 16:9 displays, however, are still the norm within this price class and in general, you will have to make some compromises within this segment when it comes to performance.
Price and availability
Currently, the Schenker Work 14 Base retails for around US$750 but it isn't available to purchase in the United States.
SCHENKER Work 14 Base
-
05/01/2024 v7
Andreas Osthoff
Transparency
The present review sample was made available to the author as a loan by the manufacturer or a shop for the purposes of review. The lender had no influence on this review, nor did the manufacturer receive a copy of this review before publication. There was no obligation to publish this review.
Pricecompare

